Recommended Procedures for Flood
Velocity Data Development
November 2012
Federal Emergency Management Agency
Department of Homeland Security
500 C Street, SW
Washington, DC 20472

This document was prepared by
URS Group, Inc.
12420 Milestone Center Drive, Suite 150
Germantown, MD 20876
Contract No.: HSFEHQ-10-D-0037
Task Order: HSFEHQ-11-J-0026
TABLE OF CONTENTS
Recommended Procedures for Flood Velocity Data Development November 2012\\ i
ACRONYMS AND ABBREVIATIONS ......................................................................................................... iii
SECTION ONE INTRODUCTION ....................................................................................................... 1-1 1.1 Audience and Purpose.............................................................................. 1-1 1.2 Velocity Grid and Model Background ..................................................... 1-1 1.3 Using Flood Velocity Data to Improve Foundation Design .................... 1-2
SECTION TWO DEVELOPING FLOOD DEPTH AND VELOCITY GRID DATA WITHIN RISK MAP ........................................................................................................................... 2-1
2.1 Sources for Developing Risk Map Guidance and Standards for
Velocity Grids .......................................................................................... 2-1 2.2 Summary of Flood Depth and Analysis Grids Datasets .......................... 2-2
2.2.1 Technical Requirements for Developing a Grid .......................... 2-4
2.2.2 Potential Uses for Flood Depth and Analysis Grids Datasets...... 2-5 2.3 Summary of Flood Risk Products ............................................................ 2-6
2.3.1 Flood Risk Database .................................................................... 2-6 2.3.2 Flood Risk Report ........................................................................ 2-6 2.3.3 Flood Risk Map............................................................................ 2-6
SECTION THREE ONE-DIMENSIONAL AND QUASI-TWO-DIMENSIONAL MODELS AND METHODS ................................................................................................................. 3-1
3.1 HEC-RAS Model ..................................................................................... 3-3 3.1.1 One-Dimensional Approach ........................................................ 3-3 3.1.2 Quasi-Two-Dimensional Approach ............................................. 3-5
3.2 Best Practices ........................................................................................... 3-9
SECTION FOUR TWO-DIMENSIONAL MODELS AND METHODS ..................................................... 4-1 4.1 Direct Approach for Developing Two-Dimensional Models .................. 4-2 4.2 Indirect Approach for Developing Two-Dimensional Models ................ 4-5 4.3 Hybrid Approach for Developing Two-Dimensional Models ................. 4-6 4.4 Three-Dimensional Models ..................................................................... 4-8
SECTION FIVE USING FLOOD VELOCITY DATA FOR BUILDING DESIGN ................................... 5-1 5.1 Using Flood Velocity Data for Foundation Design ................................. 5-3
5.2 Damage in Riverine SFHAS .................................................................... 5-4 5.3 Damage in Coastal SFHAS ...................................................................... 5-7
SECTION SIX SUMMARY ................................................................................................................ 6-1
SECTION SEVEN REFERENCES AND RESOURCES .......................................................................... 7-1
Figures
Figure 3-1: Velocity grid (1-percent-annual-chance event) ......................................................... 3-1
Figure 3-2: Contrast of cross-section alignment assumptions in HEC-RAS, with the 1D
modeling assumption at left and the actual 2D orientation at right .......................... 3-2 Figure 3-3: Flow conveyance in HEC-RAS, where K = conveyance and n, A, and P
represent parameters used for calculations ............................................................... 3-2 Figure 3-4: Velocity grid based on single velocity value from HEC-RAS for each cross-
section (based on Risk MAP early demonstration project in Georgia) .................... 3-3

TABLE OF CONTENTS
Recommended Procedures for Flood Velocity Data Development November 2012\\ ii
Figure 3-5: Example of Floodway Data Table with mean velocity ............................................. 3-4 Figure 3-6: HEC-RAS output tables showing several velocity values for each cross-
section and profile (return period) ............................................................................ 3-5 Figure 3-7: Velocity distribution plot from HEC-RAS, Version 4.1, where dark blue
shows the fastest velocity and green shows the slowest .......................................... 3-6 Figure 3-8: Example of tabular flow distribution output for a single cross-section from
HEC-RAS ................................................................................................................. 3-6 Figure 3-9: HEC-RAS model for cross-section interpolation from HEC-RAS Version 4.1
Reference Manual ..................................................................................................... 3-7 Figure 3-10: HEC-GeoRAS velocity mapping tool ..................................................................... 3-8 Figure 3-11: Interpolated velocity grid developed with HEC-GeoRAS from HEC-RAS
velocity output .......................................................................................................... 3-8
Figure 4-1: Two-dimensional hydraulic model representations of water velocity from XP
2D model (Available from XP Solutions at http://www.xpsolutions.com/) ............ 4-1 Figure 4-2: Velocity grid map from FLO-2D model for Beaver Dam Wash in Arizona ............ 4-2 Figure 4-3: Velocity mapping showing both direction and magnitude from XP 2D User
Manual ...................................................................................................................... 4-3 Figure 4-4: Velocity grid issues caused by a couple of false ridges indicated by the H’s
(from XP 2D User Manual) ...................................................................................... 4-3 Figure 4-5: Velocity grid showing corrections made to TIN issues (from XP 2D User
Manual) .................................................................................................................... 4-4 Figure 4-6: Triangular cells used in 2D flow modeling from FLO-2D (Available from
FLO-2D Software at http://http://www.flo-2d.com/) ............................................... 4-5 Figure 4-7: Coastal velocity grid example from Guidelines and Specifications for Flood
Hazard Mapping Partners, draft Appendix N: Flood Risk Data Development
(2012b) ..................................................................................................................... 4-6 Figure 4-8: Hybrid modeling approach from XP 2D User Manual ............................................. 4-7 Figure 4-9: XP 2D approaches to link 1D and 2D modeling domains from XP 2D User
Manual ...................................................................................................................... 4-7 Figure 5-1: Pre-FIRM foundation that was exposed to hydrodynamic forces as wind-
driven waves flowed from a lake into a nearby river ............................................... 5-5 Figure 5-2: Wave and surge damage to load-bearing walls atop stem wall foundation
approximately 0.5 mile from shoreline .................................................................... 5-7
Figure 5-3: House on verge of collapse due to shallow embedment of timber pile
foundation ................................................................................................................. 5-9
Tables
Table 2-1: Web Locations for Risk MAP Program and Guidance Documents ........................... 2-2 Table 2-2: Summary of Flood Depth and Analysis Grid Datasets .............................................. 2-3 Table 6-1: Comparison of 1D and 2D Models............................................................................. 6-3

Acronyms and Abbreviations
Recommended Procedures for Flood Velocity Data Development November 2012\\ iii
1D one-dimensional
2D two-dimensional
3D three-dimensional
ADH ADaptive Hydraulics
AOMI Areas of Mitigation Interest
ASCE American Society of Civil Engineers
BFE Base Flood Elevation
CSLF Changes Since Last FIRM
FEMA Federal Emergency Management Agency
FIRM Flood Insurance Rate Map
FIS Flood Insurance Study
fps feet per second
FRD Flood Risk Database
FRM Flood Risk Map
FRR Flood Risk Report
GIS geographic information system
H&H hydrologic and hydraulic
HEC-RAS Hydrologic Engineering Center’s River Analysis System
NFIP National Flood Insurance Program
PTS Production Technical Services
Risk MAP Risk Mapping, Assessment, and Planning
SFHA Special Flood Hazard Area
TIN triangulated irregular network
USACE U.S. Army Corps of Engineers

Introduction
Recommended Procedures for Flood Velocity Data Development November 2012\\ 1-1
SECTION ONE INTRODUCTION
This report highlights recommended procedures for developing flood velocity data within the
context of the Federal Emergency Management Agency (FEMA) efforts related to the Risk
Mapping, Assessment, and Planning (Risk MAP) Program and FEMA’s Building Science
Branch. Report sections provide detailed descriptions of velocity grid development and
considerations for one-dimensional (1D), two-dimensional (2D), and three-dimensional (3D)
models.
1.1 AUDIENCE AND PURPOSE
The audience for this report includes the FEMA Headquarters and Regional Building Science
staff who may provide guidance to FEMA Risk MAP staff and local officials on building science
issues related to the development and implementation of Risk MAP regulatory and non-
regulatory products.
The Risk MAP program is dynamic, and the technical specifications and requirements are
constantly evolving. As FEMA and the Production Technical Services (PTS) contractors gain
program insight from lessons learned, draft requirements approved for interim use are revised
and finalized. For this reason, specific standards and technical requirements for developing flood
velocity data are not included in this document. Instead, this document summarizes procedures
and best practices and cites flood velocity data documents applicable for Risk MAP projects.
Readers should review the latest versions of referenced documents on either the FEMA Web site
or Risk MAP Program Portal to verify that they are using the current requirements.
1.2 VELOCITY GRID AND MODEL BACKGROUND
Flood velocity data, specifically velocity grid data, developed during a Risk MAP project, are an
important source of information for building science professionals. Velocity grids, and their
associated flood depth grids, are part of the new Risk MAP non-regulatory products and datasets.
All new Risk MAP studies will develop three non-regulatory products: Flood Risk Database,
Flood Risk Report, and Flood Risk Map. These three products are created from the four non-
regulatory datasets: Changes Since Last FIRM (Flood Insurance Rate Map), Flood Depth and
Analysis Grids, Flood Risk Assessment, and Areas of Mitigation Interest.
Velocity grids can be developed from both 1D and 2D hydraulic models. For a 1D model, such
as the U.S. Army Corps of Engineers Hydrologic Engineering Center’s River Analysis System
(HEC-RAS), there are several ways that velocities can be calculated and exported from the
model. These range from a single mean velocity value for only lettered cross-sections to quasi-
2D methods that use hundreds of velocity values for every modeled or interpolated cross-section.
Velocity grid developers may need to use a combination of automated and manual approaches to
create velocity grids that are consistent with other regulatory and non-regulatory datasets. All
procedures used should be well documented and explain the modeling assumptions and known
use limitations.

Introduction
Recommended Procedures for Flood Velocity Data Development November 2012\\ 1-2
Two-dimensional models use more complex methods than 1D models for velocity and can show
both magnitude and direction. Often 2D models are used for unsteady flow situations, such as
tidal areas, where velocity magnitude and direction can vary greatly. Velocity grid developers
need to decide whether one or multiple velocity grids are required to show velocity conditions.
Geographic information system (GIS) methods used to develop velocity grids also need to
address non-raster calculation elements. It is important that users document the methods used to
develop the 2D hydraulic analysis and velocity grid. This is especially true for indirect 2D
methods, where velocity grids are developed outside of a specific hydraulic model based on
another grid, such as the depth grid. Documentation of methods and limitations is also important
for hybrid 2D models, in which combinations of 1D and 2D models are used.
1.3 USING FLOOD VELOCITY DATA TO IMPROVE FOUNDATION DESIGN
Flood velocity data derived using the methods referenced in this report can be used to improve
building performance during flood events. Proper foundation design can enhance overall
building stability and performance under riverine and coastal flood conditions. Buildings in flood
hazard areas may be subjected to a variety of flood-induced forces. During inundation by
standing or low-velocity floodwaters, a building must resist primarily hydrostatic pressures from
saturated soils and floodwaters. This situation is typical of broad, flat floodplains and floodways
along low-gradient rivers and streams. During inundation by high-velocity riverine and coastal
floodwaters, a building must also be able to resist hydrodynamic forces and flood-borne debris
impact loads. High-velocity floodwaters are found in floodways along steeper-gradient rivers,
sheet-flow down slopes, and coastal areas with storm surge and waves.
The site-specific velocity data from the Risk MAP non-regulatory products described in this
report can be used to meet local building codes or enhanced foundation design requirements,
while providing more efficient designs that increase resilience for new or retrofit construction.
Some examples of residential failures and best practices and for siting, design, and construction
in riverine and coastal Special Flood Hazard Areas are included in the document.

Developing Flood Depth and Velocity Grid Data within Risk Map
Recommended Procedures for Flood Velocity Data Development November 2012\\ 2-1
SECTION TWO DEVELOPING FLOOD DEPTH AND VELOCITY GRID DATA WITHIN RISK MAP
This section presents a discussion of the source of information used for developing flood risk
data, including a description of risk map guidance and standards for the flood velocity grid
(Section 2.1), a summary of flood depth and analysis grid datasets (Section 2.2), and a summary
of flood risk products (Section 2.3).
The Risk Mapping, Assessment, and Planning (Risk MAP) program is dynamic and continues to
evolve based on lessons learned by the Federal Emergency Management Agency (FEMA) and
the Production Technical Services (PTS) contractors during the development and implementation
of new and revised flood studies and flood risk products. The FEMA Risk MAP development
teams revise or finalize data requirements, technical standards, and draft manuals or other
guidance documents on an as-needed basis. For this reason, specific standards and technical
requirements for the development of flood velocity data are not included in this document.
Instead, this document summarizes procedures and best practices and cites flood velocity data
documents applicable for Risk MAP projects. Readers should review the latest versions of
referenced documents on either the FEMA Web site or Risk MAP Program Portal to verify that
they are using the current requirements.
2.1 SOURCES FOR DEVELOPING RISK MAP GUIDANCE AND STANDARDS FOR VELOCITY GRIDS
Draft technical specifications approved as interim guidance by FEMA are located on the Risk
MAP Program Portal, while finalized documents are located on the FEMA Risk MAP Web site.
This document includes references to Risk MAP documents related to flood velocity data
specifications and standards. Readers should always check the Web site and Portal for the latest
versions of referenced publications to verify that they are using the current technical
requirements. Table 2-1 lists the Web locations for the guidance documents.
Risk MAP guidance and specification documents may be in the form of:
Guidance documents
Operating guidance
Procedure memorandums
Appendices to the Guidelines and Specifications for Flood Hazard Mapping Partners
Training or outreach materials
FEMA also offers Risk MAP University, an online training curriculum that provides details on
all aspects of the program, from required meetings to the technical specifications of the
regulatory and non-regulatory datasets and products.

Developing Flood Depth and Velocity Grid Data within Risk Map
Recommended Procedures for Flood Velocity Data Development November 2012\\ 2-2
Table 2-1: Web Locations for Risk MAP Program and Guidance Documents
Category Web address
Risk MAP (general) http://www.fema.gov/rm-main
Guidelines and Specifications for Flood Hazard Mapping Partners – Discussion
http://www.fema.gov/ctp-main/guidelines-and-specifications-flood-hazard-mapping-partners
Guidelines and Specifications for Flood Hazard Mapping Partners – Publication for download. Includes TOC, Volumes 1–3, and Appendices A–M.
http://www.fema.gov/library/viewRecord.do?id=2206
Risk MAP Operating Guidance Documents http://www.fema.gov/guidance-cooperating-technical-partners-program/operating-guidance-documents
Risk MAP Procedure Memorandums http://www.fema.gov/ctp-main/guidelines-specifications-flood-hazard-mapping-partners
Note: Risk MAP Portal users must contact the portal administrator (at the adjacent Web address) to receive approval and login credentials (user name and password) prior to initial use.
mailto: [email protected]
Risk MAP Portal
http://pm.riskmapcds.com/Pages/Default.aspx
Appendix N: Flood Risk Data Development Once logged into the Risk MAP Portal, use Advanced Search and enter Appendix N in the “All of these words” data field, and property restrictions based on the Last Date Modified, Later than, 01/01/2012 (three data fields)
Appendix O: Format And Standards for Non-Regulatory Flood Risk Products
Use steps above and enter Appendix O in the “All of these words” data field.
Risk MAP University – Online training that provides details about Risk MAP meeting phases and technical requirements
http://pm.riskmapcds.com/University/COD/default.aspx
(users require Risk MAP Portal login credentials)
2.2 SUMMARY OF FLOOD DEPTH AND ANALYSIS GRIDS DATASETS
Flood depth and velocity grids are part of the Flood Depth and Analysis Grids dataset within the
non-regulatory products for the FEMA Risk MAP) Program. The FEMA minimum standards for
development of these grids are presented in the draft Guidelines and Specifications for Flood
Hazard Mapping Partners, draft Appendix N: Flood Risk Data Development (2012b). The Flood
Risk Database (FRD) minimum standards for saving these data are presented in the FEMA draft
Guidelines and Specifications for Flood Hazard Mapping Partners, draft Appendix O: Format
and Standards for Non-Regulatory Flood Risk Products (2012c). Although these documents
provide the minimum requirements for these grids, the additional procedures recommended in
this report will ensure the grids are more useful for building science professionals.

Developing Flood Depth and Velocity Grid Data within Risk Map
Recommended Procedures for Flood Velocity Data Development November 2012\\ 2-3
The multiple depth and analysis grids datasets work well with the Changes Since Last FIRM1
(CSLF) dataset to show a variety of flood risk information for all areas within the mapped
floodplain. This data ranges from the depth of flooding to the velocity of floodwaters, to the
probability of being flooded in any given year in a 30-year period (duration of a typical home
mortgage). The multiple datasets within a group are summarized in Table 2-2. For example, the
1-percent-annual-chance and 30-year probability grids can be helpful in communicating that
flood risk is not uniform and varies by location within the floodplain. This dataset can provide a
graphical representation of risk variance within the mapped floodplain rather than merely
communicating that a structure is located in the 1-percent-annual-chance floodplain.
Table 2-2: Summary of Flood Depth and Analysis Grid Datasets
Grid Description
Depth Represents flood depth values across the entire mapped floodplain to enable an understanding of true flood risk in the identified floodplain. This dataset is derived by subtracting the terrain elevation from the water surface elevation for respective recurrence interval events.
Water Surface Elevation
Represents modeled water surface elevations for different flood frequency (or return interval) events within the identified floodplain.
Water Surface Elevation Change
Shows change in water elevation between the existing and revised mapped floodplain. This dataset is considered the vertical companion to the horizontal changes provided by the CSLF dataset.
Velocity (Riverine) Describes the average flood velocity for a specific location in the mapped floodplain for a given percent-annual-chance flood frequency profile.
Velocity (Coastal) Similar to the riverine velocity grid and is located in mapped floodplain areas affected by coastal flood hazards and storm surge.
Percent-Annual-Chance Probability
Represents the percent annual chance of flooding for all areas within the identified floodplain.
Percent 30-Year Chance Probability
Shows the likelihood of flooding at least one time during a 30-year period to relate the chance of being flooded to a typical mortgage lifespan for all areas within the identified floodplain.
1-Percent Plus Water Surface Elevation
Represents a flood elevation higher than the base flood elevation (BFE) by incorporating known uncertainties in water surface elevation of the 1-percent-annual-chance floodplain.
1-Percent Plus Depth Similar to other depth grids, the terrain elevation is subtracted from the 1-Percent Plus water surface elevations to derive the 1-Percent Plus Depth Grid.
By identifying areas of highest flood risk according to flood frequency and depths, Flood Depth
and Analysis Grids may be used to help enlist support of elected officials for mitigation projects
that reduce flood risk. These datasets can be used by building officials to explain and show
1 Flood Insurance Rate Map

Developing Flood Depth and Velocity Grid Data within Risk Map
Recommended Procedures for Flood Velocity Data Development November 2012\\ 2-4
structure owners, developers, contractors, and others how the structure elevation requirements
for specific sites may change over time. These data can also be used to show the flood risk
elements for each grid cell, such as the change in water surface elevations between the old and
new flood study and areas of high floodwater velocity. Probability grids can show the chance of
being flooded in any given year or 30-year period and communicate increased flood risks
associated with the statistical confidence limits of the hydraulic models.
For example, community decisions derived from the Flood Depth and Analysis Grids to maintain
some areas as open space enhance a community’s chance to recover after a flood because no
important facilities (e.g., schools, water treatment plants) will have been built there.
2.2.1 Technical Requirements for Developing a Grid
FEMA provides the minimum FRD standards in the draft FEMA Guidelines and Specifications
for Flood Hazard Mapping Partners, draft Appendix O: Format and Standards for Non-
Regulatory Flood Risk Products (2012c). As part of enhanced data development, a community
may decide to add supplemental tables and spatial databases to the FRD. For building science,
these supplemental data could include anything from more detailed hydrologic and hydraulic
(H&H) analysis data to building-specific construction practices databases. By being non-
regulatory and allowing for local enhancements, the FRD has flexibility to archive more than the
standard regulatory datasets and products.
Some of the requirements, from Table 1: Table of Standards in the draft Appendix N: Flood Risk
Data Development of the draft FEMA Guidelines and Specifications for Flood Hazard Mapping
Partners (2012b), associated with development of the depth and velocity grids include:
For Riverine Areas:
The water surface elevations used to create water surface and depth grids for new or
updated flood hazard studies must reflect the proposed regulatory elevations.
Riverine depth grids for new studies will be created, at a minimum, for the 10-percent-,
4-percent-, 2-percent-, 1-percent-, and the 0.2-percent-annual-chance flood events.
Depth grids for Zone AO shallow flooding zones shall reflect the reported depth as
shown on the FIRM or more detailed data from the model, if the rounded results would
equal the whole-foot rounded depths on the FIRM.
Depth grids for Zone AH zones shall be based on the static whole-foot regulatory
elevation shown on the FIRM, or more detailed 0.10-foot elevations derived from models
provided that the results round to the whole-foot elevations shown on the FIRM.
For Coastal Areas:
Coastal depth grids for new studies will be created, at a minimum, for the 1-percent-
annual-chance flood event.

Developing Flood Depth and Velocity Grid Data within Risk Map
Recommended Procedures for Flood Velocity Data Development November 2012\\ 2-5
Coastal depth grid development should primarily focus on areas over land based on the
difference between the base flood elevation (BFE) (which may include wave heights for
certain flood zones) and ground surface.
Coastal depth grids for open water areas will use the modeling bathymetric elevation
source data (when available). The spatial extent of depth grids should match the full
extent of the flood hazard zone shown on the FIRM. However, the decision may be made
to clip the depth grids at the shoreline or high tide line based on project-specific
considerations.
Coastal velocity grids must reflect the appropriate upper-bound velocities from two-
dimensional (2D) storm surge modeling, Equation #8.2 from FEMA P-55, Coastal
Construction Manual: Principles and Practices of Planning, Siting, Designing,
Constructing, and Maintaining Residential Buildings in Coastal Areas (2011).
Note of Caution: If streams within a watershed were modeled at different times or using
different methods, newly created grids will often have flood elevation tie-in issues. However, the
grid creation process is not intended to resolve all study or modeling issues, and grids do not
have to be clipped or altered to match floodplain or project area boundaries. Nor do they have to
resolve negative depths that may occur as a result of using high-precision elevation data.
All velocity grids must be consistent with other Risk MAP products, including the regulatory
flood boundaries and depth grids. In most cases, the velocity grid should be populated only in
locations that also include a depth grid. However, if manual raster development is needed to
match the depth grid with the base flood boundary, then the velocity grid may also need to be
adjusted based on engineering and modeling judgment.
2.2.2 Potential Uses for Flood Depth and Analysis Grids Datasets
These datasets can help community officials show specific risks to the built and planned
environments while improving the design and permitting processes through the availability of
additional detailed data and tools. Flood Depth and Analysis Grids Datasets:
Help decision makers evaluate potential effects of risk reduction efforts
Highlight areas of greatest flood risk vulnerability across the floodplain
Clearly depict high flood risk areas for future planning
Increase understanding and awareness of hydrodynamic and hydrostatic flood loads on
foundations and basement walls
Illustrate a variety of flood risk elements for local stakeholders
Demonstrate higher flood vulnerability in specific areas
Provide data sources for cost-effectiveness analyses of proposed mitigation projects
Assist with advanced recovery planning and disaster preparedness
Developing Flood Depth and Velocity Grid Data within Risk Map
Recommended Procedures for Flood Velocity Data Development November 2012\\ 2-6
2.3 SUMMARY OF FLOOD RISK PRODUCTS
The Flood Risk Datasets are created as companion elements to the H&H study (or restudy) of
flooding sources presented in the Flood Insurance Study (FIS) report(s) for a given watershed,
coastal area, or site-specific project area. The four non-regulatory datasets are used to develop
the three non-regulatory products: FRD, Flood Risk Report (FRR), and Flood Risk Map (FRM).
The non-regulatory products and datasets are not subject to the due process or related protocols
associated with the FIS and FIRM.
2.3.1 Flood Risk Database
The FRD contains the spatial databases and associated tables for each of the four datasets for a
given project area and enables users to perform a variety of risk analyses based on the flood risk
assessment data collected, created, and analyzed during the FIS. It also contains data used to
populate tables in the FRR and spatial layers used for the FRM. This main archive function of
the FRD can be used to store the specific building science-related topics brought forth in the
datasets. For example, the Areas of Mitigation Interest (AOMI) feature “Other miscellaneous
flood risk or hazard mitigation related areas” can be used to store points and descriptions of flood
risk “hot spots” or other associated concerns that come up in Risk MAP meetings.
FEMA provides the minimum FRD standards in draft Appendix O of FEMA’s Guidelines and
Specifications for Flood Hazard Mapping Partners. As part of enhanced data development, a
community may decide to add supplemental tables and spatial databases to the FRD. These
supplemental data could include additional H&H analyses or building-specific construction
practices databases. Because it is non-regulatory and allows for local enhancements, the FRD
can provide the foundation for archiving future flood data.
2.3.2 Flood Risk Report
The FRR provides communities with a summary of the flood risk data that they can use for
outreach and improved risk and vulnerability assessments in mitigation plans. The FRR is the
non-regulatory Risk MAP equivalent of the regulatory FIS report.
2.3.3 Flood Risk Map
The FRM product shows flood risk and related information for the project area, as well as a
subset of the spatial data in the FRD. Because of scale issues, the printed map often is limited as
an analysis product, but it does show the biggest issues in a Risk MAP project. The FRM
includes call-out boxes in which specific topics of concern are highlighted. In addition, custom
AOMI points can be shown on the FRM. Local officials can access all of the data in the FRD
used to develop the FRM.

One-Dimensional and Quasi-Two-Dimensional Models and Methods
Recommended Procedures for Flood Velocity Data Development November 2012\\ 3-1
SECTION THREE ONE-DIMENSIONAL AND QUASI-TWO-DIMENSIONAL MODELS AND METHODS
Because high-velocity floodwaters may be associated with increased flood risk, velocity grids
provide valuable insight into possible flood risk mitigation opportunities, such as avoiding
development in these areas or reinforcing channel walls where high velocities are anticipated
(generally, but not always in the floodway). Velocity grids may also be used to increase public
awareness of flood hazard risks in areas identified as susceptible to high floodwater velocities.
The velocity grid dataset is a digital representation of flood velocity distribution created by
mapping the velocity output. The data are obtained from FEMA-accepted riverine hydraulic
models. Any point on the grid describes the average flood velocity for that floodplain location
for a given flood frequency. Figure 3-1 shows an example of a riverine velocity grid.
Most approaches for coastal flood modeling can detect combinations of one-dimensional (1D)
transects developed from 2D models offshore and 1D transects over land. Section 5 will discuss
these types of combination models and the unique issues with modeling coastal flood velocity.
FEMA’s current list of approved hydraulic models is located at http://www.fema.gov/national-
flood-insurance-program-flood-hazard-mapping/numerical-models-meeting-minimum-
requirement-0.
Figure 3-1: Velocity grid (1-percent-annual-chance event)
All hydraulic models use velocity as part of the calculations for determining flood elevations. As
mentioned earlier, models begin with the continuity equation for water flow, Q = V*A, where Q
= water flow, V = velocity, and A = area. Each model listed on the FEMA list of approved
hydraulic models uses certain simplifying assumptions and modeling approaches to route flood
flows and estimate spatially varying flood elevations. The assumptions and modeling approaches
also influence how velocity is approximated.
One-Dimensional and Quasi-Two-Dimensional Models and Methods
Recommended Procedures for Flood Velocity Data Development November 2012\\ 3-2
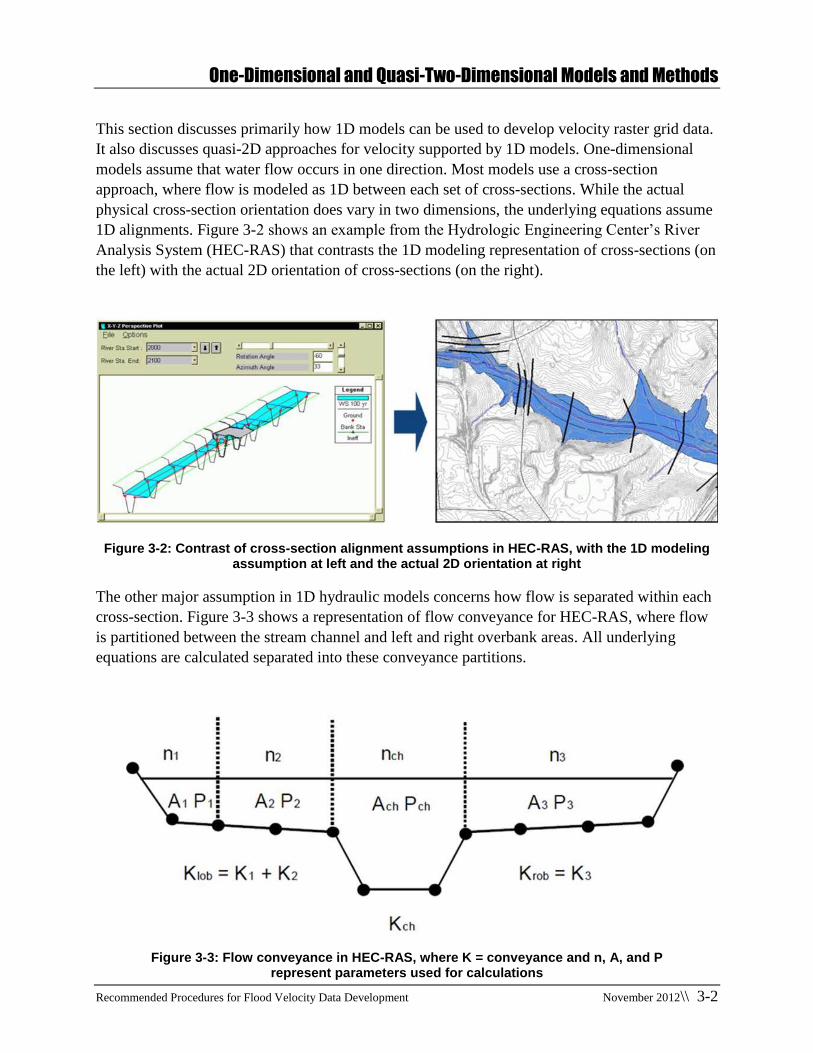
This section discusses primarily how 1D models can be used to develop velocity raster grid data.
It also discusses quasi-2D approaches for velocity supported by 1D models. One-dimensional
models assume that water flow occurs in one direction. Most models use a cross-section
approach, where flow is modeled as 1D between each set of cross-sections. While the actual
physical cross-section orientation does vary in two dimensions, the underlying equations assume
1D alignments. Figure 3-2 shows an example from the Hydrologic Engineering Center’s River
Analysis System (HEC-RAS) that contrasts the 1D modeling representation of cross-sections (on
the left) with the actual 2D orientation of cross-sections (on the right).
Figure 3-2: Contrast of cross-section alignment assumptions in HEC-RAS, with the 1D modeling assumption at left and the actual 2D orientation at right
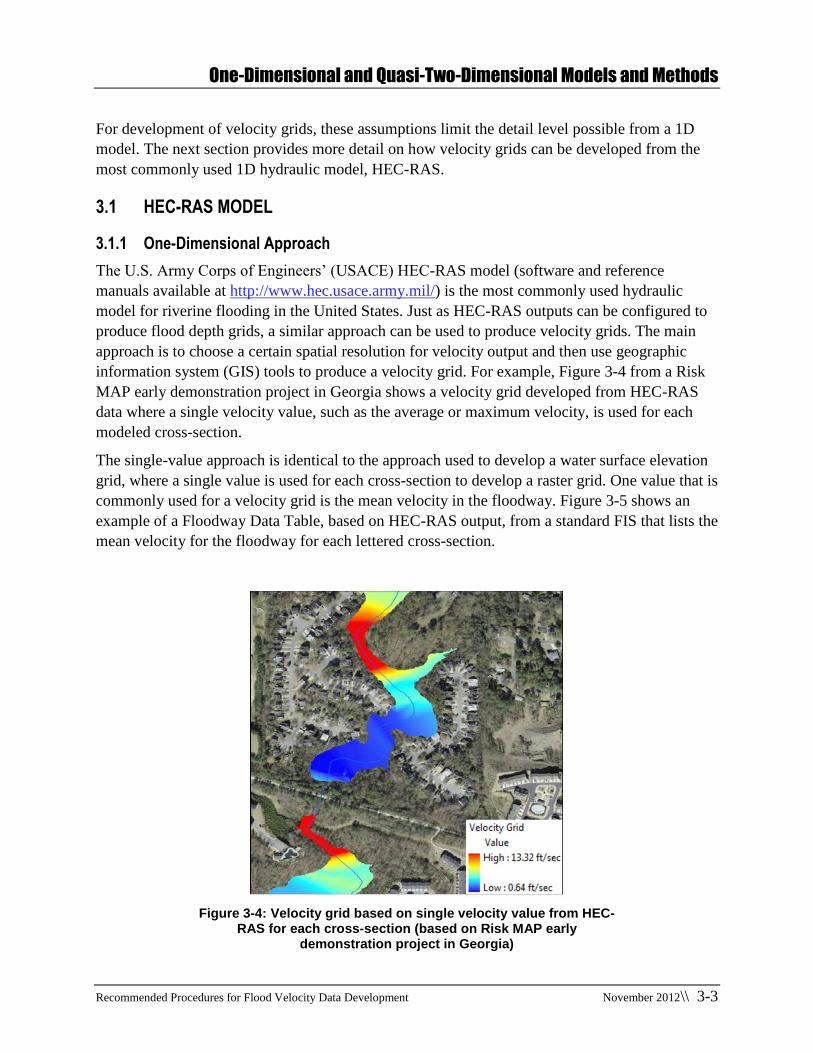
The other major assumption in 1D hydraulic models concerns how flow is separated within each
cross-section. Figure 3-3 shows a representation of flow conveyance for HEC-RAS, where flow
is partitioned between the stream channel and left and right overbank areas. All underlying
equations are calculated separated into these conveyance partitions.
Figure 3-3: Flow conveyance in HEC-RAS, where K = conveyance and n, A, and P represent parameters used for calculations
One-Dimensional and Quasi-Two-Dimensional Models and Methods
Recommended Procedures for Flood Velocity Data Development November 2012\\ 3-3
For development of velocity grids, these assumptions limit the detail level possible from a 1D
model. The next section provides more detail on how velocity grids can be developed from the
most commonly used 1D hydraulic model, HEC-RAS.
3.1 HEC-RAS MODEL
3.1.1 One-Dimensional Approach
The U.S. Army Corps of Engineers’ (USACE) HEC-RAS model (software and reference
manuals available at http://www.hec.usace.army.mil/) is the most commonly used hydraulic
model for riverine flooding in the United States. Just as HEC-RAS outputs can be configured to
produce flood depth grids, a similar approach can be used to produce velocity grids. The main
approach is to choose a certain spatial resolution for velocity output and then use geographic
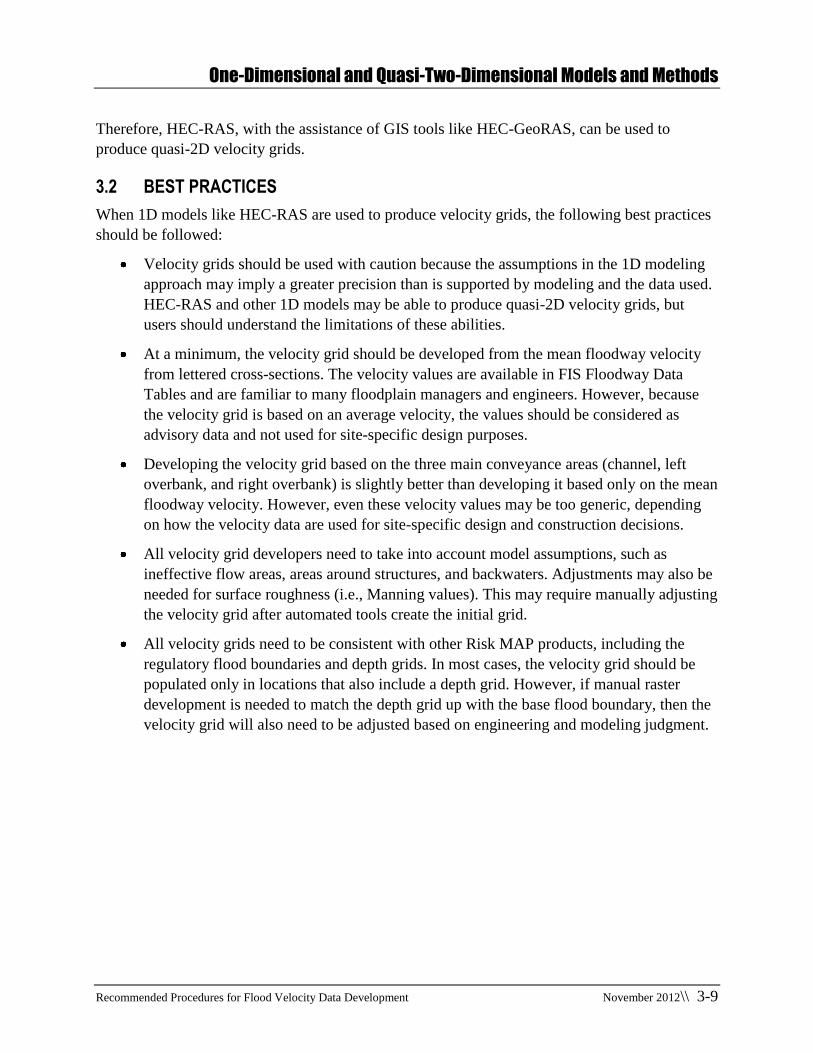
information system (GIS) tools to produce a velocity grid. For example, Figure 3-4 from a Risk
MAP early demonstration project in Georgia shows a velocity grid developed from HEC-RAS
data where a single velocity value, such as the average or maximum velocity, is used for each
modeled cross-section.
The single-value approach is identical to the approach used to develop a water surface elevation
grid, where a single value is used for each cross-section to develop a raster grid. One value that is
commonly used for a velocity grid is the mean velocity in the floodway. Figure 3-5 shows an
example of a Floodway Data Table, based on HEC-RAS output, from a standard FIS that lists the
mean velocity for the floodway for each lettered cross-section.
Figure 3-4: Velocity grid based on single velocity value from HEC-RAS for each cross-section (based on Risk MAP early
demonstration project in Georgia)

One-Dimensional and Quasi-Two-Dimensional Models and Methods
Recommended Procedures for Flood Velocity Data Development November 2012\\ 3-4
Figure 3-5: Example of Floodway Data Table with mean velocity
Note that the floodway mean velocity is not a good measure of the actual flood velocity in the
flood fringe, but it can be used as a general measure to determine locations in the floodplain
where floodwaters will move relatively faster or slower, and can provide an upper limit for
velocities in the flood fringe. Generally, channel velocities are higher than overbank velocities.
However, there are instances, such as with parking lots or other areas with limited flow
obstructions, where overbank velocities are higher than channel velocities. Using the mean
velocity would be appropriate for older studies where HEC-RAS model files are not available or
no other velocity data exist.
When the HEC-RAS models are available, the level of detail can be increased. For example,
Figure 3-6 shows a standard version of the HEC-RAS Profile Output Table with additional
columns for velocity data.

One-Dimensional and Quasi-Two-Dimensional Models and Methods
Recommended Procedures for Flood Velocity Data Development November 2012\\ 3-5
Figure 3-6: HEC-RAS output tables showing several velocity values for each cross-section and profile (return period)
Figure 3-6 shows that even standard HEC-RAS tables can provide velocity data at every cross-
section, not just lettered cross-sections, for multiple return periods. HEC-RAS can provide more
than the mean velocity for the floodway, but it can also provide an average velocity for the entire
cross-section. In addition, the figure shows the velocity value can be separated by the
conveyance separation (left overbank, channel, and right overbank). In fact, as discussed in the
next section on quasi-2D HEC-RAS velocity modeling, HEC-RAS and HEC-GeoRAS (an
extension for support of HEC-RAS using ArcView) both have tools that can approximate 2D
velocity distributions.
3.1.2 Quasi-Two-Dimensional Approach
The HEC-RAS model provides ways to approximate a 2D distribution of velocity. However,
because the underlying equations in HEC-RAS are only 1D, these methods are considered
“quasi-2D.” When performing calculations, HEC-RAS estimates velocities at a much more
detailed level than only channel and overbanks. Figures 3-7 and 3-8 show a graphical and tabular
depiction of the velocity variation modeling within a cross-section.

One-Dimensional and Quasi-Two-Dimensional Models and Methods
Recommended Procedures for Flood Velocity Data Development November 2012\\ 3-6
Figure 3-7: Velocity distribution plot from HEC-RAS, Version 4.1, where dark blue shows the fastest velocity and green shows the slowest
Figure 3-8: Example of tabular flow distribution output for a single cross-section from HEC-RAS

One-Dimensional and Quasi-Two-Dimensional Models and Methods
Recommended Procedures for Flood Velocity Data Development November 2012\\ 3-7
HEC-RAS calculates velocities for each point in a cross-section by using the flood distribution
option. There is currently no minimum standard for capturing flood velocity distribution data,
but the scale or number of velocity points or subdivisions to be specified per cross-section should
be representative of the variation of velocity across the channel and overbank areas. It may be
necessary to augment user-defined cross-sections with interpolated cross-sections to obtain
sufficient flood velocity data at areas of interest, such as known flooding “hot spots,” flood-
prone structures, critical facilities, and populated areas. However, user-defined or interpolated
cross-section data are no substitute for more detailed initial data gathering. Figure 3-9 from the
HEC-RAS Reference Manual for Version 4.1 shows how interpolated cross-sections are
calculated from the two bounding cross-sections.
Figure 3-9: HEC-RAS model for cross-section interpolation from HEC-RAS Version 4.1 Reference Manual
When velocity data are general, including velocities along interpolated cross-sections, tools like
HEC-GeoRAS (available from http://www.hec.usace.army.mil/) can be used to produce quasi-
2D velocity grids. Figure 3-10 shows the Velocity Mapping tool within HEC-GeoRAS.

One-Dimensional and Quasi-Two-Dimensional Models and Methods
Recommended Procedures for Flood Velocity Data Development November 2012\\ 3-8
Figure 3-10: HEC-GeoRAS velocity mapping tool
Figure 3-11 shows an example from the HEC-GeoRAS Version 4.3 User’s Manual of a quasi-2D
velocity grid that was developed from velocity points from modeled and interpolated cross-
sections from HEC-RAS.
Figure 3-11: Interpolated velocity grid developed with HEC-GeoRAS from HEC-RAS velocity output
One-Dimensional and Quasi-Two-Dimensional Models and Methods
Recommended Procedures for Flood Velocity Data Development November 2012\\ 3-9
Therefore, HEC-RAS, with the assistance of GIS tools like HEC-GeoRAS, can be used to
produce quasi-2D velocity grids.
3.2 BEST PRACTICES
When 1D models like HEC-RAS are used to produce velocity grids, the following best practices
should be followed:
Velocity grids should be used with caution because the assumptions in the 1D modeling
approach may imply a greater precision than is supported by modeling and the data used.
HEC-RAS and other 1D models may be able to produce quasi-2D velocity grids, but
users should understand the limitations of these abilities.
At a minimum, the velocity grid should be developed from the mean floodway velocity
from lettered cross-sections. The velocity values are available in FIS Floodway Data
Tables and are familiar to many floodplain managers and engineers. However, because
the velocity grid is based on an average velocity, the values should be considered as
advisory data and not used for site-specific design purposes.
Developing the velocity grid based on the three main conveyance areas (channel, left
overbank, and right overbank) is slightly better than developing it based only on the mean
floodway velocity. However, even these velocity values may be too generic, depending
on how the velocity data are used for site-specific design and construction decisions.
All velocity grid developers need to take into account model assumptions, such as
ineffective flow areas, areas around structures, and backwaters. Adjustments may also be
needed for surface roughness (i.e., Manning values). This may require manually adjusting
the velocity grid after automated tools create the initial grid.
All velocity grids need to be consistent with other Risk MAP products, including the
regulatory flood boundaries and depth grids. In most cases, the velocity grid should be
populated only in locations that also include a depth grid. However, if manual raster
development is needed to match the depth grid up with the base flood boundary, then the
velocity grid will also need to be adjusted based on engineering and modeling judgment.

Two-Dimensional Models and Methods
Recommended Procedures for Flood Velocity Data Development November 2012\\ 4-1
SECTION FOUR TWO-DIMENSIONAL MODELS AND METHODS
Two-dimensional hydraulic models provide a more detailed approach to approximate water flow.
The key concept is that water flow is not in one direction (straight between cross-sections), but is
a vector or in two dimensions as shown in Figure 4-1.
Figure 4-1: Two-dimensional hydraulic model representations of water velocity from XP 2D model (Available from XP Solutions at http://www.xpsolutions.com/)
These modeling approaches use either finite element or finite difference calculation approaches
with equations representing conservation of continuity (flow) and momentum (energy). Models
use a variety of “cell” types, including square elements (as shown in Figure 4-1) or triangular
elements. Underlying terrain data have a major influence in determining how water flows
downhill from cell to cell. Therefore, the quality of terrain data has a major influence on how
well the model can perform and should reflect features that would influence the flood modeling.
Most models can accommodate unsteady flow conditions, where flood hydrographs are
simulated based on discrete times. This allows 2D models to approximate complex hydraulics,
such as coastal and tidal locations.
There is no one dominant 2D model used for FEMA Risk MAP projects. Certain 2D models are
appropriate for low-slope riverine conditions, while others are used for alluvial fans, and still
others are used for coastal floodplain modeling. Because velocity plays a major role in the
calculations of all models, each model has velocity information available to develop a velocity
grid. However, the methods for exporting and mapping this velocity data vary. Therefore, rather
than focusing on a specific model, the following subsections discuss three major ways that 2D
models can be used to produce velocity. The first way is the direct approach, where velocity data
are directly supported by the models and can be explicitly exported from the model. The second
way can be described as an indirect approach, where 2D outputs other than velocity are exported
from a model, such as the depth grid, and then the velocity grid is derived from these other data.

Two-Dimensional Models and Methods
Recommended Procedures for Flood Velocity Data Development November 2012\\ 4-2
The third way is a hybrid modeling approach, usually involving linking 1D and 2D models. For
these hybrids, including most coastal flood modeling, velocity grids may need to be developed
from several different types of models.
4.1 DIRECT APPROACH FOR DEVELOPING TWO-DIMENSIONAL MODELS
Two-dimensional models that support direct velocity grid development are those models that
include output options for velocity, usually at the model cell level. For example, Figure 4-2
shows a velocity grid map from the FLO-2D model for Beaver Dam Wash in Arizona.
Figure 4-2: Velocity grid map from FLO-2D model for Beaver Dam Wash in Arizona2
Many models also support the export of velocity direction information at various time steps, so
velocity can be shown with vectors (as in Figure 4-3) or as computer video simulations. For Risk
MAP outreach meetings, these kinds of visualization can be effective in showing how flow
changes over time, especially in tidal areas where flow velocities and direction can vary greatly.
2 From Beaver Dam Wash Flood Hazard Assessment, Mohave County Flood Control District, Kingman, AZ.
Available at:
http://resource.co.mohave.az.us/FloodControl/Mohave%20County%20Studies%20and%20Plans/Beaver%20Dam/B
eaverDamWashFloodHazardAssessmentReportofFindings.pdf
Two-Dimensional Models and Methods
Recommended Procedures for Flood Velocity Data Development November 2012\\ 4-3
Figure 4-3: Velocity mapping showing both direction and magnitude from XP 2D User Manual
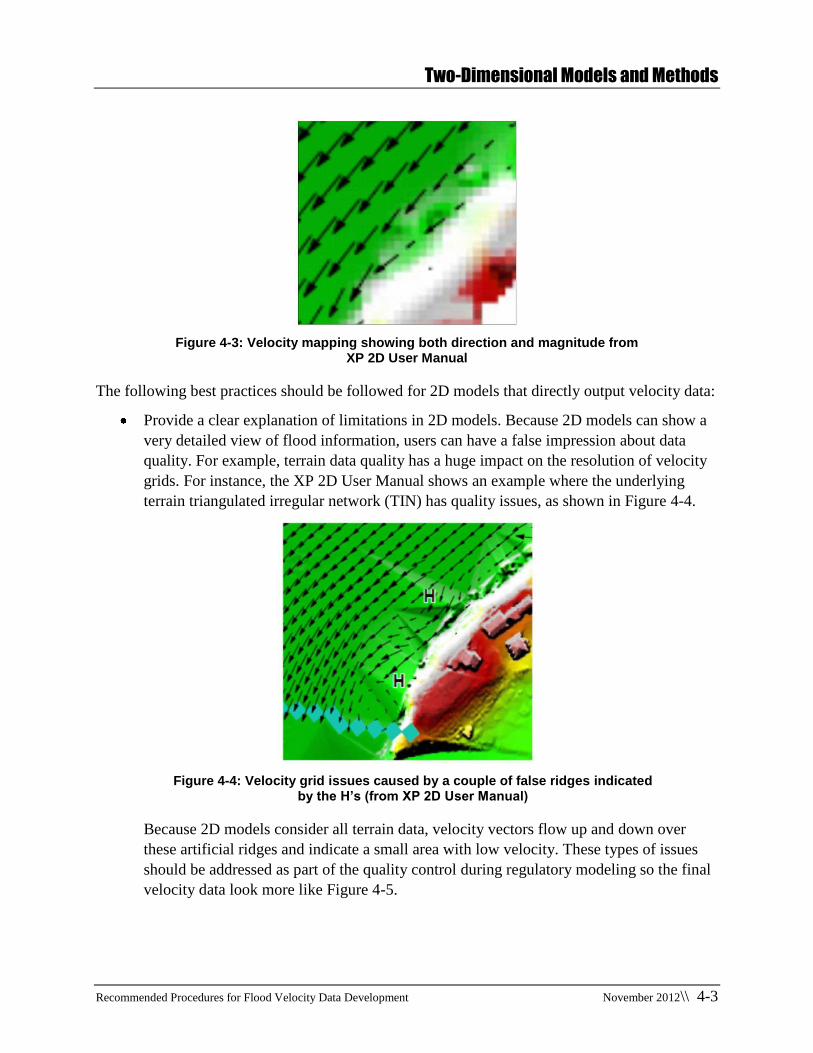
The following best practices should be followed for 2D models that directly output velocity data:
Provide a clear explanation of limitations in 2D models. Because 2D models can show a
very detailed view of flood information, users can have a false impression about data
quality. For example, terrain data quality has a huge impact on the resolution of velocity
grids. For instance, the XP 2D User Manual shows an example where the underlying
terrain triangulated irregular network (TIN) has quality issues, as shown in Figure 4-4.
Figure 4-4: Velocity grid issues caused by a couple of false ridges indicated by the H’s (from XP 2D User Manual)
Because 2D models consider all terrain data, velocity vectors flow up and down over
these artificial ridges and indicate a small area with low velocity. These types of issues
should be addressed as part of the quality control during regulatory modeling so the final
velocity data look more like Figure 4-5.
Two-Dimensional Models and Methods
Recommended Procedures for Flood Velocity Data Development November 2012\\ 4-4
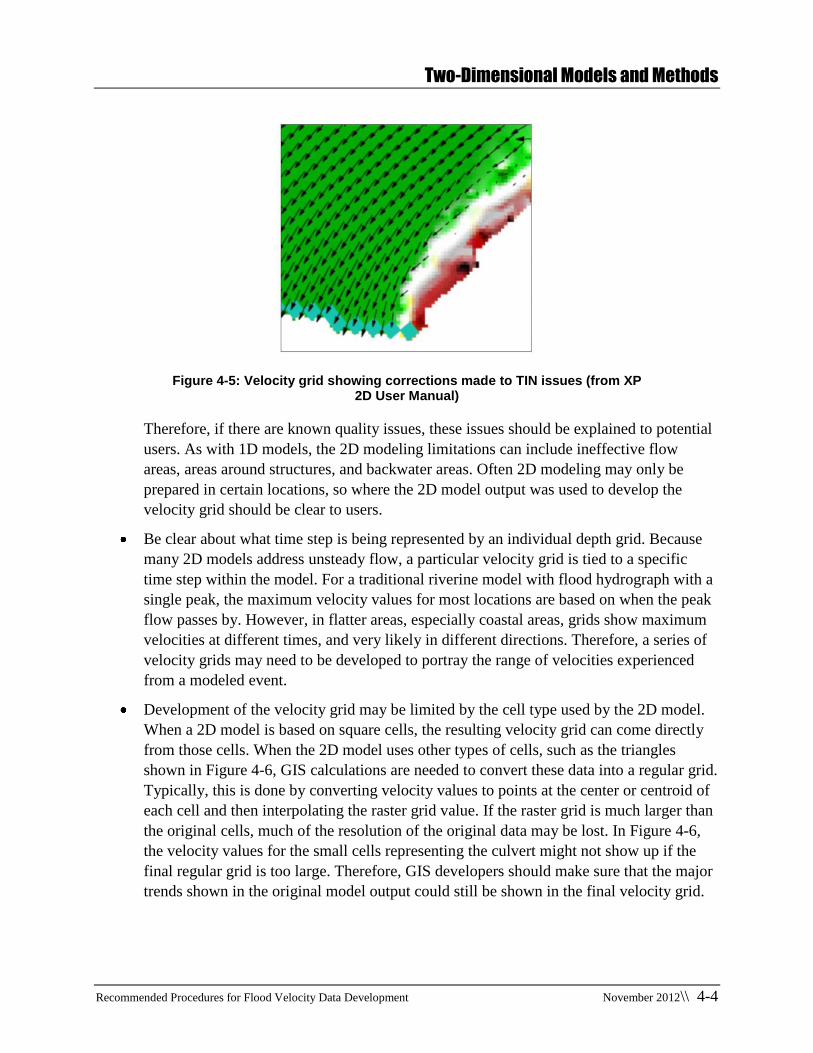
Figure 4-5: Velocity grid showing corrections made to TIN issues (from XP 2D User Manual)
Therefore, if there are known quality issues, these issues should be explained to potential
users. As with 1D models, the 2D modeling limitations can include ineffective flow
areas, areas around structures, and backwater areas. Often 2D modeling may only be
prepared in certain locations, so where the 2D model output was used to develop the
velocity grid should be clear to users.
Be clear about what time step is being represented by an individual depth grid. Because
many 2D models address unsteady flow, a particular velocity grid is tied to a specific
time step within the model. For a traditional riverine model with flood hydrograph with a
single peak, the maximum velocity values for most locations are based on when the peak
flow passes by. However, in flatter areas, especially coastal areas, grids show maximum
velocities at different times, and very likely in different directions. Therefore, a series of
velocity grids may need to be developed to portray the range of velocities experienced
from a modeled event.
Development of the velocity grid may be limited by the cell type used by the 2D model.
When a 2D model is based on square cells, the resulting velocity grid can come directly
from those cells. When the 2D model uses other types of cells, such as the triangles
shown in Figure 4-6, GIS calculations are needed to convert these data into a regular grid.
Typically, this is done by converting velocity values to points at the center or centroid of
each cell and then interpolating the raster grid value. If the raster grid is much larger than
the original cells, much of the resolution of the original data may be lost. In Figure 4-6,
the velocity values for the small cells representing the culvert might not show up if the
final regular grid is too large. Therefore, GIS developers should make sure that the major
trends shown in the original model output could still be shown in the final velocity grid.

Two-Dimensional Models and Methods
Recommended Procedures for Flood Velocity Data Development November 2012\\ 4-5
Figure 4-6: Triangular cells used in 2D flow modeling from FLO-2D (Available from FLO-2D Software at http://http://www.flo-2d.com/)
Like 1D modeling, velocity grids in 2D modeling should be consistent with other Risk
MAP products, when appropriate. This includes regulatory flood boundaries and depth
grids. In locations where velocities are close to zero, such as large lakes or backwater
areas, engineering and modeling judgment are needed to decide whether the model
results need to be adjusted.
4.2 INDIRECT APPROACH FOR DEVELOPING TWO-DIMENSIONAL MODELS
Two-dimensional models can also support velocity grid development, even when velocity is not
or cannot be directly exported from a hydraulic model. An indirect approach is to use 2D outputs
other than velocity as the basis for deriving a velocity grid. The most common basis is the flood
depth grid. This approach is most often used when a model does not have the capability to
directly export velocity data or when a historical flood analysis is being used where only select
output are available.
For example, FEMA P-55, Coastal Construction Manual, gives guidelines on estimating water
velocity grids from the stillwater depth grid. Estimations of design flood velocities in coastal
flood hazard areas by this method are subject to considerable uncertainty (as discussed in FEMA
P-55). Given this uncertainty, Equation #8.2 from FEMA P-55 can be used for the upper-bound
velocities.
Equation #8.2: Velocity (feet/second) = (32.2× stillwater depth) ^ 0.5
A similar approach can also be used for riverine situations. For example, one could start with a
flood depth grid and information about land cover. A cell-based version of Manning’s equation
can be used to derive velocity, with assumptions, including Manning’s n values, based on land
cover and partitioning flows across the floodplain.

Two-Dimensional Models and Methods
Recommended Procedures for Flood Velocity Data Development November 2012\\ 4-6
The following best practices should be followed for these indirect approaches:
Be sure to provide sufficient documentation of how these indirect approaches were used.
With the exception of the coastal methods based on FEMA P-55, Coastal Construction
Manual, all other indirect approaches tend to be more ad hoc and highly dependent on
specific models and data availability. A detailed description should include modeling
approaches used and associated assumptions. Documentation should also address how
these methods could be applied in other locations.
Include documentation on use limitations. These indirect methods may only be applied in
certain locations or to address particular questions. Therefore, documentation for these
velocity grids needs to describe how this information should and should not be used and
how the values should be shown. For example, showing velocities divided into a few
categories (low, medium, high) rather than specific ranges of values may be advisable.
4.3 HYBRID APPROACH FOR DEVELOPING TWO-DIMENSIONAL MODELS
The final way that 2D models can support velocity grid development is as part of a hybrid
modeling approach. This approach combines two or more separate models (1D and 2D) to satisfy
the regulatory mapping requirement. The most common hybrid approach is used for coastal
modeling, where 2D surge models are combined with 1D transect models and wave run-up
models. Figure 4-7 shows an example of a coastal velocity grid based on this hybrid approach.
Figure 4-7: Coastal velocity grid example from Guidelines and Specifications for Flood Hazard Mapping Partners, draft Appendix N: Flood Risk Data Development (2012b)
Riverine models can also be developed using a hybrid approach. Figure 4-8 shows the
conceptual approach used by many 2D models, where the channel is represented by a 1D model
and the overbanks are modeled with a 2D approach.

Two-Dimensional Models and Methods
Recommended Procedures for Flood Velocity Data Development November 2012\\ 4-7
Figure 4-8: Hybrid modeling approach from XP 2D User Manual
How the 1D and 2D portions are linked depends on individual model capabilities. Figure 4-9
shows two ways that XP 2D supports these links.
Figure 4-9: XP 2D approaches to link 1D and 2D modeling domains from XP 2D User Manual

Two-Dimensional Models and Methods
Recommended Procedures for Flood Velocity Data Development November 2012\\ 4-8
The example shown at the top of Figure 4-9 has a one-cell-wide channel, where the 1D portion
assigns values to individual cells within the 2D framework. The example shown at the bottom of
Figure 4-9 shows a more complex approach, where the 1D flow path carves out a channel several
cells wide in the 2D framework.
4.4 THREE-DIMENSIONAL MODELS
Some hydraulic models now have the capability for three-dimensional (3D) approximations of
flow. Conceptually, 3D models are more complex than 2D models. These have some specific 3D
data needs, but can use many of the same input data sets as 2D models. For example, the
ADaptive Hydraulics (ADH) modeling system developed by the Coastal and Hydraulics
Laboratory of the USACE3 is capable of handling 3D flow and 3D shallow water problems.
ADH uses a 3D mesh of either triangles or quadrilaterals to represent terrain with X, Y, and Z
coordinates.
Like 2D models, 3D models can also calculate velocities directly, indirectly, or with a hybrid
approach when combined with other models. Because velocity calculations in 3D models have
both horizontal and vertical components, the development of a velocity raster (with only two
dimensions) requires the developer to decide how to simplify the data. Some types of rasters that
could be derived from a 3D model include:
Overall velocity vector value (considers all three dimensions)
Horizontal velocity value (considers only X and Y components of velocity)
Vertical velocity value (considers only Z component of velocity)
Velocity direction values (represented by a direction and/or slope)
The decision of which rasters to develop is based on local needs, GIS capabilities, and how the
data will be used for the different Risk MAP meetings. Because there are no 3D models on the
current FEMA list of nationally acceptable hydraulics models, very few studies will likely use
this level of modeling complexity.
3 https://adh.usace.army.mil/new_webpage/main/main_page.htm
Using Flood Velocity Data for Building Design
Recommended Procedures for Flood Velocity Data Development November 2012\\ 5-1
SECTION FIVE USING FLOOD VELOCITY DATA FOR BUILDING DESIGN
Buildings in flood hazard areas may be subjected to a variety of flood-induced forces. During
inundation by standing or low-velocity floodwaters, a building must resist primarily hydrostatic
pressures from saturated soils and floodwaters. This situation is typical of broad, flat floodplains
and floodways along low-gradient rivers and streams. Horizontal hydrostatic forces against a
structure are created when the level of standing or slowly moving floodwaters on opposite sides
of a superstructure or foundation wall are not equal. These forces are primarily a function of
flood depth. Saturated soil will also create hydrostatic pressure; thus, for building foundations or
other below-grade elements, the effect of saturated soil must be considered in the design of these
building elements. Flooding can also cause vertical hydrostatic forces, resulting in flotation of
the submerged object, such as a building. Rapidly rising floodwaters can also cause structures to
float off their foundations.
When flood velocities increase, the magnitude of the hydrodynamic forces relative to the
hydrostatic forces also increases. During inundation by high-velocity riverine and coastal
floodwaters, a building must be able to resist both hydrodynamic forces and flood-borne debris
impact loads. High-velocity floodwaters are found in floodways along steeper-gradient rivers,
sheet-flow down slopes, and coastal areas with storm surge and waves.
High velocities in riverine and coastal flood areas create hydrodynamic forces on submerged
buildings and foundations. The hydrodynamic forces are capable of collapsing solid walls and
dislodging buildings with inadequate foundations. These forces are primarily a function of flood
flow velocity, but are also influenced by flood depth and structure geometry. FEMA P-259,
Principles and Practices for Retrofitting Flood-Prone Residential Structures (2012a), is a good
source of design information for determining both hydrostatic and hydrodynamic loads for
buildings located in or near riverine flood plains.
High-velocity flows can also result in scour around foundations and water-based infrastructure
(culverts, bridge supports, and utility support structures) due to large quantities of sediment and
debris. Scour around or under a structure can make the water deeper, which increases
hydrodynamic forces. Knowing what type of soil supports a building is important for assessing
the likelihood of scour.
Obtaining accurate velocity and depth information is the most important task in determining the
magnitude of flood loads. The Risk MAP products described in this document can help building
professionals estimate flood velocity at any particular point in the riverine floodplain. The
estimates and the supporting floodway velocity information are based on the continuity equation
for fluid flow: Q = V*A where Q is the stream flow in cubic feet per second, V is the velocity in
feet per second (fps) and A is the cross-sectional area of the stream in square feet. Thus, velocity
can be estimated using the FIS channel cross-sections across the stream and the stream cross-
sectional area.
The community FIS contains a Floodway Data Table (see section 2.1.1 for more details) that
includes some data on mean velocities (in fps) within the floodway for riverine studies for each
cross-section along the river or stream. The mean velocity is based on an average of the higher

Using Flood Velocity Data for Building Design
Recommended Procedures for Flood Velocity Data Development November 2012\\ 5-2
channel velocities and the lower floodway velocities in overbank. Generally, velocities at sites
outside of the floodway are lower than the mean floodway velocities listed in the Floodway Data
Table.
The presence of manmade flow obstructions along the flow path within channels or a shoreline
can create or exacerbate high-velocity flows. In developed areas, scour and erosion are
magnified when channelized flow is forced between existing buildings or through undersized
infrastructure. Existing buildings in riverine and coastal flood areas that are not elevated enough
above the design flood level or strong enough to resist flood loads are vulnerable to overwash,
excessive scour, high-velocity flows or waves, or some combination of these flood forces.
In addition to hydrostatic and hydrodynamic forces, flood-borne debris must be accounted for in
building design in floodplains. These forces are primarily a function of the weight and velocity
of the debris, which is assumed to flow at the same velocity as the flood water. Flood-borne
debris impact forces are also a function of the impact duration, which can vary significantly and
is estimated based on empirical studies. Refer to FEMA P-259 and American Society of Civil
Engineers (ASCE) 7-10, Minimum Design Loads for Buildings and Other Structures,
Commentary Chapter C5 for details. This is a conservative assumption of debris impact loads
because, depending on the weight of the debris, it is likely that it will tumble or flow along or
near the bottom of the water, where velocity is lower. However, some debris does float at or near
the surface, so it is prudent to design buildings and infrastructure to resist this debris.
The design for resisting flood loads should use the most restrictive flood case—either hydrostatic
or hydrodynamic. The highest possible load of flood-borne debris loads should be used for
determining building collapse possibilities because the equivalent size debris will not likely be
large enough to affect the entire flood impact area on a building. The flood loads associated with
wave forces on a building will depend primarily on the depth of flooding at the building
foundation. These loads must be added to the hydrostatic, hydrodynamic, and debris impact
loads to understand the total flood loads that could act on the building foundation.
Siting (proximity to a flooding source) can also affect foundation performance under flood
conditions, particularly in coastal areas. Building close to a shoreline is a common, and often
poor, siting practice. It generally renders a building more vulnerable to wave, flood, and erosion
effects and reduces any margin of safety against multiple storms or erosion events. If flood
hazards increase over time, the building may require removal, protection, or demolition. In
coastal areas subject to long-term or episodic erosion, poor siting often leads to otherwise well-
built elevated buildings standing on the active beach and potentially susceptible to additional
wave impacts.
In high-velocity flow areas, open foundation systems such as piers, piles, or columns can greatly
reduce hydrodynamic loads and, therefore, reduce damage. In addition, proper siting can also
reduce the flood loads on the foundation. Although the National Flood Insurance Program
(NFIP) allows solid foundation walls in Zone A areas with hydrostatic openings sized based on
the footprint of the building and positioned per guidelines in FEMA Technical Bulletin 1, solid
foundation walls are not recommended in Coastal A Zones where highly erodible soil conditions

Using Flood Velocity Data for Building Design
Recommended Procedures for Flood Velocity Data Development November 2012\\ 5-3
exist. Solid foundation walls are not permitted in Zone V. Because the hydrodynamic flows can
be greatest in coastal areas, an open foundation is the best way to elevate a residential building in
those areas.
5.1 USING FLOOD VELOCITY DATA FOR FOUNDATION DESIGN
Building design is one of the most important factors of successful foundation and superstructure
performance in riverine and coastal floodplain areas. Observations of building damage resulting
from past storm events have not only provided insight into the design of buildings, but have led
to positive changes in building design codes and standards. Newer buildings built to these codes
tend to perform better. However, certain design flaws still exist and are observed year after year
during post-disaster evaluations of building performance.
Preliminary calculations indicate that prescriptive provisions for closed foundations for Special
Flood Hazard Areas (SFHAs) in the International Residential Code may be inadequate to
withstand the effects of higher hydrodynamic loads in combination with flood-borne debris
impact loading. However, further research and vetting of these calculations are necessary to
confirm their validity.
In high-velocity flow areas, NFIP regulations require that areas below the lowest floor of
elevated buildings must be either free of obstructions or enclosed by non-supporting breakaway
walls, open lattice-work, or insect screening. Enclosed area use is limited to vehicle parking,
building access, or storage. Per Section 60.3(e)(5) in Title 44 of the Code of Federal Regulations,
breakaway walls should be designed and constructed with the “intention to collapse under wind
and water loads without causing collapse, displacement, or other structural damage to the
elevated portion of the building or supporting foundation system….” FEMA Technical Bulletin
9, Design and Construction Guidance for Breakaway Walls Below Elevated Buildings (August
2008) should be used as guidance for the design and construction of breakaway walls.
Normally, estimating the speed and direction of high-velocity flows is difficult and subject to
considerable uncertainty. However, with the flood velocity data grids generated by the non-
regulatory datasets, designers, permit reviewers, and building officials will have velocity data for
any areas in the SFHA. Section 8.5.6 of FEMA P-55, Coastal Construction Manual, has
guidance on estimating high-velocity flows based on proximity to the flooding source and
obstructions in the flood path that could reduce the velocity.
Although design and permit review professionals have multiple sources for design calculations
that meet or exceed local building codes for construction in or adjacent to floodplain areas,
FEMA has developed publications that provide comprehensive guidance on the rigorous
application of site-specific load determinations and best practices design methodology. These
publications have been peer reviewed and verified by building code organizations and national
experts. There are 12 FEMA publications with information and design requirements to address
high velocities that may be used in conjunction with the recently updated documents below,
which provide the guidance needed for a majority of coastal and riverine design calculations:
Using Flood Velocity Data for Building Design
Recommended Procedures for Flood Velocity Data Development November 2012\\ 5-4
FEMA P-55, Coastal Construction Manual: Principles and Practices of Planning, Siting,
Designing, Constructing, and Maintaining Residential Buildings in Coastal Areas,
Volumes I and II (2011). http://www.fema.gov/residential-coastal-construction
FEMA P-259, Engineering Principles and Practices for Retrofitting Flood-Prone
Residential Structures (2012a). http://www.fema.gov/library/viewRecord.do?id=1645
FEMA P-55 contains detailed information on the coastal flood data contained on the FIRMs for
coastal communities, different types of coastal flood effects, erosion, and foundation design
considerations and best practices for coastal areas of the United States and territories based on
flood hazard assessments.
It is imperative that the designs and construction plans be prepared by qualified professionals
who understand the technical evaluations and calculations needed to meet the design
requirements for structures in and adjacent to floodplain areas. Designs for new or retrofit
construction that are based on the site-specific velocity values can be more efficient and perform
better for specific loads than designs based on more general guidance for areas with unknown or
estimated velocities.
When available as part of a Risk MAP non-regulatory product (see Section 1.2), the velocity data
from the Flood Depth and Analysis Grid datasets can be used in design equations as follows:
For sites that show more than one value on the velocity grid, use the highest velocity
value, in fps, for the design equations.
Depending on the channel depth near the structure site, the velocity grid may also contain
velocity values that increase from the channel bottom to the water surface. Although the
highest velocity values are usually at the water surface, the highest velocity from the
column of water should be used for design calculations.
5.2 DAMAGE IN RIVERINE SFHAS
The following are representative types of damage common to riverine SFHAs. The depth,
velocity, and duration of flooding plus the local soil conditions and the elevation of the first floor
in relation to the flood elevation can reduce or increase the level of damage.
The most common form of structural damage to pre-FIRM residential buildings is the
failure of foundation walls, especially those constructed from unreinforced masonry.
Pre-FIRM residential buildings may also lack sufficient openings in the foundation walls
to allow the ingress and egress of floodwaters. In residential buildings that have openings
in their foundation walls, damage may still occur if the openings are too high above the
ground or obstructed by insulation or other building elements.
Other development in the SFHA, such as placing unanchored propane tanks, storage
sheds, or garages in the floodplain, can become damaging sources of debris as
floodwaters rise.
Using Flood Velocity Data for Building Design
Recommended Procedures for Flood Velocity Data Development November 2012\\ 5-5
The following best practices are recommended for new and retrofit construction in riverine
SFHAs. Basement wall failures are common in older construction where basements lack
reinforced foundation walls to resist lateral loads caused by hydrostatic forces and saturated
soils. These failures are found primarily in pre-FIRM basements within the SFHA and older
unreinforced foundation walls outside the SFHA.
Other than basements, foundation failures may be caused by either hydrostatic or hydrodynamic
forces. Hydrodynamic force failures occur due to high-velocity floodwater acting directly upon
the foundation. These failures are likely to occur in two places:
Near stream channels where floodwater exits the channel and enters the floodplain at
high velocity, such as at the outer side of stream bends
Near failed levees that allowed concentrated floodwater to enter the floodplain at high
velocity
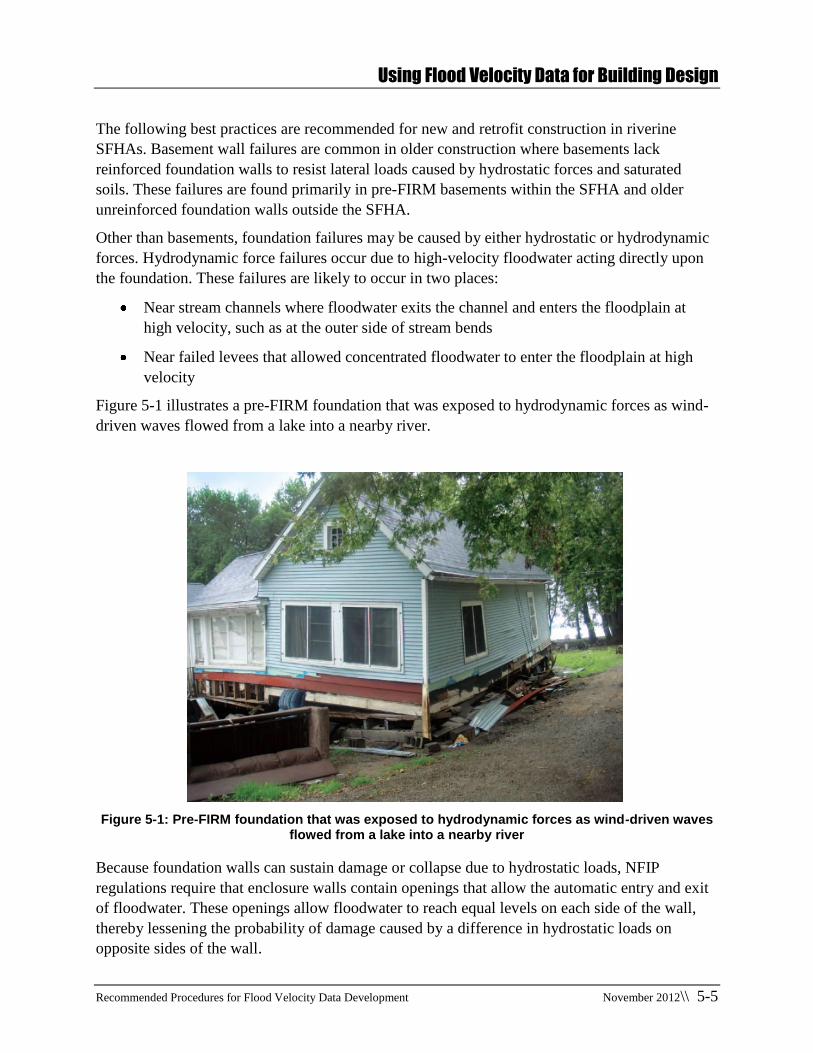
Figure 5-1 illustrates a pre-FIRM foundation that was exposed to hydrodynamic forces as wind-
driven waves flowed from a lake into a nearby river.
Figure 5-1: Pre-FIRM foundation that was exposed to hydrodynamic forces as wind-driven waves flowed from a lake into a nearby river
Because foundation walls can sustain damage or collapse due to hydrostatic loads, NFIP
regulations require that enclosure walls contain openings that allow the automatic entry and exit
of floodwater. These openings allow floodwater to reach equal levels on each side of the wall,
thereby lessening the probability of damage caused by a difference in hydrostatic loads on
opposite sides of the wall.

Using Flood Velocity Data for Building Design
Recommended Procedures for Flood Velocity Data Development November 2012\\ 5-6
The following best practices are recommended for structures in riverine SFHAs.
1. All new construction in SFHAs should be elevated to the BFE plus freeboard.
2. All new construction, substantial improvements, and repair of substantially damaged
structures in the SFHA should follow flood damage-resistant criteria and be elevated
above the BFE as specified by ASCE 24, Flood Resistant Design and Construction
(dwellings have 1 foot of freeboard and critical facilities have 2 to 3 feet of freeboard).
ASCE 24 design and elevation requirements apply to utilities and attendant equipment as
well. Property owners and developers should weigh the potential savings from damages
avoided against the upfront cost of elevating a few feet higher. The potential for lower
flood insurance rates as a result of lower flood risk should also be taken into account.
3. The importance of continuous load paths to foundations should be emphasized because
this is important in properly securing existing buildings that are being elevated on new
foundations.
4. Basements in the SFHA should be removed if a house is substantially damaged by
flooding and the community is not approved for basement exceptions under the NFIP.
Consideration should be given to filling in the basement areas when rebuilding and
reinforcing foundation walls during repairs. Basements located within the floodway
should be partially filled up to the outside grade and vents added for the remaining
portions of the basement walls that extend above the outside grade. Basements in houses
located outside the SFHA should also be considered for removal if there is a potential for
flooding.
5. When repairing a non-substantially damaged building in the SFHA and not filling the
basement as discussed above, all basement walls should be evaluated to determine if they
have adequate reinforcement. Specifically, foundation walls constructed of unreinforced
concrete masonry units should be reinforced during repair. Other modifications like
replacing unreinforced basement slabs can make a foundation system more resistant to
flooding and should be considered. The owner should consult with a qualified structural
engineer in this regard. Consideration should also be given to permanently relocating
utilities to a higher floor of the building, above expected flood levels, along with any
vulnerable contents that cannot be evacuated easily and quickly.
6. Communities should consider requiring open foundations for buildings that are
constructed in potential high-velocity flow areas, such as those along river bends and
immediately adjacent to the floodway. Open foundations include piles, posts, piers, or
columns with the building’s first floor elevated above the BFE. The pile, post, pier, or
column embedment depth must be designed to account for the maximum potential
erosion and scour depths as determined by a design professional familiar with site-
specific building design issues, including flooding. FEMA P-85, Protecting
Manufactured Homes from Floods and Other Hazards: A Multi-Hazard Foundation and
Installation Guide (2009) recommends that all manufactured home foundations in
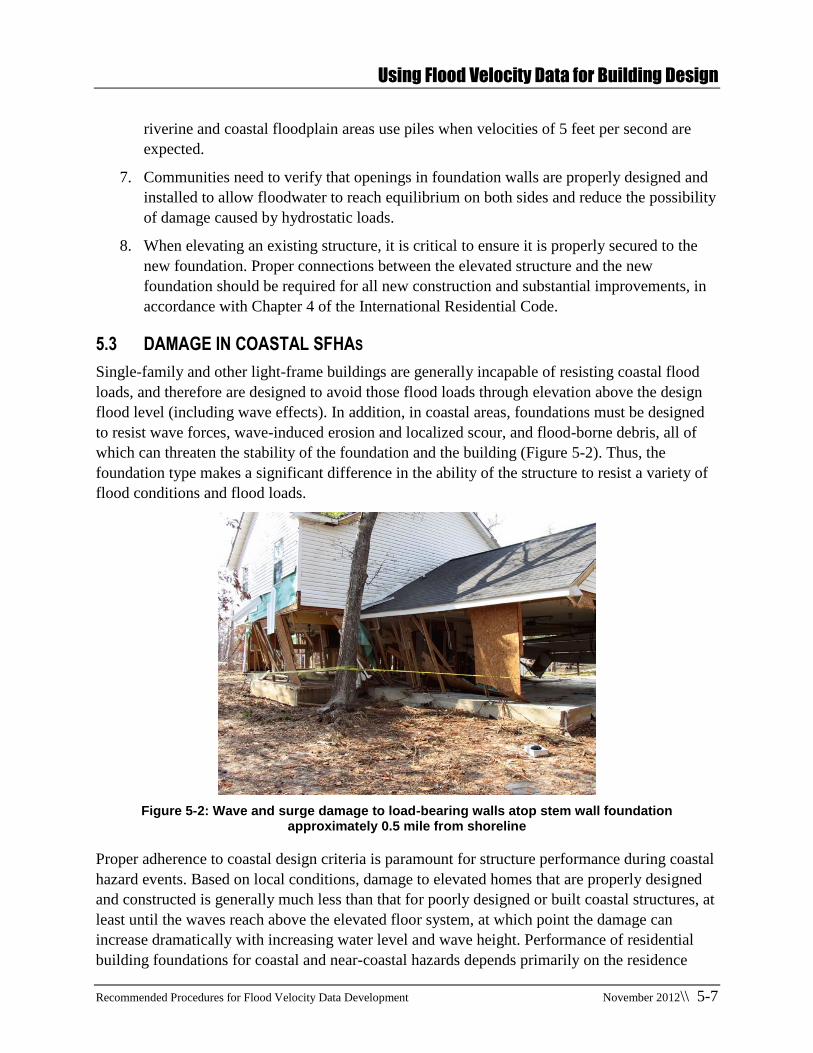
Using Flood Velocity Data for Building Design
Recommended Procedures for Flood Velocity Data Development November 2012\\ 5-7
riverine and coastal floodplain areas use piles when velocities of 5 feet per second are
expected.
7. Communities need to verify that openings in foundation walls are properly designed and
installed to allow floodwater to reach equilibrium on both sides and reduce the possibility
of damage caused by hydrostatic loads.
8. When elevating an existing structure, it is critical to ensure it is properly secured to the
new foundation. Proper connections between the elevated structure and the new
foundation should be required for all new construction and substantial improvements, in
accordance with Chapter 4 of the International Residential Code.
5.3 DAMAGE IN COASTAL SFHAS
Single-family and other light-frame buildings are generally incapable of resisting coastal flood
loads, and therefore are designed to avoid those flood loads through elevation above the design
flood level (including wave effects). In addition, in coastal areas, foundations must be designed
to resist wave forces, wave-induced erosion and localized scour, and flood-borne debris, all of
which can threaten the stability of the foundation and the building (Figure 5-2). Thus, the
foundation type makes a significant difference in the ability of the structure to resist a variety of
flood conditions and flood loads.
Figure 5-2: Wave and surge damage to load-bearing walls atop stem wall foundation approximately 0.5 mile from shoreline
Proper adherence to coastal design criteria is paramount for structure performance during coastal
hazard events. Based on local conditions, damage to elevated homes that are properly designed
and constructed is generally much less than that for poorly designed or built coastal structures, at
least until the waves reach above the elevated floor system, at which point the damage can
increase dramatically with increasing water level and wave height. Performance of residential
building foundations for coastal and near-coastal hazards depends primarily on the residence

Using Flood Velocity Data for Building Design
Recommended Procedures for Flood Velocity Data Development November 2012\\ 5-8
having adequate elevation, proper construction, proper foundation, and depth. If any of these
criteria are inadequate, performance under hazard conditions can suffer. Foundation depth is
extremely critical for resisting scour and erosion.
Buildings can be constructed to survive flood levels by elevating the lowest floor above the BFE,
choosing a foundation that is more resistant to flood forces and erosion, and using flood damage-
resistant materials above the BFE. Using these measures will make a building more “storm-
resilient,” reduce future flood damage, allow easier repairs, and reduce flood insurance
premiums. See Figure 5-2 for an example of damage to a house that was not elevated properly.
Foundations in coastal areas must meet the following requirements. Failure to meet any of these
requirements can result in building damage or collapse:
Be elevated above the surge and wave crest level
Remain intact and functional despite scour and erosion effects
Provide a continuous load path from the elevated building to the ground, and resist all
vertical and lateral loads transferred from the elevated building to the foundation
Resist flood loads, including storm surge, wave, and flood-borne debris impacts acting on
the foundation and any below-flood level obstructions that do not break away
Open foundations on piles are the best way to protect against costal flood damage. However,
even this type of foundation is subject to embedment failure or pile bending.
Embedment Failures. These failures occur when a foundation is not deep enough in the
ground to resist wind and flood loads pushing on the structure; a leaning foundation or
over-turned building can result. Scour and erosion often exacerbate this mode of failure
by reducing embedment (Figure 5-3).
Pile and Column Bending Failure. Pile and column breakage occur where the strength
of the piles or columns are inadequate to resist the bending moments or shear forces
caused by the flood and wind loads acting on the structure. Scour and erosion contribute
to this mode of failure by increasing the unbraced pile/column length and by increasing
the bending moments in the pile/column.

Using Flood Velocity Data for Building Design
Recommended Procedures for Flood Velocity Data Development November 2012\\ 5-9
Figure 5-3: House on verge of collapse due to shallow embedment of timber pile foundation
The methods used to secure an elevated building to the top of the foundation can also affect the
overall foundation strength. Connections at the tops of the piles or columns that do not provide
fixity (i.e., resistance to rotation) allow greater stresses to develop in the piles or columns than
would develop with connections that rigidly tie the structural elements together.
In buildings where timber construction is used for the foundation, and the tops of the piles or
columns are connected to elevated buildings with bolted connections, the connections provide
limited fixity; weakness in this type of connection can be overcome in some instances through
the use of larger piles or columns and other design details that help to stiffen the foundation. It
should be noted that piles that are over-notched (i.e., more than 50 percent of their cross-
sectional area) can also contribute to connection failures. This can occur when piles are
improperly spaced or misaligned during installation.
Residential building performance in coastal areas can also depend on the capability of the
building foundation to accommodate erosion and the loss of soil support. The lowering of the
ground is often caused by high winds, storm surge, large waves, and debris propelled by wind or
water, which further magnify adverse effects of soil loss. For foundation design purposes, it is
important to distinguish the nature and extent of soil loss expected around a building because
these can affect the stillwater flood depth and the magnitude of the flood conditions at the site.
Soil loss can be caused by erosion or scour.
Erosion. Erosion is a lowering of the ground surface over a large area, usually brought
on by a coastal storm or long-term shoreline recession. Erosion increases the unbraced
length of vertical foundation elements and increases the stillwater depth at the building,
allowing larger waves to reach the foundation.
Scour. Scour is a localized loss of soil immediately around an object or obstruction such
as building foundation elements. Scour also increases the unbraced length of vertical
foundation elements, but does not act to increase the stillwater flood depth across which

Using Flood Velocity Data for Building Design
Recommended Procedures for Flood Velocity Data Development November 2012\\ 5-10
waves propagate (thus, scour can be ignored for wave height calculation purposes).
Walls, columns, pilings, pile caps, footings, slabs, and other objects found under a coastal
building can contribute to localized scour.
Deep pile foundations are generally the most effective choice on barrier islands and open bay
shorelines, where waves, high velocity flow, and storm-induced erosion and scour are
anticipated, provided piles are sufficiently embedded and the top of the pile foundation is at or
above the wave elevation. The slender cross-section of piles minimizes the wave force
transferred to the elevated building unless the wave crest reaches the floor beams and joists. Piles
can be made of wood, concrete, or steel. Piles consist of a continuous structural unit along the
embedded and exposed length, which, unlike piers, do not contain splices or joints. Splices and
joints can become failure points for piers in areas subject to high flood levels, wave effects, and
large floating debris loads.
The following best practices are recommended for new and retrofit construction in coastal
SFHAs:
1. It is strongly recommended that buildings be constructed to survive flood levels that
exceed the base flood design conditions. Flood conditions can exceed those shown on the
FIRM for a variety of reasons, but the most common include storms more severe than the
1-percent-annual-chance flood and outdated flood maps; maps can become outdated
because of changed site conditions, the availability of better topographic data, or
improved modeling procedures. For these reasons, designing for flood conditions more
severe than the base flood is recommended. These designs could involve additional
freeboard (per ASCE 24) or the greater of the 500-year flood level and the flood of
record.
2. Communities should consider enforcing the ASCE 24-05 Zone A design and construction
standards in the areas between the effective SFHA landward limit and a ground elevation
equal to the adjacent Zone A. Even when buildings are elevated and constructed to meet
minimum requirements, they are still vulnerable to flood damage when flood levels
exceed the BFE.
3. New coastal construction should rely on deeply embedded piles and avoid shallow or
closed foundations such as slabs, stem walls, crawlspaces, or even piers.
4. The bottom frame members of all new and replacement manufactured homes should be
elevated to or above the BFE using wind- and flood-resistant foundations. Installation of
new manufactured homes should follow the guidance provided in FEMA P-85,
Protecting Manufactured Homes from Floods and other Hazards: A Multi-Hazard
Foundation and Installation Guide, Second Edition (2009).
5. State and local governments should encourage siting away from eroding shorelines,
employ coastal restoration where justified to mitigate erosion effects, and acquire
erosion-damaged properties and prohibit reconstruction on those lots.

Using Flood Velocity Data for Building Design
Recommended Procedures for Flood Velocity Data Development November 2012\\ 5-11
6. Enhanced-code houses involve construction that exceeds the minimum building code
requirements. As such, they should be designed to resist erosion, scour, and flood loads
associated with flood levels above the BFE, and not just elevated above the BFE on
otherwise minimally flood-compliant foundations. Entities certifying enhanced-code
houses should review foundation calculations before granting enhanced-code status.
7. In areas where the BFEs are approximately 6 feet above exterior grade (including erosion
effects) homes supported by pile foundations can be elevated 3 to 5 feet above the BFE
with only moderate cost increases. In areas where homes need to be elevated more than
10 feet above grade, pile foundations are still a viable method of providing reasonably
priced freeboard if longer piles are readily available in the area and the owner decides
that he or she still wants to build on that site. The ability to deeply embed the pile makes
it the most reliable support in areas subject to the deeper erosion commonly found on
barrier island and ocean dune exposures.
8. Grade beams used in open foundation designs allow the foundation to respond as an
integral system while avoiding footings that can rotate and fail with relatively low lateral
loads. Properly designed foundations using grade beams can withstand much higher
lateral loads since the entire grade beam matrix must rotate as an entity. Although grade
beam foundations can resist much greater lateral loads than foundations using discrete
footings, they are just as vulnerable to erosion- and scour-induced failures as foundations
with discrete footings. Grade beams can also create an obstruction if attached to the piles
and the piles are subject to excessive erosion and scour.
For additional building performance information, guidance and best practices, refer to the
Mitigation Assessment Team reports and recovery advisories for the Midwest floods in Iowa and
Wisconsin (2008) for riverine floodplains and the Hurricane Katrina (2006) and Hurricane Ike
(2009) Mitigation Assessment Team reports for coastal floodplains.

Summary
Recommended Procedures for Flood Velocity Data Development November 2012\\ 6-1
SECTION SIX SUMMARY
This report highlights the recommended procedures for developing flood depth and velocity grid
data based on the standard modeling used by the FEMA Risk MAP program. The report includes
background information on the development and use of the flood depth and velocity grid data for
discussions between FEMA Regional Building Science staff and local and State officials during
the Risk MAP implementation process. The report also summarizes FEMA’s Building Science
Branch and the Risk MAP program and includes detailed descriptions of depth and velocity grid
development. Lastly, the report reviews the pros and cons of the standard Risk MAP 1D and 2D
hydraulic models.
The four datasets developed as part of the non-regulatory Risk MAP products include the CSLF,
Flood Depth and Analysis Grids, Flood Risk Assessment, and AOMI. Combined, these datasets
communicate a variety of flood risk information, ranging from the depth of flooding, to the
velocity of floodwaters, to the probability of being flooded in any given year in a 30-year period
(duration of a typical home mortgage).
Three primary grid datasets are related to velocity issues in the Risk MAP non-regulatory
products:
Depth Grid presents flood depth values across the entire mapped floodplain to enable an
understanding of true flood risk. This dataset is derived by subtracting the terrain
elevation from the water surface elevation for respective recurrence interval events.
Riverine Velocity Grid presents the average flood velocity for a specific location in the
mapped floodplain for a given percent-annual-chance flood frequency profile.
Coastal Velocity Grid is similar to the riverine velocity grid and presents data for
floodplain areas affected by coastal flood hazards and storm surge.
FEMA specifies the minimum FRD standards in the FEMA Guidelines and Specifications for
Flood Hazard Mapping Partners, draft Appendices N and O (January 2012a and b). Although
these documents provide the minimum requirements for these grids, the additional procedures
recommended in this report will ensure the grids are more useful for building science
professionals. As part of enhanced data development, a community may decide to add
supplemental tables and spatial databases to the FRD.
Buildings in flood hazard areas may be subjected to a variety of flood-induced forces. During
inundation by standing or low-velocity floodwaters, a building must resist primarily hydrostatic
pressures from saturated soils and floodwaters. For inundation by high-velocity riverine and
coastal floodwaters, a building must also be able to resist hydrodynamic forces and flood-borne
debris impact loads. High-velocity floodwaters are found in floodways along steeper-gradient
rivers, sheet-flow down slopes, and coastal areas with storm surge and waves.
For building science purposes, these supplemental data could include anything from more
detailed H&H analysis data to building-specific construction practices databases. By being non-
regulatory and allowing for local enhancements, the FRD has the flexibility to archive more than

Summary
Recommended Procedures for Flood Velocity Data Development November 2012\\ 6-2
the standard regulatory datasets and products. Proper foundation design enhances overall
building stability and performance under riverine and coastal flood conditions. The Risk MAP
non-regulatory products provide site-specific velocity data that can be used to meet local
building code or enhanced foundation design requirements and to produce more efficient designs
that increase resilience for new or retrofit construction. Some examples of residential failures and
best practices and for siting, design, and construction in riverine and coastal SFHAs are included
in the document.
Once areas of highest flood risk are identified according to flood frequency and depths, Flood
Depth and Analysis Grids can be used to show additional hazard information. Communities can
then enlist the support of elected officials for mitigation projects that reduce flood risk. Building
officials can use these datasets to show structure owners, developers, contractors, and others how
the structure elevation requirements for specific sites may change over time. These data can also
be used to show the flood risk elements for each grid cell, such as the change in water surface
elevations between the old and new flood study and areas of high floodwater velocity.
Probability grids communicate the chance of being flooded in any given year or in a 30-year
period and the increased flood risks associated with the statistical confidence limits of the
hydraulic models.
Velocity grids can be developed from 1D, 2D, and 3D hydraulic models. For a 1D model, such
as HEC-RAS, velocities can be calculated in several ways and exported from the model. These
range from a single mean velocity value for only lettered cross-sections to quasi-2D methods that
use hundreds of velocity values for every modeled or interpolated cross-section. Velocity grid
developers may need to use a combination of automated and manual approaches to create
velocity grids that are consistent with other regulatory and non-regulatory datasets. All
procedures used should be well documented and explain the modeling assumptions and known
use limitations. Neither 1D nor quasi-2D models show direction of flow.
Two-dimensional models use more complex methods than 1D models for velocity, and can show
both magnitude and direction. Often 2D models are used for unsteady flow situations, such as
tidal areas, where velocity magnitude and direction can vary greatly. Velocity grid developers
need to decide if one or multiple velocity grids are required to show velocity conditions. GIS
methods used to develop velocity grids also need to address non-raster calculation elements.
Documentation of methods used for 2D hydraulic analysis and velocity grid development is
important for data users. This is especially true for indirect 2D methods, where velocity grids are
developed outside of a specific hydraulic model based on another grid, such as the depth grid.
Documentation of methods and limitation is also important for hybrid 2D models, in which
combinations of 1D and 2D models are used.
Some hydraulic models now have the capability for 3D approximation of flow. Conceptually, 3D
models are more complex than 2D models. There are some specific data needs for 3D models,
but they can use many of the same input data sets as 2D models. Because velocity calculations in
3D models have both horizontal and vertical components, the development of a velocity raster
(with only two dimensions) will require decisions on how to simplify the data. Because there are
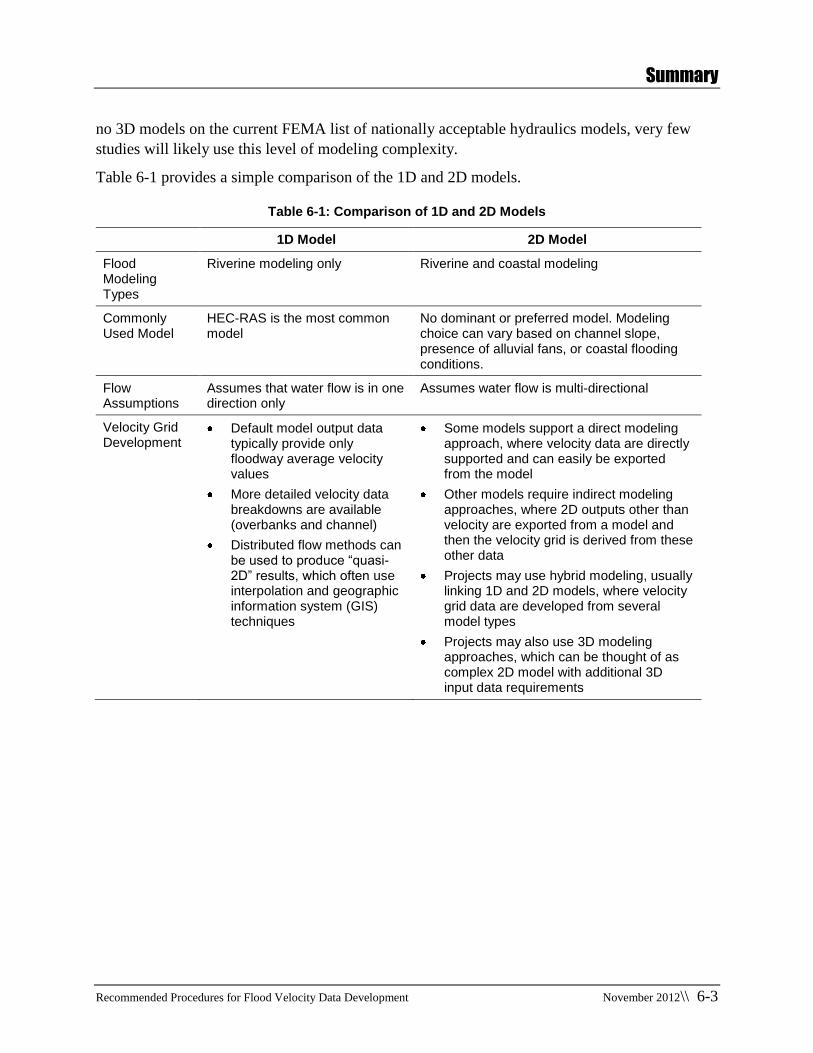
Summary
Recommended Procedures for Flood Velocity Data Development November 2012\\ 6-3
no 3D models on the current FEMA list of nationally acceptable hydraulics models, very few
studies will likely use this level of modeling complexity.
Table 6-1 provides a simple comparison of the 1D and 2D models.
Table 6-1: Comparison of 1D and 2D Models
1D Model 2D Model
Flood Modeling Types
Riverine modeling only Riverine and coastal modeling
Commonly Used Model
HEC-RAS is the most common model
No dominant or preferred model. Modeling choice can vary based on channel slope, presence of alluvial fans, or coastal flooding conditions.
Flow Assumptions
Assumes that water flow is in one direction only
Assumes water flow is multi-directional
Velocity Grid Development
Default model output data typically provide only floodway average velocity values
More detailed velocity data breakdowns are available (overbanks and channel)
Distributed flow methods can be used to produce “quasi-2D” results, which often use interpolation and geographic information system (GIS) techniques
Some models support a direct modeling approach, where velocity data are directly supported and can easily be exported from the model
Other models require indirect modeling approaches, where 2D outputs other than velocity are exported from a model and then the velocity grid is derived from these other data
Projects may use hybrid modeling, usually linking 1D and 2D models, where velocity grid data are developed from several model types
Projects may also use 3D modeling approaches, which can be thought of as complex 2D model with additional 3D input data requirements

References and Resources
Recommended Procedures for Flood Velocity Data Development November 2012\\ 7-1
SECTION SEVEN REFERENCES AND RESOURCES
References
ASCE (American Society of Civil Engineers). 2010. ASCE 7-10, Minimum Design Loads for
Buildings and Other Structures, Commentary Chapter C5.
ASCE. 2005. ASCE 24-05, Flood Resistant Design and Construction.
FEMA. 2003. Guidelines and Specifications for Flood Hazard Mapping Partners.
FEMA P-55. 2011. Coastal Construction Manual: Principles and Practices of Planning, Siting,
Designing, Constructing, and Maintaining Residential Buildings in Coastal Areas,
Volumes I and II.
FEMA P-85. 2009. Protecting Manufactured Homes from Floods and Other Hazards: A Multi-
Hazard Foundation and Installation Guide.
FEMA P-259. 2012a. Engineering Principles and Practices for Retrofitting Flood-Prone
Residential Structures.
FEMA. 2012b. Guidelines and Specifications for Flood Hazard Mapping Partners, draft
Appendix N, Flood Risk Data Development.
FEMA. 2012c. Guidelines and Specifications for Flood Hazard Mapping Partners, draft
Appendix O, Format and Standards for Non-regulatory Flood Risk Products.
Resources
FEMA P-348. 1999. Protecting Building Utilities From Flood Damage: Principles and
Practices for the Design and Construction of Flood Resistant Building Utility Systems.
FEMA P-499. 2010. Home Builder's Guide to Coastal Construction: Technical Fact Sheet
Series.
FEMA 549. 2006. Hurricane Katrina in the Gulf Coast, Mitigation Assessment Team Report,
Building Performance Observations, Recommendations, and Technical Guidance.
FEMA P-550. 2009. Recommended Residential Construction in Coastal Areas: Building on
Strong and Safe Foundations.
FEMA P-757. 2009. Mitigation Assessment Team Report, Hurricane Ike in Texas and Louisiana,
Building Performance Observations, Recommendations, and Technical Guidance.
References and Resources
Recommended Procedures for Flood Velocity Data Development November 2012\\ 7-2
FEMA P-765. 2009., Mitigation Assessment Team Report, Midwest Floods of 2008 in Iowa and
Wisconsin, Building Performance Observations, Recommendations, and Technical
Guidance.
FEMA Technical Bulletin 1. 2008. Openings in Foundation Walls and Walls of Enclosures:
Below Elevated Buildings in Special Flood Hazard Areas in accordance with the
National Flood Insurance Program.
FEMA Technical Bulletin 3. 1993. Non-Residential Floodproofing - Requirements and
Certification for Buildings Located in Special Flood Hazard Areas in accordance with
the National Flood Insurance Program.
FEMA Technical Bulletin 9. 2008. Design and Construction Guidance for Breakaway Walls
Below Elevated Buildings in Coastal High Hazard Areas in accordance with the National
Flood Insurance Program.
FEMA Technical Bulletin 11. 2001. Crawlspace Construction for Buildings Located in Special
Flood Hazard Areas in accordance with the National Flood Insurance Program.
International Code Council. 2008. Reducing Flood Losses through the International Code Series,
Published by the International Code Council (ICC).
FEMA. 2012. Flood Resistant Provisions of the 2012 International Code Series.
FEMA. 2010. Highlights of ASCE 24-05 Flood Resistant Design and Construction.
Hydraulic Modeling Resources
FEMA. 2012. Numerical Models Meeting the Minimum Requirement of NFIP, Currently
Accepted Hydraulic Models (2012). Available at: http://www.fema.gov/national-flood-
insurance-program-flood-hazard-mapping/numerical-models-meeting-minimum-
requirement-0.
Recommended