IMPORTANT DISCLOSURES, INCLUDING ANY REQUIRED RESEARCH CERTIFICATIONS, ARE PROVIDED AT THE END OF THIS REPORT. IF THIS REPORT IS DISTRIBUTED IN THE UNITED STATES IT IS DISTRIBUTED BY CGS-CIMB SECURITIES (USA), INC. AND IS CONSIDERED THIRD-PARTY AFFILIATED RESEARCH.
Powered by the EFA Platform
Asia Pacific Daily - 2 September 2019 Equity Research Reports…
▌IDEA OF THE DAY | India
IT Services (NEUTRAL) - Time for a breather; cautiously optimistic | P2 Digital adoption by clients is becoming the new normal and we believe that it will take several years for clients to reach adoption maturity. However, we see concerns over global tariff issues, their impact
on GDP of key markets, insourcing and supply side/margin pressure. Given these concerns, coupled with elevated sector valuations, we downgrade the sector from Overweight to Neutral
———————————————————————————————————————————————————————————————————————————————————————
▌Economics THB - Economic Update - Macro snapshot | P3 ———————————————————————————————————————————————————————————————————————————————————————
▌Australia Acrow Formwork and Construction Services (ADD, tp:A$0.34▼) - Down but not out | P4
Atomos (ADD, tp:A$1.58▼) - Recorded a strong maiden result | P5 Cromwell Property Group (HOLD, tp:A$1.22▲) - Ready for deployment | P6 Freedom Foods (HOLD, tp:A$5.16▼) - From here it all comes down to execution | P7
Generation Development Group (ADD, tp:A$0.83) - A good base set for further growth | P8 Genex Power (SPECULATIVE BUY, tp:A$0.30▼) - Solar not as bright but K2H is getting closer | P9 Micro-X (SPECULATIVE BUY, tp:A$0.47) - Future is looking brighter | P10
People Infrastructure (ADD, tp:A$3.83▲) - Industry tailwinds to drive growth | P11 PWR Holdings (ADD, tp:A$5.30▲) - Pole position | P12 ———————————————————————————————————————————————————————————————————————————————————————
▌China/Hong Kong Guangzhou Automobile Group (REDUCE, tp:HK$6.50▼) - Own brand drags | P13
Nissin Foods Co Ltd (ADD, tp:HK$7.59) - Expect further margin expansion in China | P14 Sino Land Co Ltd (HOLD▼, tp:HK$12.30▼) - Slowing sales, rising margin risk | P15 SOHO China (REDUCE, tp:HK$2.12▼) - Challenging operating outlook | P16 Universal Scientific Industrial (ADD, tp:Rmb16.00▼) - A better tomorrow | P17 ———————————————————————————————————————————————————————————————————————————————————————
▌Indonesia
Tunas Baru Lampung (ADD, tp:Rp1,300.00) - Fired up by biodiesel | P18 ———————————————————————————————————————————————————————————————————————————————————————
▌South Korea
Retail (UNDERWEIGHT) - CVS: Entering a duopoly | P19 Retail (UNDERWEIGHT) - July 2019 sales: downturn materialises | P20 ———————————————————————————————————————————————————————————————————————————————————————
▌Malaysia DKSH Holdings (Malaysia) (ADD, tp:RM3.64) - 2Q19: Boosted by Auric acquisition | P21
Duopharma Biotech Bhd (ADD, tp:RM1.56) - Manifesting its charms | P22 Genting Bhd (ADD, tp:RM7.90▼) - 1H19: Boosted by high win rate | P23 Genting Malaysia (HOLD, tp:RM3.15▼) - 2Q19: Win rates remained high | P24 IHH Healthcare Bhd (ADD, tp:RM6.37) - 2Q19: financing costs the main drag | P25
KPJ Healthcare (ADD, tp:RM1.25) - Capacity expansion continue to bear fruit | P26 LBS Bina Group (ADD, tp:RM0.88) - On track to achieve FY19 sales target | P27 Mah Sing Group (ADD, tp:RM1.20) - Lining up RM1.5bn of new launches in 2H19 | P28
MY E.G. Services (ADD, tp:RM1.96) - 3QFY19: Recruitment services have started | P29 Only World Group Holdings (REDUCE, tp:RM0.49▼) - 4QFY19: Still disappointing | P30 Success Transformer Corp (ADD, tp:RM1.39) - All set to light up FY20 | P31
Supermax Corp (ADD, tp:RM2.03▼) - An unexpected blip | P32 Tenaga Nasional (ADD, tp:RM15.30) - Higher dividend payout in store | P33 YTL Corporation (HOLD, tp:RM1.01▼) - Construction earnings at inflection point | P34 ———————————————————————————————————————————————————————————————————————————————————————
▌Singapore
Banks (NEUTRAL) - Domestic growth not holding up | P35 ———————————————————————————————————————————————————————————————————————————————————————
▌Thailand
Thai Oil (ADD, tp:THB77.00) - Strong GRM rebound in 2H19F | P36
Sources: CIMB. COMPANY REPORTS
Recent CGS-CIMB Research Ideas ——————————————————————————————————
THB: TMB Bank 28/08
Chance to shake up the industry —————————————————————————————————————————————————————————————————————————————————
INA: Navigating Indonesia: Cement 27/08
Light at the end of the tunnel —————————————————————————————————————————————————————————————————————————————————
INA: TVS Motor Co Ltd 26/08 Jack of many, but master of very few —————————————————————————————————————————————————————————————————————————————————
SIN: Strategy Note-Alpha 23/08
Test of time —————————————————————————————————————————————————————————————————————————————————
HKG: China Merchants Bank 23/08
Different from the rest ———————————————————————————————————————————————————— —————————————————————————————
Regional Equity Research Contact ————————————————————————————————— Bertram LAI Head of Research T: (852) 2532 1111 E: [email protected]
———————————————————————————————————————————————————————————————————————————————————
Show Style "View Doc Map"
|
Upcoming Events

Sector Note Navigating India │ IT Services │ August 30, 2019
IMPORTANT DISCLOSURES, INCLUDING ANY REQUIRED RESEARCH CERTIFICATIONS, ARE PROVIDED AT THE END OF THIS REPORT. IF THIS REPORT IS DISTRIBUTED IN THE UNITED STATES IT IS DISTRIBUTED BY CGS-CIMB SECURITIES (USA), INC. AND IS CONSIDERED THIRD-PARTY AFFILIATED RESEARCH. EFACustomEntityStatement
Powered by EFA Platform
DOWNGRADE
IT Services Time for a breather; cautiously optimistic
■ Digital adoption by clients is becoming the new normal and we believe that it will take several years before clients reach adoption maturity.
■ However, we see concerns over global tariff issues, their impact on GDP of key markets, insourcing and supply side/margin pressures.
■ Given these concerns, coupled with elevated sector valuations, we downgrade the sector from Overweight to Neutral.
Digital adoption is the new normal… Our demand thesis regarding the increasing adoption of digital technologies highlighted in
our sector report, “Increasing demand tailwinds”, is becoming a reality. We believe that
digital adoption is the new normal and offers increasing business benefits (Figures 8-9).
…and is a multi-year journey, in our view We also believe that the adoption of digital technologies would take several years as: i)
clients are looking to adopt advanced technologies beyond social, mobile, analytics and
cloud (SMAC), including block chain, artificial intelligence (AI), augmented/virtual reality
(AR/VR), Internet of Things (IoT), etc. in their business operations, and ii) only a very
small proportion of large clients have successfully adopted digital technologies (Figures
11-12). These trends are helping IT vendors to expand their order books (Figures 16-19).
Optimistic but cautious on rising macro/client-specific issues... We remain optimistic on IT services demand in the medium-to-long term but are now
more cautious. We believe that rising global macro issues (like global tariffs and Brexit)
have started to have impact on: i) GDP growth in key markets, with that of the
UK/Germany turning negative (Figures 22-25), ii) corporate earnings growth and its
correlation with IT spend (Figures 26-29), and iii) rising client-specific issues (Figure 30).
…and increasing supply, visa, margin issues, and insourcing We see additional concerns over: i) increasing visa rejection rates, employee attrition
rates and resulting scarcity of required skilled workers to fulfill demand and the impact on
margins (Figures 31-36), and ii) the rising trend of insourcing of IT spend as the use of
technology shifts to improving business value, besides cost efficiency (Figures 39-40).
NSE IT trailing P/E +1 s.d. above 3-year mean; downgrade to Neutral With the NSE IT index’s returns consistently outperforming the NIFTY over FY18 to FY20
YTD (Figure 44), NSE IT is trading at +1 s.d. above its 3-year mean on trailing P/E. This,
coupled with the above concerns, leads us to downgrade the sector to Neutral. We
believe that there is a declining correlation between digital IT spend (vs. traditional IT)
and corporate earnings but it is unlikely to be completely eliminated, hence our cautious
optimism. We prefer stocks with better US$ sales growth visibility and/or reasonable
valuations and prefer TechM, HCLT and Infosys (vs. TCS) as our large-cap picks, and
NITEC/Hexaware/LTI as our mid-cap picks. Any sharp depreciation in Rs/US$ is a key
upside risk and major adverse macro event/outsourcing rules are key downside risks.
Figure 1: NSE IT Index trailing P/E – trading at +1 s.d. above its 3-year mean
SOURCES: CGS-CIMB RESEARCH, BLOOMBERG
India
Neutral (previously Overweight)
Highlighted Companies
HCL Technologies ADD, TP Rs1,245, Rs1,118 close
In our view, HCLT’s reasonable P/E valuations (13.7x FY21F/12.5x FY22F) factors in the increasing uncertainty related to the synergy benefits from its big software IP/product-related M&A activities, to some extent. Also, we think its organic sales growth prospects are improving on the back of its increasing order book.
Infosys ADD, TP Rs870.0, Rs807.0 close
We believe that its increasing order book (without compromising ASP) augurs well for its sales growth visibility. We believe this would help Infosys improve margins in the medium term.
Tech Mahindra ADD, TP Rs800.0, Rs691.2 close
TechM’s sales growth prospects in the communication and enterprise segments are improving, which could provide positive surprises in its overall sales growth ahead. TechM’s current P/E valuations (12.7x FY21F/11.6x FY22F) offer favourable risk-reward ratio, in our view.
Summary Valuation Metrics
Insert
Analyst(s)
Sandeep SHAH
T (91) 22 4880 5159 E [email protected]
P/E (x) Dec-19F Dec-20F Dec-21F
HCL Technologies 15.19 14.00 12.78
Infosys 21.64 19.25 17.48
Tech Mahindra 14.12 12.91 11.80
P/BV (x) Dec-19F Dec-20F Dec-21F
HCL Technologies 3.14 2.78 2.52
Infosys 5.38 5.03 4.64
Tech Mahindra 2.88 2.62 2.36
Dividend Yield Dec-19F Dec-20F Dec-21F
HCL Technologies 2.53% 3.41% 3.76%
Infosys 2.91% 3.23% 3.60%
Tech Mahindra 3.00% 3.55% 3.94%
12.0
14.0
16.0
18.0
20.0
22.0
24.0
26.0
Aug-
11
Nov-
11
Feb-
12
May
-12
Aug-
12
Nov-
12
Feb-
13
May
-13
Aug-
13
Nov-
13
Feb-
14
May
-14
Aug-
14
Nov-
14
Feb-
15
May
-15
Aug-
15
Nov-
15
Feb-
16
May
-16
Aug-
16
Nov-
16
Feb-
17
May
-17
Aug-
17
Nov-
17
Feb-
18
May
-18
Aug-
18
Nov-
18
Feb-
19
May
-19
Aug-
19
Trailing P/E +1SD (19.2x) -1SD (15.8x) 3-year Avg trailing P/E (17.5x)
2

Economics Note Thailand August 30, 2019
IMPORTANT DISCLOSURES, INCLUDING ANY REQUIRED RESEARCH CERTIFICATIONS, ARE PROVIDED AT THE END OF THIS REPORT. IF THIS REPORT IS DISTRIBUTED IN THE UNITED STATES IT IS DISTRIBUTED BY CGS-CIMB SECURITIES (USA), INC. AND IS CONSIDERED THIRD-PARTY AFFILIATED RESEARCH.
Powered by the EFA Platform
Economics Update
Macro snapshot
■ The THB316bn stimulus to add 0.3% pt to GDP but may not arrive in time to arrest slide in this year’s growth (CGS-CIMB: +2.7% in 2019, +3.2% in 2020).
■ Further efforts needed to nudge baht weaker, including further BOT rate cut.
External headwinds ruffle domestic economy A disappointing outturn in 2Q19 GDP data has led to full-year forecast revisions by us
(+2.7% vs. +3.3% previously) and the Ministry of Finance (3.0% vs. 3.8% in Apr). Exports
rebounded in Jul (+3.8% yoy vs. -2.1% yoy in Jun) – driven by sequential gains in E&E,
agriculture, fishery and precious stones & metals – while industrial output contracted at a
slower pace (-3.2% yoy vs. -5.3% yoy in Jun) as slippages in autos, rubbers & plastics,
and hard drives moderated. Despite green shoots, new US-China tariffs could still upend
trade activity. Apart from the trade war, tourism slowdown, and weakened domestic
business sentiment, the finalisation of the Cabinet only in Jul has delayed disbursement
of the 2020 Budget from Oct 2019 to Jan 2020, exerting a short-term fiscal drag.
Tourism sector has bottomed but recovery to be gradual The visa-on-arrival fee waiver, which was recently extended to Apr 2020, helped boost
tourist arrivals in Jul (+4.7% yoy vs. +1.3% yoy in Jun), as arrivals from China recovered
(+5.8% yoy vs. -7.1% yoy in Jun), boosted by a less challenging base given the boat
incident in Jul last year. However, a further relaxation to grant visas waivers for stays up
to 30 days for travellers from China and India was rejected due to security concerns.
Slower outflows of Thai capital bolsters external financial position The balance of payments (BOP) position improved in Jul (+US$4.5bn vs. +US$1.9bn in
Jun), as slower outflows of Thai portfolio investment and deposits abroad lifted the
financial account, negating the narrower current account surplus (+US$1.8bn in Jul vs.
+US$3.9bn in Jun).
Reinforcements arriving as stimulus takes shape MOF unveiled a stimulus package of THB316.8bn or US$10bn (Fig 1) to boost flagging
private consumption (+2.6% yoy in Jul), consisting of: 1) THB200bn in debt suspensions
for farmers and loans for SMEs, 2) THB20bn welfare transfer top-ups for low-income
consumers paid by early-Sep, 3) THB20bn hand-outs to promote local tourism, 4) tax
benefits for first-time homebuyers, and 5) accelerated infrastructure spending.
Separately, the government is working on: 1) implementing a one-year THB59bn scheme
to fix rice and palm oil prices, key anchors for farm incomes, and subsidies for paddy
farmers, 2) intensified efforts to boost exports via G2G deals for agriculture products and
attract FDI with a relocation package, and 3) incentives for electric vehicle buyers. The
Bank of Thailand (BOT) has also postponed implementing a standardised debt-service
ratio for banks, which would have tightened credit access for low-income households.
VAT on digital businesses to take effect in 2020 Apart from a proposed expansion of the value-added tax (VAT) to cover e-businesses in
2020, expected to generate additional revenue of THB3-4bn p.a., the MOF is studying a
revamp of Thailand’s tax regime, including the viability of Palang Pracharath’s election
promise of personal income tax cuts.
Central bank’s resolve tested by baht resilience The BOT has undertaken a series of measures to restrain the baht: 1) lowering the ceiling
balance on non-resident FX accounts to THB200m, 2) demanding greater transparency
on foreign holders of Thai debt securities, 3) lowering supply of short-term BOT bills, and
4) a 25bp policy rate cut in Aug. The baht’s resilience has led BOT officials to restate a
commitment to further interventions, including relaxing conditions on outbound Thai
investments. In tandem, we think the BOT may consider further policy rate cuts to nudge
the baht weaker, given dovish stances across regional central banks, and maintain our
forecast of one further 25bp cut to the policy rate by 1H20.
Thailand
Insert
Economist(s)
Michelle CHIA
T (60) 3 2261 9097 E [email protected]
Sofea AZAHAR T (60) 3 2261 9096 E [email protected]
3

Constrn & Material - Overall│Australia│Equity research│August 30, 2019
IMPORTANT DISCLOSURES REGARDING COMPANIES THAT ARE THE SUBJECT OF THIS REPORT AND AN EXPLANATION OF RECOMMENDATIONS CAN BE FOUND AT THE END OF THIS DOCUMENT. MORGANS FINANCIAL LIMITED (ABN 49 010 669 726) AFSL 235410 - A PARTICIPANT OF ASX GROUP
Powered by EFA
Acrow Formwork and Construction Services
Down but not out
ACF’s FY19 result overall was below our expectations.
2H19 performance was impacted by the wind down of existing projects and delays in the start-up of new projects.
Encouragingly, some projects are beginning to come on line with the pipeline remaining strong.
We decrease FY20F underlying EBITDA by 16% to A$12.5m.
Maintain Add rating on a lower A$0.34 target price (from A$0.40).
FY19 result was below our expectations ACF reported FY19 earnings growth that was below our expectations. FY19 EBITDA rose 9% to A$11.6m (-7% vs Morgans) while underlying NPAT fell 5% to $7.5m (-6% vs Morgans). Revenue was up 9%, which benefitted from growth in formwork hire revenue and a 10-month contribution from Natform, partially offset by a large drop in scaffold hire revenue. Growth in 2H19 was impacted by the wind down of existing projects and delays in the start-up of new projects, which affected the legacy ACF business as well as Natform. Encouragingly, some of these projects are now starting to come on line, which should help revenue in FY20. Natform won seven contracts during the year on the back of cross-selling initiatives, with six of these contracts either recently commenced or due to commence in 1Q20.
Outlook remains strong After weak trading in 3Q19, management saw improved performance in 4Q19 with 1Q20 trading activity commencing at similar levels. The pipeline remains strong, with potential hire revenue increasing 61% in FY19 versus FY18. ACF is the only national provider of formwork, screen and scaffolding equipment rental in Australia, and we think this puts it in a good position to win work over the next few years. The company is also underrepresented in the large civil infrastructure markets of NSW and VIC with opportunities to increase market share in these key states.
Decreases to earnings forecasts We reduce FY20F underlying EBITDA by 16% to A$12.5m while underlying NPAT also decreases by 16% to A$8.4m.
Maintain Add rating On the back of changes to earnings forecasts our equally-blended (PE, EV/EBITDA, DCF) target price falls to A$0.34 (from A$0.40). While the FY19 result was softer than expected, we remain encouraged by the strong outlook for civil infrastructure activity on the east coast. Project timing continues to be uncertain. However, over the medium term we think ACF remains well positioned for solid growth. With the stock trading on 6.0x FY20F PE and 7.7% yield, we continue to see valuation support and maintain our Add rating.
SOURCE: MORGANS, COMPANY REPORTS
▎Australia
ADD (no change) Current price: A$0.29
Target price: A$0.34
Previous target: A$0.40
Up/downside: 19.3%
Reuters: ACF.AX
Bloomberg: ACF AU
Market cap: US$34.11m
A$50.58m
Average daily turnover: US$0.05m
A$0.08m
Current shares o/s 175.0m
Free float: 72.0%
Key changes in this note
FY20F EBITDA down by 16%.
FY20F NPAT down by 16%.
Price performance 1M 3M 12M
Absolute (%) -13.6 -10.9 -38.7
Relative (%) -10.1 -14.2 -42.7
Alexander LU, CFA
T (61) 2 9043 7901
Analyst(s) own shares in the following stock(s) mentioned in this report:
– Acrow Formwork and Construction Services
Financial Summary Jun-18A Jun-19A Jun-20F Jun-21F Jun-22F
Revenue (A$m) 65.34 71.01 73.48 75.65 78.14
Operating EBITDA (A$m) 10.60 11.55 12.50 13.36 14.26
Net Profit (A$m) 6.46 4.91 8.41 9.07 9.77
Normalised EPS (A$) 0.043 0.041 0.048 0.051 0.055
Normalised EPS Growth 529% (6%) 17% 7% 7%
FD Normalised P/E (x) 6.24 6.42 5.97 5.58 5.23
DPS (A$) 0.005 0.020 0.022 0.024 0.025
Dividend Yield 1.75% 7.02% 7.66% 8.33% 8.87%
EV/EBITDA (x) 4.41 4.86 4.35 4.05 3.57
P/FCFE (x) NA 121.1 27.7 14.6 7.8
Net Gearing (12.6%) 7.7% 8.0% 5.7% (0.4%)
P/BV (x) 1.19 1.05 0.94 0.85 0.77
ROE 34.6% 17.3% 16.6% 16.0% 15.4%
% Change In Normalised EPS Estimates
Normalised EPS/consensus EPS (x) 0.81 0.87 0.78
46
72
97
123
0.230
0.330
0.430
0.530
Price Close Relative to S&P/ASX 200 (RHS)
Source: Bloomberg
5
10
15
Aug-18 Nov-18 Mar-19 Jun-19
Vo
l m
4

Lifestyles│Australia│Equity research│August 29, 2019
IMPORTANT DISCLOSURES REGARDING COMPANIES THAT ARE THE SUBJECT OF THIS REPORT AND AN EXPLANATION OF RECOMMENDATIONS CAN BE FOUND AT THE END OF THIS DOCUMENT. MORGANS FINANCIAL LIMITED (ABN 49 010 669 726) AFSL 235410 - A PARTICIPANT OF ASX GROUP
Powered by EFA
Atomos
Recorded a strong maiden result
AMS delivered a strong maiden FY result, with revenue +51% yoy to A$54m and EBITDA slightly above recently upgraded guidance.
Looking into FY20, we forecast another strong year of revenue and earnings growth, driven by solid top-line growth (+39% yoy) and EBITDA increasing to A$5.7m (vs A$1.6m in FY19) reflecting fixed cost leverage.
Clearly AMS is benefiting from stronger than expected take-up of its recent product releases, which bodes well for continued growth as the business expands into the Social/Cinema markets. We maintain an Add rating with a A$1.58 PT.
FY19 result – a strong beat on prospectus forecasts AMS reported a strong maiden FY19 result, exceeding both revenue and EBITDA prospectus forecasts and recently upgraded guidance. Key highlights of the result included: revenue +51% to A$54m (+32%/+72% 1H/2H and vs MorgsE of A$50.4m); gross profit of A$24m (vs MorgsE of A$23.5m); gross margin of 44.4% (-210bps vs MorgsE); CODB of A$22.4m (-640bps as a % of sales); and EBITDA of A$1.6m (vs guidance for A$1.4m and A$0.3m prospectus forecast). Gross margins were -410bps yoy and below forecast, impacted by higher component costs in the 1H which is now resolved (2H GM was +190bps hoh). CODB was slightly higher (as was revenue/GP), due to higher than forecast marketing costs (A$2.3m above prospectus). AMS generated an operating cash outflow of A$4.2m, reflecting inventory build (A$1.9m) and debtors (A$3.2m) from stronger sales. AMS ended FY19 with A$3.6m of net cash (A$5.1m cash; A$1.5m debt), with pro-forma cash position of ~A$11m following the A$7.5m raise completed post balance date.
New releases should see continued growth in FY20 Strong revenue growth was driven primarily by the releases of the Ninja V and Shinobi products, in addition to continued sales of the Shogun Inferno. Pleasingly, this was across all regions with the US +60%. Over FY19, AMS announced the seven new releases (Ninja V; two Shinobi products; Shogun 7; and four Neon products). This should see another strong year of growth into FY20 as products are released (Neons/Shogun 7) and products launched during FY19 are annualised into the revenue base. A key driver of our revenue growth into FY20 is the Neon range, which we forecast to account for ~30% of our FY20 revenue (~A$23m). We expect AMS will continue to announce/release additional products over the coming year.
Mapping out our forecasts AMS did not provide guidance (as expected), but did note it anticipates ‘solid growth in sales and earnings’. We forecast 39% revenue growth in FY20 – primarily driven by new product releases and an annualised impact of FY19 releases. We have made slight increases to our marketing spend, reflecting the higher FY19 base and reinvestment in the business to assist continued top-line momentum and expansion into new market segments. We forecast EBITDA of A$5.7m in FY20 (vs A$1.4m the pcp).
Add maintained and A$1.58 price target Following today’s result, our PT falls slightly to A$1.58. We believe AMS’ recent product momentum and relatively fixed cost base should see potential upside to our forecasts upon successful execution. With >10% TSR on offer, we maintain an Add rating. We note that given AMS’ scalable manufacturing operations, additional partnerships can move the dial in terms of revenue/earnings uplift, which is a key upside risk. Key risks: product obsolescence, loss of distributors/relationships; working capital requirements; supply chain; and competition.
SOURCE: MORGANS, COMPANY REPORTS
▎Australia
ADD (no change) Current price: A$1.39
Target price: A$1.58
Previous target: A$1.63
Up/downside: 14.4%
Reuters: AMS.AX
Bloomberg: AMS AU
Market cap: US$149.0m
A$220.8m
Average daily turnover: US$0.57m
A$0.87m
Current shares o/s 169.5m
Free float: 86.0%
Price performance 1M 3M 12M
Absolute (%) 0.7 3.4
Relative (%) 5.4 2.4
James BARKER
T (61) 7 3334 4893
Nick HARRIS
T +61 7 3334 4557
Analyst(s) own shares in the following stock(s) mentioned in this report:
– Atomos
Financial Summary Jun-18A Jun-19A Jun-20F Jun-21F Jun-22F
Revenue (A$m) 35.6 54.0 74.9 90.2 108.7
Operating EBITDA (A$m) 0.22 1.65 5.66 9.59 13.84
Net Profit (A$m) -0.06 -0.65 4.28 8.02 9.72
Core EPS (A$) (0.000) (0.004) 0.025 0.047 0.057
Core EPS Growth (99%) 1057% 87% 21%
FD Core P/E (x) NA NA 53.65 29.26 24.14
DPS (A$) - - - - -
Dividend Yield 0% 0% 0% 0% 0%
EV/EBITDA (x) 964.9 133.9 40.1 23.8 16.5
P/FCFE (x) NA NA NA 277.1 102.5
Net Gearing (45.7%) (15.6%) (24.0%) (17.5%) (14.8%)
P/BV (x) 10.07 9.67 7.37 6.48 5.56
ROE (0.5%) (2.8%) 15.5% 23.6% 24.8%
% Change In Core EPS Estimates (1.5%) 4.9% 14.3%
CGS-CIMB/Consensus EPS (x) 0.97 1.05 1.15
77
127
177
227
277
327
377
0.31
0.51
0.71
0.91
1.11
1.31
1.51
Price Close Relative to S&P/ASX 200 (RHS)
Source: Bloomberg
10
20
30
Dec-18 Feb-19 May-19 Jul-19
Vo
l m
5

REIT│Australia│Equity research│August 30, 2019
IMPORTANT DISCLOSURES REGARDING COMPANIES THAT ARE THE SUBJECT OF THIS REPORT AND AN EXPLANATION OF RECOMMENDATIONS CAN BE FOUND AT THE END OF THIS DOCUMENT. MORGANS FINANCIAL LIMITED (ABN 49 010 669 726) AFSL 235410 - A PARTICIPANT OF ASX GROUP
Powered by EFA
Cromwell Property Group
Ready for deployment
CMW’s FY19 result was slightly ahead of guidance. FY20 op. EPS guidance now expected to be at the upper end of the range at 8.3c with DPS guidance 7.5c.
The Invest to Manage strategy remains unchanged with CMW identifying a cA$1bn pipeline in value-add opportunities.
We retain a Hold rating with a price target of A$1.22.
FY19 result highlights CMW reported op. profit of A$174.2m (+11.1% on the pcp). Op. EPS was 8.21cps (vs 8.36cps in the pcp and guidance of 8c). NOI was +5.5% with good fee contributions from retail funds management which offset a lower wholesale contribution. FY19 distributions totaled 7.25c (in line with guidance/90% payout ratio). Gearing 35% from 37%, however pro-forma gearing is 24% (weighted average tenor 4.5 years/gearing target range 30-40%) and cash A$101.6m. NTA is 97c (+1c on the pcp). We note CMW raised A$407.5m at A$1.15 in June with funds used to pay down debt and growth opportunities with a A$1bn pipeline of value-add opportunities identified as well as further asset recycling. Gearing will likely increase to the low 30% range post deployment.
FY20 guidance reiterated; deployment of funds underway FY20 EPS guidance has been tightened to the top end of the range (8.3c vs MorgansE at 8.2c). DPS guidance is 7.5c. We expect any variability will come down to timing on deployment of capital/transactional activity. Material transactions post balance date include the acquisition of 400 George St, Brisbane (A$525m/5.9% yield) and due to settle in September. Other potential transactions include European retail/office opportunities with CMW announcing it has exercised a pre-emptive right to acquire a third party investor interest in the Cromwell Polish Retail Fund (7 shopping centres valued at A$900m). Further detail on the fund will be known in the next few months. During 2H19, CMW also announced it sold its 50% stake in Northpoint for A$300m (still subject to FIRB approval).
Portfolio and FUM tracking well CMW’s portfolio is valued at A$2.5bn; WALE 6.9 years; and WACR 5.80%. As at June, vacancy was 8.3% (ex active assets = 2%) and FY20/21 lease expiries 8.7%/6.9% respectively with 3 expires >1% of income due by 06/21. Total AUM at June was A$9bn (+3.2%) with growth driven by retail AUM (A$2.3bn) with wholesale AUM flat on the pcp at A$6.7m. Around half of the Europe AUM is now supported by longer dated capital providing recurring income (near term likely to reach 64% vs medium term target 75%). CMW has a medium term target to grow European FUM to €8bn (double current FUM).
Retain Hold rating; distribution yield 6% While there is a solid recurring income base with the core property and funds management operations, CMW’s active assets will also deliver returns for investors over the medium/long term. CMW’s ‘Invest to Manage’ strategy seeks to use its existing balance sheet liquidity and asset recycling to fund a range of initiatives to deliver growth over the medium to longer term. CMW now has a wider range of capital sources it can connect with opportunities across AU, NZ and EU. Post changes, our SOTP/DCF valuation moves to A$1.22 from A$1.20. Upcoming catalysts relate to successful outcomes from the active management of assets; potential M&A; and update/execution of growth initiatives. Key risks relate to tenant default/non-renewal and lower than forecast/loss of AUM.
SOURCE: MORGANS, COMPANY REPORTS
▎Australia
HOLD (no change) Current price: A$1.22
Target price: A$1.22
Previous target: A$1.20
Up/downside: 0.2%
Reuters: CMW.AX
Bloomberg: CMW AU
Market cap: US$2,136m
A$3,167m
Average daily turnover: US$7.15m
A$10.34m
Current shares o/s 2,563m
Free float: 92.0%
Price performance 1M 3M 12M
Absolute (%) 2.5 4.3 10.4
Relative (%) 7.2 3.3 8
Fiona BUCHANAN
T (61) 7 3334 4879
Analyst(s) own shares in the following stock(s) mentioned in this report:
– Cromwell Property Group
Key metrics
Jun-18A Jun-19A Jun-20E Jun-21E Jun-22E
Revenue (A$m) 311.6 314.6 358.4 365.6 385.5
EBITDA (A$m) 172.9 169.1 208.6 213.4 231.7
EBIT (A$m) 172.5 167.6 208.2 213.0 231.3
NPAT (A$m) 156.8 173.1 215.7 222.4 230.7
EPS Norm. (cps) 8.4 8.2 8.3 8.5 8.8
EPS growth -3% -2% 2% 3% 3%
Normalised P/E (x) 11.2 16.3 13.1 12.8 13.8
EV/EBITDA (x) 20.0 20.7 18.4 19.9 19.1
DPS (cps) 8.3 7.3 7.5 7.7 7.9
Yield 6.8% 5.9% 6.1% 6.3% 6.5%
Payout ratio 100% 89% 90% 90% 90%
Interest cover (x) 4.2 3.9 4.8 5.3 4.6
Gearing (ND/A) 35% 34% 26% 29% 30%
NTA (A$) 0.96 0.97
96.0
100.0
104.0
108.0
112.0
0.900
1.000
1.100
1.200
1.300
Price Close Relative to S&P/ASX 200 (RHS)
Source: Bloomberg
10
20
30
40
Aug-18 Nov-18 Mar-19 Jun-19
Vo
l m
6

Food & Beverages│Australia│Equity research│September 1, 2019
IMPORTANT DISCLOSURES REGARDING COMPANIES THAT ARE THE SUBJECT OF THIS REPORT AND AN EXPLANATION OF RECOMMENDATIONS CAN BE FOUND AT THE END OF THIS DOCUMENT. MORGANS FINANCIAL LIMITED (ABN 49 010 669 726) AFSL 235410 - A PARTICIPANT OF ASX GROUP
Powered by EFA
Freedom Foods Group
From here it all comes down to execution
While FNP’s FY19 result missed our forecasts on most key metrics, there were some encouraging signs from Dairy and Plant Based Beverages which are both scaling nicely.
We expect strong earnings growth over the forecast period due to strong demand for FNP’s products across Australia, Asia and the Middle East. It will also benefit from the further scaling of new facilities and the production of higher margin dairy nutritional productions.
We maintain a Hold rating with a new price target of A$5.16.
FY19 result grows strongly although misses our forecast Sales were slightly below the bottom end of recently revised guidance. Despite the miss, FY19 sales rose 35%, underlying EBITDA was up 31% and NPAT increased 21% (higher D&A and interest). Strong growth reflected strong demand for its existing products across Australia and Asia, new product launches, expanded distribution and the scaling of new facilities. Margin performance was particularly disappointing as group overheads rose 66%. Some of the increase reflected materially higher employee share option expense of A$5.8m, up from A$1.3m the pcp. Capex was 45% higher than expected at A$199.0m as spend was been brought forward from FY20. The operating cash outflow was A$0.9m compared to guidance for positive cashflow. Net debt consequently rose to A$122.0m compared to our forecast of A$53.7m. The highlight of the result for us was the strong performance from the Dairy operations (EBITDA up 112.6%). Plant Based Beverages also had a strong year (EBITDA up 47.5%). Cereals & Snacks and Specialty Seafood, both went backwards for the period.
Outlook is for growth however it wasn’t quantified Unlike past practice, FNP hasn't provided formal FY20 sales guidance. However management said it expects revenue and operating profits to increase in FY20. In particular, new product revenue streams from the Nutritionals capability, such as lactoferrin, are expected to materially contribute to FY20 and beyond. Importantly, FNP said that capex has now peaked and cashflow generation is expected to improve. We expect strong earnings growth over the forecast period due to strong demand for FNP’s products across its key markets/geographies. It will also benefit from the scaling of new facilities and the production of higher margin dairy nutritional productions. However, we continue to believe that consensus estimates in outer years are far too high given expectations that lactoferrin prices will remain high despite significant new capacity coming online over the next couple of years. Due to higher than expected D&A, our FY20/21/22 NPAT forecasts have fallen by 3.2%/2.9%/6.5%.
Investment view – Hold and A$5.16 price target (was A$5.52) FNP’s vast product portfolio gives it strong leverage to favourable healthy eating and drinking trends. While it has a strong earnings growth profile, it is a capital intensive business. We expect that investors are relieved to hear that FNP is now through its peak capex cycle. However, as we have seen in recent years, the company is known for increasing its spend beyond what it has previously said as there is always another growth opportunity. Trading on a FY20/21F PE of 37.8x/23.5x, there is no room for disappointment and given the company has missed our forecasts for number of years now, execution risk remains. FNP’s trading multiples are more than fair given its margins and ROE (8.7% in FY22 when it reaches its capacities) are below the sector average.
SOURCE: MORGANS, COMPANY REPORTS
▎Australia
HOLD (no change) Current price: A$5.05
Target price: A$5.16
Previous target: A$5.52
Up/downside: 2.2%
Reuters: FNP.AX
Bloomberg: FNP AU
Market cap: US$929.4m
A$1,378m
Average daily turnover: US$2.40m
A$3.93m
Current shares o/s 272.9m
Free float: 47.4%
Price performance 1M 3M 12M
Absolute (%) 4.8 -5.6 -13.7
Relative (%) 8.3 -8.9 -17.7
Belinda MOORE
T (61) 7 3334 4532
Kurt GELSOMINO
T (617) 3334 4858
Analyst(s) own shares in the following stock(s) mentioned in this report:
– N/A
Financial Summary Jun-18A Jun-19A Jun-20F Jun-21F Jun-22F
Revenue (A$m) 353.0 476.2 648.4 776.1 865.8
Operating EBITDA (A$m) 37.8 49.4 86.8 123.9 143.3
Net Profit (A$m) 13.20 12.06 37.17 59.70 69.22
Normalised EPS (A$) 0.07 0.07 0.14 0.22 0.25
Normalised EPS Growth 40.4% 3.8% 87.8% 60.6% 15.9%
FD Normalised P/E (x) 74.00 73.09 37.79 23.51 20.26
DPS (A$) 0.050 0.055 0.060 0.065 0.070
Dividend Yield 0.99% 1.09% 1.19% 1.29% 1.39%
EV/EBITDA (x) 29.94 28.16 17.71 12.57 10.79
P/FCFE (x) NA NA NA 173.9 47.0
Net Gearing 6.8% 18.2% 23.0% 24.5% 21.5%
P/BV (x) 2.33 2.05 1.99 1.88 1.76
ROE 3.57% 3.04% 5.45% 8.38% 9.12%
% Change In Normalised EPS Estimates (3.20%) (2.05%) (5.00%)
Normalised EPS/consensus EPS (x) 0.83 0.80 0.98
60.0
70.0
80.0
90.0
100.0
110.0
120.0
130.0
3.70
4.20
4.70
5.20
5.70
6.20
6.70
7.20
Price Close Relative to S&P/ASX 200 (RHS)
Source: Bloomberg
5
10
15
Aug-18 Nov-18 Mar-19 Jun-19
Vo
l m
7

Financial Services - Others│Australia│Equity research│August 30, 2019
IMPORTANT DISCLOSURES REGARDING COMPANIES THAT ARE THE SUBJECT OF THIS REPORT AND AN EXPLANATION OF RECOMMENDATIONS CAN BE FOUND AT THE END OF THIS DOCUMENT. MORGANS FINANCIAL LIMITED (ABN 49 010 669 726) AFSL 235410 - A PARTICIPANT OF ASX GROUP
Powered by EFA
Generation Development Group
A good base set for further growth
GDG reported an FY19 underlying NPAT of A$2.3m (+48% on pcp) in line with our forecast, with evidence of rising leverage a result highlight in our view.
Outlook commentary points to a strong start to FY20 including a record July sales number.
We make relatively small changes to our GDG forecasts adjusting FY20F/FY21F EPS by +/-1%/2%. Our PT is unchanged at A$0.83.
Trading on 18x our FY20F EPS, we see GDG as undervalued versus its medium-term growth profile. ADD maintained.
Result summary GDG reported an FY19 underlying NPAT of A$2.3m (+48% on pcp), in line with our forecast. FUM (A$1.07bn) was up 21% on pcp supported by positive net flows of A$137m and favourable market movements. A final dividend of 1cps was announced (in-line with MorgansE) taking the full year dividend to 2cps. The outlook commentary was positive, pointing to strong initial sales in FY20, with expense growth this year also forecast to be lower than pcp (despite GDG continuing to invest in the business).
The good 1) Underlying NPAT (A$2.3m) growth of ~50% on pcp was a solid performance, in our view, given a difficult FY19 operating environment (e.g. a federal election, disruption in adviser channels, etc); 2) GDG has seen a strong start to FY20, noting July sales were the highest on record, with an improving sales pipeline seen for the rest of this calendar year; 3) FUM grew by 20% on pcp (+A186m), with GDG total FUM now above A$1bn; 4) Active Advisers numbers (928) rose 21% on pcp pointing to increased penetration in this key distribution channel; 5) Jaws improved from 1.2x to 1.8x yoy showing rising leverage post the company cycling the higher cost base of ‘Project Clearwater’; and 6) A ~A$5m gain (A$4m in cash) was booked on the initial Ascalon investment, which will be used to launch the Ascalon Growth Catalyst Fund in Asia.
Where we are cautious 1) FY19 sales (A$224m) were down 2% on pcp, and while initial FY20 sales momentum seems positive, we retain some caution on sales growth trends given recent market headwinds; 2) Life fee income margins appear to have fallen in 2H19 (3-4bps MorgansE), likely reflecting some increased competition; and 3) The Ascalon Asia fund remains a higher risk venture, with success susceptible to a range of swing factors like market corrections and global macro conditions.
Investment view We make relatively small changes to our GDG forecasts adjusting FY20F/FY21F EPS by +/-1%/2. Our PT is unchanged at A$0.83. Management continues to execute well and we see GDG as in a strong position to deliver a compound earnings growth story over time. Trading on 18x FY20F EPS, we see GDG as undervalued versus its medium-term growth profile. ADD maintained.
SOURCE: MORGANS, COMPANY REPORTS
▎Australia
ADD (no change) Current price: A$0.50
Target price: A$0.83
Previous target: A$0.83
Up/downside: 65.3%
Reuters: GDG.AX
Bloomberg: GDG AU
Market cap: US$42.25m
A$62.64m
Average daily turnover: US$0.02m
A$0.02m
Current shares o/s 124.7m
Free float: 100.0%
Price performance 1M 3M 12M
Absolute (%) -1 -13.1 -56.9
Relative (%) 2.5 -16.4 -60.9
Richard COLES
T (61) 2 9043 7911
Steven SASSINE, CFA
T (61) 2 9043 7905
Analyst(s) own shares in the following stock(s) mentioned in this report:
– Generation Development Group
Financial Summary FY18A FY19A FY20F FY21F FY22F
Revenue (A$m) 10.0 12.1 14.1 15.9 17.7
Expenses (A$m) -11.5 -13.1 -14.8 -16.2 -17.6
Life management fund benefit (A$m) 3.1 3.2 3.7 4.1 4.4
Net Profit (A$m) 1.5 2.3 3.0 3.7 4.5
Normalised EPS (cps) 1.5 2.1 2.8 3.3 3.9
Normalised EPS Growth 55% 48% 29% 18% 17%
FD Normalised P/E (x) 34.4 23.3 18.0 15.2 12.9
DPS (cps) 2.0 2.0 2.0 1.5 1.7
Dividend Yield 4.0% 4.0% 4.0% 3.0% 3.5%
P/BV (x) 3.7 3.1 3.0 2.7 2.4
ROE (%) 11% 13% 16% 18% 19%
24
42
60
78
96
114
0.30
0.50
0.70
0.90
1.10
1.30
Price Close Relative to S&P/ASX 200 (RHS)
Source: Bloomberg
1
1
2
2
3
Aug-18 Nov-18 Mar-19 Jun-19
Vo
l m
8

Energy Infrastructure│Australia│Equity research│August 30, 2019
IMPORTANT DISCLOSURES REGARDING COMPANIES THAT ARE THE SUBJECT OF THIS REPORT AND AN EXPLANATION OF RECOMMENDATIONS CAN BE FOUND AT THE END OF THIS DOCUMENT. MORGANS FINANCIAL LIMITED (ABN 49 010 669 726) AFSL 235410 - A PARTICIPANT OF ASX GROUP
Powered by EFA
Genex Power
Solar not as bright but K2H is getting closer
GNX generated positive EBITDA for the first time in FY19 but FY19 results weren’t as strong as we hoped (NPAT -$1.2m on our forecast). Output from the KS1 solar farm was less than forecast but this was offset by an R&D refund and liquidated damages from the KS1’s contractor.
We’ve reduced our estimated value of KS1 by 3cps due to output restrictions and costs from ancillary services charged by the market operator (AEMO).
We’ve also increased our capex forecast for K2H by 5% to $287.5m (GNX share) which lowers our value estimate by 3cps.
SPECULATIVE BUY rating maintained and our price target is reduced to 30cps which offers 30% upside to current prices.
GNX began generating EBITDA in FY19 but result a miss overall EBITDA was up by $7.1m on the back of a full year’s production to generate $5.6m compared to -$1.7m in FY18. Frequency Control and Ancillary Services (FCAS) fees charged by AEMO reduced revenue more than we thought (these charges are netted off revenue in the accounts) and output was lower. There was an R&D refund ($1.9m) and liquidated damages ($2.4m) recovered from UGL which offset the misses so revenue was in line with our forecast but these items are one-offs. Net profit after tax was worse than we thought (-$5.5m vs -$3.3m) though, partly as a result of GNX not recognising tax assets from its FY19 loss.
KS1 missed our forecast but we expect FY20 will be higher KS1’s energy output is less than we’d forecast and its registered maximum capacity has been reduced to 47.7MW. Over FY19, KS1 produced 126.8GWh of energy which is less than our forecast of 144.5GWh. Output from KS1 was lower in 2H19 than the first half (see Figure 3). Weather issues from North Queensland’s wet season, including Cyclone Owen, affected the January to March quarter and then network issues curtailed output in the following quarter but these issues have been resolved. We have reduced our FY20 output forecast to 133.9GWh to allow for potential uncertainty in volumes.
Pumped hydro capex forecast increased We understand there have been some design changes to the K2H project that could increase the capital cost of the project. GNX hasn’t released its costings but we’ve increased our estimate by 5% to $287.5m (GNX share) to allow for it. This has reduced our estimated value of K2H by 3cps. We don’t expect further increases to the project’s cost as we understand that GNX has a fixed price agreement with its contractors which, without any further scope changes, will keep costs stable.
Upside potential as K2H gets closer Despite the downward revisions to our forecast the recent share price weakness offers substantial upside potential. There are two significant conditions outstanding for K2H: a transmission line agreement with the Queensland Government owned Powerlink and a binding offtake agreement with EnergyAustralia. GNX expects both of these items will be resolved in the next six months which we think will trigger a significant rerate upwards. We maintain our SPECULATIVE BUY rating and reduce our target price to 30cps with a potential 30% upside to the current price.
SOURCE: MORGANS, COMPANY REPORTS
▎Australia
SPECULATIVE BUY (no change) Current price: A$0.23
Target price: A$0.30
Previous target: A$0.36
Up/downside: 30.4%
Reuters: GNX.AX
Bloomberg: GNX AU
Market cap: US$62.33m
A$92.42m
Average daily turnover: US$0.09m
A$0.13m
Current shares o/s 312.4m
Free float: 69.3%
Key changes in this note
FY20F revenue down by 11%.
KS1 maximum output down to 47.7MW.
K2H SPV capex up by 5%.
Price performance 1M 3M 12M
Absolute (%) -11.5 0 -19.3
Relative (%) -6.8 -1 -21.7
Max VICKERSON, CFA
T +61 7 3334 4804
Analyst(s) own shares in the following stock(s) mentioned in this report:
– Genex Power
Financial Summary Jun-18A Jun-19A Jun-20F Jun-21F Jun-22F
Revenue (A$m) 8.27 10.82 18.58 24.39 23.86
Operating EBITDA (A$m) -1.72 5.59 15.18 20.31 19.71
Net Profit (A$m) -7.46 -5.48 12.06 4.02 2.37
Normalised EPS (A$) (0.025) (0.018) 0.044 0.012 0.007
Normalised EPS Growth (33.3%) (28.8%) (72.2%) (41.2%)
FD Normalised P/E (x) NA NA 5.21 18.70 31.81
DPS (A$) - - - - 0.004
Dividend Yield 0.00% 0.00% 0.00% 0.00% 1.65%
EV/EBITDA (x) NA 30.62 18.64 14.45 14.28
P/FCFE (x) NA NA NA 27.08 15.59
Net Gearing 596% 1187% 288% 262% 243%
P/BV (x) 4.57 8.51 1.60 1.51 1.50
ROE (43.3%) (46.2%) 45.7% 8.3% 4.7%
% Change In Normalised EPS Estimates (6.5%) (15.4%) (68.3%)
Normalised EPS/consensus EPS (x) 6.31 -2.05 0.36
60.0
68.6
77.1
85.7
94.3
102.9
111.4
120.0
0.180
0.200
0.220
0.240
0.260
0.280
0.300
0.320
Price Close Relative to S&P/ASX 200 (RHS)
Source: Bloomberg
1
2
3
4
Aug-18 Nov-18 Mar-19 Jun-19
Vo
l m
9

Biotechnology│Australia│Equity research│August 30, 2019
IMPORTANT DISCLOSURES REGARDING COMPANIES THAT ARE THE SUBJECT OF THIS REPORT AND AN EXPLANATION OF RECOMMENDATIONS CAN BE FOUND AT THE END OF THIS DOCUMENT. MORGANS FINANCIAL LIMITED (ABN 49 010 669 726) AFSL 235410 - A PARTICIPANT OF ASX GROUP
Powered by EFA
Micro-X
Future is looking brighter
MX1 posted its FY19 result which was slightly better than our expectations.
MX1 recently entered into a strategic alliance with French base defence and security company Thales. As part of the alliance a A$10m convertible note was invested into MX1 with funds being used to develop an airport checkpoint security system.
The MX1 technology has applications in other areas including military medical facilities and brain imaging for stroke.
We have made modest changes to our sales forecasts in FY20/21 with only modest NPAT changes in FY21 resulting. Our target price remains unchanged.
We maintain our Speculative Buy for investors with a higher risk profile.
FY19 result was slightly better than expected MX1 posted a FY19 net loss of A$9.8m (Morgans: net loss A$11.6M). Revenue of A$1.9m (sales to Carestream of the DRX-Revolution Nano) and R&D tax incentive was A$3.1m which was in line with our forecasts. The main cost items were project costs of A$4.8m (Morgans A$7.3m) and salaries and wages A$5.1m (Morgans: A$4.5m). Net cash outflow was A$7.1m (pcp: A$7.8m). MX1 finished the year with A$1.6m in cash and borrowings A$6.0m.
Pipeline looks promising and major strategic alliance Subsequent to year end MX1 announced an alliance with leading aerospace, defence and security company Thales Group SA. Thales has completed a A$10m investment by way of a convertible note. MX1 and Thales will jointly design and manufacture a new range of ultra-miniature x-ray tubes. These products potentially will be used for the security market for a new high spend airport checkpoint security system. Other products in development include; 1) Rover Mobile X-ray for deployment in military medical facilities; 2) counter-terrorism applications; and 3) brain tomographic imaging for stroke.
Modest changes to forecasts We have made modest changes to our sales projections for the Nano to A$9.9m (from A$11.8m) and to A$40.7m (from A$48.6m) for FY20/21 respectively. This reflects a more conservative stance as we wait for more evidence of a sustainable run rate. Our cost base has also been trimmed reflecting a lower project spend than previously forecast. As a result of the changes our FY20 forecast remains unchanged and our FY21 NPAT forecast is reduced to A$2.3m (was A$4.6m).
Investment view – Speculative buy maintained Following the minor changes to forecasts and rolling forward our model , the DCF derived valuation remains unchanged at A$0.47m. We have se the target price at the same level. The key risk is slower-than-expected Nano sales. We maintain our Speculative Buy recommendation for investors with a higher risk profile.
SOURCE: MORGANS, COMPANY REPORTS
▎Australia
SPECULATIVE BUY (no change) Current price: A$0.34
Target price: A$0.47
Previous target: A$0.47
Up/downside: 38.2%
Reuters: MX1.AX
Bloomberg: MX1 AU
Market cap: US$37.65m
A$55.82m
Average daily turnover: US$0.08m
A$0.11m
Current shares o/s 144.4m
Free float: 80.0%
Key changes in this note
FY20F revenue down by16.4%.
FY20F EBITDA up by 8.1%.
FY20F Net loss no change.
Price performance 1M 3M 12M
Absolute (%) 1.5 19.3 -2.9
Relative (%) 6.2 18.3 -5.3
Scott POWER
T (61) 7 3334 4884
Dr Derek JELLINEK
T (61) 2 9043 7904
Analyst(s) own shares in the following stock(s) mentioned in this report:
– N/A
Financial Summary Jun-18A Jun-19A Jun-20F Jun-21F Jun-22F
Revenue (A$m) 1.61 1.93 9.87 40.67 82.00
Operating EBITDA (A$m) -9.20 -8.59 -9.65 3.56 19.79
Net Profit (A$m) -16.59 -9.82 -10.66 2.29 18.47
Normalised EPS (A$) -0.11 -0.06 -0.06 0.01 0.10
Normalised EPS Growth 34% (45%) (9%) 706%
FD Normalised P/E (x) NA NA NA 27.60 3.42
DPS (A$) - - - - -
Dividend Yield 0% 0% 0% 0% 0%
EV/EBITDA (x) NA NA NA 19.71 3.25
P/FCFE (x) NA NA NA NA 10.84
Net Gearing (761%) (215%) (140%) (820%) 6%
P/BV (x) NA NA NA NA 3.59
ROE (227%) 530% 349% (115%) 220%
% Change In Normalised EPS Estimates 6.2% (52.9%)
Normalised EPS/consensus EPS (x) 0.94 0.47
46
64
82
100
118
136
0.180
0.230
0.280
0.330
0.380
0.430
Price Close Relative to S&P/ASX 200 (RHS)
Source: Bloomberg
1
1
2
2
Aug-18 Nov-18 Mar-19 Jun-19
Vo
l m
10

Services - Overall│Australia│Equity research│August 30, 2019
IMPORTANT DISCLOSURES REGARDING COMPANIES THAT ARE THE SUBJECT OF THIS REPORT AND AN EXPLANATION OF RECOMMENDATIONS CAN BE FOUND AT THE END OF THIS DOCUMENT. MORGANS FINANCIAL LIMITED (ABN 49 010 669 726) AFSL 235410 - A PARTICIPANT OF ASX GROUP
Powered by EFA
People Infrastructure
Industry tailwinds to drive growth
It was another quality result from PPE with the FY19 result coming in-line with our expectations and slightly ahead of Factset consensus at the NPATA line. The final dividend of 4.5cps (fully franked) was ahead of our forecast and a nice surprise for investors.
With strong industry tailwinds and scope for further acquisition in time we continue to like PPE’s earnings growth profile. No formal guidance was provided but the company commented that it expects continued organic growth across the business and expects the recent acquisitions to drive further upside.
With an increased price target of A$3.83/share offering 11% upside from the intra-day price of A$3.45, we retain an Add rating on the stock.
A quick recap of the result PPE reported strong revenue growth of 27% to A$278 which was in-line with our forecast of A$280m. EBITDA of A$17.8m was up 42.8% on the pcp and again in-line with our forecast of A$17.9m and the EBITDA margin increased from 5.7% to 6.4%. NPATA of A$12.1m was an increase of 55% on the pcp and in-line with our forecast. The company reported strong operating cash flow of A$10.9m which saw debt come in at A$19.4m, better than our forecast while the ND/EBITDA ratio sits at 1.1x. A final dividend of 4.5cps (fully franked) was ahead of expectations and is a good sign of confidence in the outlook for the business.
Strong industry tailwinds remain PPE’s pro-forma FY20 estimated profit by industry is heavily skewed to Healthcare and Social Services (49%) and Information Technology (20%). These are defensive and fast growing industries and should result in growth well above GDP. PPE should be a significant beneficiary from the continued roll-out of the National Disability Insurance Scheme (NDIS) given the company’s position in the market.
Only minor changes to forecasts Following the result we have made only very minor changes to our forecasts which have resulted in NPATA across FY20, FY21 and FY22 rising by 0.7%, 0.6% and 1.1% respectively. Our DPS forecast for FY20 has increased 1cps to 13c while our forecasts of 14cps and 16cps for FY21 and FY22 remain unchanged.
Retaining an Add rating We value PPE using a blended PE multiple (15x, up from 14x given the continued solid delivery by the company) and a DCF. Following changes to the PE and minor earnings changes, our target price has increased to A$3.83/share from A$3.67/share. Add retained. Key risks include overall employment markets and general economic conditions, variations in legislation and government policies, loss of key customers, customer safety and integration risk.
SOURCE: MORGANS, COMPANY REPORTS
▎Australia
ADD (no change) Current price: A$3.45
Target price: A$3.83
Previous target: A$3.67
Up/downside: 11.0%
Reuters: PPE.AX
Bloomberg: PPE AU
Market cap: US$174m
A$250m
Average daily turnover: US$0.43m
A$0.62m
Current shares o/s 72.40m
Free float: 80.0%
Price performance 1M 3M 12M
Absolute (%) -5.7 16.1 54.6
Relative (%) -0.9 15.2 51.5
James LAWRENCE
T (61) 7 3334 4547
Analyst(s) own shares in the following stock(s) mentioned in this report:
– N/A
Financial Summary Jun-18A Jun-19A Jun-20F Jun-21F Jun-22F
Revenue (A$m) 218.6 278.2 363.5 391.0 420.5
Operating EBITDA (A$m) 11.7 17.8 27.5 29.8 32.3
Net Profit (A$m) 8.5 12.1 17.8 19.9 22.0
Normalised EPS (A$) 0.13 0.18 0.25 0.27 0.30
Normalised EPS Growth (28.8%) 33.1% 39.6% 11.7% 10.8%
FD Normalised P/E (x) 26.07 19.58 14.02 12.56 11.34
DPS (A$) 0.04 0.09 0.13 0.14 0.16
Dividend Yield 1.16% 2.46% 3.77% 4.06% 4.64%
EV/EBITDA (x) 22.03 15.14 9.56 8.54 7.61
P/FCFE (x) 6.4 47.9 9.7 8.7 9.7
Net Gearing 17.8% 28.6% 17.7% 5.7% (4.9%)
P/BV (x) 5.18 3.67 3.36 3.05 2.77
ROE 21.4% 21.7% 25.0% 25.5% 25.6%
0
1
2
3
4
5
6
7
8
9
1.50
2.00
2.50
3.00
3.50
4.00
4.50
Aug-18 Oct-18 Dec-18 Feb-19 Apr-19 Jun-19 Aug-19
11

Auto & Parts - Overall│Australia│Equity research│August 30, 2019
IMPORTANT DISCLOSURES REGARDING COMPANIES THAT ARE THE SUBJECT OF THIS REPORT AND AN EXPLANATION OF RECOMMENDATIONS CAN BE FOUND AT THE END OF THIS DOCUMENT. MORGANS FINANCIAL LIMITED (ABN 49 010 669 726) AFSL 235410 - A PARTICIPANT OF ASX GROUP
Powered by EFA
PWR Holdings Limited
Pole position
PWH’s FY19 result was broadly in line with expectations.
The result was underpinned by 26% revenue growth (GBP sales +40%, AUD sales +17%, USD sales -7%) primarily driven by new products, growth in motorsports and OEM.
We increase FY20F underlying EBITDA by 2% to A$25.3m while underlying NPAT remains broadly unchanged at A$16.7m.
Maintain Add rating on a higher A$5.30 target price (from A$4.83).
Solid FY19 result PWH reported earnings growth that was broadly in line with Morgans and consensus forecasts. FY19 underlying EBITDA rose 24% to A$21.8m (+4% vs Morgans and +3% vs consensus) while underlying NPAT grew 17% to A$14.2m (+1% vs Morgans and +1% vs consensus). Revenue climbed 26% and was primarily driven by new products, growth in motorsports and OEM. Europe was the again the standout performer with GBP revenue up 40%, while AUD revenue increased 17% and USD revenue was down 7%. The drop in USD revenue was due to FY18 including the discontinued C&R South business. Excluding C&R South, USD revenue was flat.
3.0cps special dividend was a positive surprise One of the key positive surprises from the result was the announcement of a 3.0cps special dividend. This brings total FY19 DPS to 11.5cps, which was comfortably above ours (8.2cps) and consensus (8.5cps) expectations. The dividend is supported by a very healthy balance sheet, with FY19 net cash of A$16.6m (FY18 net cash: A$11.6m). Operating cash flow was strong, up 35% to A$22.4m due mainly to improved working capital management. Cash conversion was high at 103% (FY18: 97%) while ROE (as reported) increased to 27% (FY18: 24%). We believe PWH continues to perform well on all key financial metrics.
Still plenty in the pipeline As expected, PWH did not give formal outlook guidance. However, management said FY20 and FY21 look positive. We expect earnings growth over the next few years to be driven by motorsports and increasing revenue from OEM contracts. While OEM delivered strong growth in FY19 (revenue +55%), we expect the segment’s contribution to ramp up in FY20 as more programs come on line. With PWR’s strong reputation, there remains potential for further contract wins. Overall, we forecast FY20 underlying NPAT to be up 18% to A$16.7m.
Maintain Add rating We continue to view PWH as a high-quality business with a clear focus on high-end cooling solutions. With another strong result, we have increased confidence in the medium-term growth outlook with management continuing to execute well. We therefore maintain our Add rating with our equally-blended (DCF, EV/EBITDA, PE) target price rising to A$5.30 (from A$4.82).
SOURCE: MORGANS, COMPANY REPORTS
▎Australia
ADD (no change) Current price: A$4.77
Target price: A$5.30
Previous target: A$4.83
Up/downside: 11.2%
Reuters: PWH.AX
Bloomberg: PWH AU
Market cap: US$321.7m
A$477.0m
Average daily turnover: US$0.59m
A$0.86m
Current shares o/s 100.00m
Free float: 54.5%
Key changes in this note
FY20F EBITDA up by 2%.
FY20F NPAT broadly unchanged.
Price performance 1M 3M 12M
Absolute (%) 10.2 15.8 47.7
Relative (%) 13.7 12.5 43.7
Alexander LU, CFA
T (61) 2 9043 7901
Analyst(s) own shares in the following stock(s) mentioned in this report:
– PWR Holdings Limited
Financial Summary Jun-18A Jun-19A Jun-20F Jun-21F Jun-22F
Revenue (A$m) 51.89 65.41 75.88 87.09 95.44
Operating EBITDA (A$m) 17.61 21.76 25.27 29.09 31.96
Net Profit (A$m) 12.12 14.21 16.74 19.42 21.39
Normalised EPS (A$) 0.12 0.14 0.17 0.19 0.21
Normalised EPS Growth 30.0% 17.3% 17.8% 16.0% 10.1%
FD Normalised P/E (x) 39.37 33.58 28.50 24.56 22.31
DPS (A$) 0.07 0.12 0.10 0.12 0.13
Dividend Yield 1.53% 2.41% 2.10% 2.45% 2.68%
EV/EBITDA (x) 26.43 21.16 18.16 15.65 14.09
P/FCFE (x) 53.96 29.86 44.05 32.71 28.09
Net Gearing (25.0%) (31.3%) (28.4%) (30.3%) (32.8%)
P/BV (x) 10.26 9.00 7.47 6.60 5.87
ROE 27.7% 28.6% 28.6% 28.5% 27.9%
% Change In Normalised EPS Estimates (0.201%) (0.398%) 0.457%
Normalised EPS/consensus EPS (x) 0.99 0.96 1.02
95.0
107.0
119.0
131.0
143.0
155.0
2.80
3.30
3.80
4.30
4.80
5.30
Price Close Relative to S&P/ASX 200 (RHS)
Source: Bloomberg
2
4
6
Aug-18 Nov-18 Mar-19 Jun-19
Vo
l m
12

Company Note Autos │ Hong Kong │ August 30, 2019
IMPORTANT DISCLOSURES, INCLUDING ANY REQUIRED RESEARCH CERTIFICATIONS, ARE PROVIDED AT THE END OF THIS REPORT. IF THIS REPORT IS DISTRIBUTED IN THE UNITED STATES IT IS DISTRIBUTED BY CGS-CIMB SECURITIES (USA), INC. AND IS CONSIDERED THIRD-PARTY AFFILIATED RESEARCH.
Powered by the EFA Platform
Insert Insert
Guangzhou Automobile Group Own brand drags
■ 1H19 net profit of Rmb4.9bn (-29% yoy) formed 40% of our full-year forecast, mainly due to weakness in GAC’s own brand models.
■ Own brand vehicle sales fell 30% yoy, while gross profit fell 72% yoy due to heavy discounting to the channel.
■ Maintain Reduce, with a lower target price based on 6x FY19F P/E, near 1 standard deviation below historical average.
1H19 weak due to deterioration in own brand car sales 1H19 net profit declined 29% yoy to RMB4.9bn with revenue falling by 24% yoy. Overall
gross profit margins declined from 19.5% in 1H18 to 7.2% in 1H19, with gross profit
falling by 72% yoy. Revenue was weak mainly due to a 30% yoy decline in sales for
GAC’s own brand vehicles (GAMC) due to continued weakness in China’s SUV segment
coupled with an ageing product line and lack of new exciting models for the Trumpchi
SUV segment leading to market share loss. As a group, GAC’s SUV sales declined 22%
in 1H19 vs. 13% decline for the SUV sector in China. We also believe GAC cut
production of SUVs in order to manage inventory at the dealer level.
Major joint ventures doing well but profits flat One positive note is that GAC Honda and GAC Toyota saw sales volume increase 16%
and 22% respectively in 1H19. Meanwhile, GAC Fiat Chrysler and GAC Mitsubishi saw
1H19 volume fall by 49% and 16% respectively. Overall, 1H19 JV/associate income was
RMB4.9bn (-1.5% yoy) which we believe reflects dealer discounting in the channel.
Despite 9% unit sales growth from JV brands, JV net margin fell by 1.5% pts. yoy. Strong
Toyota and Honda sales were driven by the 8th generation Camry and 10
th generation
Accord. GAC will expand the production facilities of GAC Toyota/GAC Honda this year,
which will increase production by roughly 100k/240k vs.480k/600k currently.
NEV outlook weak GAC’s new energy vehicle volume reached 10k units in 1H19 (+73% yoy) which
comprised 5% of total own brand volume, below key local competitors Geely and Great
Wall Motor. We expect GAC’s NEV car sales to slow in 2H19 due to government subsidy
cuts for NEVs. Overall, we forecast that GAC’s own brand models will continue to see a
30% sales decline this year in addition to dealer discounts due to ageing models.
Maintain non-consensus Reduce We reduce our EPS forecasts for FY19-21F by 12-18% due to lower shipment
assumptions for GAMC vehicles, coupled with lower gross margins. Our target price
remains based on 6x FY19F P/E, near 2 standard deviations below the stock’s historical
8-year trading period. On a consensus basis, the stock has traded between 4.6x to 7x
this year. Another downside risk to the share price is possible announcements by Toyota
or Honda to increase their stake in the GAC JV which would hurt JV/associate income.
Upside risks to our target price is a turnaround in GAMC shipments.
SOURCES: CGS-CIMB RESEARCH, COMPANY REPORTS
Hong Kong
REDUCE (no change)
Consensus ratings*: Buy 26 Hold 6 Sell 3
Current price: HK$7.90
Target price: HK$6.50
Previous target: HK$7.93
Up/downside: -17.7%
CGS-CIMB / Consensus: -33.4%
Reuters: 2238.HK
Bloomberg: 2238 HK
Market cap: US$14,834m
HK$116,395m
Average daily turnover: US$23.96m
HK$188.7m
Current shares o/s: 10,217m
Free float: 30.3% *Source: Bloomberg
Key changes in this note
FY19F EPS reduced by 18%
FY20F EPS reduced by 14%
FY21F EPS reduced by 12%
Source: Bloomberg
Price performance 1M 3M 12M Absolute (%) -4.9 3 -5.5
Relative (%) 3.7 8.1 3.2
Major shareholders % held Guangzhou Automobile Group 53.8 BlackRock Inc 7.0 CitiGroup Inc 6.1
Insert
Analyst(s)
Michael TING
T (852) 2532 1121 E [email protected]
Financial Summary Dec-17A Dec-18A Dec-19F Dec-20F Dec-21F
Revenue (Rmbm) 71,575 72,380 54,714 60,049 63,316
Operating EBITDA (Rmbm) 5,923 5,000 750 1,423 2,134
Net Profit (Rmbm) 11,005 10,900 10,064 11,303 12,599
Normalised EPS (Rmb) 1.68 1.07 0.98 1.11 1.23
Normalised EPS Growth 72.0% (36.5%) (7.7%) 12.3% 11.5%
FD Normalised P/E (x) 4.37 6.74 7.30 6.50 5.83
DPS (Rmb) 0.58 0.38 0.30 0.33 0.37
Dividend Yield 8.04% 5.29% 4.11% 4.61% 5.14%
EV/EBITDA (x) 1.62 9.08 61.84 33.59 23.12
P/FCFE (x) 4.11 NA 26.05 22.87 19.65
Net Gearing (54.7%) (37.8%) (33.4%) (28.0%) (23.4%)
P/BV (x) 0.68 0.96 0.87 0.77 0.68
ROE 19.4% 14.9% 12.5% 12.6% 12.4%
% Change In Normalised EPS Estimates (18.1%) (14.4%) (11.9%)
Normalised EPS/consensus EPS (x) 0.94 0.95 0.99
83.0
94.3
105.5
116.8
128.0
6.60
7.60
8.60
9.60
10.60
Price Close Relative to HSI (RHS)
50
100
150
Aug-18 Nov-18 Mar-19 Jun-19
Vo
l m
13

Company Note Food & Beverages │ Hong Kong │ August 30, 2019
IMPORTANT DISCLOSURES, INCLUDING ANY REQUIRED RESEARCH CERTIFICATIONS, ARE PROVIDED AT THE END OF THIS REPORT. IF THIS REPORT IS DISTRIBUTED IN THE UNITED STATES IT IS DISTRIBUTED BY CGS-CIMB SECURITIES (USA), INC. AND IS CONSIDERED THIRD-PARTY AFFILIATED RESEARCH.
Powered by the EFA Platform
Insert Insert
Nissin Foods Co Ltd Expect further margin expansion in China
■ NF’s 1H19 net profit jumped 41% yoy, supported by improved profitability in China and HK operations.
■ We are positive on 2H19F outlook due to solid revenue growth, stabilised material costs, improved product mix and continual efficiency improvements.
■ Maintain Add. Target price of HK$7.59 is based on 20x ex-cash FY20F P/E.
Robust 1H19 results due to improved profitability Nissin Foods' (NF) 1H19 net profit jumped 41% yoy to HK$133m, mainly driven by 2.1%
pts gross profit margin expansion, thanks to 1) improved profitability in Nissin brands and
MCMS, its distribution unit, and positive contribution from Kagome beverage products in
HK, and 2) lowered value added tax, tightened cost control and improved efficiency in
distribution channels. Revenue edged up 1% yoy to HK$1.5bn, mainly dragged down by
HK operations which fell 5% yoy while China operations rose 6% yoy.
Room for further margin expansion in China operations China operations revenue rose 6% yoy to HK$872m in 1H19 (12% yoy in terms of Rmb),
thanks to robust volume growth of Cup Noodles and Damae Iccho and deeper channel
expansion to Eastern China (Shanghai, Zhejiang and Jiangsu). Operating profit surged
42% yoy to HK$99m while operating margin (OPM) expanded by 2.9% pts to 11.4%,
driven by lower VAT, stabilised depreciation and reduced costs in distribution channels.
We expect revenue growth momentum to continue due to 1) market share gains in
Eastern and Northern China, and 2) new product offerings such as the recently launched
spicy Mongolia-series and non-fried instant noodles. We also expect further OPM
enhancement due to VAT benefit and improved product mix.
Promising outlook in HK operations HK operations revenue fell 5% yoy to HK$626m in 1H19 due to termination of low-margin
products in MCMS (distribution unit) while sales of Cup Noodles and Damae Iccho
remained steady. Operating profit rose 12% yoy to HK$59m while OPM widened by 1.4%
pts to 9.4%, thanks to improved profitability in distribution business. We expect instant
noodles demand to remain solid, underpinned by stable market share, introduction of
new products and continuous category expansion. We expect strong OPM expansion in
2H19F due to high-single digit ex-factory price hike and stable material costs.
Maintain Add with a target price of HK$7.59 We retain our Add call on NF as it will benefit from the instant noodles premiumisation
trend in China. Our earnings forecasts are intact as we deem 1H19 net profit as in line at
52% of our FY19F forecast because we factor in weaker HK sales in 2H19F due to
persistent protests. Our target price of HK$7.59 is based on 20x ex-cash FY20F P/E (net
cash on hand at Jun 19: HK$2.05bn, or HK$1.91/share), on par with its key competitor
Tingyi (322 HK, Not Rated). Share price catalyst is continual market share gains in
China. Downside risks are food safety issues and the return of anti-Japanese sentiment.
SOURCES: CGS-CIMB RESEARCH, COMPANY REPORTS
Hong Kong
ADD (no change)
Consensus ratings*: Buy 9 Hold 0 Sell 0
Current price: HK$6.30
Target price: HK$7.59
Previous target: HK$7.59
Up/downside: 20.5%
CGS-CIMB / Consensus: 16.5%
Reuters: 1475.HK
Bloomberg: 1475 HK
Market cap: US$862.6m
HK$6,768m
Average daily turnover: US$3.76m
HK$29.59m
Current shares o/s: 1,074m
Free float: 30.0% *Source: Bloomberg
Key changes in this note
No change.
Source: Bloomberg
Price performance 1M 3M 12M Absolute (%) 14.5 37.6 77.5
Relative (%) 23.1 42.7 86.2
Major shareholders % held Nissin Foods Holdings Co., Ltd 70.0 Yeo Hiap Seng Ltd 1.5 Kagome Co., Ltd 1.2
Insert
Analyst
Ray KWOK
T (852) 2532 1113 E [email protected]
Financial Summary Dec-17A Dec-18A Dec-19F Dec-20F Dec-21F
Revenue (HK$m) 2,689 2,999 3,207 3,604 3,980
Operating EBITDA (HK$m) 290.7 284.3 339.4 407.5 476.0
Net Profit (HK$m) 195.4 205.4 257.9 303.9 348.8
Normalised EPS (HK$) 0.19 0.20 0.24 0.28 0.32
Normalised EPS Growth 3.3% 4.5% 22.0% 17.8% 14.8%
FD Normalised P/E (x) 33.48 32.02 26.24 22.27 19.40
DPS (HK$) 0.07 0.10 0.12 0.14 0.16
Dividend Yield 1.16% 1.51% 1.91% 2.25% 2.58%
EV/EBITDA (x) 16.41 16.89 14.14 11.71 9.90
P/FCFE (x) 160.4 NA 64.7 43.3 32.1
Net Gearing (59.4%) (57.8%) (54.0%) (50.9%) (48.6%)
P/BV (x) 1.97 1.94 1.81 1.68 1.56
ROE 6.67% 6.11% 7.14% 7.82% 8.33%
Normalised EPS/consensus EPS (x) 1.03 1.05 1.05
86
117
148
179
210
2.80
3.80
4.80
5.80
6.80
Price Close Relative to HSI (RHS)
20
40
60
Aug-18 Nov-18 Mar-19 Jun-19
Vol m
14

Company Note Property Devt & Invt │ Hong Kong │ August 30, 2019
IMPORTANT DISCLOSURES, INCLUDING ANY REQUIRED RESEARCH CERTIFICATIONS, ARE PROVIDED AT THE END OF THIS REPORT. IF THIS REPORT IS DISTRIBUTED IN THE UNITED STATES IT IS DISTRIBUTED BY CGS-CIMB SECURITIES (USA), INC. AND IS CONSIDERED THIRD-PARTY AFFILIATED RESEARCH.
Powered by the EFA Platform
DOWNGRADE
Insert Insert
Sino Land Co Ltd Slowing sales, rising margin risk
■ Sino Land’s FY19 results were in line with our expectations. Dividends were however slightly disappointing.
■ We expect its contracted sales to slow down in FY20F, given a luxury-focused pipeline and fewer new units launched.
■ Given high land costs, upcoming launches have relatively low margin buffer. Downgrade to Hold on limited near-term catalysts with lower TP of HK$12.3.
FY19 results in line with our estimate Sino Land’s FY19 underlying profit dropped 58% yoy to HK$4.7bn, in line with our
estimate, mainly due to a large disposal gain in FY18 and minimal bookings in FY19.
Dividend growth milder than expected Sino Land declared a final DPS of HK$0.41 (FY18: HK$0.40), milder than our
expectation, especially given that it launched Grand Central, which generated c.HK$20bn
in proceeds. Management had previously guided for a steady and sustainable dividend
growth that is in line with its cash flow. Management explained that the relatively
conservative payout this round was to reflect the current uncertain economic and political
environment, and its dividend policy of a steadily-growing DPS remains unchanged.
Slower sales ahead with luxury-focused launch pipeline In FY19, it achieved a record HK$24bn contracted sales in HK, mainly due to the
successful launches of Grand Central and Mayfair By The Sea 8. It plans to launch three
new projects with a total of 302 units in FY20 (vs. new launch of 2,627 units in FY19).
Given the launch pipeline is more luxury-focused, buyers are also likely to adopt a wait-
and-see approach given the weak market sentiment. Hence, we expect its contracted
sales to drop significantly to HK$8bn in FY20.
Upcoming launches have a relatively low margin buffer Meanwhile, its upcoming launches are mainly sites acquired in 2017 with relatively high
land costs. We estimate development margins of 14-18% at prevailing market prices (see
fig 2), which does not provide a strong margin buffer in the event of a market downturn.
Net cash provides downside support As at Jun 2019, Sino Land had net cash of HK$34bn, equivalent to 44% of its market
cap. The strong financial position provides room for Sino Land to raise dividends or
perform share buyback in the future, which should cushion its share price downside.
Downgrade from Add to Hold on limited near-term catalysts We cut our FY19-20F EPS by 1-3% after updating the sales and completion schedule
and introduce our FY21F estimate. Our new TP of HK$12.3 is based on a wider 50%
discount to NAV (from 45%). Downgrade from Add to Hold. Upside risk: stronger-than-
expected response in upcoming launches. Downside risk: a slowdown in HK economy.
SOURCES: CGS-CIMB RESEARCH, COMPANY REPORTS
Hong Kong
HOLD (previously ADD)
Consensus ratings*: Buy 12 Hold 3 Sell 1
Current price: HK$11.40
Target price: HK$12.30
Previous target: HK$14.00
Up/downside: 7.9%
CGS-CIMB / Consensus: -14.3%
Reuters: 0083.HK
Bloomberg: 83 HK
Market cap: US$9,904m
HK$77,714m
Average daily turnover: US$9.59m
HK$75.09m
Current shares o/s: 6,316m
Free float: 45.0% *Source: Bloomberg
Key changes in this note
FY20F EPS decreased by 1%
FY21F EPS decreased by 3%
Source: Bloomberg
Price performance 1M 3M 12M Absolute (%) -11.2 -11.5 -14
Relative (%) -2.6 -5.9 -4.4
Major shareholders % held Tsim Sha Tsui Properties 52.9
Insert
Analyst(s)
Raymond CHENG, CFA
T (852) 2539 1324 E [email protected]
Jeffrey MAK T (852) 2539 1328 E [email protected]
Will CHU T (852) 2539 1327 E [email protected]
Financial Summary Jun-18A Jun-19A Jun-20F Jun-21F Jun-22F
Total Net Revenues (HK$m) 10,730 8,010 7,479 32,670 18,927
Operating EBITDA (HK$m) 4,731 4,355 4,121 12,256 8,453
Net Profit (HK$m) 13,992 6,915 4,680 10,445 8,095
Core EPS (HK$) 1.75 0.74 0.74 1.65 1.28
Core EPS Growth 97% (58%) 0% 123% (22%)
FD Core P/E (x) 6.52 15.41 15.38 6.89 8.89
DPS (HK$) 0.53 0.55 0.56 0.58 0.59
Dividend Yield 4.65% 4.82% 4.91% 5.09% 5.18%
EV/EBITDA (x) 3.32 0.91 2.52 0.31 (1.01)
P/FCFE (x) NA 3.43 NA 9.78 5.87
Net Gearing (14.3%) (23.3%) (17.6%) (20.1%) (25.9%)
P/BV (x) 0.52 0.50 0.49 0.45 0.43
ROE 8.25% 3.28% 3.19% 6.80% 4.97%
% Change In Core EPS Estimates (0.55%) (3.36%)
CGS-CIMB/Consensus EPS (x) 0.94 1.05 0.99
90.0
100.0
110.0
120.0
10.00
12.00
14.00
16.00
Price Close Relative to HSI (RHS)
10
20
30
Aug-18 Nov-18 Mar-19 Jun-19
Vo
l m
15

Company Note Property Investment │ Hong Kong │ August 30, 2019
IMPORTANT DISCLOSURES, INCLUDING ANY REQUIRED RESEARCH CERTIFICATIONS, ARE PROVIDED AT THE END OF THIS REPORT. IF THIS REPORT IS DISTRIBUTED IN THE UNITED STATES IT IS DISTRIBUTED BY CGS-CIMB SECURITIES (USA), INC. AND IS CONSIDERED THIRD-PARTY AFFILIATED RESEARCH.
Powered by the EFA Platform
Insert Insert
SOHO China Challenging operating outlook
■ SOHO’s management expects a challenging outlook for Shanghai and Beijing office space despite its solid rental growth in 1H19.
■ In view of its net gearing, we think the potential asset disposal would not lead to meaningful DPS growth.
■ We maintain our Reduce call with a lower TP of HK$2.12.
1H19 core net profit slightly below estimate SOHO’s core net profit for 1H19 was Rmb150m (1H18: net loss of Rmb3m) but 12%
below our estimate, mainly due to higher interest expense and higher taxation. It did not
declare any interim dividend.
More challenging office markets in Shanghai and Beijing Excluding Sky SOHO whose disposal was completed in Apr 2018, rental income was up
7% yoy on a like-to-like basis to Rmb850m in 1H19. Its average occupancy (excluding
Gubei SOHO opened in Feb 19) stood at 94% at end-Jun, down 2% pts from end-Dec
18, mainly due to tenants surrendering office space in Beijing. We expect a more
challenging outlook ahead for Shanghai and Beijing office space, as China’s slowing
economic growth could lead to fewer leasing enquiries and slower rental growth.
Higher net finance cost ahead Its net finance cost rose 8% yoy due to a lower interest capitalisation ratio, arising from
the completion of Gubei SOHO. Following the scheduled opening of SOHO Leeza by the
end of 3Q19, we expect a further decrease in capitalised interest and therefore expect
higher net finance cost in FY19-21F compared to FY18.
Meaningful DPS growth unlikely despite potential asset disposal In late Jun, SOHO mentioned that it planned to dispose of some non-core assets, such
as office units in Wangjing SOHO and Galaxy SOHO, valued at Rmb7.8bn. Management
said discussions on the disposal are still in progress. In view of its net gearing of 43% at
end-Jun, which we consider high for an office landlord, meaningful DPS growth would be
unlikely even with confirmation of the asset disposal.
Capex plan for SOHO 3Q suspended In view of the competitive landscape that its co-working brand SOHO 3Q is facing,
management has suspended major capex for its 30k-seat portfolio. In our view, more
stringent cost control is important for achieving breakeven by end-FY19 or beyond.
Maintain Reduce with a lower TP of HK$2.12 We are cautious on its rental growth, 3Q’s earnings visibility and its DPS growth outlook.
We lower FY19-21F EPS by 5-10% after updating our assumptions on its rental growth.
We maintain our Reduce call with a lower TP of HK$2.12, based on a 55% discount
(widened from 50%) to NAV, due to a more challenging office market outlook. Potential
de-rating catalysts are slower economic growth in China and further depreciation of Rmb
vs. HK$. Key upside risks are improvement in office occupancy and higher DPS growth.
SOURCES: CGS-CIMB RESEARCH, COMPANY REPORTS
Hong Kong
REDUCE (no change)
Consensus ratings*: Buy 2 Hold 4 Sell 3
Current price: HK$2.30
Target price: HK$2.12
Previous target: HK$2.60
Up/downside: -8.0%
CGS-CIMB / Consensus: -32.4%
Reuters: 0410.HK
Bloomberg: 410 HK
Market cap: US$1,524m
HK$11,959m
Average daily turnover: US$0.93m
HK$7.35m
Current shares o/s: 5,200m
Free float: 36.1% *Source: Bloomberg
Key changes in this note
FY19-21F EPS decreased by 5-10%.
Source: Bloomberg
Price performance 1M 3M 12M Absolute (%) -10.5 -9.1 -26.8
Relative (%) -1.9 -4 -18.1
Major shareholders % held Pan Shiyi 63.9
Insert
Analyst(s)
Will CHU
T (852) 2539 1327 E [email protected]
Raymond CHENG, CFA T (852) 2539 1324 E [email protected]
Jeffrey MAK T (852) 2539 1328 E [email protected]
Financial Summary Dec-17A Dec-18A Dec-19F Dec-20F Dec-21F
Total Net Revenues (Rmbm) 1,963 1,721 2,104 2,523 2,697
Operating EBITDA (Rmbm) 1,082 1,008 1,190 1,403 1,502
Net Profit (Rmbm) (898.3) 364.5 413.1 502.3 559.8
Core EPS (Rmb) (0.17) 0.07 0.08 0.10 0.11
Core EPS Growth 115% 13% 22% 11%
FD Core P/E (x) NA 29.83 26.31 21.64 19.42
DPS (Rmb) 0.92 0.03 0.03 0.04 0.04
Dividend Yield 44.0% 1.4% 1.5% 1.9% 2.1%
EV/EBITDA (x) 26.76 26.84 22.76 19.38 18.23
P/FCFE (x) 1.6 NA 53.8 93.3 127.0
Net Gearing 50.6% 42.3% 41.8% 41.4% 41.3%
P/BV (x) 0.33 0.31 0.31 0.31 0.30
ROE (2.67%) 1.08% 1.18% 1.43% 1.58%
% Change In Core EPS Estimates (4.65%) (9.83%) (9.67%)
CGS-CIMB/Consensus EPS (x) 1.01 0.89 0.85
77.0
87.9
98.9
109.8
2.10
2.60
3.10
3.60
Price Close Relative to HSI (RHS)
10
20
30
Aug-18 Nov-18 Mar-19 Jun-19
Vo
l m
16

Company Note Semiconductor │ China │ August 30, 2019
IMPORTANT DISCLOSURES, INCLUDING ANY REQUIRED RESEARCH CERTIFICATIONS, ARE PROVIDED AT THE END OF THIS REPORT. IF THIS REPORT IS DISTRIBUTED IN THE UNITED STATES IT IS DISTRIBUTED BY CGS-CIMB SECURITIES (USA), INC. AND IS CONSIDERED THIRD-PARTY AFFILIATED RESEARCH.
Powered by the EFA Platform
Insert Insert
Universal Scientific Industrial A better tomorrow
■ USI's most intense period of spending likely over. We expect margins to improve hereon.
■ Industrial and PC/server businesses may pick up in 2H19F (favouring GPM).
■ TP trimmed to Rmb16.0 to reflect a more conservative business outlook.
Investing for future growth is definitely worthwhile 2Q19 revenue was in line with our estimate, but GPM/OPM came in 3.3%/24% below our
expectation. Undesirable sales mix (i.e. strong consumer sales coupled with weak
industrial sales and PC/server sales) was the main culprit for the lower-than-expected
GPM. USI incurred more-than-expected opex due to new projects related to 5G and
relocation of some capacities out of China for better geographical diversity. Management
guided for GPM improvement in 2H19, and kept its long-term goal of GPM above 10%.
2019 may be the peak of USI’s investment for the decade. We expect spending intensity
to drop significantly after this year, and thus see structural improvement in its profitability.
Confuse not between “SiP” and “AiP” We often get inquiries about the prospects of USI’s antenna-in-package (AiP) project for
5G application. In fact, all the AiP USI uses are produced by its mother company, ASE.
USI takes completed AiP from ASE, and further assemble it with other components of
radio frequency-front-end (RFFE) for 5G into a system-in-package (SiP). Revenue
recognition of AiP is booked entirely on ASE’s income statement. This is similar to the
fingerprint module for iPhone, in which ASE and USI collaborate to serve Apple.
“QSiP” definitely has more than one customer QCOM SiP, often referred as QSiP by both ASE and USI, is the RFFE module
companion to QCOM’s 5G modem or 5G system-on-chip (SoC). Encapsulating all RFFE
components into one SiP is an unprecedented approach, and unmatched by any other
competitor. QSiP significantly reduces system design difficulty and offers optimised
performance for QCOM’s 5G modem/SoC. We believe the attachment rate of QSiP to
QCOM’s 5G modem/SoC will be close to 100%. Asus issued a joint announcement with
USI and QCOM on its adoption of QCOM’s 5G solution, including QSiP. We believe there
are many unannounced customers using QSiP, including Samsung, Xiaomi, Oppo, LG,
Sony, etc. QSiP may be the fastest-growing sales for USI in our forecast period.
Strategically well aligned for growth We trim FY20F BVPS by 1% to reflect a more conservative demand outlook as the US-
China trade war lingers. At the same FY20F P/BV of 3.0x, our TP dips to Rmb16.0.
Based on our historical P/BV vs. ROE comparison (Figure 8), we believe USI is
undervalued now, given the clear divergence between its P/BV and ROE curves. We
recommend investors adopt a long investment horizon, and value the company’s
strategic alignment to surging demand for advanced SiP technologies. The main risk is
worse-than-expected demand growth in its communication business, particularly QSiP.
SOURCES: CGS-CIMB RESEARCH, COMPANY REPORTS
China
ADD (no change)
Consensus ratings*: Buy 13 Hold 2 Sell 0
Current price: Rmb13.27
Target price: Rmb16.00
Previous target: Rmb16.40
Up/downside: 20.6%
CGS-CIMB / Consensus: -2.3%
Reuters: 601231.SS
Bloomberg: 601231 CH
Market cap: US$4,042m
Rmb28,875m
Average daily turnover: US$29.78m
Rmb207.7m
Current shares o/s: 217.6m
Free float: 16.1% *Source: Bloomberg
Key changes in this note
FY20 revenue decreased by 6.1%.
FY20 ROE decreased by 1.2% pts.
FY20 BVPS decreased by 1.0%.
Source: Bloomberg
Price performance 1M 3M 12M Absolute (%) -1.2 6.8 46.6
Relative (%) 0.7 7.8 42.4
Major shareholders % held USI enterprise Ltd 77.4 China securities finance corp 1.7 National social security fund 1.2
Insert
Analyst(s)
Peter CHAN
T (1) 212 616 8614 E [email protected]
Financial Summary Dec-17A Dec-18A Dec-19F Dec-20F Dec-21F
Revenue (Rmbm) 29,706 33,550 37,067 44,477 54,713
Net Profit (Rmbm) 1,314 1,180 1,377 1,668 2,221
Core EPS (Rmb) 0.60 0.54 0.63 0.77 1.02
Core EPS Growth 64.7% (10.2%) 16.7% 21.2% 33.1%
FD Core P/E (x) 21.98 24.48 20.98 17.31 13.00
Price To Sales (x) 0.97 0.86 0.78 0.65 0.53
DPS (Rmb) 0.12 0.20 0.18 0.19 0.23
Dividend Yield 0.94% 1.49% 1.38% 1.45% 1.76%
EV/EBITDA (x) 11.94 13.67 14.44 12.60 9.64
P/FCFE (x) 45.15 NA NA NA NA
Net Gearing (55.4%) (38.0%) 7.0% 8.0% 5.2%
P/BV (x) 3.35 3.07 2.80 2.49 2.17
ROE 16.3% 13.1% 14.0% 15.2% 17.9%
% Change In Core EPS Estimates 3.14% (7.81%) (2.33%)
CGS-CIMB/Consensus EPS (x) 1.01 0.95 1.04
87
105
123
140
158
7.3
9.3
11.3
13.3
15.3
Price Close Relative to SHCOMP (RHS)
20
40
60
Aug-18 Nov-18 Mar-19 Jun-19
Vo
l m
17

Company Note Agribusiness │ Indonesia │ August 30, 2019
IMPORTANT DISCLOSURES, INCLUDING ANY REQUIRED RESEARCH CERTIFICATIONS, ARE PROVIDED AT THE END OF THIS REPORT. IF THIS REPORT IS DISTRIBUTED IN THE UNITED STATES IT IS DISTRIBUTED BY CGS-CIMB SECURITIES (USA), INC. AND IS CONSIDERED THIRD-PARTY AFFILIATED RESEARCH.
Powered by the EFA Platform
Insert Insert
Tunas Baru Lampung Fired up by biodiesel
■ With B30 enactment now brought forward to Oct 19, TBLA’s 2019F FAME contract with Pertamina has been upped from 215k mt to 260k mt.
■ Its 2020F FAME sales volume could rise by c.150k mt, implying a 55% yoy growth. TBLA would prioritise FAME over cooking oil given the better margin.
■ We lift our FY19-21F EPS by 1-12%. Maintain Add with an unchanged TP. Sugar import quota remains the key risk.
A more aggressive Biodiesel programme push On 29 Aug 19, the government announced that it has brought forward the B30
implementation from Jan 20 to Oct 19. Accordingly, Pertamina has increased its FAME
(Biodiesel) contracts, including TBLA’s, from 215k mt previously in 2019 to 260k mt. The
B30 implementation would lift FAME demand by c.3m mt in 2020F. Assuming TBLA has
a 2% market share (based on production capacity), its 2020F FAME volume would grow
to c.428k mt or +55% yoy. This would lift biodiesel sales contribution (to palm oil) from
19% in 2018 to 44% in 2020F. Note that biodiesel offers a GPM of c.17% vs. cooking oil’s
4-9%. At such, TBLA’s margins and profitability would be raised.
Better mix in cooking oil After biodiesel, cooking oil contributed major to palm oil sales, at c.33% in 1H19. In 1H19,
cooking oil sales volume declined by 29% yoy, in line with lower production by c.30%.
The growing biodiesel business contributed to the production decline given limited CPO
feedstock, albeit the company has bought more CPO from third parties in 1H19 (up by
30%). Both bulk and branded cooking oil sales volume fell, with the former at a much
faster pace. In 2018, bulk:branded cooking oil volume proportion was 50:50, but is
projected to be 35:65 in 2019F. Branded cooking oil’s higher margin (GPM of 8-9% vs.
bulk’s 4-5%) suggests the shift in product mix may boost margins.
Additional capex for capacity expansion, but de-leveraging remains Prior to the additional demand in FAME, TBLA plans to expand its biodiesel production
capacity by c.2x from the current 315k mt p.a. The capex required would be c.US$15m-
20m, or c.Rp280bn to be spread over 2019-20F. We thus increase 2019F/20F capex
assumptions from Rp700bn/600bn to Rp840bn/740bn. Nevertheless, we project it is on
track to de-leverage with 2019F/20F debt-to-equity ratio of 1.34/1.12x (vs. 2018’s 1.57x).
Maintain Add and unchanged TP We maintain Add on TBLA with an unchanged P/E-based TP of Rp1,300, still based on a
62% discount from the consumer staples’ P/E of 23x. The government’s aggressive
biodiesel push should catalyse TBLA’s growth. While there could be higher cost incurred
as its own CPO could not sufficiently supply the demand growth, it should overall be a net
benefit from higher volume and better margins. The key near-term risk not receiving
sugar quota from the government. We expect the quota announcement in Oct 19. We
increase 2019-21F EPS by 1-12% to factor in the higher biodiesel demand.
SOURCES: CGS-CIMB RESEARCH, COMPANY REPORTS
Indonesia
ADD (no change)
Consensus ratings*: Buy 4 Hold 0 Sell 0
Current price: Rp900.0
Target price: Rp1,300
Previous target: Rp1,300
Up/downside: 44.4%
CGS-CIMB / Consensus: 13.4%
Reuters: TBLA.JK
Bloomberg: TBLA IJ
Market cap: US$337.7m
Rp4,807,889m
Average daily turnover: US$0.16m
Rp2,262m
Current shares o/s: 5,342m
Free float: 44.7% *Source: Bloomberg
Key changes in this note
FY19F EPS increased by 1%.
FY20F EPS increased by 12%.
FY21F EPS increased by 4%.
Source: Bloomberg
Price performance 1M 3M 12M Absolute (%) 11.8 9.1 -22.4
Relative (%) 12.6 5.4 -27.5
Major shareholders % held PT Sungai Budi 28.1 PT Budi Delta Swakarya 27.2
Insert
Analyst(s)
Patricia GABRIELA
T (62) 21 3006 1734 E [email protected]
Vilhelmina T (62) 21 3006 1732 E [email protected]
Financial Summary Dec-17A Dec-18A Dec-19F Dec-20F Dec-21F
Revenue (Rpb) 8,975 8,615 8,761 10,111 10,426
Operating EBITDA (Rpb) 2,419 2,314 2,349 2,632 2,679
Net Profit (Rpb) 973 758 789 967 1,010
Core EPS (Rp) 182.2 141.8 147.6 180.9 189.1
Core EPS Growth 54.4% (22.1%) 4.1% 22.6% 4.5%
FD Core P/E (x) 4.88 6.35 6.10 4.97 4.76
DPS (Rp) 30.00 75.00 25.00 44.28 72.38
Dividend Yield 3.33% 8.33% 2.78% 4.92% 8.04%
EV/EBITDA (x) 4.33 5.22 5.02 4.38 4.14
P/FCFE (x) 25.53 8.99 21.95 50.00 9.81
Net Gearing 133% 152% 128% 108% 92%
P/BV (x) 1.13 1.01 0.89 0.78 0.71
ROE 24.7% 16.8% 15.5% 16.7% 15.6%
% Change In Core EPS Estimates 1.1% 12.1% 4.2%
CGS-CIMB/Consensus EPS (x) 0.99 1.11 1.91
57.0
73.7
90.3
107.0
680
880
1,080
1,280
Price Close Relative to JCI (RHS)
20
40
60
Aug-18 Nov-18 Mar-19 Jun-19
Vo
l m
18

Sector Note Consumer Discretionary │ South Korea │ August 30, 2019
IMPORTANT DISCLOSURES, INCLUDING ANY REQUIRED RESEARCH CERTIFICATIONS, ARE PROVIDED AT THE END OF THIS REPORT. IF THIS REPORT IS DISTRIBUTED IN THE UNITED STATES IT IS DISTRIBUTED BY CGS-CIMB SECURITIES (USA), INC. AND IS CONSIDERED THIRD-PARTY AFFILIATED RESEARCH.
Powered by the EFA Platform
Retail
CVS: Entering a duopoly
■ GSR and BGF's outdistancing profit structure vs. peers make them inevitable choices for franchisees; we see V-shape recovery in their net store opening.
■ We maintain OW on CVS industry amid 1) underappreciated OP upcycle by consensus, 2) undemanding sector valuation; GSR is our top pick.
Maintain Overweight on CVS We maintain OW on Korea's convenience store (CVS) sector (UW on Retail) amid benign
risk-reward. Structurally, the net store opening growth for GS Retail (GSR) and BGF
Retail (BGF) should turn positive in 2019F-2021F, in our view, as their franchisee NP vs.
industry laggards broadens. As such, we expect the duo to capture a majority share of
the surging no. of stores up for franchise contract renewal in 2019-2021F. Also, we
expect their subsidy burden to ease further from 1) tighter regulations on store openings
and 2) slowdown in minimum wage hike. Meanwhile, valuations have yet to reflect the
steeper earnings growth cycle, in our view. Our top CVS sector pick is GSR given its
steeper OP up-cycle from 1) higher net store opening, 3) waning SG&A burden from
declining depreciation, and 3) narrowing losses from non-CVS divisions.
Winner takes all; full-fledged upcycle ahead We expect CVS industry’s store share will briskly shift towards GSR/BGF in FY19-21F,
given 1) their outdistancing franchisee NP vs. laggards, 2) upsurge in stores up for
franchise contract renewal (c.2,000/2,900/4,300 in FY19/20/21F). We believe franchisees
would inevitably be drawn to choose GSR or BGF over the industry laggards – Seven
Eleven, Mini-Stop, EMart24– as the franchisee profit gap between the two frontrunners
and the laggards are widening, stemming from higher 1) sales, 2) store-level GPM, 3)
profit sharing ratio, and 4) subsidy. Based on our pro-forma store-level profit analysis on
18 different franchise types (Figs 4-6), GSR and BGF offer the most favourable profit
structures for a franchisee, with 2019F NP of W22m-52m and W36m-50m respectively,
far outpacing those of Seven Eleven (-W8m to W17m), Ministop (-W8m to W13m), and E-
Mart (-W25m to W8m). This bolsters our view that the industry will shift to a duopoly.
GS Retail: highest net store opening in 2019-2021F We raise our TP for GSR to W58k, now based on 10.5x 12M forward EV/EBITDA,
derived from 1 s.d. above 5-year average (8.2x previously), to reflect steeper OP upcycle
in FY18-21F from 1) higher CVS net store opening amid stronger store-level GPM, 2)
decrease in SG&A burden, and 3) narrowing losses from non-CVS divisions. We expect
GSR to enjoy the highest net store opening in the industry as franchisees get drawn to it
1) highest growth potential in store-level GPM (+0.6%pt p.a. over FY18-21F) vs. peers, 2)
highest store-level sales in the industry, and 3) favourable profit sharing structure.
BGF Retail: risk-reward skewed to the upside We reiterate our Add call on BGF with higher TP of W265k, still based on 25x 12M
forward EPS (20% premium to its historical average over 2017-YTD), as we revise up our
2019-2021F net store opening estimates for BGF given its higher-than-expected store-
level GPM in 2Q19 & QTD. In our view, the risk-reward for BGF is favourable, given its 1)
strong 2020F OP, which is being underappreciated by consensus, and 2) undemanding
valuation which has yet to reflect the full-fledged turnaround in its net store opening.
Figure 1: CVS industry's net store opening growth – consolidation in sight
SOURCES: CGS-CIMB RESEARCH, COMPANY
South Korea
Underweight (no change)
Highlighted Companies
BGF Retail ADD, TP W265,000, W203,500 close
We remain positive on BGF and see upside risks to Bloomberg consensus forecasts on its OP for 2020F and onwards as we believe consensus under-appreciates its net store opening growth. Moreover, its valuation has yet to reflect the V-shaped recovery of its business cycle.
GS Retail ADD, TP W58,000, W38,700 close
GSR is our top pick within the Korean CVS space given its: 1) CVS business cycle turnaround, 2) narrowing losses from non-CVS divisions, and 3) still-undemanding valuation.
Summary Valuation Metrics
Insert
Analyst(s)
Jun LIM
T (82) 2 6730 6130 E [email protected]
P/E (x) Dec-19F Dec-20F Dec-21F
GS Retail 19.00 15.18 13.33
BGF Retail 21.19 18.12 16.72
P/BV (x) Dec-19F Dec-20F Dec-21F
GS Retail 1.34 1.28 1.22
BGF Retail 5.49 4.53 3.84
Dividend Yield Dec-19F Dec-20F Dec-21F
GS Retail 1.81% 1.94% 2.07%
BGF Retail 1.65% 2.04% 2.33%
-60%
-40%
-20%
0%
20%
40%
2017 2018 2019F 2020F 2021F
BGF Retail GS Retail Ministop Seven Eleven Emart 24
Industry consolidation period
19

Consumer Discretionary │ South Korea
Retail │ August 30, 2019
1
Retail July 2019 sales: downturn materialises
■ Major retailers’ aggregate sales declined 0.1% yoy in July; offline retailers saw 5.6% yoy decline while online retailers posted 8.7% yoy growth.
■ Hypermarket/supermarket/department stores’ sales fell 13.3%/2.7% /4.0% yoy while CVS sales rose 2.4% yoy in Jul.
July 2019 retail sales: unfavourable weather conditions Major retailers’ aggregate sales declined 0.1% yoy in July, according to data from the
Ministry of Trade, Industry and Energy (MOTIE) released yesterday. Online retailers
posted 8.7% yoy sales growth, at the cost of offline retailers which saw a sales decline of
5.6 yoy, largely affected by unfavourable weather conditions in July 19 (frequent rainfall
on the weekend) and unfavourable consumption sentiment. Notably, contribution to
overall sales from hypermarkets/department stores dipped 3.1%/0.7% pts yoy, while
convenience store (CVS)/online sales contribution increased 0.4%/3.4% pts yoy. By
category, luxury boutique sales increased 19.2% yoy, followed by service/others (+5.2%),
household goods (+0.1%), foods (-0.3%), kids/sports (-2.3%), fashion/accessories (-
3.5%), and electronics (-4.6%).
Hypermarkets: SSSG down 12.9% yoy (Underweight) Major hypermarket retailers’ Jul revenue fell 13.3% yoy, visitor foot traffic declined 11.6%
while basket size decreased by 1.9%. Consequently, same-store-sales growth (SSSG)
fell 12.9% yoy in July. Sales decline prevailed across the board, with home appliances
seeing the largest decline of 26.6% yoy; food reported the smallest decline of 7.7% yoy.
Department stores: geared towards luxury boutique (Neutral) Major department store operators’ July 2019 revenue fell 4.0% yoy, visitor foot traffic
declined 13.7% while basket size increased by 11.3%. SSSG increased 0.9% yoy, largely
driven by accelerating sales growth in luxury boutique (+19.2% yoy), and all other
categories saw a decline in yoy sales.
Convenience stores (CVS): store opening sustains +4% yoy (OW) Major CVS operators’ July 2019 revenue grew 2.4% yoy, visitor foot traffic declined 0.6%
while basket size increased by 3.0%. SSSG decreased 1.9% yoy, while store openings
were sustained at +4.4% yoy level; both figures were in line with our expectations (-
1%/+4% yoy for 2019F).
Duty-free: the bright spot in domestic retail (Neutral) Domestic duty-free revenue (in US$ terms) rose 27.7% yoy in July, foreign visitor foot
traffic rose 12% while foreigners’ spending per visit increased by 22.8% yoy. Our channel
checks found major duty-free operators’ downtown concession sales growth sustained at
over 35% yoy levels in July and month-to-date, in Won terms.
Maintain Underweight; prefer CVS names The persisting downturn in consumption sentiment, coupled with ample downside risks to
Bloomberg consensus' forecasts on sector earnings, underpins our Underweight view on
the retail sector. Our preferred picks are CVS names which have been relatively
safeguarded from the consumption slowdown vs. other retail formats. Given the upside
risks to the latest consensus earnings forecasts while valuations remain undemanding,
we advise investors to add CVS name.
Figure 1: July 2019 retail sales
SOURCES: CGS-CIMB RESEARCH, COMPANY
South Korea
Underweight (no change)
Analyst(s)
Jun LIM
T (82) 2 6730 6130 E [email protected]
(yoy%) Hypermarket Dept Store CVS Duty-free Onl. Platform Onl. Direct
July-19 sales value -13.3% -4.0% 2.4% 27.7% 10.8% 3.6%
Visitor foot traffic -11.6% -13.7% -0.6% 2.4% na na
Basket size -1.9% 11.3% 3.0% 24.7% na na
Same-store-sales growth -12.9% 0.9% -1.9% na na na
20
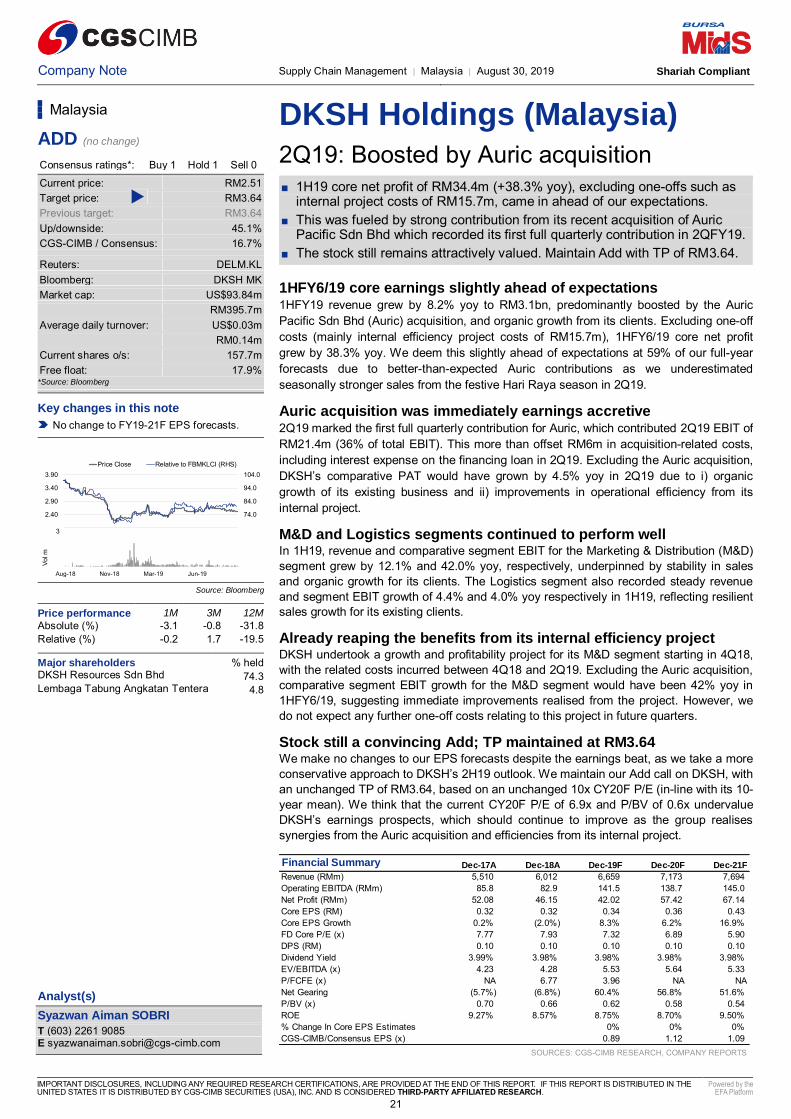
Company Note Supply Chain Management │ Malaysia │ August 30, 2019 Shariah Compliant
IMPORTANT DISCLOSURES, INCLUDING ANY REQUIRED RESEARCH CERTIFICATIONS, ARE PROVIDED AT THE END OF THIS REPORT. IF THIS REPORT IS DISTRIBUTED IN THE UNITED STATES IT IS DISTRIBUTED BY CGS-CIMB SECURITIES (USA), INC. AND IS CONSIDERED THIRD-PARTY AFFILIATED RESEARCH.
Powered by the EFA Platform
Insert Insert
DKSH Holdings (Malaysia)
2Q19: Boosted by Auric acquisition
■ 1H19 core net profit of RM34.4m (+38.3% yoy), excluding one-offs such as internal project costs of RM15.7m, came in ahead of our expectations.
■ This was fueled by strong contribution from its recent acquisition of Auric Pacific Sdn Bhd which recorded its first full quarterly contribution in 2QFY19.
■ The stock still remains attractively valued. Maintain Add with TP of RM3.64.
1HFY6/19 core earnings slightly ahead of expectations 1HFY19 revenue grew by 8.2% yoy to RM3.1bn, predominantly boosted by the Auric
Pacific Sdn Bhd (Auric) acquisition, and organic growth from its clients. Excluding one-off
costs (mainly internal efficiency project costs of RM15.7m), 1HFY6/19 core net profit
grew by 38.3% yoy. We deem this slightly ahead of expectations at 59% of our full-year
forecasts due to better-than-expected Auric contributions as we underestimated
seasonally stronger sales from the festive Hari Raya season in 2Q19.
Auric acquisition was immediately earnings accretive 2Q19 marked the first full quarterly contribution for Auric, which contributed 2Q19 EBIT of
RM21.4m (36% of total EBIT). This more than offset RM6m in acquisition-related costs,
including interest expense on the financing loan in 2Q19. Excluding the Auric acquisition,
DKSH’s comparative PAT would have grown by 4.5% yoy in 2Q19 due to i) organic
growth of its existing business and ii) improvements in operational efficiency from its
internal project.
M&D and Logistics segments continued to perform well In 1H19, revenue and comparative segment EBIT for the Marketing & Distribution (M&D)
segment grew by 12.1% and 42.0% yoy, respectively, underpinned by stability in sales
and organic growth for its clients. The Logistics segment also recorded steady revenue
and segment EBIT growth of 4.4% and 4.0% yoy respectively in 1H19, reflecting resilient
sales growth for its existing clients.
Already reaping the benefits from its internal efficiency project DKSH undertook a growth and profitability project for its M&D segment starting in 4Q18,
with the related costs incurred between 4Q18 and 2Q19. Excluding the Auric acquisition,
comparative segment EBIT growth for the M&D segment would have been 42% yoy in
1HFY6/19, suggesting immediate improvements realised from the project. However, we
do not expect any further one-off costs relating to this project in future quarters.
Stock still a convincing Add; TP maintained at RM3.64 We make no changes to our EPS forecasts despite the earnings beat, as we take a more
conservative approach to DKSH’s 2H19 outlook. We maintain our Add call on DKSH, with
an unchanged TP of RM3.64, based on an unchanged 10x CY20F P/E (in-line with its 10-
year mean). We think that the current CY20F P/E of 6.9x and P/BV of 0.6x undervalue
DKSH’s earnings prospects, which should continue to improve as the group realises
synergies from the Auric acquisition and efficiencies from its internal project.
SOURCES: CGS-CIMB RESEARCH, COMPANY REPORTS
Malaysia
ADD (no change)
Consensus ratings*: Buy 1 Hold 1 Sell 0
Current price: RM2.51
Target price: RM3.64
Previous target: RM3.64
Up/downside: 45.1%
CGS-CIMB / Consensus: 16.7%
Reuters: DELM.KL
Bloomberg: DKSH MK
Market cap: US$93.84m
RM395.7m
Average daily turnover: US$0.03m
RM0.14m
Current shares o/s: 157.7m
Free float: 17.9% *Source: Bloomberg
Key changes in this note
No change to FY19-21F EPS forecasts.
Source: Bloomberg
Price performance 1M 3M 12M
Absolute (%) -3.1 -0.8 -31.8
Relative (%) -0.2 1.7 -19.5
Major shareholders % held DKSH Resources Sdn Bhd 74.3 Lembaga Tabung Angkatan Tentera 4.8
Insert
Analyst(s)
Syazwan Aiman SOBRI
T (603) 2261 9085 E [email protected]
Financial Summary Dec-17A Dec-18A Dec-19F Dec-20F Dec-21F
Revenue (RMm) 5,510 6,012 6,659 7,173 7,694
Operating EBITDA (RMm) 85.8 82.9 141.5 138.7 145.0
Net Profit (RMm) 52.08 46.15 42.02 57.42 67.14
Core EPS (RM) 0.32 0.32 0.34 0.36 0.43
Core EPS Growth 0.2% (2.0%) 8.3% 6.2% 16.9%
FD Core P/E (x) 7.77 7.93 7.32 6.89 5.90
DPS (RM) 0.10 0.10 0.10 0.10 0.10
Dividend Yield 3.99% 3.98% 3.98% 3.98% 3.98%
EV/EBITDA (x) 4.23 4.28 5.53 5.64 5.33
P/FCFE (x) NA 6.77 3.96 NA NA
Net Gearing (5.7%) (6.8%) 60.4% 56.8% 51.6%
P/BV (x) 0.70 0.66 0.62 0.58 0.54
ROE 9.27% 8.57% 8.75% 8.70% 9.50%
% Change In Core EPS Estimates 0% 0% 0%
CGS-CIMB/Consensus EPS (x) 0.89 1.12 1.09
64.0
74.0
84.0
94.0
104.0
1.90
2.40
2.90
3.40
3.90
Price Close Relative to FBMKLCI (RHS)
1
2
3
Aug-18 Nov-18 Mar-19 Jun-19
Vo
l m
21

Company Note Pharmaceuticals │ Malaysia │ August 30, 2019 Shariah Compliant
IMPORTANT DISCLOSURES, INCLUDING ANY REQUIRED RESEARCH CERTIFICATIONS, ARE PROVIDED AT THE END OF THIS REPORT. IF THIS REPORT IS DISTRIBUTED IN THE UNITED STATES IT IS DISTRIBUTED BY CGS-CIMB SECURITIES (USA), INC. AND IS CONSIDERED THIRD-PARTY AFFILIATED RESEARCH.
Powered by the EFA Platform
Insert Insert
Duopharma Biotech Bhd Manifesting its charms
■ DBB’s 1H19 core net profit was in-line with expectations, making up 52.4% of our full-year forecast (c.3% above consensus), as 1H is typically stronger.
■ The stronger performance was driven by improved demand for pharmaceutical products from the public and private sector.
■ Maintain Add with a TP of RM1.56, pegged to its 5-year historical mean of 16x CY20F P/E.
2Q19 core net profit lifted by strong demand DBB’s 2Q19 core NP rose by 14.2% yoy, after adjusting for exceptional items of RM1.5m
of foreign exchange gain and RM1.2m of write-off of inventories. It benefitted from strong
pharmaceutical products demand from the public/private sectors and exports growth,
resulting in 17.3% yoy topline growth. We attribute this to the continued supply of insulin
to MOH, likely higher sales under the Approved Purchase Product List (APPL) segment,
and continued sales of prescription and consumer healthcare products to the private
sector. We expect more details at DBB’s analyst briefing next week (5 Sep).
Margins remained firm despite higher operational costs Gross margins remained healthy at 49%, up qoq, though it inched down by 1.4% pts yoy,
arising from higher production costs due to the strengthening of the US$ against the
ringgit (+5% yoy) as its raw materials are sourced from India and China. Finance costs
also spiked during the quarter as it drew down more borrowings to fund its expansion
plans, as we had anticipated. Nevertheless, PBT margins remained steady qoq at 12.6%
(1Q19: 12.5%) rising by 2.2% pts yoy. Meanwhile, net gearing stood at 0.3x (as at end-
Jun 2019), which is manageable given the expected steady operating cashflows.
Unlikely to be hit by drug price control Meanwhile, the Ministry of Health (MOH) is developing a medicine price control
mechanism at the wholesale and retail levels. We think this move is intended to curtail
the prices of single-source or patented drugs in order to improve access to healthcare for
all. We think local manufacturers, including DBB, are shielded as they produce
comparatively cheaper generic drugs. Drastic price intervention also may not be taken to
avoid discouraging growth and innovation among local pharmaceutical players. We await
further clarity on this from the MOH.
Retain Add; well-placed to capture demand in public/private sector We reiterate our Add recommendation on DBB, supported by our expectation of steady
upcoming secular growth as more of its strategies and collaborations come to fruition. It
is also further differentiating itself from other local pharmaceutical players as it makes
inroads into the high-value segment and niche therapeutic areas, which strategically
positions it to capture the growing demand in the Malaysian healthcare sector from both
the public and private segments. The stock is further supported by c.4% dividend yield
over FY19-21F, based on our estimates. It offers close to 14% upside based on our
valuation, and is still comparatively undervalued.
SOURCES: CGS-CIMB RESEARCH, COMPANY REPORTS
Malaysia
ADD (no change)
Consensus ratings*: Buy 3 Hold 0 Sell 0
Current price: RM1.41
Target price: RM1.56
Previous target: RM1.56
Up/downside: 10.7%
CGS-CIMB / Consensus: -2.1%
Reuters: DUOP.KL
Bloomberg: DBB MK
Market cap: US$227.4m
RM959.0m
Average daily turnover: US$0.19m
RM0.77m
Current shares o/s: 481.0m
Free float: 41.3% *Source: Bloomberg
Key changes in this note
No change.
Source: Bloomberg
Price performance 1M 3M 12M Absolute (%) 2.9 4.4 9.3
Relative (%) 4.8 5.9 20.7
Major shareholders % held Permodalan Nasional Berhad (PNB) 46.7 Employee Provident Fund (EPF) 7.8 Amanah Saham Bhd (ASB) 4.2
Insert
Analyst(s)
Calyne TI
T (60) 3 2261 9082 E [email protected]
Financial Summary Dec-17A Dec-18A Dec-19F Dec-20F Dec-21F
Revenue (RMm) 465.7 498.7 546.4 598.8 661.8
Operating EBITDA (RMm) 83.0 99.9 114.3 129.4 149.7
Net Profit (RMm) 41.53 47.64 59.60 66.34 78.17
Normalised EPS (RM) 0.07 0.09 0.09 0.10 0.11
Normalised EPS Growth (40.7%) 21.9% (1.3%) 11.3% 17.8%
FD Normalised P/E (x) 13.83 15.83 15.80 14.46 12.27
DPS (RM) 0.085 0.055 0.044 0.049 0.057
Dividend Yield 6.03% 3.90% 3.11% 3.46% 4.08%
EV/EBITDA (x) 11.44 10.71 9.70 8.52 7.17
P/FCFE (x) NA 59.2 150.4 14.2 10.8
Net Gearing 6.5% 30.2% 27.3% 24.5% 18.1%
P/BV (x) 1.91 1.92 1.75 1.64 1.53
ROE 10.1% 12.1% 11.6% 11.7% 12.9%
% Change In Normalised EPS Estimates 0% 0% 0%
Normalised EPS/consensus EPS (x) 1.04 1.12 1.11
75.0
92.1
109.3
126.4
0.80
1.00
1.20
1.40
Price Close Relative to FBMKLCI (RHS)
1
2
3
4
Aug-18 Nov-18 Mar-19 Jun-19
Vo
l m
22

Company Note Gaming │ Malaysia │ August 30, 2019
IMPORTANT DISCLOSURES, INCLUDING ANY REQUIRED RESEARCH CERTIFICATIONS, ARE PROVIDED AT THE END OF THIS REPORT. IF THIS REPORT IS DISTRIBUTED IN THE UNITED STATES IT IS DISTRIBUTED BY CGS-CIMB SECURITIES (USA), INC. AND IS CONSIDERED THIRD-PARTY AFFILIATED RESEARCH.
Powered by the EFA Platform
Insert Insert
Genting Bhd
1H19: Boosted by high win rate
■ 1H19 core net profit was above expectations at 60.1% of our and 84% of consensus full-year forecasts due to a high gaming win rate.
■ 1H19 domestic leisure and hospitality division recorded a 0.4% PBT increase, which was mainly due to high gaming win rate at VIP tables.
■ Maintain Add, raise FY19F EPS by 7.0% but cut FY20-21F EPS by 7.2-13.8%. Our TP falls from RM8.40 to RM7.90.
Key drivers for 1HFY19 earnings 1HFY19 core net profit was up 20.3% yoy at RM1,335.2m, mainly due to growth in
Singapore’s leisure & hospitality division (+3.4% yoy at RM1,950.7m). Both Singapore
and domestic gaming operations benefited from high win rates at VIP tables. Domestic
leisure PBT was up 0.4% yoy at RM1,337.5m. However, this was offset by PBT declines
in the plantation division (PBT down 32.4% yoy at RM167.8m), due to weak crude palm
oil (CPO) price, and oil & gas division (PBT down 12.1% yoy at RM103.4m) from lower oil
prices. A 6.5 sen interim DPS was declared, within our expectations.
Smaller Bimini losses boost US profits 1HFY19 US operations PBT grew 18.4% yoy to RM168.6m, mainly due to smaller losses
for the Bimini operations. Power division PBT was up 3% yoy at RM210.3m, mainly due
to the contribution from the Banten Plant and the Jangi wind farm. Plantation PBT was
down more than 30% yoy due to weak crude palm oil (CPO) prices, while property PBT
growth was flat yoy due to weak property market conditions.
Construction of RWLV to be completed by end-2020 The construction of its new US casino, Resorts World Las Vegas (RWLV), is progressing
well. As of 10 Aug 2019, RWLV has completed concrete works for both the West and
East Towers, topping off at the 69th level. Total development and land costs incurred as
of 30 Jun 2019 were approximately US$1.5bn. The first phase of the project is estimated
to cost approximately US$4.1 bn.
Reduce FY20-21F core EPS by 7.2%-13.8% We raise FY19F EPS by 7.0% to reflect higher investment and interest income. However,
we slash our FY20-21F core EPS by 7.2-13.8% due to our EPS cuts for Genting
Singapore (GENS SP, Add) and Genting Plantation (GENP MK, Add).
Remains an Add, TP cut from RM8.40 to RM7.70 As we earlier slashed our target prices for Genting Singapore (GENS SP, Add), Genting
Malaysia (GENM MK, Add) and Genting Plantation (GENP MK, Add), our TP falls from
RM8.40 to RM7.70, based on a 30% discount to RNAV. The stock remains an Add due to
its attractive valuation of 8.4x 2020F P/E. A potential re-rating catalyst is continued high
win rates for the gaming division while risks include delays in the opening of the outdoor
theme park and weak gaming profits.
SOURCES: CGS-CIMB RESEARCH, COMPANY REPORTS
Malaysia
ADD (no change)
Consensus ratings*: Buy 12 Hold 4 Sell 1
Current price: RM5.90
Target price: RM7.90
Previous target: RM8.40
Up/downside: 33.9%
CGS-CIMB / Consensus: 0.2%
Reuters: GENT.KL
Bloomberg: GENT MK
Market cap: US$5,387m
RM22,718m
Average daily turnover: US$6.43m
RM26.77m
Current shares o/s: 3,743m
Free float: 60.0% *Source: Bloomberg
Key changes in this note
We raise our FY19F EPS by 7.0% and reduce FY20-21F EPS by 7.2-13.8%
Source: Bloomberg
Price performance 1M 3M 12M
Absolute (%) -15.1 -6.8 -32.2
Relative (%) -12.2 -5 -19.8
Major shareholders % held
Kien Huat Realty 40.0
Insert
Analyst(s)
Ivy NG Lee Fang, CFA
T (60) 3 2261 9073 E [email protected]
Financial Summary Dec-17A Dec-18A Dec-19F Dec-20F Dec-21F
Revenue (RMm) 20,020 20,853 21,989 22,978 24,065
Operating EBITDA (RMm) 7,063 7,928 7,443 7,926 8,121
Net Profit (RMm) 1,445 1,366 2,068 2,157 2,239
Core EPS (RM) 0.50 0.75 0.55 0.58 0.60
Core EPS Growth 20.0% 50.4% (26.2%) 4.3% 3.8%
FD Core P/E (x) 14.32 9.63 12.92 12.40 11.95
DPS (RM) 0.12 0.12 0.12 0.12 0.12
Dividend Yield 2.03% 2.03% 2.03% 2.03% 2.03%
EV/EBITDA (x) 5.39 4.52 4.62 3.93 3.43
P/FCFE (x) 9.31 8.28 9.17 5.82 5.72
Net Gearing (25.5%) (29.6%) (32.7%) (38.1%) (42.9%)
P/BV (x) 0.62 0.59 0.57 0.55 0.53
ROE 5.33% 7.66% 5.40% 5.47% 5.50%
% Change In Core EPS Estimates 7.0% (7.2%) (13.8%)
CGS-CIMB/Consensus EPS (x) 0.90 0.92 0.96
74.0
82.6
91.1
99.7
5.60
6.60
7.60
8.60
Price Close Relative to FBMKLCI (RHS)
10
20
30
40
Aug-18 Nov-18 Mar-19 Jun-19
Vo
l m
23

Company Note Gaming │ Malaysia │ August 30, 2019
IMPORTANT DISCLOSURES, INCLUDING ANY REQUIRED RESEARCH CERTIFICATIONS, ARE PROVIDED AT THE END OF THIS REPORT. IF THIS REPORT IS DISTRIBUTED IN THE UNITED STATES IT IS DISTRIBUTED BY CGS-CIMB SECURITIES (USA), INC. AND IS CONSIDERED THIRD-PARTY AFFILIATED RESEARCH.
Powered by the EFA Platform
Insert Insert
Genting Malaysia
2Q19: Win rates remained high
■ 1H19 core net profit was in line with our (54% of our FY19F) but beat market expectations (65% consensus). High gaming win rates likely not sustainable.
■ Malaysia EBITDA rose 2.0% yoy in 1H19, which was impressive considering the casino tax was raised by 10% pts at the start of this year.
■ Maintain Hold. Our TP dips as we add a 10% discount to its RNAV to reflect potential earnings risk from Empire Resorts and lower gaming win rates.
1HFY19 core net profit only down 2.9% yoy GENM posted 1H19 core net profit of RM811.3m, down only 2.9% yoy; this is impressive
given the 10%-pt hike in casino tax effective 1 Jan 2019. 1HFY19 PBT declined 12.0%
yoy to RM758.9m, driven by i) RM138m provision for related costs from the termination of
contracts related to its outdoor theme park, and ii) RM112.3m fall in interest income,
mainly due to impairment of its investment in the Mashpee Wampanoag Tribe promissory
notes. The losses were partially offset by RM123.8m gain from asset sale. A 6sen interim
DPS was declared, in line with our expectations.
Malaysia EBITDA gain from high hold percentage in VIP market Malaysia EBITDA rose 2.0% yoy in 1H19 to RM1,095.6m, mainly due to continued
exceptionally high hold percentage in the mid-to-premium market segment and higher
non-gaming revenue. What is of concern was that 1H19 gaming VIP business volume fell
19% yoy, while non-VIP volume fell 5% yoy. The decline was mainly due to lower
incentives offered to players as part of its cost rationalisation initiatives.
Better US profit due to lower losses from Bimini operations US and Bahamas EBITDA rose 18.4% yoy in 1H19 to RM168.6m, mainly due to smaller
losses for the Bimini operations. US 1H19 PBT loss almost halved to RM31m vs. RM60m
loss in 1H18, mainly due to improved operational efficiencies.
New outdoor theme park to open only in 3Q2020 GENM indicated that its new outdoor theme park (NOTP) would only be opened in 3Q20.
This is a disappointment as we had expected a 1Q20 opening. It looks like the company
needs a bit more time to get new intellectual properties (IP) for the rides. Meanwhile,
GENM expects its acquisition of the US Empire Resort (ER) to be completed by the end
of this year. However, it gave no details when asked how much funds it will pump into
ER. We have not assumed any earnings from ER.
Remains a Hold, TP cut to RM3.15 We raise our FY19-21F EPS forecasts slightly by 0.01%-0.8% for housekeeping
purposes. Our TP falls from RM3.50 to RM3.15, now based on a 10% discount to our
RNAV (no discount before) due to earnings risks from i) potential losses from ER, and ii)
possibility of luck running out soon for its VIP gaming division. The stock remains a Hold.
Potential re-rating catalysts include continued high gaming win rates while further delays
in the opening of NOTP could de-rate the stock.
SOURCES: CGS-CIMB RESEARCH, COMPANY REPORTS
Malaysia
HOLD (no change)
Consensus ratings*: Buy 4 Hold 9 Sell 6
Current price: RM3.12
Target price: RM3.15
Previous target: RM3.50
Up/downside: 1.0%
CGS-CIMB / Consensus: -12.9%
Reuters: GENM.KL
Bloomberg: GENM MK
Market cap: US$4,393m
RM18,527m
Average daily turnover: US$13.13m
RM54.67m
Current shares o/s: 5,938m
Free float: 50.7% *Source: Bloomberg
Key changes in this note
We raise our FY19-21F EPS forecasts by 0.01%-0.8% for housekeeping purposes.
Source: Bloomberg
Price performance 1M 3M 12M
Absolute (%) -19 0.6 -39.5
Relative (%) -16.1 2.4 -27.1
Major shareholders % held
Genting Berhad 49.3
Insert
Analyst(s)
Ivy NG Lee Fang, CFA
T (60) 3 2261 9073 E [email protected]
Financial Summary Dec-17A Dec-18A Dec-19F Dec-20F Dec-21F
Revenue (RMm) 9,494 9,928 10,587 11,017 11,483
Operating EBITDA (RMm) 2,207 2,602 2,667 2,867 3,043
Net Profit (RMm) 1,160 (20) 1,496 1,534 1,660
Core EPS (RM) 0.24 0.33 0.25 0.26 0.28
Core EPS Growth (9.0%) 41.0% (24.8%) 2.6% 8.2%
FD Core P/E (x) 13.14 9.32 12.39 12.08 11.16
DPS (RM) 0.17 0.18 0.10 0.11 0.12
Dividend Yield 5.45% 5.77% 3.21% 3.53% 3.69%
EV/EBITDA (x) 7.85 6.97 7.33 6.88 6.48
P/FCFE (x) 3.76 11.96 20.59 17.88 15.69
Net Gearing 4.7% 9.5% 16.8% 17.4% 16.8%
P/BV (x) 0.96 1.02 0.99 0.96 0.93
ROE 7.2% 10.6% 8.1% 8.1% 8.5%
% Change In Core EPS Estimates 0.01% 0.81% 0.78%
CGS-CIMB/Consensus EPS (x) 1.18 1.13 1.15
57.0
73.7
90.3
107.0
2.50
3.50
4.50
5.50
Price Close Relative to FBMKLCI (RHS)
100
200
300
400
Aug-18 Nov-18 Mar-19 Jun-19
Vo
l m
24
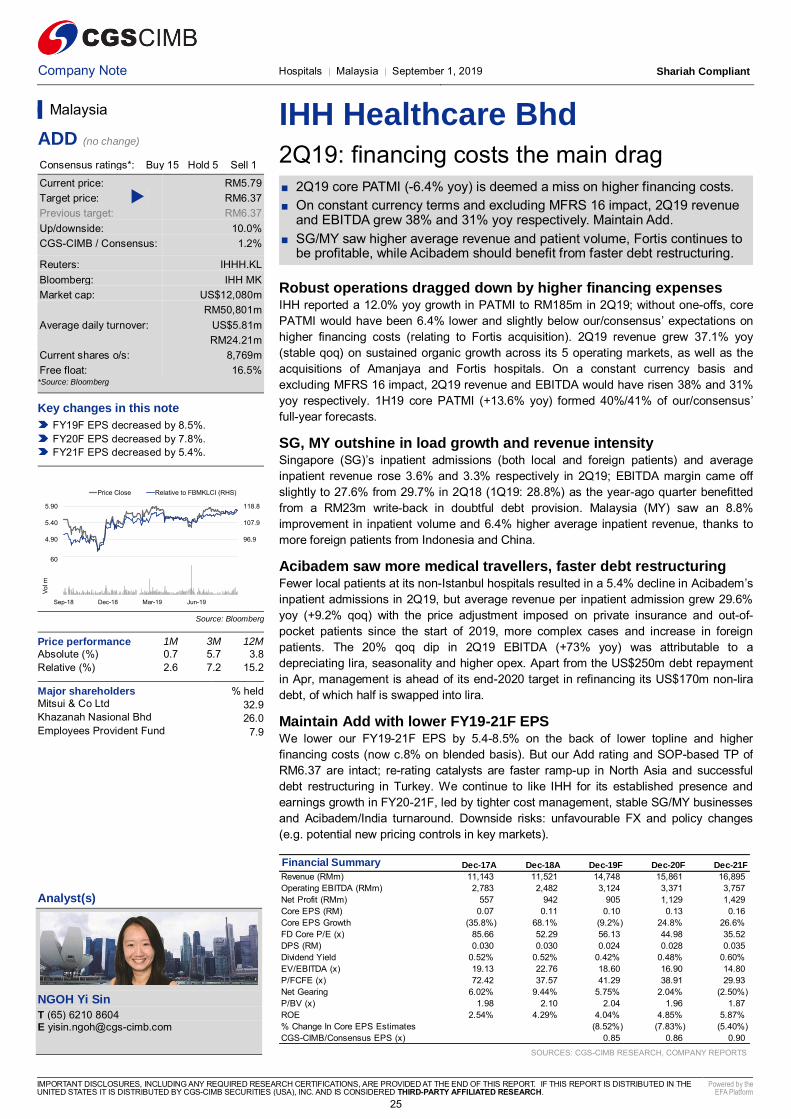
Company Note Hospitals │ Malaysia │ September 1, 2019 Shariah Compliant
IMPORTANT DISCLOSURES, INCLUDING ANY REQUIRED RESEARCH CERTIFICATIONS, ARE PROVIDED AT THE END OF THIS REPORT. IF THIS REPORT IS DISTRIBUTED IN THE UNITED STATES IT IS DISTRIBUTED BY CGS-CIMB SECURITIES (USA), INC. AND IS CONSIDERED THIRD-PARTY AFFILIATED RESEARCH.
Powered by the EFA Platform
Insert Insert
IHH Healthcare Bhd
2Q19: financing costs the main drag
■ 2Q19 core PATMI (-6.4% yoy) is deemed a miss on higher financing costs.
■ On constant currency terms and excluding MFRS 16 impact, 2Q19 revenue and EBITDA grew 38% and 31% yoy respectively. Maintain Add.
■ SG/MY saw higher average revenue and patient volume, Fortis continues to be profitable, while Acibadem should benefit from faster debt restructuring.
Robust operations dragged down by higher financing expenses IHH reported a 12.0% yoy growth in PATMI to RM185m in 2Q19; without one-offs, core
PATMI would have been 6.4% lower and slightly below our/consensus’ expectations on
higher financing costs (relating to Fortis acquisition). 2Q19 revenue grew 37.1% yoy
(stable qoq) on sustained organic growth across its 5 operating markets, as well as the
acquisitions of Amanjaya and Fortis hospitals. On a constant currency basis and
excluding MFRS 16 impact, 2Q19 revenue and EBITDA would have risen 38% and 31%
yoy respectively. 1H19 core PATMI (+13.6% yoy) formed 40%/41% of our/consensus’
full-year forecasts.
SG, MY outshine in load growth and revenue intensity Singapore (SG)’s inpatient admissions (both local and foreign patients) and average
inpatient revenue rose 3.6% and 3.3% respectively in 2Q19; EBITDA margin came off
slightly to 27.6% from 29.7% in 2Q18 (1Q19: 28.8%) as the year-ago quarter benefitted
from a RM23m write-back in doubtful debt provision. Malaysia (MY) saw an 8.8%
improvement in inpatient volume and 6.4% higher average inpatient revenue, thanks to
more foreign patients from Indonesia and China.
Acibadem saw more medical travellers, faster debt restructuring Fewer local patients at its non-Istanbul hospitals resulted in a 5.4% decline in Acibadem’s
inpatient admissions in 2Q19, but average revenue per inpatient admission grew 29.6%
yoy (+9.2% qoq) with the price adjustment imposed on private insurance and out-of-
pocket patients since the start of 2019, more complex cases and increase in foreign
patients. The 20% qoq dip in 2Q19 EBITDA (+73% yoy) was attributable to a
depreciating lira, seasonality and higher opex. Apart from the US$250m debt repayment
in Apr, management is ahead of its end-2020 target in refinancing its US$170m non-lira
debt, of which half is swapped into lira.
Maintain Add with lower FY19-21F EPS We lower our FY19-21F EPS by 5.4-8.5% on the back of lower topline and higher
financing costs (now c.8% on blended basis). But our Add rating and SOP-based TP of
RM6.37 are intact; re-rating catalysts are faster ramp-up in North Asia and successful
debt restructuring in Turkey. We continue to like IHH for its established presence and
earnings growth in FY20-21F, led by tighter cost management, stable SG/MY businesses
and Acibadem/India turnaround. Downside risks: unfavourable FX and policy changes
(e.g. potential new pricing controls in key markets).
SOURCES: CGS-CIMB RESEARCH, COMPANY REPORTS
Malaysia
ADD (no change)
Consensus ratings*: Buy 15 Hold 5 Sell 1
Current price: RM5.79
Target price: RM6.37
Previous target: RM6.37
Up/downside: 10.0%
CGS-CIMB / Consensus: 1.2%
Reuters: IHHH.KL
Bloomberg: IHH MK
Market cap: US$12,080m
RM50,801m
Average daily turnover: US$5.81m
RM24.21m
Current shares o/s: 8,769m
Free float: 16.5% *Source: Bloomberg
Key changes in this note
FY19F EPS decreased by 8.5%.
FY20F EPS decreased by 7.8%.
FY21F EPS decreased by 5.4%.
Source: Bloomberg
Price performance 1M 3M 12M
Absolute (%) 0.7 5.7 3.8
Relative (%) 2.6 7.2 15.2
Major shareholders % held
Mitsui & Co Ltd 32.9 Khazanah Nasional Bhd 26.0
Employees Provident Fund 7.9
Insert
Analyst(s)
NGOH Yi Sin
T (65) 6210 8604 E [email protected]
Financial Summary Dec-17A Dec-18A Dec-19F Dec-20F Dec-21F
Revenue (RMm) 11,143 11,521 14,748 15,861 16,895
Operating EBITDA (RMm) 2,783 2,482 3,124 3,371 3,757
Net Profit (RMm) 557 942 905 1,129 1,429
Core EPS (RM) 0.07 0.11 0.10 0.13 0.16
Core EPS Growth (35.8%) 68.1% (9.2%) 24.8% 26.6%
FD Core P/E (x) 85.66 52.29 56.13 44.98 35.52
DPS (RM) 0.030 0.030 0.024 0.028 0.035
Dividend Yield 0.52% 0.52% 0.42% 0.48% 0.60%
EV/EBITDA (x) 19.13 22.76 18.60 16.90 14.80
P/FCFE (x) 72.42 37.57 41.29 38.91 29.93
Net Gearing 6.02% 9.44% 5.75% 2.04% (2.50%)
P/BV (x) 1.98 2.10 2.04 1.96 1.87
ROE 2.54% 4.29% 4.04% 4.85% 5.87%
% Change In Core EPS Estimates (8.52%) (7.83%) (5.40%)
CGS-CIMB/Consensus EPS (x) 0.85 0.86 0.90
86.0
96.9
107.9
118.8
4.40
4.90
5.40
5.90
Price Close Relative to FBMKLCI (RHS)
20
40
60
Sep-18 Dec-18 Mar-19 Jun-19
Vo
l m
25

Company Note Hospitals │ Malaysia │ August 30, 2019 Shariah Compliant
IMPORTANT DISCLOSURES, INCLUDING ANY REQUIRED RESEARCH CERTIFICATIONS, ARE PROVIDED AT THE END OF THIS REPORT. IF THIS REPORT IS DISTRIBUTED IN THE UNITED STATES IT IS DISTRIBUTED BY CGS-CIMB SECURITIES (USA), INC. AND IS CONSIDERED THIRD-PARTY AFFILIATED RESEARCH.
Powered by the EFA Platform
Insert Insert
KPJ Healthcare
Capacity expansion continue to bear fruit
■ KPJ’s 1H19 core net profit was in line with expectations, making up 50% of our full-year forecast and 48% of the consensus number.
■ The stronger patient growth was driven by hospitals in the growth stage.
■ Maintain Add with an unchanged TP of RM1.25, still based on its 5-year historical mean of 27.4x 2020F P/E.
2Q19 core net profit rose on account of strong patient growth 2Q19 core net profit fell by 1.1% yoy (post-MFRS 16) or an estimated 2.4% yoy growth
(pre-MFRS16) to RM45.3m. This was on the back of the strong 5.8% yoy patient growth
and 7.2% increase in average revenue per patient. KPJ Rawang, KPJ Pasir Gudang
(both of which are hospitals in the growth stage) and KPJ Johor registered increased
number of surgery cases and patient traffic. Meanwhile, the newly-opened KPJ Perlis and
KPJ Bandar Dato’ Onn also contributed to the higher patient growth, as expected.
Margins taking a positive course on operational improvements To recap, post-MFRS16, we should also see an improvement in EBITDA margins (2Q19:
17.5%; 2Q18: 14.2%), as scheduled lease payments due to the lessors are excluded
from the P&L while interest expense from the operating leases and the depreciation of
right-of-use assets are included. PBT margins should be lower at the initial stage due to
front-loading of expenses. However, we note that KPJ delivered higher PBT margins of
7.9% in 2Q19 (+0.2% pts yoy), likely due to continued cost optimisation efforts and
higher-value offerings.
Less strain from start-up losses It is also encouraging that there are now only two hospitals left in the gestation phase -
KPJ Perlis (opened in May 2018) and KPJ Bandar Dato’ Onn (opened in Feb 2019) as
per our 5 July report - whereby stronger patient growth, increased service offerings and
higher revenue intensity are key.
Concerns on drug price control overblown We think that the 9.5% YTD decline in share price to close to its 1-year low is
unwarranted given KPJ’s fairly stable earnings and as it is the key beneficiary of the
government’s plans to improve access to healthcare treatment. Furthermore, we think the
government is unlikely to take extreme measures to put a cap on medicine prices as this
will inhibit the viability of the government’s move to alleviate overcrowding in the public
sector by moving some services to private players. Lastly, we think private hospitals have
the flexibility to adjust the component of charges which are not regulated; procedure
fees/hospital charges in response to the price ceiling on drugs. We reiterate our Add
recommendation with a TP of RM1.25. It is positioning itself as the key private hospital
provider and remains as the only pure-play Malaysian hospital provider with an attractive
valuation of close to 2 s.d. below its 5-year historical mean.
SOURCES: CGS-CIMB RESEARCH, COMPANY REPORTS
Malaysia
ADD (no change)
Consensus ratings*: Buy 11 Hold 6 Sell 1
Current price: RM0.91
Target price: RM1.25
Previous target: RM1.25
Up/downside: 37.3%
CGS-CIMB / Consensus: 12.5%
Reuters: KPJH.KL
Bloomberg: KPJ MK
Market cap: US$924.9m
RM3,901m
Average daily turnover: US$0.76m
RM3.17m
Current shares o/s: 4,355m
Free float: 44.8% *Source: Bloomberg
Key changes in this note
No changes.
Source: Bloomberg
Price performance 1M 3M 12M
Absolute (%) -2.7 -2.2 -17.3
Relative (%) 0.2 0.3 -5
Major shareholders % held Johor Corporation 38.7 EPF 9.4 Waqaf An-Nur Corporation 7.1
Insert
Analyst(s)
Calyne TI
T (60) 3 2261 9082 E [email protected]
Financial Summary Dec-17A Dec-18A Dec-19F Dec-20F Dec-21F
Revenue (RMm) 3,180 3,308 3,495 3,736 3,989
Operating EBITDA (RMm) 388.0 460.9 552.8 609.9 651.8
Net Profit (RMm) 155.0 183.0 178.1 200.5 217.2
Core EPS (RM) 0.039 0.042 0.041 0.046 0.050
Core EPS Growth 11.0% 9.4% (3.1%) 12.6% 8.3%
FD Core P/E (x) 24.13 23.20 22.37 19.77 18.25
DPS (RM) 0.018 0.020 0.020 0.023 0.025
Dividend Yield 1.96% 2.20% 2.25% 2.53% 2.74%
EV/EBITDA (x) 13.00 10.65 10.80 9.80 9.14
P/FCFE (x) NA 42.14 84.36 98.83 32.95
Net Gearing 77% 56% 122% 118% 113%
P/BV (x) 2.31 2.00 2.27 2.14 2.03
ROE 10.1% 9.9% 9.5% 11.1% 11.4%
% Change In Core EPS Estimates 0.029% 0.026% 0.025%
CGS-CIMB/Consensus EPS (x) 1.00 1.05 1.06
89.0
94.0
99.0
104.0
109.0
0.800
0.900
1.000
1.100
1.200
Price Close Relative to FBMKLCI (RHS)
20
40
60
80
Aug-18 Nov-18 Mar-19 Jun-19
Vo
l m
26

Company Note Property Development │ Malaysia │ August 30, 2019 Shariah Compliant
IMPORTANT DISCLOSURES, INCLUDING ANY REQUIRED RESEARCH CERTIFICATIONS, ARE PROVIDED AT THE END OF THIS REPORT. IF THIS REPORT IS DISTRIBUTED IN THE UNITED STATES IT IS DISTRIBUTED BY CGS-CIMB SECURITIES (USA), INC. AND IS CONSIDERED THIRD-PARTY AFFILIATED RESEARCH.
Powered by the EFA Platform
Insert Insert
LBS Bina Group
On track to achieve FY19 sales target
■ 1H19 core net profit was in line at 40% of our full-year forecast, as we expect a stronger 2H19 from higher sales recognition.
■ 1H19 new property sales of RM819m made up 55% of its FY19 sales target of RM1.5bn.
■ Maintain Add with a TP of RM0.88, still based on a 45% discount to RNAV.
Key results highlights LBS’s 1H19 core net profit came in within expectations, at 40% of our full-year estimate,
but below the Bloomberg consensus number at 34%. We deem the results in-line as we
expect a stronger 2H19 due to higher revenue recognition of ongoing projects. 1H19 core
net profit declined 29% yoy due to weaker profit from the construction division (PBT: -
62% yoy), higher interest cost and higher effective tax rate. As at end-Jun 2019, unbilled
sales trended marginally higher to RM1.75bn vs. RM1.7bn at end-Jun 2018.
1H19 new property sales at RM819m 1H19 new property sales were comparable at RM819m vs. RM831m in 1H18, making up
55% of its FY19 sales target of RM1.5bn. The sales were mainly driven by its projects in
LBS CyberSouth (RM393m), Alam Perdana (RM221m), and Residensi Bukit Jalil
(RM57m). As at 27 Aug 2019, new property sales stood at RM1bn. Given the good sales
momentum, we believe LBS is on track to achieve its FY19 sales target of RM1.5bn.
More aggressive launches in FY19 LBS plans to launch projects with a total gross development value (GDV) of c.RM2bn
(revised from RM1.8bn previously) in FY19 vs. RM1.2bn in FY18. The higher revised
planned launches were due to encouraging sales momentum at CyberSouth and Alam
Perdana, where LBS decided to launch an additional project (Melodi Perdana; RM163m
GDV) in Alam Perdana in FY19. As at 27 Aug 2019, LBS has launched new projects
worth up to RM1.1bn gross development value (GDV) so far this year.
Resubmitting ZIC’s revised plan before end-2019 China’s government unveiled the outline development plan for the Greater Bay Area in
early-2019. Currently, LBS is working to improve and revise the Zhuhai International
Circuit’s (ZIC) upgrading and transformation plan in order to better leverage the higher
growth prospects for the Greater Bay Area of Guangdong, Hong Kong and Macau.
Negotiations with potential interested parties are still ongoing at all levels. The group
plans to resubmit the revised plan to authorities before end-2019.
Maintain Add Our TP of RM0.88 is based on a 45% discount to RNAV. Maintain Add given the potential
value arising from its China ZIC upgrade and undemanding valuation of 0.56x FY20F
P/BV. LBS is poised to benefit from the Malaysian government’s focus on affordable
housing, as the majority of its products are priced below RM500,000. Key downside risks
are a deterioration in property market sentiment and lower-than-expected sales.
SOURCES: CGS-CIMB RESEARCH, COMPANY REPORTS
Malaysia
ADD (no change)
Consensus ratings*: Buy 5 Hold 2 Sell 0
Current price: RM0.53
Target price: RM0.88
Previous target: RM0.88
Up/downside: 65.9%
CGS-CIMB / Consensus: 15.3%
Reuters: LBSB.KL
Bloomberg: LBS MK
Market cap: US$195.9m
RM826.0m
Average daily turnover: US$0.15m
RM0.62m
Current shares o/s: 1,559m
Free float: 49.3% *Source: Bloomberg
Key changes in this note
No change.
Source: Bloomberg
Price performance 1M 3M 12M
Absolute (%) -0.9 2.9 -40.8
Relative (%) 2 4.7 -28.4
Major shareholders % held Tan Sri Lim Hock San 50.7 KWAP 11.6
Insert
Analyst(s)
NGO Siew Teng
T (60) 3 2261 9089 E [email protected]
Financial Summary Dec-17A Dec-18A Dec-19F Dec-20F Dec-21F
Total Net Revenues (RMm) 1,347 1,122 1,619 1,784 1,371
Operating EBITDA (RMm) 216.5 210.9 263.1 294.3 222.2
Net Profit (RMm) 100.7 85.1 78.7 95.5 71.7
Core EPS (RM) 0.069 0.036 0.051 0.062 0.046
Core EPS Growth (60.1%) (47.6%) 41.4% 21.3% (24.9%)
FD Core P/E (x) 4.59 15.12 10.47 8.63 11.49
DPS (RM) 0.082 0.018 0.015 0.018 0.014
Dividend Yield 15.5% 3.4% 2.9% 3.5% 2.6%
EV/EBITDA (x) 6.80 8.56 5.72 4.52 5.91
P/FCFE (x) NA NA 1.98 2.99 7.96
Net Gearing 43.9% 69.2% 36.0% 17.8% 12.6%
P/BV (x) 0.32 0.61 0.59 0.56 0.54
ROE 8.42% 3.88% 5.72% 6.64% 4.80%
CGS-CIMB/Consensus EPS (x) 0.96 1.04 0.87
62.0
75.3
88.7
102.0
0.400
0.600
0.800
1.000
Price Close Relative to FBMKLCI (RHS)
5
10
15
Aug-18 Nov-18 Mar-19 Jun-19
Vo
l m
27

Company Note Property Devt & Invt │ Malaysia │ August 30, 2019 Shariah Compliant
IMPORTANT DISCLOSURES, INCLUDING ANY REQUIRED RESEARCH CERTIFICATIONS, ARE PROVIDED AT THE END OF THIS REPORT. IF THIS REPORT IS DISTRIBUTED IN THE UNITED STATES IT IS DISTRIBUTED BY CGS-CIMB SECURITIES (USA), INC. AND IS CONSIDERED THIRD-PARTY AFFILIATED RESEARCH.
Powered by the EFA Platform
Insert Insert
Mah Sing Group Lining up RM1.5bn of new launches in 2H19
■ Mah Sing’s 1H19 core net profit came in below expectations due to weaker-than-expected sales recognised.
■ 1H19 new property sales of RM761m made up 51% of its FY19 sales target of RM1.5bn. Mah Sing plans to launch c.RM1.5bn new projects in 2H19.
■ Maintain Add with a TP of RM1.20, based on 35% discount to RNAV.
Key results highlights Mah Sing’s 1HFY19 core net profit came in below expectations, at 30% of our and
Bloomberg consensus full-year forecasts due to weaker-than-expected sales recognised.
1H19 core net profit (excluding the accrued distribution to perpetual sukuk holders and
forex movements) declined 41% yoy due to lower revenue (-21% yoy), as new sales
secured from its new projects have limited contribution during the initial stages of
construction.
1H19 new property sales at RM761m New property sales came in lower at RM761m in 1H19 vs. RM942m in 1H18 due to fewer
new launches, representing 51% of its FY19 sales target of RM1.5bn. As of 1H19, the
group had launched projects worth up to RM723m GDV vs. RM971m in 1H18 (Southville
City: RM141m, M Vertica Cheras: RM237m, M Aruna Rawang: RM45m, Meridin East:
RM286m and Sutera Avenue Saban: RM14m). Unbilled sales stood at RM1.65bn as of
end-Jun 2019 vs. RM2.6bn at end-Jun 2018, which translate into 0.7x FY18 revenue.
RM1.5bn worth of new launches in 2H19 Mah Sing plans to launch projects with a total gross development value (GDV) of
RM2.2bn in FY19F, which include launches for M Vertica Cheras, M Arisa Sentul,
Sensory Residence Southville City, Basil@M Aruna Rawang, Onyx Icon City Petaling
Jaya, and M Oscar Happy Garden in Klang Valley. The group remains on track to
achieve its FY19 sales target, in our opinion, given the more aggressive launches lined
up in 2H19 (c.RM1.5bn).
Maintain Add We adjust our FY19-21F EPS estimates to factor in the changes in project development
timelines (M Centura and M Vertica) and project launches. We remain positive on Mah
Sing given: (i) its net cash position to cater to future landbank acquisitions, (ii) that it
should benefit from the increasing focus on affordable housing by the government, and
(iii) its decent dividend yield of 4-5% for FY19-21F. Our TP of RM1.20, which is based on
a 35% discount to RNAV remains intact.
Key risks to our call Key risks to our Add call are a sudden deterioration in property market sentiment and
weaker-than-expected property sales.
SOURCES: CGS-CIMB RESEARCH, COMPANY REPORTS
Malaysia
ADD (no change)
Consensus ratings*: Buy 8 Hold 6 Sell 0
Current price: RM0.87
Target price: RM1.20
Previous target: RM1.20
Up/downside: 38.7%
CGS-CIMB / Consensus: 13.1%
Reuters: MAHS.KL
Bloomberg: MSGB MK
Market cap: US$497.9m
RM2,100m
Average daily turnover: US$0.24m
RM1.01m
Current shares o/s: 2,428m
Free float: 65.0% *Source: Bloomberg
Key changes in this note
FY19F EPS decreased by 17%.
FY20-21F EPS increased by 0.3-20%.
Source: Bloomberg
Price performance 1M 3M 12M Absolute (%) -5.5 -4.4 -26.7
Relative (%) -2.6 -1.9 -14.4
Major shareholders % held Tan Sri Leong Hoy Kum 35.0 EPF 9.9 Lembaga Tabung Haji 5.8
Insert
Analyst(s)
NGO Siew Teng
T (60) 3 2261 9089 E [email protected]
Financial Summary Dec-17A Dec-18A Dec-19F Dec-20F Dec-21F
Total Net Revenues (RMm) 2,916 2,193 2,079 1,913 1,832
Operating EBITDA (RMm) 496.5 383.3 336.4 388.8 397.4
Net Profit (RMm) 325.3 190.0 166.4 222.6 228.5
Core EPS (RM) 0.13 0.08 0.07 0.09 0.09
Core EPS Growth (8.7%) (40.5%) (12.4%) 33.7% 2.7%
FD Core P/E (x) 6.58 11.05 12.62 9.44 9.19
DPS (RM) 0.065 0.045 0.030 0.050 0.050
Dividend Yield 7.51% 5.20% 3.47% 5.78% 5.78%
EV/EBITDA (x) 5.73 7.25 7.57 5.03 4.00
P/FCFE (x) NA 8.66 5.75 3.00 4.01
Net Gearing (9.4%) (13.6%) (18.0%) (28.8%) (34.9%)
P/BV (x) 0.60 0.60 0.58 0.55 0.53
ROE 9.41% 5.47% 4.70% 6.02% 5.89%
% Change In Core EPS Estimates (16.8%) 0.3% 19.5%
CGS-CIMB/Consensus EPS (x) 0.86 1.08 0.97
82.0
88.3
94.5
100.8
107.0
0.800
0.900
1.000
1.100
1.200
Price Close Relative to FBMKLCI (RHS)
2
4
6
Aug-18 Nov-18 Mar-19 Jun-19
Vo
l m
28
Company Note Technology - Others │ Malaysia │ August 30, 2019 Shariah Compliant
IMPORTANT DISCLOSURES, INCLUDING ANY REQUIRED RESEARCH CERTIFICATIONS, ARE PROVIDED AT THE END OF THIS REPORT. IF THIS REPORT IS DISTRIBUTED IN THE UNITED STATES IT IS DISTRIBUTED BY CGS-CIMB SECURITIES (USA), INC. AND IS CONSIDERED THIRD-PARTY AFFILIATED RESEARCH.
Powered by the EFA Platform
Insert Insert
MY E.G. Services
3QFY19: Recruitment services have started
■ 9MFY9/19 net profit was below at 57% of our full-year forecast (67% of consensus). We expect a lower intake of new foreign workers in FY19F.
■ Recruitment of new foreign workers started on 1 Jul 2019. We believe MyEG already has orders to recruit more than 50,000 new foreign workers.
■ Remains an Add. We cut FY19F EPS by 10.1% as we expect a lower number of registered new foreign workers brought in by the company in FY19F.
Marginal rise in 9MFY19 net profit Although 9MFY19 revenue was up 8.8% yoy at RM357.1m, 9MFY19 net profit was only
up 0.7% yoy at RM174.9m. This was mainly due to higher tax charges in 9MFY19, likely
for non-deductible expense incurred. Services to help foreign workers renew working
permits was the company’s largest revenue contributor. No interim DPS was declared, in
line with our expectations.
Healthy balance sheet MyEG had RM37.3m net cash as at end-Jun 2019. With no major capex in the pipeline,
the company could raise its net dividend payout ratio in the near future. Currently, the
company’s dividend policy is to pay out 30% of its net profit annually.
Recruitment of NFWs has already started for MyEG Recruitment of new foreign workers (NFWs) started from 1 Jul this year. We previously
expected MyEG to register 50,000 NFW in FY19F. Although we understand that the
company has secured orders to recruit more than 50,000 NFWs since 1 Jul 2019, we
gather that the company may not be able to deliver all the 50,000 NFWs to customers by
end-Sep 2019 as there is still a shortage of NFWs coming into the country, especially
from Bangladesh. We understand that the Bangladesh government has yet to agree on a
new recruitment mechanism for Bangladeshi workers in Malaysia. However, we gathered
that this issue should be resolved over the next few months. Thus, we lower our forecast
to 20,000 NFWs for MyEG in FY19F.
Overseas operations could surprise next year? Its Bangladesh operations could become a major overseas earnings contributor over the
next few years if the VAT Monitoring project materialises. We are hopeful that MyEG will
sign the concession agreement with the government before the end of this year.
Remains an Add We cut our FY19F EPS by 10.1% as we lower our assumptions of NFW registrations for
MyEG. FY20-21F EPS is unchanged, and TP is still based on 21x 2020F P/E, a 40%
premium over the technology sector’s 2020F target P/E of 15x; the premium is to reflect
the potential of its overseas operations over the next few years. The stock remains an
Add. Higher NFW registrations is a potential re-rating catalyst while failure to register
NFWs in Malaysia this year is a key downside risk to our Add call.
SOURCES: CGS-CIMB RESEARCH, COMPANY REPORTS
Malaysia
ADD (no change)
Consensus ratings*: Buy 6 Hold 0 Sell 0
Current price: RM1.36
Target price: RM1.96
Previous target: RM1.96
Up/downside: 44.1%
CGS-CIMB / Consensus: 12.3%10.
Reuters: MYEG.KL
Bloomberg: MYEG MK
Market cap: US$1,124m
RM4,739m
Average daily turnover: US$6.92m
RM28.74m
Current shares o/s: 3,600m
Free float: 59.4% *Source: Bloomberg
Key changes in this note
FY19F EPS cut by 10.1%.
Source: Bloomberg
Price performance 1M 3M 12M
Absolute (%) -14.5 -0.7 -8.1
Relative (%) -11.6 1.1 4.3
Major shareholders % held Wong Thean Soon 40.6
Insert
Analyst(s)
Ivy NG Lee Fang, CFA
T (60) 3 2261 9073 E [email protected]
Financial Summary Sep-17A Sep-18A Sep-19F Sep-20F Sep-21F
Revenue (RMm) 371.6 564.6 505.0 566.2 580.5
Operating EBITDA (RMm) 233.8 311.2 308.4 351.5 359.5
Net Profit (RMm) 200.1 129.0 276.2 330.3 347.0
Core EPS (RM) 0.056 0.077 0.077 0.092 0.096
Core EPS Growth 40.5% 38.9% (0.6%) 19.6% 5.1%
FD Core P/E (x) 24.47 17.61 17.73 14.82 14.11
DPS (RM) 0.020 0.019 0.023 0.024 0.027
Dividend Yield 1.47% 1.40% 1.69% 1.76% 1.99%
EV/EBITDA (x) 20.93 15.77 15.30 12.82 11.94
P/FCFE (x) 38.55 19.26 19.15 16.39 15.96
Net Gearing (0.1%) 3.0% (22.9%) (39.1%) (48.6%)
P/BV (x) 8.85 8.62 6.43 4.93 3.96
ROE 42.0% 49.6% 41.5% 37.6% 31.1%
% Change In Core EPS Estimates (10.1%) 0.0% 0.0%
CGS-CIMB/Consensus EPS (x) 1.07 1.11 0.99
57
90
124
0.70
1.20
1.70
Price Close Relative to FBMKLCI (RHS)
100
200
300
400
Aug-18 Nov-18 Mar-19 Jun-19
Vo
l m
29
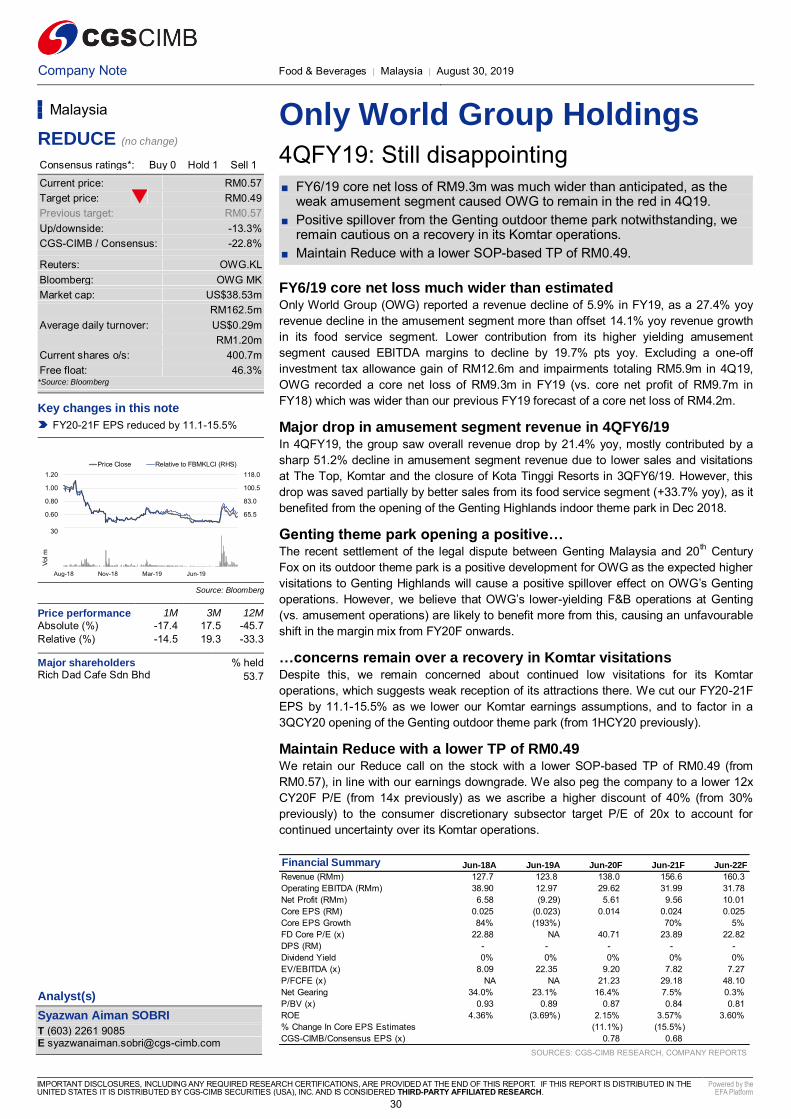
Company Note Food & Beverages │ Malaysia │ August 30, 2019
IMPORTANT DISCLOSURES, INCLUDING ANY REQUIRED RESEARCH CERTIFICATIONS, ARE PROVIDED AT THE END OF THIS REPORT. IF THIS REPORT IS DISTRIBUTED IN THE UNITED STATES IT IS DISTRIBUTED BY CGS-CIMB SECURITIES (USA), INC. AND IS CONSIDERED THIRD-PARTY AFFILIATED RESEARCH.
Powered by the EFA Platform
Insert Insert
Only World Group Holdings
4QFY19: Still disappointing
■ FY6/19 core net loss of RM9.3m was much wider than anticipated, as the weak amusement segment caused OWG to remain in the red in 4Q19.
■ Positive spillover from the Genting outdoor theme park notwithstanding, we remain cautious on a recovery in its Komtar operations.
■ Maintain Reduce with a lower SOP-based TP of RM0.49.
FY6/19 core net loss much wider than estimated Only World Group (OWG) reported a revenue decline of 5.9% in FY19, as a 27.4% yoy
revenue decline in the amusement segment more than offset 14.1% yoy revenue growth
in its food service segment. Lower contribution from its higher yielding amusement
segment caused EBITDA margins to decline by 19.7% pts yoy. Excluding a one-off
investment tax allowance gain of RM12.6m and impairments totaling RM5.9m in 4Q19,
OWG recorded a core net loss of RM9.3m in FY19 (vs. core net profit of RM9.7m in
FY18) which was wider than our previous FY19 forecast of a core net loss of RM4.2m.
Major drop in amusement segment revenue in 4QFY6/19 In 4QFY19, the group saw overall revenue drop by 21.4% yoy, mostly contributed by a
sharp 51.2% decline in amusement segment revenue due to lower sales and visitations
at The Top, Komtar and the closure of Kota Tinggi Resorts in 3QFY6/19. However, this
drop was saved partially by better sales from its food service segment (+33.7% yoy), as it
benefited from the opening of the Genting Highlands indoor theme park in Dec 2018.
Genting theme park opening a positive… The recent settlement of the legal dispute between Genting Malaysia and 20
th Century
Fox on its outdoor theme park is a positive development for OWG as the expected higher
visitations to Genting Highlands will cause a positive spillover effect on OWG’s Genting
operations. However, we believe that OWG’s lower-yielding F&B operations at Genting
(vs. amusement operations) are likely to benefit more from this, causing an unfavourable
shift in the margin mix from FY20F onwards.
…concerns remain over a recovery in Komtar visitations Despite this, we remain concerned about continued low visitations for its Komtar
operations, which suggests weak reception of its attractions there. We cut our FY20-21F
EPS by 11.1-15.5% as we lower our Komtar earnings assumptions, and to factor in a
3QCY20 opening of the Genting outdoor theme park (from 1HCY20 previously).
Maintain Reduce with a lower TP of RM0.49 We retain our Reduce call on the stock with a lower SOP-based TP of RM0.49 (from
RM0.57), in line with our earnings downgrade. We also peg the company to a lower 12x
CY20F P/E (from 14x previously) as we ascribe a higher discount of 40% (from 30%
previously) to the consumer discretionary subsector target P/E of 20x to account for
continued uncertainty over its Komtar operations.
SOURCES: CGS-CIMB RESEARCH, COMPANY REPORTS
Malaysia
REDUCE (no change)
Consensus ratings*: Buy 0 Hold 1 Sell 1
Current price: RM0.57
Target price: RM0.49
Previous target: RM0.57
Up/downside: -13.3%
CGS-CIMB / Consensus: -22.8%
Reuters: OWG.KL
Bloomberg: OWG MK
Market cap: US$38.53m
RM162.5m
Average daily turnover: US$0.29m
RM1.20m
Current shares o/s: 400.7m
Free float: 46.3% *Source: Bloomberg
Key changes in this note
FY20-21F EPS reduced by 11.1-15.5%
Source: Bloomberg
Price performance 1M 3M 12M
Absolute (%) -17.4 17.5 -45.7
Relative (%) -14.5 19.3 -33.3
Major shareholders % held Rich Dad Cafe Sdn Bhd 53.7
Insert
Analyst(s)
Syazwan Aiman SOBRI
T (603) 2261 9085 E [email protected]
Financial Summary Jun-18A Jun-19A Jun-20F Jun-21F Jun-22F
Revenue (RMm) 127.7 123.8 138.0 156.6 160.3
Operating EBITDA (RMm) 38.90 12.97 29.62 31.99 31.78
Net Profit (RMm) 6.58 (9.29) 5.61 9.56 10.01
Core EPS (RM) 0.025 (0.023) 0.014 0.024 0.025
Core EPS Growth 84% (193%) 70% 5%
FD Core P/E (x) 22.88 NA 40.71 23.89 22.82
DPS (RM) - - - - -
Dividend Yield 0% 0% 0% 0% 0%
EV/EBITDA (x) 8.09 22.35 9.20 7.82 7.27
P/FCFE (x) NA NA 21.23 29.18 48.10
Net Gearing 34.0% 23.1% 16.4% 7.5% 0.3%
P/BV (x) 0.93 0.89 0.87 0.84 0.81
ROE 4.36% (3.69%) 2.15% 3.57% 3.60%
% Change In Core EPS Estimates (11.1%) (15.5%)
CGS-CIMB/Consensus EPS (x) 0.78 0.68
48.0
65.5
83.0
100.5
118.0
0.40
0.60
0.80
1.00
1.20
Price Close Relative to FBMKLCI (RHS)
10
20
30
Aug-18 Nov-18 Mar-19 Jun-19
Vo
l m
30

Company Note Ind Goods & Services │ Malaysia │ August 31, 2019 Shariah Compliant
IMPORTANT DISCLOSURES, INCLUDING ANY REQUIRED RESEARCH CERTIFICATIONS, ARE PROVIDED AT THE END OF THIS REPORT. IF THIS REPORT IS DISTRIBUTED IN THE UNITED STATES IT IS DISTRIBUTED BY CGS-CIMB SECURITIES (USA), INC. AND IS CONSIDERED THIRD-PARTY AFFILIATED RESEARCH.
Powered by the EFA Platform
Insert Insert
Success Transformer Corp
All set to light up FY20
■ FY6/19 core net profit of RM17m was broadly in-line at 95% of our estimate.
■ Moving into FY20F, we expect STC to record strong earnings from higher street lighting sales, better economies of scale and lower losses from SEB.
■ Maintain Add, with an unchanged TP of RM1.39 (12x CY20 P/E).
4QFY6/19: Return to the black on a yoy basis While STC’s 4QFY6/19 revenue waned 6.7% yoy from lower transformer sales, its core
net profit rose to RM3.1m (>100% yoy) post adding back one-off losses of RM0.3m. This
was driven by better cost control and lower losses from its process equipment segment
(65% stake in SEB). On a qoq basis, 4QFY6/19 revenue and core net profit declined by
13.5% and 19.2%, respectively, due to larger losses from SEB (orderbook reduction) and
lower transformer sales from the earlier timing of Ramadan this year.
FY6/19 core net profit rose 133% yoy As a result of larger-than-expected losses from SEB in 4QFY19, FY6/19 core net profit
was 5% below our full-year forecast. Nevertheless, FY6/19 core net profit still rose 133%
yoy to RM17.1m, due to better sales of street lighting and transformers (which offer
higher margins) as well as better overall cost control efforts. This was also reflected in the
4.8 pts yoy gain in its FY19 EBITDA margins.
More opportunities to secure street lighting projects ahead Moving forward, STC is set to secure more orders for street lighting from domestic and
foreign clients. On the domestic front, STC should benefit from higher orders as the
Malaysian government is ramping up its efforts to replace street lights nationwide with
light-emitting diodes (LED). For export markets, STC is targeting to secure more
overseas orders from key markets such as Vietnam and Indonesia through more
aggressive marketing efforts, especially for its smart lighting products, Trimax and ILCS.
SEB to break even at the minimum in FY20 In FY20, we expect SEB (STC has a 55% stake) to breakeven at the bottomline from its
current loss-making position (FY19 core net loss of RM3.9m) through securing a larger
orderbook and ongoing efforts to rationalise its operating costs through better cost
management. We also note that SEB has secured more projects in the palm oil refinery
industry. We gather that these palm oil projects offer better profit margins.
Maintain Add, TP unchanged at RM1.39 We lower our FY20-21 EPS estimates by 0.1-0.5% on housekeeping matters while we
introduce our FY22 EPS estimates. Our TP remains at RM1.39, still based on 12x CY20F
P/E (3-year historical mean). We also like the stock’s supportive dividend yields of 4.3%
in FY20-22. Potential re-rating catalysts are: i) higher street lighting sales and ii) strong
profits from SEB. Downside risks: i) delay in public tenders for LED lights and ii) bigger
losses from SEB.
SOURCES: CGS-CIMB RESEARCH, COMPANY REPORTS
Malaysia
ADD (no change)
Consensus ratings*: Buy 1 Hold 0 Sell 0
Current price: RM0.94
Target price: RM1.39
Previous target: RM1.39
Up/downside: 48.0%
CGS-CIMB / Consensus: 0.1%
Reuters: SCCE.KL
Bloomberg: STC MK
Market cap: US$52.45m
RM220.6m
Average daily turnover: US$0.06m
RM0.26m
Current shares o/s: 248.5m
Free float: 43.0% *Source: Bloomberg
Key changes in this note
FY20-21F EPS lowered by 0.1-0.5% on
housekeeping matters.
Source: Bloomberg
Price performance 1M 3M 12M
Absolute (%) 2.2 12.6 27.9
Relative (%) 4.1 14.1 39.3
Major shareholders % held
Omega Attraction Sdn Bhd 45.0 CIMB-Principal Asset Management 6.4
FMR LLC 6.3
Insert
Analyst(s)
Walter AW
T (60) 3 2261 9093 E [email protected]
Financial Summary Jun-18A Jun-19A Jun-20F Jun-21F Jun-22F
Revenue (RMm) 326.1 318.8 396.1 452.1 488.2
Operating EBITDA (RMm) 32.37 40.08 52.10 62.38 70.54
Net Profit (RMm) 7.16 15.16 25.27 32.35 38.42
Core EPS (RM) 0.04 0.07 0.10 0.13 0.15
Core EPS Growth (87.2%) 72.7% 37.1% 28.0% 18.8%
FD Core P/E (x) 21.89 12.67 9.25 7.22 6.08
DPS (RM) 0.040 0.040 0.040 0.040 0.040
Dividend Yield 4.26% 4.26% 4.26% 4.26% 4.26%
EV/EBITDA (x) 7.93 6.23 4.76 3.93 3.26
P/FCFE (x) 65.14 7.95 13.45 36.75 12.39
Net Gearing (1.43%) (3.49%) (4.69%) (6.00%) (9.98%)
P/BV (x) 0.75 0.73 0.69 0.65 0.60
ROE 3.5% 5.8% 7.7% 9.3% 10.3%
% Change In Core EPS Estimates (0.453%) (0.060%)
CGS-CIMB/Consensus EPS (x) 1.02 1.00
69
92
114
137
159
0.40
0.60
0.80
1.00
1.20
Price Close Relative to FBMKLCI (RHS)
5
10
Aug-18 Dec-18 Mar-19 Jun-19
Vo
l m
31

Company Note Rubber Gloves │ Malaysia │ August 30, 2019 Shariah Compliant
IMPORTANT DISCLOSURES, INCLUDING ANY REQUIRED RESEARCH CERTIFICATIONS, ARE PROVIDED AT THE END OF THIS REPORT. IF THIS REPORT IS DISTRIBUTED IN THE UNITED STATES IT IS DISTRIBUTED BY CGS-CIMB SECURITIES (USA), INC. AND IS CONSIDERED THIRD-PARTY AFFILIATED RESEARCH.
Powered by the EFA Platform
HIGH
CONVICTION
Insert Insert
Supermax Corp
An unexpected blip
■ FY6/19 core net profit of RM117.3m was below expectations, at 91% of our and 89% of Bloomberg consensus' full-year estimates.
■ We expect stronger earnings ahead, on the back of: i) recovery in glove selling prices, ii) capacity expansion, and iii) better cost efficiencies.
■ Maintain Add, with lower TP of RM2.03 (18.8x CY20F P/E).
Weaker 4QFY19 due to higher latex prices and operating expenses 4QFY6/19 revenue rose 4.1% qoq, mainly from higher glove sales. Yet, 4QFY19 EBITDA
margin declined 8.8% pts qoq to 8.5% while net profit weakened to RM15.1m (-56.5%
qoq). We attribute the weaker qoq results to: i) higher latex prices (+23% qoq), ii) stiffer
pricing competition, and iii) higher operating costs. We suspect there was a longer-than-
expected time lag in adjusting selling prices of latex gloves upwards to fully pass on
higher latex prices. Note that SUCB’s glove sales mix is currently 52% nitrile: 48% latex.
FY6/19 core net profit rose 9.6% yoy; below expectations Due to the weaker-than-expected 4QFY19 results, FY19 core net profit came in below
expectations at 91% of our and 89% of Bloomberg consensus' full-year estimates. This
was despite SUCB posting a 14.2% yoy increase in FY19 revenue to RM1.5bn and 9.6%
yoy growth in FY19 core net profit to RM117m (excluding one-off RM6.5m gain from
insurance claims in 1QFY19). The stronger yoy results was driven by higher glove sales
from increased production output and better cost efficiencies.
Slight delay in commissioning its new plant, Plant 12 For its glove capacity expansion plans, Plant 12 will begin gradual commissioning in two
stages -- Stage A (2.2bn p.a.) to begin by 4Q19F (1QFY6/20F) and Stage B (+2.2bn p.a.)
by 2Q20F (3QFY20F), an estimated delay of 3 months due to slower civil works. With this
new plant, SUCB’s total glove production capacity will rise 20.3% to 26.2bn pieces p.a.
Stronger earnings ahead Moving forward, we expect SUCB to record stronger earnings, to be driven by: i) higher
selling prices of its latex gloves, ii) tailwinds from external environment (lower latex raw
material prices and weaker RM/US$), and iii) its capacity expansion. Nevertheless, we
lower our FY20-21F EPS by 10.6-12.5% to reflect: i) higher latex prices, and ii) 3-month
delay in commissioning of all its new glove plants. We also introduce our FY22 estimates.
Maintain Add, with lower TP of RM2.03 With the EPS cut, our TP dips to RM2.03, still based on 18.8x CY20F P/E (1 s.d. of 5yr
mean). We believe that at 13.8x CY20F P/E (51% discount to glove sector’s average of
24.8x), SUCB is undervalued, given its improved earnings outlook and strong 3-year EPS
CAGR of 18% (FY20-22F). Potential re-rating catalysts are stronger-than-expected
earnings delivery from its glove segment, and its contact lens segment turning profitable.
Downside risks: sharp rise in latex/nitrile raw material prices, stiffer pricing competition.
SOURCES: CGS-CIMB RESEARCH, COMPANY REPORTS
Malaysia
ADD (no change)
Consensus ratings*: Buy 7 Hold 2 Sell 0
Current price: RM1.49
Target price: RM2.03
Previous target: RM2.30
Up/downside: 36.2%
CGS-CIMB / Consensus: -0.8%
Reuters: SUPM.KL
Bloomberg: SUCB MK
Market cap: US$461.5m
RM1,946m
Average daily turnover: US$1.28m
RM5.48m
Current shares o/s: 1,360m
Free float: 62.5% *Source: Bloomberg
Key changes in this note
FY20-21F EPS lowered by 10.6-12.5%.
Source: Bloomberg
Price performance 1M 3M 12M
Absolute (%) -9.2 -9.2 -11.3
Relative (%) -7.3 -7.7 0.1
Major shareholders % held Dato' Seri Thai Kim Sim, Stanley 20.7 Datin Seri Tan Bee Geok, Cheryl 15.3 Amanah Saham Nasional 1.5
Insert
Analyst(s)
Walter AW
T (60) 3 2261 9093 E [email protected]
Financial Summary Jun-18A Jun-19A Jun-20F Jun-21F Jun-22F
Revenue (RMm) 1,304 1,489 1,761 2,029 2,314
Operating EBITDA (RMm) 211.7 230.6 271.8 308.4 340.1
Net Profit (RMm) 106.7 123.8 135.7 157.9 175.3
Core EPS (RM) 0.08 0.09 0.10 0.12 0.13
Core EPS Growth 58.7% 9.9% 15.7% 16.4% 11.0%
FD Core P/E (x) 19.00 17.29 14.94 12.84 11.56
DPS (RM) 0.040 0.039 0.045 0.052 0.036
Dividend Yield 2.68% 2.60% 3.01% 3.51% 2.42%
EV/EBITDA (x) 10.07 8.86 7.95 7.15 6.50
P/FCFE (x) 12.4 29.7 115.5 20.3 16.7
Net Gearing 28.5% 19.4% 27.5% 28.7% 26.1%
P/BV (x) 2.00 1.80 1.69 1.57 1.43
ROE 10.3% 11.0% 11.7% 12.7% 13.0%
% Change In Core EPS Estimates (12.5%) (10.6%)
CGS-CIMB/Consensus EPS (x) 0.88 0.92
82.0
93.3
104.5
115.8
127.0
1.30
1.50
1.70
1.90
2.10
Price Close Relative to FBMKLCI (RHS)
20
40
60
80
Aug-18 Nov-18 Mar-19 Jun-19
Vo
l m
32

Company Note Power │ Malaysia │ August 30, 2019 Shariah Compliant
IMPORTANT DISCLOSURES, INCLUDING ANY REQUIRED RESEARCH CERTIFICATIONS, ARE PROVIDED AT THE END OF THIS REPORT. IF THIS REPORT IS DISTRIBUTED IN THE UNITED STATES IT IS DISTRIBUTED BY CGS-CIMB SECURITIES (USA), INC. AND IS CONSIDERED THIRD-PARTY AFFILIATED RESEARCH.
Powered by the EFA Platform
Insert Insert
Tenaga Nasional
Higher dividend payout in store
■ 1H19 core net profit came in line at 55% of our and 54% of Bloomberg consensus full-year forecasts.
■ An interim DPS of 30 sen was declared, representing a dividend payout of 55%, beating our estimate of 50% dividend payout.
■ Maintain Add given the anticipated lower regulatory risk and its supportive dividend yield of 4%. TP remains at RM15.30.
1H19 core net profit lower on regulatory revenue adjustment Tenaga’s 1HFY19 core net profit (excluding RM198m impairment for GMR Energy India,
RM136m impairment of financial guarantee for GAMA Enerji Turkey, and RM9m forex
loss) came in within expectations, at 55% of our and 54% of Bloomberg consensus’ full
year forecasts. 1HFY19 core earnings declined 17% yoy, mainly due to the regulatory
revenue adjustments accounted for every month starting 2019 (2018’s revenue
adjustment was done in 4Q18) and higher interest expenses due to MFRS 16.
1H19 electricity demand rose 4.4% yoy In 1H19, Tenaga made a regulatory revenue adjustment of RM809.5m (1Q19: RM524m
and 2Q19: RM285.6m) to comply with the 2% allowable electricity demand growth,
capex/opex efficiency carry-over scheme (ECS) under the incentive-based framework
(IBR) regulatory period 2 (RP2, 2018-2020). 1HFY19 electricity demand grew 4.4% yoy
vs. an average growth rate of 2.5% for FY16-17 and 3.2% in FY18, supported by positive
growth in all segments.
Declared an interim DPS of 30 sen Tenaga declared an interim DPS of 30 sen (vs. 30.3 sen in 1H18) representing a
dividend payout of 55% (based on management’s adjusted earnings for one-off items),
above our 50% dividend payout assumption. Thus, we increase our FY19-21F dividend
payout estimates to 55% (previously 50%). Dividend yield remains decent at 4% for
FY19-21F.
Maintain Add We revise up our FY19-21F marginally by 0.1-0.4% to factor in the improving contribution
from its associates. We still like Tenaga as: (i) the regulatory risk from sector reforms
seems to be low, as it will likely maintain its monopoly in the transmission & distribution
(T&D) segment, and (ii) it is one of the cheapest big cap counters, with a decent dividend
yield of c.4% for FY19-21F. Our target price remains at RM15.30, still based on the
sector average FY20F P/E of 15x.
Key risks to our call Stronger-than-expected earnings from associates are a key potential re-rating catalyst.
The key downside risks are weaker contribution from associates and potential sector
reforms that significantly impact Tenaga’s earnings.
[Add FP Header] [Add FP BodyText]
#DO NOT Leave Any Unused Text, Para etc. below this Line! as it will appear in the Email
SOURCES: CGS-CIMB RESEARCH, COMPANY REPORTS
Malaysia
ADD (no change)
Consensus ratings*: Buy 16 Hold 7 Sell 0
Current price: RM13.80
Target price: RM15.30
Previous target: RM15.30
Up/downside: 10.9%
CGS-CIMB / Consensus: 2.4%
Reuters: TENA.KL
Bloomberg: TNB MK
Market cap: US$18,609m
RM78,479m
Average daily turnover: US$16.85m
RM70.11m
Current shares o/s: 5,687m
Free float: 43.3% *Source: Bloomberg
Key changes in this note
FY19-21F EPS increased by 0.1-0.4%
Source: Bloomberg
Price performance 1M 3M 12M
Absolute (%) 1.3 12 -12.1
Relative (%) 4.2 13.8 0.3
Major shareholders % held Khazanah Nasional Berhad 27.3 EPF 15.3 State Street Corp 14.1
Insert
Analyst(s)
NGO Siew Teng
T (60) 3 2261 9089 E [email protected]
Financial Summary Dec-17A Dec-18A Dec-19F Dec-20F Dec-21F
Revenue (RMm) 63,244 48,924 48,517 49,496 50,497
Operating EBITDA (RMm) 18,618 13,493 15,519 16,497 17,026
Net Profit (RMm) 9,660 3,724 5,476 5,784 5,797
Core EPS (RM) 1.68 0.91 0.96 1.02 1.02
Core EPS Growth 22.4% (45.6%) 5.4% 5.5% 0.2%
FD Core P/E (x) 8.20 15.09 14.32 13.57 13.54
DPS (RM) 0.90 0.53 0.53 0.56 0.56
Dividend Yield 6.52% 3.86% 3.84% 4.05% 4.06%
EV/EBITDA (x) 6.05 8.67 7.73 7.42 7.31
P/FCFE (x) 30.26 8.74 25.01 21.19 19.00
Net Gearing 63.1% 66.3% 68.2% 69.3% 69.7%
P/BV (x) 1.36 1.35 1.30 1.25 1.20
ROE 17.3% 9.0% 9.3% 9.4% 9.0%
% Change In Core EPS Estimates 0.444% 0.027% 0.147%
CGS-CIMB/Consensus EPS (x) 0.98 1.00 0.99
82.0
89.1
96.3
103.4
10.00
12.00
14.00
16.00
Price Close Relative to FBMKLCI (RHS)
10
20
30
Aug-18 Nov-18 Mar-19 Jun-19
Vo
l m
33

Company Note Conglomerate │ Malaysia │ August 30, 2019
IMPORTANT DISCLOSURES, INCLUDING ANY REQUIRED RESEARCH CERTIFICATIONS, ARE PROVIDED AT THE END OF THIS REPORT. IF THIS REPORT IS DISTRIBUTED IN THE UNITED STATES IT IS DISTRIBUTED BY CGS-CIMB SECURITIES (USA), INC. AND IS CONSIDERED THIRD-PARTY AFFILIATED RESEARCH.
Powered by the EFA Platform
Insert Insert
YTL Corporation Construction earnings at inflection point
■ FY6/19 results were below expectations; core net profit declined 37% yoy.
■ Construction was the key outperformer with an almost doubling of profits.
■ Hold maintained with a lower TP; supported by 4.1-4.5% dividend yields.
FY6/19 results below expectations; full-year DPS of 4 sen FY19 core net profit declined 37.3% yoy. While full-year revenue grew at a decent 13.2%
yoy, which was also contributed by the consolidation of Lafarge in 4Q19, operating cost
rose 22% yoy, which led to a 5.4% pts slippage in EBITDA margin to 22%. FY19 results
were below expectations, making up 80-86% of our and consensus full-year forecasts.
The deviation came from weaker utilities and property/REIT segments, though the
outperformer was the almost doubling of construction earnings due to strong billings. Full-
year DPS of 4 sen (FY18: 4 sen) was broadly in line.
Construction earnings jumped 99% yoy in FY19 Construction revenue surged 216% yoy in FY19 due to higher progress of the RM8.9bn
Gemas-JB electrified rail double-tracking project. Pretax profit surged 99%, though pretax
margin stood at a low of 7% (FY18: 10%) as progress is in the relatively early stages.
The good news is that FY19 cement segment revenue grew 2% (partial consolidation
impact) but with lower pretax margin of 5% (FY18: 7%). The utilities division’s pretax
profit declined 48% yoy due to higher finance cost and impairments.
Stake in YTL Land rises to 81%; deal extended to 20 Sep The closing date for the acceptance of YTL Corp’s proposed privatisation of YTL Land via
a share swap deal has been extended from 30 Aug to 20 Sep. Recall that YTL Corp will
acquire the remaining 34.7% stake in YTL Land at RM0.36/YTL Land share. This deal
will see YTL Corp issuing 91m new shares at a swap ratio of 0.32. Since the launch of
the offer, YTL Corp’s stake in YTL Land has risen from 65.3% to 81.4% (as at 27 Aug).
Cutting FY20-21F EPS by 12-20% Post-FY6/19 performance, we now assume 1) lower gross margin for its multi-utilities
business, 2) weaker cement earnings due to the consolidation of Lafarge’s losses, 3)
lower construction margins, and 4) higher operating costs. We cut FY20-21F EPS by 12-
20% which also reflects the larger share base from the issuance of shares.
Maintain Hold with lower TP We maintain Hold but cut our TP from RM1.13 to RM1.01 as we apply a higher RNAV
discount of 40% (30% previously) as we expect limited medium-term share price
catalysts. Potential overhang on the share price could arise from the pending turnaround
of Lafarge via a cement price hike and the review of the KL-Singapore HSR project which
is due in May 2020, presenting a potential large-scale tender for YTL Corp and upside
risks to share price. Maintain Hold. Downside risk is weaker earnings.
SOURCES: CGS-CIMB RESEARCH, COMPANY REPORTS
Malaysia
HOLD (no change)
Consensus ratings*: Buy 0 Hold 2 Sell 1
Current price: RM0.98
Target price: RM1.01
Previous target: RM1.13
Up/downside: 3.1%
CGS-CIMB / Consensus: -6.9%
Reuters: YTLS.KL
Bloomberg: YTL MK
Market cap: US$2,454m
RM10,348m
Average daily turnover: US$0.51m
RM2.14m
Current shares o/s: 10,739m
Free float: 43.8% *Source: Bloomberg
Key changes in this note
FY20F EPS cut by 20%
FY21F EPS cut by 12%
Source: Bloomberg
Price performance 1M 3M 12M Absolute (%) -9.7 -10.6 -26.7
Relative (%) -6.8 -8.8 -14.3
Major shareholders % held Yeoh Tiong Lay & Sons 49.9 EPF 6.3
Insert
Analyst(s)
Sharizan ROSELY
T (60) 3 2261 9077 E [email protected]
Financial Summary Jun-18A Jun-19A Jun-20F Jun-21F Jun-22F
Revenue (RMm) 15,890 17,995 17,874 17,979 18,087
Operating EBITDA (RMm) 2,307 2,019 3,047 3,182 3,256
Net Profit (RMm) 340.9 258.8 445.5 530.1 572.0
Core EPS (RM) 0.032 0.024 0.041 0.048 0.052
Core EPS Growth (25.0%) 72.1% 19.0% 7.9%
FD Core P/E (x) 30.93 41.27 23.98 20.15 18.67
DPS (RM) 0.050 0.040 0.040 0.042 0.044
Dividend Yield 5.13% 4.10% 4.10% 4.31% 4.51%
EV/EBITDA (x) 19.09 24.08 16.06 15.46 15.20
P/FCFE (x) 47.48 NA NA NA NA
Net Gearing 133% 154% 149% 141% 135%
P/BV (x) 0.77 0.80 0.78 0.75 0.73
ROE 2.49% 1.90% 3.29% 3.81% 3.95%
% Change In Core EPS Estimates (19.9%) (12.4%)
CGS-CIMB/Consensus EPS (x) 0.95 0.99
79.0
85.0
91.0
97.0
103.0
109.0
0.900
1.000
1.100
1.200
1.300
1.400
Price Close Relative to FBMKLCI (RHS)
20
40
60
Aug-18 Nov-18 Mar-19 Jun-19
Vo
l m
34

Sector Note Financial Services │ Singapore │ August 30, 2019
IMPORTANT DISCLOSURES, INCLUDING ANY REQUIRED RESEARCH CERTIFICATIONS, ARE PROVIDED AT THE END OF THIS REPORT. IF THIS REPORT IS DISTRIBUTED IN THE UNITED STATES IT IS DISTRIBUTED BY CGS-CIMB SECURITIES (USA), INC. AND IS CONSIDERED THIRD-PARTY AFFILIATED RESEARCH.
Powered by the EFA Platform
Banks
Domestic growth not holding up
■ Industry loan growth stayed lacklustre at +0.2% mom/+4.4% yoy in Jul 2019 as regional loan growth offset the 0.9% mom contraction of domestic credit.
■ Domestic mortgages contracted for a 6th consecutive month, but we think that
increased Jul sales volumes could be indicative of better 2H19 growth.
■ Singapore could see five new digital bank licences awarded come mid-2020. Catering to the underserved segment in SG is MAS’s key assessment factor.
■ Maintain Neutral. Key downside risks are more Fed rate cuts, but c.5% yields and attractive valuations are key support pillars for the sector. Prefer UOB.
Lacklustre Jul statistics in line with lower GDP forecast The industry’s (DBU+ACU) +0.2% mom/+4.4% yoy loan growth was held up by regional
expansion as the domestic business and consumer segments contracted. The
contraction came amid a revision in Singapore’s 2019 GDP growth forecast to 0.0-1.0%
(from 1.5-2.5% previously) by the MTI on the back of weakened global economic growth.
Aside from the decline in loans to FIs, DBU (mainly SG-based) trade-related segments
such as manufacturing and general commerce recorded the largest decline this month.
Stronger 2Q19 home sales should spur mortgage growth in 2H19 Domestic mortgage growth declined for a 6
th consecutive month (-0.2% mom, -0.8% yoy).
Broadly, the banks reported shrinking mortgage bases in 1H19 on the back of weaker
sales volumes, particularly in the secondary market (its effects are more acute given the
quicker drawdown of loans). That said, we are optimistic of seeing better mortgage
growth in 2H19 given the 37% qoq rise in resale transaction values (excluding ECs,
executive condominiums) in 2Q19, according to Urban Redevelopment Authority data.
Primary home sales (excluding ECs) were also encouraging, having rebounded +29%
qoq in 2Q19 (from 3-16% qoq contractions in the past 3 quarters).
Deposit growth still fuelled by FDs despite lower rates DBU deposits expanded a touch slower at +0.3% mom and +8.0% yoy in Jul 2019. Fixed
deposits (FDs) fuelled the rise (+2.7% mom) at the expense of CASA once again (-1.3%
mom) despite the slight reduction in FD rates following the Fed rate cut at end-Jul. We
expect these rates to decline further as funding pressures ease in tandem with weaker
growth sentiment, cushioning the effect of lower rates on NIMs to some extent.
MAS: Digital banks in SG to cater to the underserved segment Applications are open for digital bank licences, but the MAS’s key criteria for applicants is
a value proposition that caters to the underserved segment in Singapore – a space not
currently catered to by the incumbents. DBS and UOB have already established their
virtual presences with Digibank and TMRW. With the licences being opened up to non-
bank players, we believe a digital bank partnership is likely to be in the works for OCBC.
Figure 1: FD rates have started trending downwards in line with the Fed rate cut in Jul
2019. We believe that these rates should slide further as domestic rates decline.
SOURCES: CGS-CIMB RESEARCH, COMPANY REPORTS
Singapore
Neutral (no change)
Highlighted Companies
DBS Group HOLD, TP S$27.59, S$24.53 close
Corporate loan drawdowns should support DBS’s mid-single-digit loan growth target in FY19. The bank expects mortgage growth to pick up in 2H19 on higher bookings, although yoy growth could be flattish.
OCBC HOLD, TP S$12.53, S$10.65 close
Customers expanding overseas and drawdowns relating to en bloc transactions had held up OCBC’s loan growth in the past quarter. We believe corporate demand could be the supporting factor for growth in 2H19.
United Overseas Bank ADD, TP S$29.54, S$24.96 close
UOB’s 4.2% 1H19 loan growth is the strongest amongst peers. The bank now projects high-single-digit growth for FY19. UOB’s ASEAN focus could see it benefiting the most from the potential diversion of production facilities out of Greater China.
Summary Valuation Metrics
Insert
Analyst(s)
Andrea CHOONG
T (65) 6210 8672
LIM Siew Khee T (65) 6210 8664 E [email protected]
P/E (x) Dec-19F Dec-20F Dec-21F
DBS Group 10.25 10.34 9.98
OCBC 9.60 9.66 9.27
United Overseas Bank 9.60 9.48 9.14
P/BV (x) Dec-19F Dec-20F Dec-21F
DBS Group 1.27 1.20 1.13
OCBC 1.07 1.01 0.95
United Overseas Bank 1.04 0.99 0.93
Dividend Yield Dec-19F Dec-20F Dec-21F
DBS Group 4.89% 4.89% 4.89%
OCBC 4.69% 4.69% 4.69%
United Overseas Bank 5.01% 5.01% 5.01%
% p.a. Tenure % p.a. Tenure % p.a. Tenure % p.a. Tenure
DBS^ 0.95 12 mth 1.40 # 12 mth 1.40 12 mth 1.40 # 12 mth
OCBC 1.65 12 mth 1.75 # 12 mth 1.65 12 mth 1.60 # 12 mth
UOB 1.65 10 mth 1.75 # 10 mth 1.70 10 mth 1.60 # 10 mth
1.90 13 mth
HSBC 1.80 12 mth 1.55#
# 6 mth 1.60 6 mth 1.60 # 6 mth
1.65#
12 mth 1.70 12 mth 1.70 # 12 mth
Citibank 1.58 6 mth 1.78@
1 6 mth n.a. n.a.
Standard Chartered+
1.75 12 mth 1.75#
10 mth 1.90 12 mth 1.70#
7 mth
Maybank 1.88 12 mth 2.05 # 12 mth 2.00 12 mth 2.10 # 9 mth
CIMB 1.90 12 mth 1.90 # 12 mth 1.90 12 mth 1.85 # 12 mth
Note: Please refer to page 4 for complete table and footnotes.
20 Dec 2019 22 Mar 2019 6 May 2019 26 Aug 2019
35

Company Note Oil & Gas Refinery │ Thailand │ August 30, 2019 Shariah Compliant
IMPORTANT DISCLOSURES, INCLUDING ANY REQUIRED RESEARCH CERTIFICATIONS, ARE PROVIDED AT THE END OF THIS REPORT. IF THIS REPORT IS DISTRIBUTED IN THE UNITED STATES IT IS DISTRIBUTED BY CGS-CIMB SECURITIES (USA), INC. AND IS CONSIDERED THIRD-PARTY AFFILIATED RESEARCH.
Powered by the EFA Platform
Insert Insert
Thai Oil Strong GRM rebound in 2H19F
■ TOP’s market GRM should bounce to US$5.3/bbl in 3Q19F, up 103% qoq.
■ Diesel forward crack spread has reflected optimism towards IMO2020.
■ Better benzene prices could partly offset weaker paraxylene prices in 3Q19F.
Remarkable GRM recovery seen in 3Q19-to-date Singapore gross refining margin (S-GRM) was strong in Jul 19 at US$6.8/bbl on tighter
supply of fuel oil and gasoline. As TOP has lower gasoline and fuel oil yields than S-GRM
benchmark, its market GRM in Jul 19 was at US$1.8/bbl discount to S-GRM. However,
diesel crack spread has already rebounded strongly to US$15.5/bbl in Aug 19 while fuel
oil crack spread has turned negative. Given that TOP has high middle distillate (diesel
and jet fuel) yield of 56% vs. S-GRM of 35%, its market GRM improved to US$5.5/bbl in
Aug 19 vs. US$5.0/bbl in Jul 19. If the trend continues, we estimate that TOP’s market
GRM in 3Q19F should reach US$5.3/bbl vs. a mere US$2.6/bbl in 2Q19.
Diesel crack spread to improve over 2H19F Thanks to the restocking demand ahead of International Maritime Organisation's (IMO)
sulphur cap regulation change effective 1 Jan 2020 (IMO2020), diesel forward crack
spread curve as at Aug 19 has improved to US$16.1-17.6/bbl over 3Q-4Q19 vs.
US$15.1-16.6/bbl as at Jul 19. We believe diesel supply pressure from China should still
persist but the volume growth should be slower going forward. The new refinery start-ups
in China slated for 2H19 will not lead to sharp rise in refined product exports as nearly
50% of the new capacity's product yield is full-range naphtha for chemical integration.
Diversifying crude oil mix TOP has gradually replaced Murban crude oil with other light crude such as Upper
Zakuum and Das from the Middle East which could be cheaper opportunistically. TOP is
also buying more crude oil from the US as it could be cheaper when supply glut starts in
4Q19F. US crude oil contribution to TOP’s total crude intake rose from 0.3% in 2016 to
5.7% in 1H19. TOP said it could use US crude for up to 20% of its total crude oil intake.
Short-term support from benzene (BZ) Paraxylene (PX) prices remained under pressure in Jul-Aug 19 at US$830-850/t due to
new supply glut from China. Using time-weighted capacity, supply growth should reach
4.1mtpa vs. demand growth of less than 2.0mtpa. Given that BZ-ULG95 spread has
recovered from the bottom level of -US$12/t in 2Q19 to US$45/t during 3Q19-to-date, we
believe TOP should still be able to generate positive EBITDA in 2H19F.
Quarterly net profit already hit bottom in 2Q19 We believe TOP’s quarterly earnings already hit bottom in 2Q19. Excluding earnings
volatility from inventory stock/gain loss, we estimate that TOP should be able to report
core net profit of THB1.8bn in 3Q19F and THB3.0bn in 4Q19F vs. a mere THB567m in
2Q19. We maintain our Add call on TOP as it is a prime beneficiary of IMO2020 while its
FY20F P/BV remains undemanding at 0.9x vs. ROE of 11.9%.
SOURCES: CGS-CIMB RESEARCH, COMPANY REPORTS
Thailand
ADD (no change)
Consensus ratings*: Buy 23 Hold 3 Sell 3
Current price: THB68.00
Target price: THB77.00
Previous target: THB77.00
Up/downside: 13.2%
CGS-CIMB / Consensus: 3.8%
Reuters: TOP.BK
Bloomberg: TOP TB
Market cap: US$4,529m
THB138,722m
Average daily turnover: US$27.13m
THB837.5m
Current shares o/s: 2,040m
Free float: 44.6% *Source: Bloomberg
Key changes in this note
No change.
Source: Bloomberg
Price performance 1M 3M 12M Absolute (%) -2.2 14.8 -19.8
Relative (%) 2.4 13.6 -15
Major shareholders % held PTT Plc 48.0 State Street Europe 3.3 Social Security Office 1.6
Insert
Analyst(s)
Amornrat CHEEVAVICHAWALKUL
T (66) 2 761 9228 E [email protected]
Financial Summary Dec-17A Dec-18A Dec-19F Dec-20F Dec-21F
Revenue (THBm) 337,388 389,344 335,634 369,810 375,293
Operating EBITDA (THBm) 36,729 20,698 23,349 33,615 33,156
Net Profit (THBm) 24,856 10,149 10,573 14,520 15,729
Core EPS (THB) 11.12 4.72 5.18 7.12 7.71
Core EPS Growth 9.0% (57.6%) 9.9% 37.3% 8.3%
FD Core P/E (x) 6.11 14.42 13.12 9.55 8.82
DPS (THB) 5.25 2.65 2.23 3.06 3.32
Dividend Yield 7.72% 3.90% 3.28% 4.50% 4.88%
EV/EBITDA (x) 3.48 6.20 6.53 6.19 7.32
P/FCFE (x) NA 4.20 NA 16.82 NA
Net Gearing (1.2%) (0.2%) 18.8% 57.4% 78.1%
P/BV (x) 1.13 1.14 1.09 1.02 0.96
ROE 19.8% 7.9% 8.5% 11.0% 11.2%
CGS-CIMB/Consensus EPS (x) 1.04 1.04 1.11
71.0
82.4
93.9
105.3
56.0
66.0
76.0
86.0
Price Close Relative to SET (RHS)
20
40
60
Aug-18 Nov-18 Mar-19 Jun-19
Vo
l m
36

Asia Pacific Daily | Equity Research | September 2, 2019
7
REGIONAL HEAD
Bertram LAI Regional Head of Research +852 2532 1111
COUNTRY HEADS OF RESEARCH
Ivy NG, CFA Siew Khee, LIM Erwan TEGUH Kasem PRUNRATANAMALA, CFA Raymond CHENG Malaysia Singapore Indonesia Thailand Hong Kong/China +60 (3) 2261-9073 +65 6210-8664 +62 (21) 3006-1720 +66 (2) 657-9221 +852 2539-1324 [email protected] [email protected] [email protected] [email protected] [email protected] KJ Hwang Pramod AMTHE South Korea India +82 (2) 6730-6123 +91 (22) 4880-5167 [email protected] [email protected]
Yolan SEIMON Anirban LAHIRI
Sri Lanka Vietnam +94 (11) 230-6273 +8428 7300-0688 (ext: 21242) [email protected] [email protected] Coverage via partnership arrangement with John
Keells Stock Brokers
Coverage via partnership arrangement with
VNDirect Securities Corporation
REGIONAL SECTOR HEADS
KJ KWANG Ivy NG, CFA Raymond YAP, CFA Offshore & Marine Plantations Transportation +82 (2) 6730-6123 +60 (3) 2261-9073 +60 (3) 2261-9072 [email protected] [email protected] [email protected]
37

Asia Pacific Daily | Equity Research | September 2, 2019
8
DISCLAIMER The content of this report (including the views and opinions expressed therein, and the information comprised therein) has been prepared by and belongs to CGS-CIMB save that (i) if it is a report written by the analyst(s) of John Keells Stock Brokers (“John Keells”), it belongs to John Keells; (ii) if it is a report written by the analyst(s) of SB Equities Inc (“SBE”), it belongs to SBE; and (iii) if it is a report written by the analyst(s) of Morgans Financial Limited (“Morgans”), it belongs to Morgans. This report is distributed by CGS-CIMB, and in respect of sections of the report relating to (i), (ii) and/or (iii) aforesaid, it is distributed pursuant to an arrangement between CGS-CIMB and John Keells, SBE and Morgans respectively and none of the aforesaid parties is an affiliate of CGS-CIMB.
This report is not directed to, or intended for distribution to or use by, any person or entity who is a citizen or resident of or located in any locality, state, country or other jurisdiction where such distribution, publication, availability or use would be contrary to law or regulation.
By accepting this report, the recipient hereof represents and warrants that he is entitled to receive such report in accordance with the restrictions set forth below and agrees to be bound by the limitations contained herein (including the “Restrictions on Distributions” set out below). Any failure to comply with these limitations may constitute a violation of law. This publication is being supplied to you strictly on the basis that it will remain confidential. No part of this report may be (i) copied, photocopied, duplicated, stored or reproduced in any form by any means or (ii) redistributed or passed on, directly or indirectly, to any other person in whole or in part, for any purpose without the prior written consent of CGS-CIMB.
The information contained in this research report is prepared from data believed to be correct and reliable at the time of issue of this report. CGS-CIMB, John Keells, SBE and/or Morgans, as the case may be, may or may not issue regular reports on the subject matter of this report at any frequency and may cease to do so or change the periodicity of reports at any time. None of CGS-CIMB, John Keells, SBE or Morgans is under any obligation to update this report in the event of a material change to the information contained in this report. None of CGS-CIMB, John Keells, SBE or Morgans has any and none of them will accept any, obligation to (i) check or ensure that the contents of this report remain current, reliable or relevant, (ii) ensure that the content of this report constitutes all the information a prospective investor may require, (iii) ensure the adequacy, accuracy, completeness, reliability or fairness of any views, opinions and information, and accordingly, CGS-CIMB, John Keells, SBE and Morgans and their respective affiliates and related persons including China Galaxy International Financial Holdings Limited (“CGIFHL”) and CIMB Group Sdn. Bhd. (“CIMBG”) and their respective related corporations (and their respective directors, associates, connected persons and/or employees) shall not be liable in any manner whatsoever for any consequences (including but not limited to any direct, indirect or consequential losses, loss of profits and damages) of any reliance thereon or usage thereof. In particular, CGS-CIMB, John Keells, SBE and Morgans disclaim all responsibility and liability for the views and opinions set out in this report.
Unless otherwise specified, this report is based upon reasonable sources. Such sources will, unless otherwise specified, for market data, be market data and prices available from the main stock exchange or market where the relevant security is listed, or, where appropriate, any other market. Information on the accounts and business of company(ies) will generally be based on published statements of the company(ies), information disseminated by regulatory information services, other publicly available information and information resulting from our research.
Whilst every effort is made to ensure that statements of facts made in this report are accurate, all estimates, projections, forecasts, expressions of opinion and other subjective judgments contained in this report are based on assumptions considered to be reasonable as of the date of the document in which they are contained and must not be construed as a representation that the matters referred to therein will occur. Past performance is not a reliable indicator of future performance. The value of investments may go down as well as up and those investing may, depending on the investments in question, lose more than the initial investment. No report shall constitute an offer or an invitation by or on behalf of CGS-CIMB, John Keells, SBE or Morgans or their respective affiliates (including CGIFHL, CIMBG and their respective related corporations) to any person to buy or sell any investments.
CGS-CIMB, John Keells, SBE and/or Morgans and/or their respective affiliates and related corporations (including CGIFHL, CIMBG and their respective related corporations), their directors, associates, connected parties and/or employees may own or have positions in securities of the company(ies) covered in this research report or any securities related thereto and may from time to time add to or dispose of, or may be materially interested in, any such securities. Further, CGS-CIMB, John Keells, SBE and/or Morgans and/or their respective affiliates and related corporations (including CGIFHL, CIMBG and their respective related corporations) do and seek to do business with the company(ies) covered in this research report and may from time to time act as market maker or have assumed an underwriting commitment in securities of such company(ies), may sell them to or buy them from customers on a principal basis and may also perform or seek to perform significant investment banking, advisory, underwriting or placement services for or relating to such company(ies) as well as solicit such investment, advisory or other services from any entity mentioned in this report.
CGS-CIMB, John Keells, SBE and/or Morgans and/or their respective affiliates (including CGIFHL, CIMBG and their respective related corporations) may enter into an agreement with the company(ies) covered in this report relating to the production of research reports. CGS-CIMB, John Keells, SBE and/or Morgans may disclose the contents of this report to the company(ies) covered by it and may have amended the contents of this report following such disclosure.
The analyst responsible for the production of this report hereby certifies that the views expressed herein accurately and exclusively reflect his or her personal views and opinions about any and all of the issuers or securities analysed in this report and were prepared independently and autonomously. No part of the compensation of the analyst(s) was, is, or will be directly or indirectly related to the inclusion of specific recommendations(s) or view(s) in this report. The analyst(s) who prepared this research report are prohibited from receiving any compensation, incentive or bonus based on specific investment banking transactions or for providing a specific recommendation for, or view of, a particular company. Information barriers and other arrangements may be established where necessary to prevent conflicts of interests arising. However, the analyst(s) may receive compensation that is based on his/their coverage of company(ies) in the performance of his/their duties or the performance of his/their recommendations and the research personnel involved in the preparation of this report may also participate in the solicitation of the businesses as described above. In reviewing this research report, an investor should be aware that any or all of the foregoing, among other things, may give rise to real or potential conflicts of interest. Additional information is, subject to the duties of confidentiality, available on request.
The term “John Keells Stock Brokers” shall, unless the context otherwise requires, mean each of John Keells Stock Brokers and its affiliates, subsidiaries and related corporations. The term “SB Equities Inc.” shall, unless the context otherwise requires, mean each of SB Equities Inc. and its
38

Asia Pacific Daily | Equity Research | September 2, 2019
9
affiliates, subsidiaries and related corporations. The term “Morgans Financial Limited” shall, unless the context otherwise requires, mean each of Morgans Financial Limited and its affiliates, subsidiaries and related corporations. The term “CGS-CIMB” shall denote, where appropriate, the relevant entity distributing or disseminating the report in the particular jurisdiction referenced below, or, in every other case except as otherwise stated herein, CGS-CIMB Securities International Pte. Ltd. and its affiliates, subsidiaries and related corporations.
CGS-CIMB Country CGS-CIMB Entity Regulated by Hong Kong CGS-CIMB Securities (Hong Kong) Limited Securities and Futures Commission Hong Kong India CGS-CIMB Securities (India) Private Limited Securities and Exchange Board of India (SEBI) Indonesia PT CGS-CIMB Sekuritas Indonesia Financial Services Authority of Indonesia Malaysia CGS-CIMB Securities Sdn. Bhd. (formerly known as Jupiter
Securities Sdn. Bhd.) Securities Commission Malaysia
Singapore CGS-CIMB Research Pte. Ltd. Monetary Authority of Singapore South Korea CGS-CIMB Securities (Hong Kong) Limited, Korea Branch Financial Services Commission and Financial Supervisory Service Thailand CGS-CIMB Securities (Thailand) Co. Ltd. Securities and Exchange Commission Thailand
Information in this report is a summary derived from individual research reports. As such, readers are directed to the individual research report or note to review the individual Research Analyst’s full analysis of the subject company. Important disclosures relating to the companies that are the subject of research reports published by CGS-CIMB, John Keells, SBE or Morgans, as the case may be, and the proprietary position by each of them and shareholdings of its Research Analysts’ who prepared the report in the securities of the company(s) are available in the individual research report.
This report does not purport to contain all the information that a prospective investor may require. CGS-CIMB, John Keells, SBE and Morgans and their respective affiliates (including CGIFHL, CIMBG and their respective related corporations) do not make any guarantee, representation or warranty, express or implied, as to the adequacy, accuracy, completeness, reliability or fairness of any such information and opinion contained in this report. None of CGS-CIMB, John Keells, SBE, Morgans and their respective affiliates and related persons (including CGIFHL, CIMBG and their respective related corporations) shall be liable in any manner whatsoever for any consequences (including but not limited to any direct, indirect or consequential losses, loss of profits and damages) of any reliance thereon or usage thereof.
This report is general in nature and has been prepared for information purposes only. It is intended for circulation amongst CGS-CIMB’s and its affiliates’ (including CGIFHL’s, CIMBG’s and their respective related corporations’s) clients generally and does not have regard to the specific investment objectives, financial situation and the particular needs of any specific person who may receive this report. The information and opinions in this report are not and should not be construed or considered as an offer, recommendation or solicitation to buy or sell the subject securities, related investments or other financial instruments or any derivative instrument, or any rights pertaining thereto.
Investors are advised to make their own independent evaluation of the information contained in this research report, consider their own individual investment objectives, financial situation and particular needs and consult their own professional and financial advisers as to the legal, business, financial, tax and other aspects before participating in any transaction in respect of the securities of company(ies) covered in this research report.
The securities of such company(ies) may not be eligible for sale in all jurisdictions or to all categories of investors.
Restrictions on Distributions
Australia : The distribution of this report is not an offer to buy or sell to any person within or outside Australia or a solicitation to any person within or outside of Australia to buy or sell any instrument described herein. This report is being issued outside Australia to a limited number of institutional investors and may not be provided to any person other than the original recipient and may not be reproduced or used for any other purposes.
Canada: This research report has not been prepared in accordance with the disclosure requirements of Dealer Member Rule 3400 – Research Restrictions and Disclosure Requirements of the Investment Industry Regulatory Organization of Canada. For any research report distributed by CIBC, further disclosures related to CIBC conflicts of interest can be found at https://researchcentral.cibcwm.com .
China: For the purpose of this report, the People’s Republic of China (“PRC”) does not include the Hong Kong Special Administrative Region, the Macau Special Administrative Region or Taiwan. The distributor of this report has not been approved or licensed by the China Securities Regulatory Commission or any other relevant regulatory authority or governmental agency in the PRC. This report contains only marketing information. The distribution of this report is not an offer to buy or sell to any person within or outside PRC or a solicitation to any person within or outside of PRC to buy or sell any instruments described herein. This report is being issued outside the PRC to a limited number of institutional investors and may not be provided to any person other than the original recipient and may not be reproduced or used for any other purpose.
France: Only qualified investors within the meaning of French law shall have access to this report. This report shall not be considered as an offer to subscribe to, or used in connection with, any offer for subscription or sale or marketing or direct or indirect distribution of financial instruments and it is not intended as a solicitation for the purchase of any financial instrument.
Germany: This report is only directed at persons who are professional investors as defined in sec 31a(2) of the German Securities Trading Act (WpHG). This publication constitutes research of a non-binding nature on the market situation and the investment instruments cited here at the time of the publication of the information.
The current prices/yields in this issue are based upon closing prices from Bloomberg as of the day preceding publication. Please note that neither the German Federal Financial Supervisory Agency (BaFin), nor any other supervisory authority exercises any control over the content of this report.
Hong Kong: This report is issued by CGS-CIMB, John Keells, SBE or Morgans, as the case may be, and distributed in Hong Kong by CGS-CIMB Securities (Hong Kong) Limited (“CHK”) which is licensed in Hong Kong by the Securities and Futures Commission for Type 1 (dealing in securities), Type 4 (advising on securities) and Type 6 (advising on corporate finance) activities. Any investors wishing to purchase or otherwise deal in the securities covered in this report should contact the Head of Sales at CGS-CIMB Securities (Hong Kong) Limited. The views and opinions in this research report are of CGS-CIMB, John Keells, SBE or Morgans, as the case may be, as of the date hereof and are subject to change. If the Financial Services and Markets Act of the United Kingdom or the rules of the Financial Conduct Authority apply to a recipient , our obligations owed to such recipient therein are unaffected. CHK has no obligation to update the opinion or the information in this research report.
39

Asia Pacific Daily | Equity Research | September 2, 2019
10
This publication is strictly confidential and is for private circulation only to clients of CHK.
India: This report is issued by CGS-CIMB, John Keells, SBE or Morgans, as the case may be, and distributed in India by CGS-CIMB Securities (India) Private Limited (“CGS-CIMB India”). CGS-CIMB India is a subsidiary of CGS-CIMB Securities International Pte. Ltd. which in turn is a 50:50 joint venture company of CGIFHL and CIMBG. The details of the members of the group of companies of CGS-CIMB can be found at www.cgs-cimb.com, CGIFHL at www.chinastock.com.hk/en/ACG/ContactUs/index.aspx and CIMBG at www.cimb.com/en/who-we-are.html. CGS-CIMB India is registered with the National Stock Exchange of India Limited and BSE Limited as a trading and clearing member (Merchant Banking Number: INM000012037) under the Securities and Exchange Board of India (Stock Brokers and Sub-Brokers) Regulations, 1992. In accordance with the provisions of Regulation 4(g) of the Securities and Exchange Board of India (Investment Advisers) Regulat ions, 2013, CGS-CIMB India is not required to seek registration with the Securities and Exchange Board of India (“SEBI”) as an Investment Adviser. CGS-CIMB India is registered with SEBI (SEBI Registration Number: INZ000157134) as a Research Analyst (INH000000669) pursuant to the SEBI (Research Analysts) Regulations, 2014 ("Regulations").
This report does not take into account the particular investment objectives, financial situations, or needs of the recipients. It is not intended for and does not deal with prohibitions on investment due to law/jurisdiction issues etc. which may exist for certain persons/entities. Recipients should rely on their own investigations and take their own professional advice before investment.
The report is not a “prospectus” as defined under Indian Law, including the Companies Act, 2013, and is not, and shall not be, approved by, or filed or registered with, any Indian regulator, including any Registrar of Companies in India, SEBI, any Indian stock exchange, or the Reserve Bank of India. No offer, or invitation to offer, or solicitation of subscription with respect to any such securities listed or proposed to be listed in India is being made, or intended to be made, to the public, or to any member or section of the public in India, through or pursuant to this report.
The research analysts, strategists or economists principally responsible for the preparation of this research report are segregated from the other activities of CGS-CIMB India and they have received compensation based upon various factors, including quality, accuracy and value of research, firm profitability or revenues, client feedback and competitive factors. Research analysts', strategists' or economists' compensation is not linked to investment banking or capital markets transactions performed or proposed to be performed by CGS-CIMB India or its affiliates.
CGS-CIMB India does not have actual / beneficial ownership of 1% or more securities of the subject company in this research report, at the end of the month immediately preceding the date of publication of this research report. However, since affi liates of CGS-CIMB India are engaged in the financial services business, they might have in their normal course of business financial interests or actual / beneficial ownership of one per cent or more in various companies including the subject company in this research report.
CGS-CIMB India or its associates, may: (a) from time to time, have long or short position in, and buy or sell the securities of the subject company in this research report; or (b) be engaged in any other transaction involving such securities and earn brokerage or other compensation or act as a market maker in the financial instruments of the subject company in this research report or act as an advisor or lender/borrower to such company or may have any other potential conflict of interests with respect to any recommendation and other related information and opinions.
CGS-CIMB India, its associates and the analyst engaged in preparation of this research report have not received any compensation for investment banking, merchant banking or brokerage services from the subject company mentioned in the research report in the past 12 months.
CGS-CIMB India, its associates and the analyst engaged in preparation of this research report have not managed or co-managed public offering of securities for the subject company mentioned in the research report in the past 12 months. The analyst from CGS-CIMB India engaged in preparation of this research report or his/her relative (a) do not have any financial interests in the subject company mentioned in this research report; (b) do not own 1% or more of the equity securities of the subject company mentioned in the research report as of the last day of the month preceding the publication of the research report; (c) do not have any material conflict of interest at the time of publication of the research report
Indonesia: This report is issued by CGS-CIMB, John Keells, SBE or Morgans, as the case may be, and distributed by PT CGS-CIMB Sekuritas Indonesia (“CGS-CIMB Indonesia”). The views and opinions in this research report are those of the issuer of the report, as of the date hereof and are subject to change. CGS-CIMB Indonesia has no obligation to update the opinion or the information in this research report. This report is for private circulation only to clients of CGS-CIMB Indonesia. Neither this report nor any copy hereof may be distributed in Indonesia or to any Indonesian citizens wherever they are domiciled or to Indonesian residents except in compliance with applicable Indonesian capital market laws and regulations.
This research report is not an offer of securities in Indonesia. The securities referred to in this research report have not been registered with the Financial Services Authority (Otoritas Jasa Keuangan) pursuant to relevant capital market laws and regulations, and may not be offered or sold within the territory of the Republic of Indonesia or to Indonesian citizens through a public offering or in circumstances which constitute an offer within the meaning of the Indonesian capital market law and regulations.
Ireland: CGS-CIMB is not an investment firm authorised in the Republic of Ireland and no part of this document should be construed as CGS-CIMB acting as, or otherwise claiming or representing to be, an investment firm authorised in the Republic of Ireland.
Malaysia: This report is issued by CGS-CIMB, John Keells, SBE or Morgans, as the case may be, and distributed in Malaysia by CGS-CIMB Securities Sdn. Bhd. (formerly known as Jupiter Securities Sdn. Bhd.) (“CGS-CIMB Malaysia”) solely for the benefit of and for the exclusive use of our clients. Recipients of this report are to contact CGS-CIMB Malaysia, at 29th Floor Menara CIMB No. 1 Jalan Stesen Sentral 2, Kuala Lumpur Sentral 50470 Kuala Lumpur, Malaysia, in respect of any matters arising from or in connection with this report. CGS-CIMB Malaysia has no obligation to update, revise or reaffirm the opinion or the information in this research reports after the date of this report.
New Zealand: In New Zealand, this report is for distribution only to persons who are wholesale clients pursuant to section 5C of the Financial Advisers Act 2008.
Singapore: This report is issued by CGS-CIMB, John Keells, SBE or Morgans, as the case may be, and distributed by CGS-CIMB Research Pte Ltd (“CGS-CIMBR”). CGS-CIMBR is a financial adviser licensed under the Financial Advisers Act, Cap 110 (“FAA”) for advising on investment products, by issuing or promulgating research analyses or research reports, whether in electronic, print or other form. Accordingly CGS-CIMBR is a subject to the applicable rules under the FAA unless it is able to avail itself to any prescribed exemptions.
Recipients of this report are to contact CGS-CIMB Research Pte Ltd, 50 Raffles Place, #16-02 Singapore Land Tower, Singapore in respect of any matters arising from, or in connection with this report. CGS-CIMBR has no obligation to update the opinion or the information in this research report. This publication is strictly confidential and is for private circulation only. If you have not been sent this report by CGS-CIMBR directly, you may not
40

Asia Pacific Daily | Equity Research | September 2, 2019
11
rely, use or disclose to anyone else this report or its contents.
If the recipient of this research report is not an accredited investor, expert investor or institutional investor, CGS-CIMBR accepts legal responsibility for the contents of the report without any disclaimer limiting or otherwise curtailing such legal responsibility. If the recipient is an accredited investor, expert investor or institutional investor, the recipient is deemed to acknowledge that CGS-CIMBR is exempt from certain requirements under the FAA and its attendant regulations, and as such, is exempt from complying with the following :
(a) Section 25 of the FAA (obligation to disclose product information);
(b) Section 27 (duty not to make recommendation with respect to any investment product without having a reasonable basis where you may be reasonably expected to rely on the recommendation) of the FAA;
(c) MAS Notice on Information to Clients and Product Information Disclosure [Notice No. FAA-N03];
(d) MAS Notice on Recommendation on Investment Products [Notice No. FAA-N16];
(e) Section 36 (obligation on disclosure of interest in specified products), and
(f) any other laws, regulations, notices, directive, guidelines, circulars and practice notes which are relates to the above, to the extent permitted by applicable laws, as may be amended from time to time, and any other laws, regulations, notices, directive, guidelines, circulars, and practice notes as we may notify you from time to time. In addition, the recipient who is an accredited investor, expert investor or institutional investor acknowledges that as CGS-CIMBR is exempt from Section 27 of the FAA, the recipient will also not be able to file a civil claim against CGS-CIMBR for any loss or damage arising from the recipient’s reliance on any recommendation made by CGS-CIMBR which would otherwise be a right that is available to the recipient under Section 27 of the FAA, the recipient will also not be able to file a civil claim against CGS-CIMBR for any loss or damage arising from the recipient’s reliance on any recommendation made by CGS-CIMBR which would otherwise be a right that is available to the recipient under Section 27 of the FAA.
CGS-CIMBR, its affiliates and related corporations, their directors, associates, connected parties and/or employees may own or have positions in specified products of the company(ies) covered in this research report or any specified products related thereto and may from time to time add to or dispose of, or may be materially interested in, any such specified products. Further, CGS-CIMBR, its affiliates and its related corporations do and seek to do business with the company(ies) covered in this research report and may from time to time act as market maker or have assumed an underwriting commitment in specified products of such company(ies), may sell them to or buy them from customers on a principal basis and may also perform or seek to perform significant investment banking, advisory, underwriting or placement services for or relating to such company(ies) as well as solicit such investment, advisory or other services from any entity mentioned in this report..
South Korea: This report is issued by CGS-CIMB, John Keells, SBE or Morgans, as the case may be, and distributed in South Korea by CGS-CIMB Securities (Hong Kong) Limited, Korea Branch (“CGS-CIMB Korea”) which is licensed as a cash equity broker, and regulated by the Financial Services Commission and Financial Supervisory Service of Korea. In South Korea, this report is for distribution only to professional investors under Article 9(5) of the Financial Investment Services and Capital Market Act of Korea (“FSCMA”).
Spain: This document is a research report and it is addressed to institutional investors only. The research report is of a general nature and not personalised and does not constitute investment advice so, as the case may be, the recipient must seek proper advice before adopting any investment decision. This document does not constitute a public offering of securities.
CGS-CIMB is not registered with the Spanish Comision Nacional del Mercado de Valores to provide investment services.
Sweden: This report contains only marketing information and has not been approved by the Swedish Financial Supervisory Authority. The distribution of this report is not an offer to sell to any person in Sweden or a solicitation to any person in Sweden to buy any instruments described herein and may not be forwarded to the public in Sweden.
Switzerland: This report has not been prepared in accordance with the recognized self-regulatory minimal standards for research reports of banks issued by the Swiss Bankers’ Association (Directives on the Independence of Financial Research).
Thailand: This report is issued by CGS-CIMB, John Keells, SBE or Morgans, as the case may be, and distributed by CGS-CIMB Securities (Thailand) Co., Ltd. (“CGS-CIMB Thailand”) based upon sources believed to be reliable (but their accuracy, completeness or correctness is not guaranteed). The statements or expressions of opinion herein were arrived at after due and careful consideration for use as information for investment. Such opinions are subject to change without notice and CGS-CIMB Thailand has no obligation to update the opinion or the information in this research report.
CGS-CIMB Thailand may act or acts as Market Maker, and issuer and offerer of Derivative Warrants and Structured Note which may have the following securities as its underlying securities. Investors should carefully read and study the details of the derivative warrants in the prospectus before making investment decisions.
AAV, ADVANC, AEONTS, AMATA, ANAN, AOT, AP, BANPU, BBL, BCH, BCP, BCPG, BDMS, BEAUTY, BEC, BEM, BGRIM, BH, BJC, BLAND, BPP, BTS, CBG, CENTEL, CHG, CK, CKP, COM7, CPALL, CPF, CPN, DELTA, DTAC, EA, EGCO, EPG, ERW, ESSO, GFPT, GLOBAL, GPSC, GULF, GUNKUL, HANA, HMPRO, INTUCH, IRPC, IVL, JAS, JMT, KBANK, KCE, KKP, KTB, KTC, LH, MAJOR, MBK, MEGA, MINT, MTC, ORI, OSP, PLANB, PRM, PSH, PSL, PTG, PTT, PTTEP, PTTGC, QH, RATCH, ROBINS, RS, SAWAD, SCB, SCC, SGP, SIRI, SPALI, SPRC, STA, STEC, SUPER, TASCO, TCAP, THAI, THANI, TISCO, TKN, TMB, TOA, TOP, TPIPP, TRUE, TTW, TU, TVO, WHA.
Corporate Governance Report:
The disclosure of the survey result of the Thai Institute of Directors Association (“IOD”) regarding corporate governance is made pursuant to the policy of the Office of the Securities and Exchange Commission. The survey of the IOD is based on the information of a company listed on the Stock Exchange of Thailand and the Market for Alternative Investment disclosed to the public and able to be accessed by a general public investor. The result, therefore, is from the perspective of a third party. It is not an evaluation of operation and is not based on inside information.
The survey result is as of the date appearing in the Corporate Governance Report of Thai Listed Companies. As a result, the survey result may be changed after that date. CGS-CIMB Thailand does not confirm nor certify the accuracy of such survey result.
Score Range: 90 - 100 80 - 89 70 - 79 Below 70 or No Survey Result
Description: Excellent Very Good Good N/A
41

Asia Pacific Daily | Equity Research | September 2, 2019
12
United Arab Emirates: The distributor of this report has not been approved or licensed by the UAE Central Bank or any other relevant licensing authorities or governmental agencies in the United Arab Emirates. This report is strictly private and confidential and has not been reviewed by, deposited or registered with UAE Central Bank or any other licensing authority or governmental agencies in the United Arab Emirates. This report is being issued outside the United Arab Emirates to a limited number of institutional investors and must not be provided to any person other than the original recipient and may not be reproduced or used for any other purpose. Further, the information contained in this report is not intended to lead to the sale of investments under any subscription agreement or the conclusion of any other contract of whatsoever nature within the territory of the United Arab Emirates.
United Kingdom and European Economic Area (EEA): In the United Kingdom and European Economic Area, this material is issued by CGS-CIMB, John Keells, SBE or Morgans, as the case may be, and is being distributed by CGS-CIMB Securities (UK) Limited (“CGS-CIMB UK”). CGS-CIMB UK is authorized and regulated by the Financial Conduct Authority and its registered office is at 27 Knightsbridge, London, SW1X7YB. The material distributed by CGS-CIMB UK has been prepared in accordance with CGS-CIMB Group’s policies for managing conflicts of interest arising as a result of publication and distribution of this material. This material is for distribution only to, and is solely directed at, selected persons on the basis that those persons: (a) are eligible counterparties and professional clients of CGS-CIMB UK; (b) have professional experience in matters relating to investments falling within Article 19(5) of the Financial Services and Markets Act 2000 (Financial Promotion) Order 2005 (as amended, the “Order”), (c) fall within Article 49(2)(a) to (d) (“high net worth companies, unincorporated associations etc”) of the Order; (d) are outside the United Kingdom subject to relevant regulation in each jurisdiction, material(all such persons together being referred to as “relevant persons”). This material is directed only at relevant persons and must not be acted on or relied on by persons who are not relevant persons. Any investment or investment activity to which this material relates is available only to relevant persons and will be engaged in only with relevant persons.
Where this material is labelled as non-independent, it does not provide an impartial or objective assessment of the subject matter and does not constitute independent “research” under the applicable rules of the Financial Conduct Authority in the UK. Consequently, any such non-independent material will not have been prepared in accordance with legal requirements designed to promote the independence of research and will not subject to any prohibition on dealing ahead of the dissemination of research. Any such non-independent material must be considered as a marketing communication.
United States: This research report is issued by CGS-CIMB, John Keells, SBE or Morgans, as the case may be, and distributed in the United States of America by CGS-CIMB Securities (USA) Inc, a U.S. registered broker-dealer and a related corporation of CGS-CIMB Securities Sdn. Bhd. (formerly known as Jupiter Securities Sdn. Bhd.), CGS-CIMB Research Pte Ltd, PT CGS-CIMB Sekuritas Indonesia, CGS-CIMB Securities (Thailand) Co. Ltd., CGS-CIMB Securities (Hong Kong) Limited and CGS-CIMB Securities (India) Private Limited, and is distributed solely to persons who qualify as “U.S. Institutional Investors” as defined in Rule 15a-6 under the Securities and Exchange Act of 1934. This communication is only for Institutional Investors whose ordinary business activities involve investing in shares, bonds, and associated securities and/or derivative securities and who have professional experience in such investments. Any person who is not a U.S. Institutional Investor or Major Institutional Investor must not rely on this communication. The delivery of this research report to any person in the United States of America is not a recommendation to effect any transactions in the securities discussed herein, or an endorsement of any opinion expressed herein. CGS-CIMB Securities (USA) Inc, is a FINRA/SIPC member and takes responsibility for the content of this report. For further information or to place an order in any of the above-mentioned securities please contact a registered representative of CGS-CIMB Securities (USA) Inc.
Other jurisdictions: In any other jurisdictions, except if otherwise restricted by laws or regulations, this report is only for distribution to professional, institutional or sophisticated investors as defined in the laws and regulations of such jurisdictions.
Corporate Governance Report of Thai Listed Companies (CGR). CG Rating by the Thai Institute of Directors Association (Thai IOD) in 2018, Anti-Corruption 2018
ADVANC – Excellent, Certified, AEONTS – Good, n/a, AH – Very Good, n/a, AMATA – Excellent, Declared, ANAN – Excellent, Declared, AOT – Excellent, Declared, AP – Excellent, Certified, ASP – Very Good, Certified, BANPU – Excellent, Certified, BAY – Excellent, Certified, BBL – Very Good, Certified, BCH – Good, Certified, BCP - Excellent, Certified, BCPG – Excellent, Certified, BEM – Very Good, n/a, BDMS – Very Good, n/a, BEAUTY – Good, n/a, BEC – Very Good, n/a, , BGRIM – Very Good, Declared, BH - Good, n/a, BJC – Very Good, Declared, BJCHI – Very Good, Certified, BLA – Very Good, Certified, BPP – Very Good, Declared, BR - Good, Declared, BTS - Excellent, Certified, CBG – Very Good, n/a, CCET – Good, n/a, CENTEL – Very Good, Certified, CHG – Very Good, Declared, CK – Excellent, n/a, COL – Excellent, Declared, CPALL – Very Good, Certified, CPF – Excellent, Certified, CPN - Excellent, Certified, DELTA - Excellent, n/a, DEMCO – Excellent, Certified, DDD – Very Good, Declared, DIF – not available, n/a, DREIT – not available, n/a, DTAC – Excellent, Certified, EA – Excellent, n/a, ECL – Very Good, Certified, EGCO - Excellent, Certified, EPG – Very Good, n/a, ERW – Very Good, n/a, GFPT - Excellent, Certified, GGC – Excellent, Certified, GLOBAL – Very Good, n/a, GLOW – Very Good, Certified, GPSC – Excellent, Certified, GULF – Very Good, n/a, GUNKUL – Excellent, Certified, HANA - Excellent, Certified, HMPRO - Excellent, Certified, HREIT - Excellent, Certified ICHI – Excellent, Declared, HUMAN – not available, n/a, III – Good, n/a, INTUCH - Excellent, Certified, IRPC – Excellent, Certified, ITD* – Very Good, n/a, IVL - Excellent, Certified, JASIF – not available, n/a, JWD – Very Good, n/a, KBANK - Excellent, Certified, KCE - Excellent, Certified, KKP – Excellent, Certified, KSL – Excellent, Certified, KTB - Excellent, Certified, KTC – Excellent, Certified, LH - Very Good, n/a, LPN – Excellent, Certified, M – Very Good, Certified, MACO – Very Good, n/a, MAJOR – Very Good, n/a, MAKRO – Excellent, Declared, MALEE – Very Good, Certified, MC – Very Good, Certified, MCOT – Excellent, Certified, MEGA – Very Good, n/a, MINT - Excellent, Certified, MTC – Excellent, Declared, NETBAY – Good, n/a, OSP – not available, n/a,PLANB – Excellent, Declared, PLAT – Very Good, Certified, PR9 – not available, n/a, PSH – Excellent, Certified, PSTC – Good, Certified, PTT - Excellent, Certified, PTTEP - Excellent, Certified, PTTGC - Excellent, Certified, QH – Excellent, Certified, RATCH – Excellent, Certified, ROBINS – Excellent, Certified, RS – Very Good, n/a, RSP – not available, n/a, S – Very Good, n/a, SAMART - Excellent, n/a, SAPPE – Very Good, Declared, SAT – Excellent, Certified, SAWAD – Very Good, n/a, SC – Excellent, Declared, SCB - Excellent, Certified, SCC – Excellent, Certified, SCN – Very Good, Certified, SF – Good, n/a, SIRI – Very Good, Certified, SPA - Good, n/a, SPALI - Excellent, n/a, SPRC – Excellent, Certified, STA – Very Good, Certified, STEC – Excellent, n/a, SVI – Excellent, Certified, SYNEX – Very Good, Declared, TASCO – Excellent, Certified, TCAP – Excellent, Certified, THANI – Excellent, Certified, TIPCO – Very Good, Certified, TISCO - Excellent, Certified, TKN – Very Good, Declared, TMB - Excellent, Certified, TNR – Very Good, Declared, TOP - Excellent, Certified, TPCH – Good, n/a, TPIPP – Good, n/a, TRUE – Excellent, Certified, TU – Excellent, Certified, TVO – Very Good, Declared, UNIQ – Good, n/a, VGI – Excellent, Certified, WHA – Excellent, Certified, WHART – not available, n/a, WICE – Very Good, Certified, WORK –
42

Asia Pacific Daily | Equity Research | September 2, 2019
13
Good, n/a. Companies participating in Thailand’s Private Sector Collective Action Coalition Against Corruption programme (Thai CAC) under Thai Institute of Directors (as of August 31, 2018) are categorized into:
- Companies that have declared their intention to join CAC, and
- Companies certified by CAC
* The company, its director or management had been reportedly accused for breaching proper corporate governance such as violation of the SEC’s regulations or charged with corruption.
Recommendation Framework
Stock Ratings Definition:
Add The stock’s total return is expected to exceed 10% over the next 12 months.
Hold The stock’s total return is expected to be between 0% and positive 10% over the next 12 months.
Reduce The stock’s total return is expected to fall below 0% or more over the next 12 months.
The total expected return of a stock is defined as the sum of the: (i) percentage difference between the target price and the current price and (ii) the forward net dividend yields of the stock. Stock price targets have an investment horizon of 12 months.
Sector Ratings Definition:
Overweight An Overweight rating means stocks in the sector have, on a market cap-weighted basis, a positive absolute recommendation.
Neutral A Neutral rating means stocks in the sector have, on a market cap-weighted basis, a neutral absolute recommendation.
Underweight An Underweight rating means stocks in the sector have, on a market cap-weighted basis, a negative absolute recommendation.
Country Ratings Definition:
Overweight An Overweight rating means investors should be positioned with an above-market weight in this country relative to benchmark.
Neutral A Neutral rating means investors should be positioned with a neutral weight in this country relative to benchmark.
Underweight An Underweight rating means investors should be positioned with a below-market weight in this country relative to benchmark.
WJV#05c
43
Recommended