Paradigm Transportation Solutions Limited
43 Forest RoadCambridge ON N1S 3B4
Email: [email protected]: 519-896-3163
905-381-2229Fax: 1-866-722-5117
ww
w.p
tsl.
com
Philip E. GrubbB.A.Sc., P.Eng.President
TransportationPlanning
TransitPlanning
TrafficEngineering
ParkingPlanning
Stewart K. ElkinsBES, MITEVice President
James J.L. MallettM.A.Sc., P.Eng., PTOEVice President
January 22, 2014 Project: 131180 Brad Schlegel Vice President, Design and Construction RBJ Schlegel Holdings Inc. 325 Max Becker Drive, Suite 201 Kitchener ON N2E 4H5 Dear Mr Schlegel: Re: Village of Riverside Glen – Traffic Impact and Parking Assessment
The following summarizes a review of the existing parking demand and driveway operations for the Village of Riverside Glen in the City of Guelph. Paradigm Transportation Solutions Limited previously submitted The Village of Riverside Glen – Scoped Traffic Impact Statement, July 30, 2013 which was available to the public and reviewed by the City of Guelph. This latest analyses was undertaken to supplement the previous Scoped Traffic Impact Statement and also to address specific items that were raised at the October 7, 2013 Public Meeting.
Site Description
The Village of Riverside Glen is located at 60-72 Woodlawn Road in the City of Guelph. The general location of the subject site is illustrated in Figure 1 (Attached).
The Village of Riverside Glen currently consists of 195 retirement home units which include Main Floor Retirement Studios, Memory Care Floor Studios (dementia care) and Assisted Care Floor Studios (physical ailment care). The development also consists of 192 long term care beds and a supporting office. The Village also provides a medical clinic and a “Living Classroom” which involves classrooms for on-site education of Conestoga College students to improve student access to education and quality of education/training for Personal Support Worker and Practical Nursing students and to enhance the quality of care for seniors.
A future apartment building, shown on the site plan, is also proposed in the longer-term for approximately 60 independent living units.
January 22, 2014 Riverside Glen Traffic Impact & Parking Assessment
Page 2
The driveway access serving 60-72 Woodlawn Road provides access to the Foxwood Seniors Apartments (50 rental units), the Parkside Seniors Apartments (39 Condo units), and for the Village of Riverside Glen. The driveway is located approximately 550 metres west of Woolwich Street on the north side of Woodlawn Road East and functions as a “T” intersection with two travel lanes on the east and west legs and one travel lane on the north leg (site driveway).
Existing Parking Demand
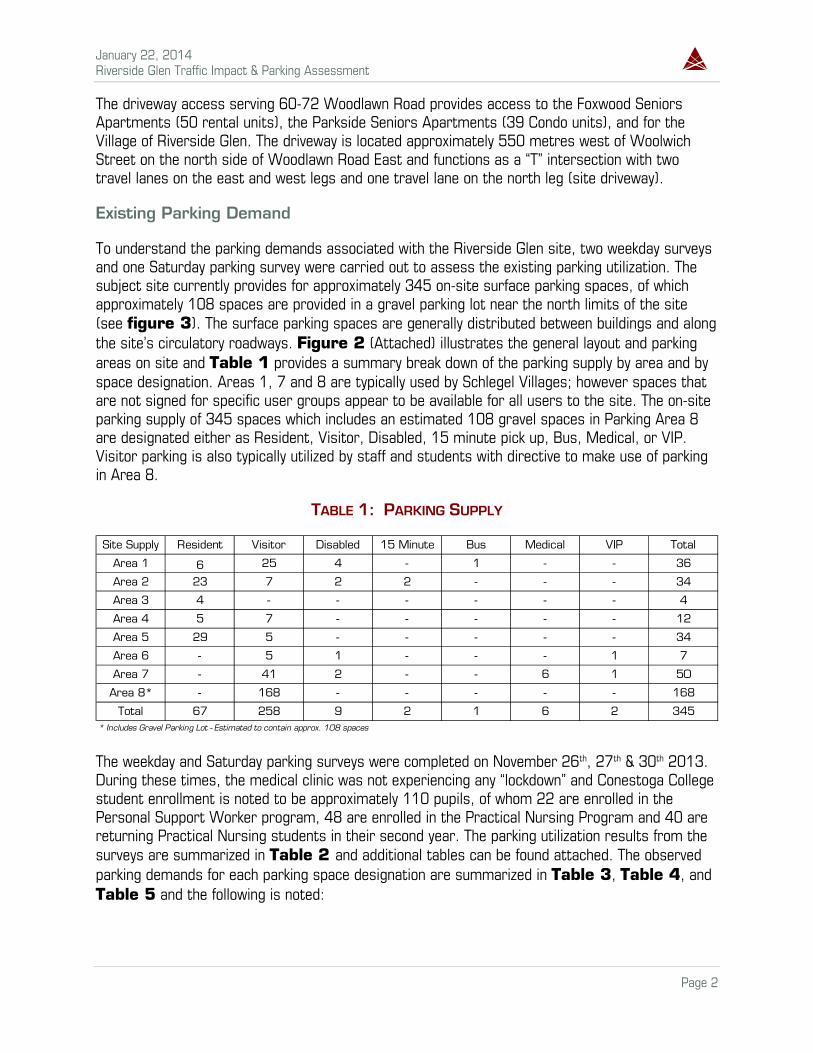
To understand the parking demands associated with the Riverside Glen site, two weekday surveys and one Saturday parking survey were carried out to assess the existing parking utilization. The subject site currently provides for approximately 345 on-site surface parking spaces, of which approximately 108 spaces are provided in a gravel parking lot near the north limits of the site (see figure 3). The surface parking spaces are generally distributed between buildings and along the site’s circulatory roadways. Figure 2 (Attached) illustrates the general layout and parking areas on site and Table 1 provides a summary break down of the parking supply by area and by space designation. Areas 1, 7 and 8 are typically used by Schlegel Villages; however spaces that are not signed for specific user groups appear to be available for all users to the site. The on-site parking supply of 345 spaces which includes an estimated 108 gravel spaces in Parking Area 8 are designated either as Resident, Visitor, Disabled, 15 minute pick up, Bus, Medical, or VIP. Visitor parking is also typically utilized by staff and students with directive to make use of parking in Area 8.
TABLE 1: PARKING SUPPLY
The weekday and Saturday parking surveys were completed on November 26th, 27th & 30th 2013. During these times, the medical clinic was not experiencing any “lockdown” and Conestoga College student enrollment is noted to be approximately 110 pupils, of whom 22 are enrolled in the Personal Support Worker program, 48 are enrolled in the Practical Nursing Program and 40 are returning Practical Nursing students in their second year. The parking utilization results from the surveys are summarized in Table 2 and additional tables can be found attached. The observed parking demands for each parking space designation are summarized in Table 3, Table 4, and Table 5 and the following is noted:
Site Supply Resident Visitor Disabled 15 Minute Bus Medical VIP Total
Area 1 6 25 4 - 1 - - 36
Area 2 23 7 2 2 - - - 34
Area 3 4 - - - - - - 4
Area 4 5 7 - - - - - 12
Area 5 29 5 - - - - - 34
Area 6 - 5 1 - - - 1 7
Area 7 - 41 2 - - 6 1 50
Area 8* - 168 - - - - - 168
Total 67 258 9 2 1 6 2 345* Includes Gravel Parking Lot - Estimated to contain approx. 108 spaces
January 22, 2014 Riverside Glen Traffic Impact & Parking Assessment
Page 3
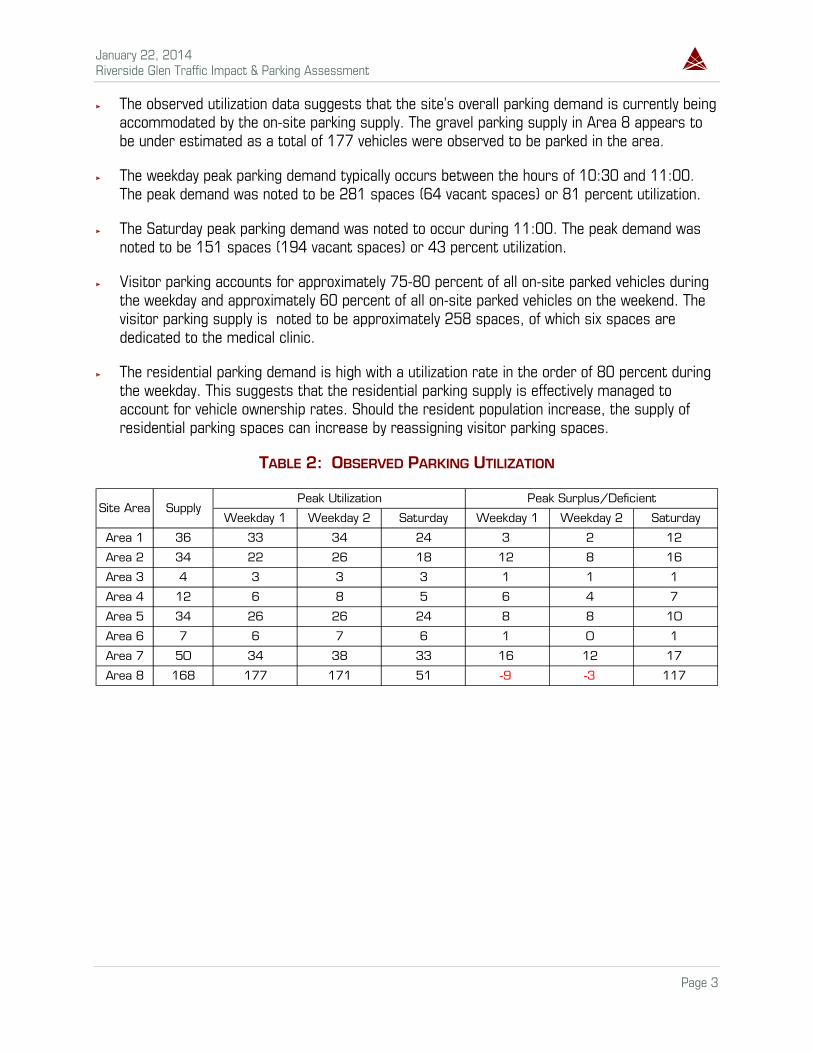
The observed utilization data suggests that the site’s overall parking demand is currently being accommodated by the on-site parking supply. The gravel parking supply in Area 8 appears to be under estimated as a total of 177 vehicles were observed to be parked in the area.
The weekday peak parking demand typically occurs between the hours of 10:30 and 11:00. The peak demand was noted to be 281 spaces (64 vacant spaces) or 81 percent utilization.
The Saturday peak parking demand was noted to occur during 11:00. The peak demand was noted to be 151 spaces (194 vacant spaces) or 43 percent utilization.
Visitor parking accounts for approximately 75-80 percent of all on-site parked vehicles during the weekday and approximately 60 percent of all on-site parked vehicles on the weekend. The visitor parking supply is noted to be approximately 258 spaces, of which six spaces are dedicated to the medical clinic.
The residential parking demand is high with a utilization rate in the order of 80 percent during the weekday. This suggests that the residential parking supply is effectively managed to account for vehicle ownership rates. Should the resident population increase, the supply of residential parking spaces can increase by reassigning visitor parking spaces.
TABLE 2: OBSERVED PARKING UTILIZATION
Weekday 1 Weekday 2 Saturday Weekday 1 Weekday 2 Saturday
Area 1 36 33 34 24 3 2 12
Area 2 34 22 26 18 12 8 16
Area 3 4 3 3 3 1 1 1
Area 4 12 6 8 5 6 4 7
Area 5 34 26 26 24 8 8 10
Area 6 7 6 7 6 1 0 1
Area 7 50 34 38 33 16 12 17
Area 8 168 177 171 51 -9 -3 117
Peak UtilizationSupplySite Area
Peak Surplus/Deficient

January 22, 2014 Riverside Glen Traffic Impact & Parking Assessment
Page 4
TABLE 3: WEEKDAY ONE UTILIZATION
TIMEA1 -R
esid
ent
A1 -V
isito
r
A1 -D
isab
led
A1 -B
us
A2 -R
esid
ent
A2 -V
isito
r
A2 -D
isab
led
A2 -
15 M
in
A3 -R
esid
ent
A4 -R
esid
ent
A4 -V
isito
r
A5 -R
esid
ent
A5 -V
isito
r
A6 -R
esid
ent
A6 -V
isito
r
A6 -V
IP
A7 -V
isito
r
A7 -
Med
ical
A7 -
Dis
able
d
A7 -
VIP
A8 -V
isito
r
Utiliz
atio
n
Supply 6 25 4 1 23 7 2 2 4 5 7 29 5 5 1 1 41 6 2 1 168
07:30 6 8 1 1 13 0 2 0 3 4 0 26 0 5 0 0 11 0 0 0 75 155
08:00 6 8 1 1 13 0 2 0 3 4 0 25 0 5 0 0 11 0 0 0 78 157
08:30 6 5 1 1 12 0 2 0 3 4 0 23 0 5 0 0 12 0 0 0 102 176
09:00 6 9 1 1 14 0 2 2 3 4 0 25 0 5 0 0 13 3 0 0 118 206
09:30 6 24 2 1 15 1 2 1 3 4 0 22 0 4 0 0 13 2 0 0 121 221
10:00 6 20 1 1 15 2 2 0 3 4 2 23 0 4 1 0 16 1 0 0 156 257
10:30 6 24 2 1 12 1 2 0 3 4 1 22 2 2 1 0 17 1 0 0 169 270
*11:00 6 24 2 1 13 2 2 0 3 3 1 22 2 1 1 0 19 2 0 0 177 281
11:30 6 23 2 1 12 2 2 0 3 3 1 21 2 3 1 0 19 2 0 0 169 272
12:00 6 20 2 1 11 1 2 0 3 3 1 19 2 5 0 0 18 1 0 0 160 255
12:30 6 23 1 1 11 1 2 1 2 4 0 21 2 5 0 0 20 1 0 0 164 265
13:00 6 23 1 1 12 2 2 0 2 3 0 19 4 4 0 0 23 2 0 0 149 253
13:30 6 23 1 1 11 3 2 0 3 3 0 18 4 4 0 0 27 3 1 0 133 243
14:00 6 23 2 1 15 5 2 0 3 3 0 19 4 4 0 0 26 6 1 1 128 249
14:30 6 23 1 1 14 4 2 0 2 4 0 20 2 5 0 0 25 4 1 0 109 223
15:00 6 21 3 1 14 4 2 0 2 3 1 18 3 5 1 0 22 5 1 1 103 216
15:30 6 19 3 1 14 4 2 0 2 3 1 16 3 5 1 0 22 5 1 1 101 210
16:00 6 21 3 1 13 3 2 1 3 3 0 20 2 5 0 0 28 3 0 1 89 204
16:30 6 22 4 1 14 3 2 1 2 4 0 19 3 5 0 0 26 4 0 1 57 174
17:00 6 17 3 1 11 2 2 2 3 4 0 22 1 5 0 0 26 4 1 1 44 155
17:30 6 15 2 1 13 1 2 0 3 4 0 21 0 5 0 0 22 4 1 1 44 145
18:00 6 11 3 1 14 1 2 0 3 4 0 21 0 5 0 0 19 3 1 1 44 139* Peak Parking Demand

January 22, 2014 Riverside Glen Traffic Impact & Parking Assessment
Page 5
TABLE 4: WEEKDAY TWO UTILIZATION
TIMEA1 -R
esid
ent
A1 -V
isito
r
A1 -D
isab
led
A1 -B
us
A2 -R
esid
ent
A2 -V
isito
r
A2 -D
isab
led
A2 -
15 M
in
A3 -R
esid
ent
A4 -R
esid
ent
A4 -V
isito
r
A5 -R
esid
ent
A5 -V
isito
r
A6 -R
esid
ent
A6 -V
isito
r
A6 -D
isab
led
A7 -V
isito
r
A7 -
Med
ical
A7 -
Dis
able
d
A7 -
VIP
A8 -V
isito
r
Utiliz
atio
n
Supply 6 25 4 1 23 7 2 2 4 5 7 29 5 5 1 1 41 6 2 1 168
07:30 6 4 1 1 13 0 2 0 3 4 0 24 2 5 0 0 9 0 0 1 69 144
08:00 5 6 1 1 13 0 2 0 3 4 0 24 2 5 0 0 12 1 0 1 76 156
08:30 5 6 1 1 13 1 2 0 3 4 0 23 2 5 0 0 12 2 0 1 97 178
09:00 5 13 1 1 13 2 2 0 3 4 0 23 2 5 0 0 13 4 0 1 110 202
09:30 5 17 1 1 13 2 2 0 3 4 0 20 3 4 0 0 25 3 1 1 129 234
10:00 4 19 1 1 12 2 2 0 3 4 0 19 4 5 0 0 31 1 0 1 145 254
*10:30 4 18 1 1 12 2 2 0 3 4 3 22 2 4 0 1 26 5 0 1 169 280
11:00 4 19 1 1 13 2 2 0 3 4 4 19 2 4 0 1 28 5 1 1 162 276
11:30 4 20 1 1 13 1 2 0 3 4 4 16 2 4 0 0 29 5 1 1 155 266
12:00 4 19 2 1 15 1 2 0 3 4 4 16 2 4 0 1 25 4 0 1 171 279
12:30 4 14 2 1 12 1 2 0 3 4 3 22 0 4 0 1 22 3 1 1 169 269
13:00 6 11 2 1 13 1 1 0 3 4 3 15 0 4 0 1 24 2 0 1 166 258
13:30 6 14 3 1 14 1 1 0 3 4 2 15 2 4 0 1 28 4 1 1 156 261
14:00 5 17 3 1 14 2 1 0 3 4 3 14 2 4 0 1 29 5 1 1 135 245
14:30 6 23 4 1 14 2 1 0 3 4 2 14 2 5 0 1 29 6 1 1 118 237
15:00 6 23 4 1 15 4 2 0 3 3 1 16 3 5 0 1 30 6 1 1 100 225
15:30 6 23 4 1 16 4 2 0 3 3 0 17 4 5 0 1 27 6 1 0 76 199
16:00 6 20 4 1 15 2 2 2 3 4 2 16 2 5 1 1 21 1 0 0 61 169
16:30 6 22 3 1 18 4 2 2 3 4 1 19 3 4 0 1 23 1 1 0 58 176
17:00 6 16 1 1 14 3 2 2 3 4 1 19 0 4 0 0 23 2 0 0 52 153
17:30 6 14 0 1 14 3 2 2 3 4 0 21 2 4 0 0 20 0 0 0 36 132
18:00 6 16 0 1 14 3 2 2 3 4 0 22 2 4 0 0 19 0 0 0 35 133* Peak Parking Demand
January 22, 2014 Riverside Glen Traffic Impact & Parking Assessment
Page 6
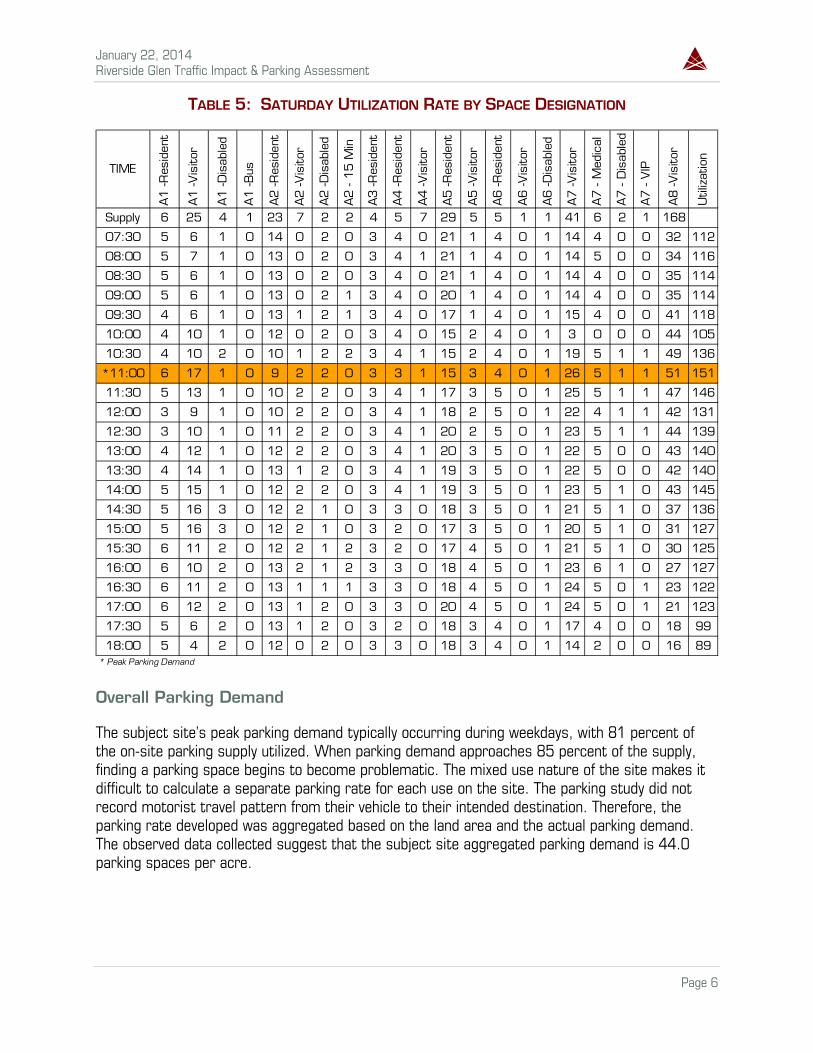
TABLE 5: SATURDAY UTILIZATION RATE BY SPACE DESIGNATION
Overall Parking Demand
The subject site’s peak parking demand typically occurring during weekdays, with 81 percent of the on-site parking supply utilized. When parking demand approaches 85 percent of the supply, finding a parking space begins to become problematic. The mixed use nature of the site makes it difficult to calculate a separate parking rate for each use on the site. The parking study did not record motorist travel pattern from their vehicle to their intended destination. Therefore, the parking rate developed was aggregated based on the land area and the actual parking demand. The observed data collected suggest that the subject site aggregated parking demand is 44.0 parking spaces per acre.
TIMEA1 -R
esid
ent
A1 -V
isito
r
A1 -D
isab
led
A1 -B
us
A2 -R
esid
ent
A2 -V
isito
r
A2 -D
isab
led
A2 -
15 M
in
A3 -R
esid
ent
A4 -R
esid
ent
A4 -V
isito
r
A5 -R
esid
ent
A5 -V
isito
r
A6 -R
esid
ent
A6 -V
isito
r
A6 -D
isab
led
A7 -V
isito
r
A7 -
Med
ical
A7 -
Dis
able
d
A7 -
VIP
A8 -V
isito
r
Utiliz
atio
n
Supply 6 25 4 1 23 7 2 2 4 5 7 29 5 5 1 1 41 6 2 1 168
07:30 5 6 1 0 14 0 2 0 3 4 0 21 1 4 0 1 14 4 0 0 32 112
08:00 5 7 1 0 13 0 2 0 3 4 1 21 1 4 0 1 14 5 0 0 34 116
08:30 5 6 1 0 13 0 2 0 3 4 0 21 1 4 0 1 14 4 0 0 35 114
09:00 5 6 1 0 13 0 2 1 3 4 0 20 1 4 0 1 14 4 0 0 35 114
09:30 4 6 1 0 13 1 2 1 3 4 0 17 1 4 0 1 15 4 0 0 41 118
10:00 4 10 1 0 12 0 2 0 3 4 0 15 2 4 0 1 3 0 0 0 44 105
10:30 4 10 2 0 10 1 2 2 3 4 1 15 2 4 0 1 19 5 1 1 49 136
*11:00 6 17 1 0 9 2 2 0 3 3 1 15 3 4 0 1 26 5 1 1 51 151
11:30 5 13 1 0 10 2 2 0 3 4 1 17 3 5 0 1 25 5 1 1 47 146
12:00 3 9 1 0 10 2 2 0 3 4 1 18 2 5 0 1 22 4 1 1 42 131
12:30 3 10 1 0 11 2 2 0 3 4 1 20 2 5 0 1 23 5 1 1 44 139
13:00 4 12 1 0 12 2 2 0 3 4 1 20 3 5 0 1 22 5 0 0 43 140
13:30 4 14 1 0 13 1 2 0 3 4 1 19 3 5 0 1 22 5 0 0 42 140
14:00 5 15 1 0 12 2 2 0 3 4 1 19 3 5 0 1 23 5 1 0 43 145
14:30 5 16 3 0 12 2 1 0 3 3 0 18 3 5 0 1 21 5 1 0 37 136
15:00 5 16 3 0 12 2 1 0 3 2 0 17 3 5 0 1 20 5 1 0 31 127
15:30 6 11 2 0 12 2 1 2 3 2 0 17 4 5 0 1 21 5 1 0 30 125
16:00 6 10 2 0 13 2 1 2 3 3 0 18 4 5 0 1 23 6 1 0 27 127
16:30 6 11 2 0 13 1 1 1 3 3 0 18 4 5 0 1 24 5 0 1 23 122
17:00 6 12 2 0 13 1 2 0 3 3 0 20 4 5 0 1 24 5 0 1 21 123
17:30 5 6 2 0 13 1 2 0 3 2 0 18 3 4 0 1 17 4 0 0 18 99
18:00 5 4 2 0 12 0 2 0 3 3 0 18 3 4 0 1 14 2 0 0 16 89* Peak Parking Demand
January 22, 2014 Riverside Glen Traffic Impact & Parking Assessment
Page 7
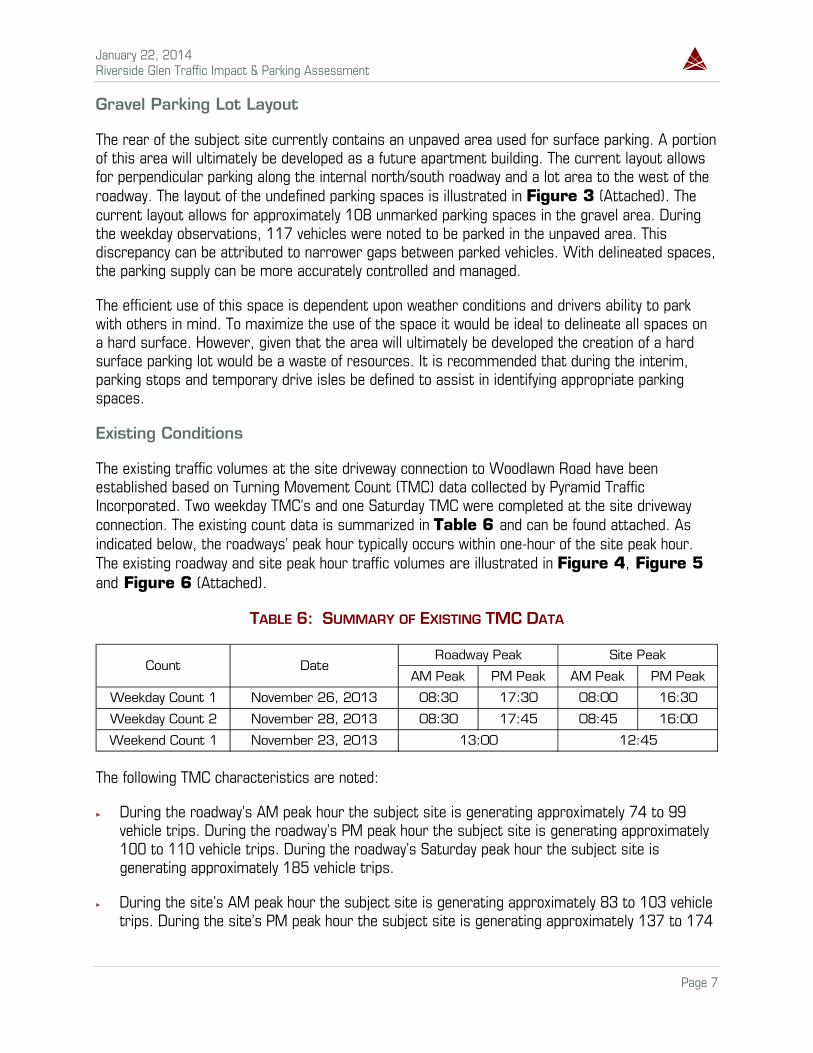
Gravel Parking Lot Layout
The rear of the subject site currently contains an unpaved area used for surface parking. A portion of this area will ultimately be developed as a future apartment building. The current layout allows for perpendicular parking along the internal north/south roadway and a lot area to the west of the roadway. The layout of the undefined parking spaces is illustrated in Figure 3 (Attached). The current layout allows for approximately 108 unmarked parking spaces in the gravel area. During the weekday observations, 117 vehicles were noted to be parked in the unpaved area. This discrepancy can be attributed to narrower gaps between parked vehicles. With delineated spaces, the parking supply can be more accurately controlled and managed.
The efficient use of this space is dependent upon weather conditions and drivers ability to park with others in mind. To maximize the use of the space it would be ideal to delineate all spaces on a hard surface. However, given that the area will ultimately be developed the creation of a hard surface parking lot would be a waste of resources. It is recommended that during the interim, parking stops and temporary drive isles be defined to assist in identifying appropriate parking spaces.
Existing Conditions
The existing traffic volumes at the site driveway connection to Woodlawn Road have been established based on Turning Movement Count (TMC) data collected by Pyramid Traffic Incorporated. Two weekday TMC’s and one Saturday TMC were completed at the site driveway connection. The existing count data is summarized in Table 6 and can be found attached. As indicated below, the roadways’ peak hour typically occurs within one-hour of the site peak hour. The existing roadway and site peak hour traffic volumes are illustrated in Figure 4, Figure 5 and Figure 6 (Attached).
TABLE 6: SUMMARY OF EXISTING TMC DATA
The following TMC characteristics are noted:
During the roadway’s AM peak hour the subject site is generating approximately 74 to 99 vehicle trips. During the roadway’s PM peak hour the subject site is generating approximately 100 to 110 vehicle trips. During the roadway’s Saturday peak hour the subject site is generating approximately 185 vehicle trips.
During the site’s AM peak hour the subject site is generating approximately 83 to 103 vehicle trips. During the site’s PM peak hour the subject site is generating approximately 137 to 174
AM Peak PM Peak AM Peak PM Peak
Weekday Count 1 November 26, 2013 08:30 17:30 08:00 16:30
Weekday Count 2 November 28, 2013 08:30 17:45 08:45 16:00
Weekend Count 1 November 23, 2013
Roadway Peak Site PeakDateCount
13:00 12:45
January 22, 2014 Riverside Glen Traffic Impact & Parking Assessment
Page 8
vehicle trips. During the roadway’s Saturday peak hour the subject site is generating approximately 228 vehicle trips.
The TMC volumes utilizing the site driveway connection to Woodlawn Road include vehicle trips made by residents, visitors including staff and medical clinic visits, service vehicles and Conestoga College students.
Existing Operational Conditions
The operations of the driveway onto Woodlawn Road were evaluated using both the site peak hour and roadway peak hour for the weekday and weekend observations based on the existing lane configuration and traffic control along with the collected TMC data. The intersection analysis considered three separate measures of performance using Synchro 7.0 with HCM 2000 procedures:
The LOS for each turning movement;
The volume to capacity ratio (v/c) for each movement; and
The 95th percentile queue lengths estimated using Synchro.
The findings are summarized in Table 7 and Detailed Synchro 7.0 output can be found attached and the following is noted:
During both the roadway and site peak hours, the subject site’s driveway connection to Woodlawn Road East is operating with acceptable levels of service. Mainline delays along Woodlawn Road East are minimal, while side street delays are noted to be in the LOS C to E range. No movements would be considered to be problematic.
During the second weekday site peak hour, the driveway approach was estimated to experienced delays in the LOS E range with a v/c ratio of 0.70. Delays of this extent are not uncommon for driveway approaches to major arterial roadways and will have little impact on the operations of Woodlawn Road East. The high levels of delay are in part attributed to the low Peak Hour Factor (PHF) of 0.66. This suggests that a sharp peak in site traffic occurred during this count period. In contrast to the first weekday TMC observation the PHF is calculated to be 0.78.
The operation of the site driveway connection to Woodlawn Road East is considered to be typical for a privative driveway connection to an arterial roadway. The operations would not warranted the need for improvements to the existing form of traffic control or suggest the need for geometric improvements.

January 22, 2014 Riverside Glen Traffic Impact & Parking Assessment
Page 9
TABLE 7: EXISTING OPERATIONAL CONDITIONS
EB1 - L
EFT/
THR
U
EB2 - T
HR
U
EB A
PPR
OACH
WB1 -
THR
U
WB - T
HR
U/
RIG
HT
WB A
PPR
OACH
SB1 - L
EFT/
RIG
HT
SB A
PPR
OACH
ICU
%
LOS A A A A A A C CDelay 2.6 0.0 1.0 0.0 0.0 0.0 17.4 17.4v/c 0.04 0.14 0.33 0.18 0.10
95th Q 1 0 0 0 3LOS A A A A A A B BDelay 1.1 0.0 0.4 0.0 0.0 0.0 14.5 14.5v/c 0.03 0.37 0.23 0.12 0.16
95th Q 1 0 0 0 5LOS A A A A A A C CDelay 2.8 0.0 1.1 0.0 0.0 0.0 17.0 17.0v/c 0.05 0.15 0.32 0.18 0.11
95th Q 1 0 0 0 3LOS A A A A A A C CDelay 2.1 0.0 0.8 0.0 0.0 0.0 24.0 24.0v/c 0.07 0.39 0.29 0.16 0.34
95th Q 2 0 0 0 12LOS A A A A A A C CDelay 4.3 0.0 1.9 0.0 0.0 0.0 18.6 18.6v/c 0.10 0.16 0.35 0.19 0.09
95th Q 3 0 0 0 2LOS A A A A A A C CDelay 1.0 0.0 0.3 0.0 0.0 0.0 17.1 17.1v/c 0.03 0.43 0.26 0.14 0.20
95th Q 1 0 0 0 6LOS A A A A A A C CDelay 5.9 0.0 2.5 0.0 0.0 0.0 24.1 24.1v/c 0.17 0.22 0.44 0.24 0.14
95th Q 5 0 0 0 4LOS A A A A A A E EDelay 2.4 0.0 0.9 0.0 0.0 0.0 47.6 47.6v/c 0.08 0.46 0.34 0.19 0.70
95th Q 2 0 0 0 37LOS A A A A A A C CDelay 2.4 0.0 0.9 0.0 0.0 0.0 18.1 18.1v/c 0.07 0.29 0.27 0.16 0.28
95th Q 2 0 0 0 9LOS A A A A A A C CDelay 4.0 0.0 1.7 0.0 0.0 0.0 20.6 20.6v/c 0.12 0.26 0.27 0.16 0.32
95th Q 3 0 0 0 11
Mid-Day 55%
Mid-Day 53%
Wee
kday
One
47%
56%
47%
56%
54%
RoadwayPeakHour
AM
PM
AM
PM
SitePeakHour
CountPeriod
Wee
kday
Tw
o
RoadwayPeakHour
SitePeakHour
Sat
urda
y
DesignHour
RoadwayPeakHour
AM
PM
SitePeakHour
AM
PM
TimePeriod
55%
42%
Direction / Movement / Approach
MOE
41%

January 22, 2014 Riverside Glen Traffic Impact & Parking Assessment
Page 10
NuMetric Data Results
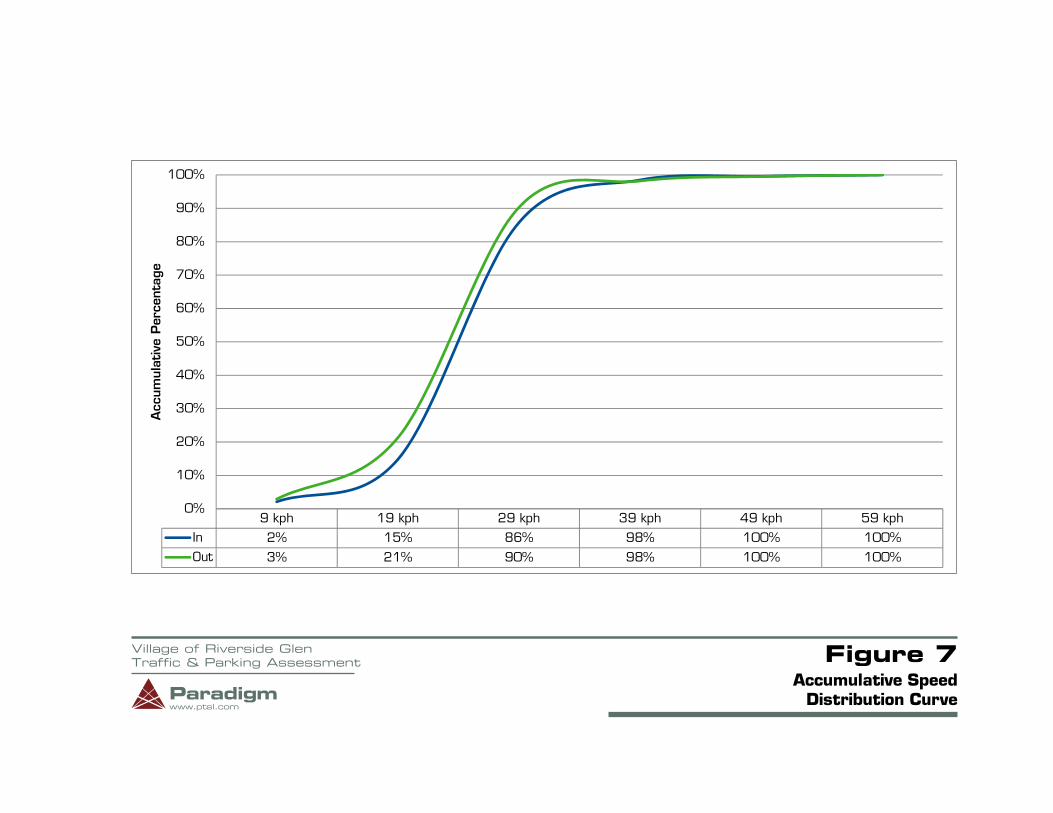
A NuMetric counting location was established to measure the distribution of vehicle length, speed, and time of day. The location selected was along the main drive aisle north of where the driveway splits. The NuMetric data was recorded for a 133 hours beginning at 00:00 on November 21, 2013 and concluding at 13:00 on November 26, 2013. The data collection period was limited due to inclement weather.
The speed data collected for inbound and outbound vehicles is summarized in Figure 7. At least half of the inbound vehicles were traveling in the 20-29 kilometres per hour range or a lower speed. The average speed for all classified inbound vehicles was 25 kilometres per hour. The 85th percentile speed for inbound vehicles is noted to be 29 kilometres per hour.
At least half of the outbound vehicles were traveling in the 20-29 kilometres per hour range or a lower speed. The average speed for all classified outbound vehicles was 24 kilometres per hour. The 85th percentile speed of outbound vehicles is noted to be 29 kilometres per hour. The speed data that was collected for several days for both inbound and outbound vehicle flows suggests that speeding issues on-site are perceived rather than factual.
The main drive aisle is signed with a 15 kilometre per hour speed warning sign. This sign type is not associated with speed limits. It is recommended that the sign be replaced with a sign designed and installed in accordance with the Ontario Traffic Manual – Book 5 – Regulatory Signs. As the main drive aisle is not a municipal roadway, enforcement under the highway traffic act will not be applicable.
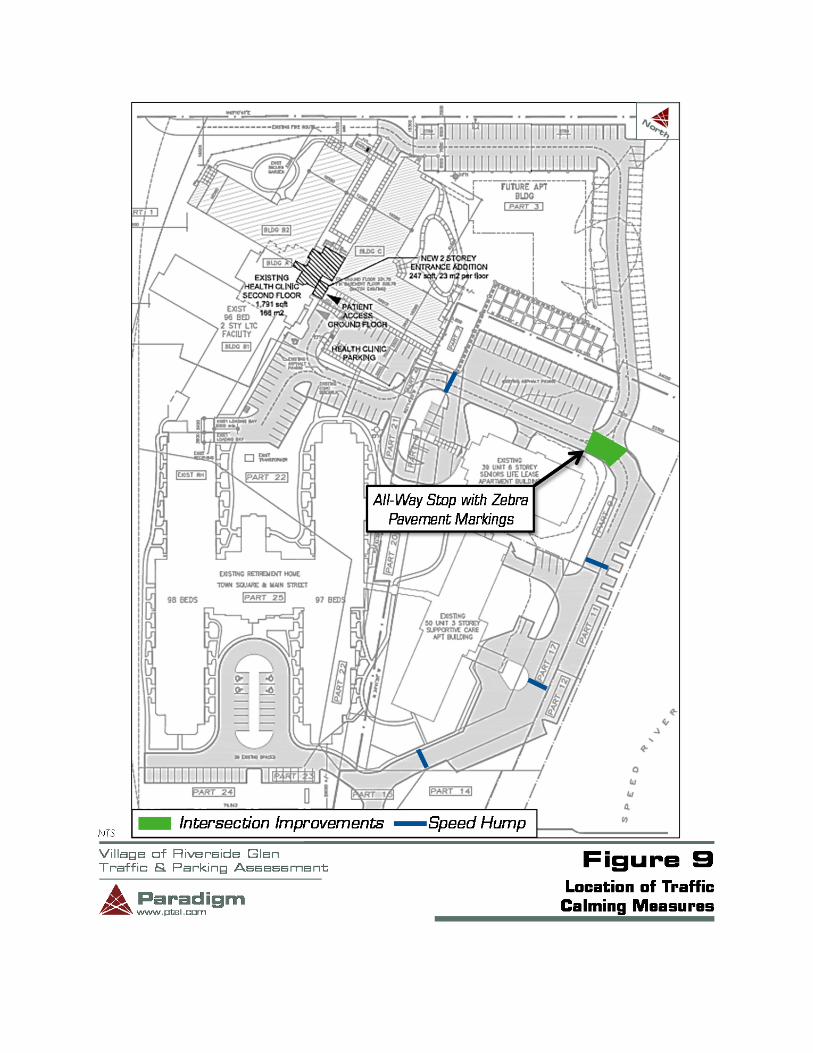
Should vehicle speed continue to be perceived as an issue for residents, consideration can be given to implementing traffic calming measures that are design to impact vehicle travel speed. Speed humps can effectively reduce vehicle speed by approximately 12 kilometres per hour (8 miles per hour). Speed humps typically cost between $1,500 and $3,000 per location. The spacing of speed humps is critical to maintaining lower operating speeds. In addition, consideration to implementing an unwarranted all-way stop with zebra crosswalk markings at the intersection where the two main internal roadways intersect can further assist in defining crosswalk areas and controlling traffic flows. The location of potential traffic calming measures and intersection improvements that could be implemented are shown in Figure 9.
The classification data collected for inbound and outbound vehicles is summarized in Table 8. Most of the vehicles were Passenger Cars. The number of Passenger Cars in the study was 5,351 and represents 96.5 percent of the total number of classified vehicles. The number of Small Trucks in the study was 106, and represents 1.9 percent of the total classified vehicles. The number of Trucks/Buses in the study was 63, and represents 1.1 percent of the total classified vehicles. The number of Tractor Trailers in the study was 27, and represents 0.5 percent of the total classified vehicles.
The heavy vehicle percentages are not uncommon for private commercial-residential developments where service vehicles are required to supply the site. The observed heavy vehicles are required to be on site and would not be considered cut-thru traffic.
January 22, 2014 Riverside Glen Traffic Impact & Parking Assessment
Page 11
During the NuMetric data collection, construction traffic related to the courtyard landscaping project was captured. Following the construction, heavy vehicle traffic will be reduced to delivery and service vehicles only. Normal heavy vehicle percentages will likely decrease to less than 1.0 percent of all two-way traffic.
TABLE 8: CLASSIFICATION OF VEHICLES
The temporal distribution of data collected is summarized in Figure 8. The data collected on the internal roadway indicates that the weekday peak hour for the site typically occurs between the hours of 15:00 to 17:00, the Weekday peak hour typically occurs between 14:00 and 15:00.
Conclusions
The parking demand for the Riverside Glen site can be accommodated by the existing parking supply of 354 spaces. The observed peak parking demand is noted to be 281 spaces (75 percent utilization) and results in the site having a parking surplus of approximately 73 spaces.
To allow for attractive parking locations for visitors to the site, the existing communications plan that is used for employees, staff and students will continue to focus on the utilization of the gravel parking lot area.
The efficient use of the gravel parking area is dependent upon weather conditions and drivers ability to park efficiently. The gravel parking area will ultimately be developed as future apartment site. Prior to the construction of the apartment site, parking stops and temporary drive isles can be used to better define and assist in identifying appropriate parking spaces and layouts.
The site driveway connection to Woodlawn Road is currently operating with satisfactory levels of service during the AM and PM peak hours. The need for improvements to the existing lane geometry and/or traffic control is not required. An additional point of access to the subject site (if possible) would result in improved operations at the existing driveway connection and would assist in increasing on-site circulation.
Volume Percent Volume Percent Volume Percent
Passenger Car 2,510 97.5% 2,841 95.6% 5,351 96.5%
Short Truck 37 1.4% 69 2.3% 106 1.9%
Truck/Bus 18 0.7% 45 1.5% 63 1.1%
Transport Truck 9 0.3% 18 0.6% 27 0.5%
Total 2,574 100.0% 2,973 100.0% 5,547 100.0%
Inbound Outbound Two-WayVehicleType

January 22, 2014 Riverside Glen Traffic Impact & Parking Assessment
Page 12
The collected speed data for both inbound and outbound vehicle flows suggests that speeding issues on-site are perceived rather than factual. To further ensure low travel speeds, traffic calming measures such as speed humps and raised intersections could be implemented.
Please do not hesitate to contact us if you have any questions.
Yours very truly,
PARADIGM TRANSPORTATION SOLUTIONS LIMITED
Stewart K. Elkins BES, MITE Vice President

ATTACHMENTS


Figure 4Existing Count Volumes – Weekday One
Tuesday November 26, 2013Paradigmwww.ptsl.com
Village of Riverside GlenTraffic & Parking Assessment
NTS
CountPeriod Road Peak Site Peak
636
0
583
0
600
828 2 % 45 805
2 % 896
4 %
0
558
2 % 783
Wee
kday
One
PM
Pea
k H
our
Riv
ersi
de D
rive
way
30
53
0
PHF= 0.80
5 %
0 %
19 11
677
1
330 3 % 32
7 % 298
Riv
ersi
de D
rive
way
75
62
604
0
548
926 0 % 30 910
306
7 % 295
Wee
kday
One
AM
Pea
k H
our
Riv
ersi
de D
rive
way
70
40
0
PHF= 0.95
2 %
7 %
56 14
Woodlawn Rd10 0 %
26
48
0
PHF= 0.85
0 %
11
Woodlawn Rd19 0 %
0 %
5 %
Woodlawn Rd17
2 %
0 %
658
0
679
309
Woodlawn Rd21
0
0 %
5 %
53
PHF= 0.78
22
729 714
324
0
2 %
0
733
0 % 29
7 %
15
Riv
ersi
de D
rive
way

Figure 5Existing Count Volumes – Weekday Two
Tuesday November 28, 2013
NTS
CountPeriod
796
1 % 990 3 % 769
Woodlawn Rd10 0 % 19 0 %
642
0
593 3 %
0
603 661
0
574 6 %
0
593
1015 0 % 25 1006 810 2 % 41
60
0 0
PHF= 0.90
2 %
0 % PHF= 0.66
1 %
4 %
7 % 352 7 % 369R
iver
side
Dri
vew
ay
65
Riv
ersi
de D
rive
way
114
35
49 16
Woodlawn Rd
87 27
413 3 % 61 356 434 6 % 65 372
783
0
766 2 %
0
783 761
0
744
17 3
Woodlawn Rd17 0 % 18 0 %
3 %
0
762
Road Peak Site PeakW
eekd
ay T
wo
AM
Pea
k H
our
Wee
kday
Tw
oPM
Pea
k H
our
Riv
ersi
de D
rive
way
21
Riv
ersi
de D
rive
way
20
78 83
0 0
PHF= 0.85
6 %
50 % PHF= 0.66
12 %
33 %
17 4
Woodlawn Rd
Paradigmwww.ptsl.com
Village of Riverside GlenTraffic & Parking Assessment
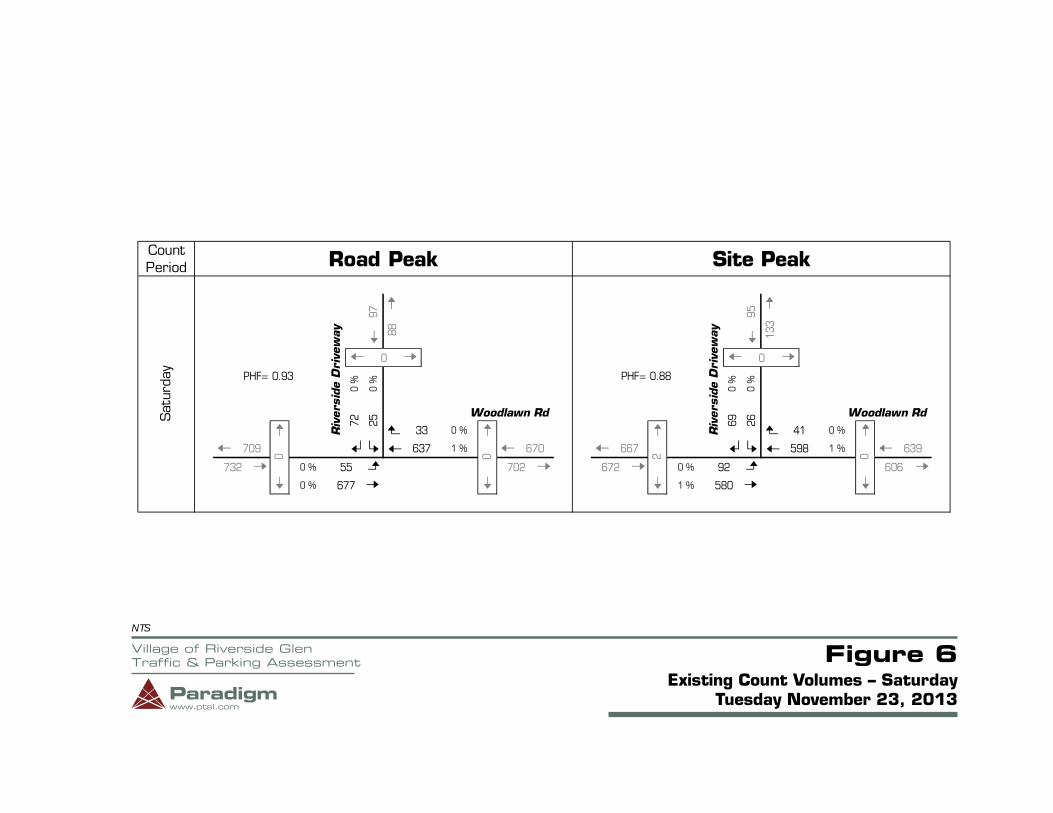
Figure 6Existing Count Volumes – Saturday
Tuesday November 23, 2013
NTS
CountPeriod
606
0 % 677 1 % 580
Woodlawn Rd
69 26
Woodlawn Rd33 0 % 41 0 %
1 %
0
639709
0
637 1 %
0
670 667
2
598
732 0 % 55 702 672 0 % 92
Sat
urda
y
Riv
ersi
de D
rive
way
97
Riv
ersi
de D
rive
way
95
88 133
0 0
PHF= 0.93
0 %
0 % PHF= 0.88
0 %
0 %
72 25
Road Peak Site Peak
Paradigmwww.ptsl.com
Village of Riverside GlenTraffic & Parking Assessment
9 kph 19 kph 29 kph 39 kph 49 kph 59 kph
In 2% 15% 86% 98% 100% 100%
Out 3% 21% 90% 98% 100% 100%
0%
10%
20%
30%
40%
50%
60%
70%
80%
90%
100%A
ccum
ulat
ive
Per
cent
age
Figure 7Accumulative Speed
Distribution CurveParadigmwww.ptsl.com
Village of Riverside GlenTraffic & Parking Assessment

Figure 8Temporal Distribution
of On-Site Travel
0
50
100
150
200
250
Thur12
6 12 18 Fri12
6 12 18 Sat12
6 12 18 Sun12
6 12 18 Mon12
6 12 18 Tue12
6 12
In Out Two-Way
Car Truck Total Car Truck
Thursday 1,091 37 1,128 96.7% 3.3%
Friday 817 39 856 95.4% 4.6%
Saturday 1,191 43 1,234 96.5% 3.5%
Sunday 722 20 742 97.3% 2.7%
Monday 1,023 44 1,067 95.9% 4.1%
Tuesday 507 13 520 97.5% 2.5%
Average Day 892 33 925 96.4% 3.6%
Total Weekday 3,438 133 3,571 96.3% 3.7%
Average Weekday 860 33 893 96.3% 3.7%
Total Weekend 1,913 63 1,976 96.8% 3.2%Average Weekend 957 32 989 96.8% 3.2%
VolumeDay
Percentage
Paradigmwww.ptsl.com
Village of Riverside GlenTraffic & Parking Assessment


ADDITIONAL PARKING DATA TABLES


UTILIZATION RATES
TIME Weekday One Weekday Two Saturday
07:30 42% 39% 31%
08:00 43% 43% 32%
08:30 48% 49% 31%
09:00 56% 55% 31%
09:30 61% 64% 32%
10:00 70% 70% 29%
10:30 74% 77% 37%
11:00 77% 76% 41%
11:30 75% 73% 40%
12:00 70% 76% 36%
12:30 73% 74% 38%
13:00 69% 71% 38%
13:30 67% 72% 38%
14:00 68% 67% 40%
14:30 61% 65% 37%
15:00 59% 62% 35%
15:30 58% 55% 34%
16:00 56% 46% 35%
16:30 48% 48% 33%
17:00 42% 42% 34%
17:30 40% 36% 27%
18:00 38% 36% 24%

PARKING DEMAND BY SPACE DESIGNATION – WEEKDAY ONE
Res
iden
tial
Vis
itor
Dis
able
15 M
inut
e
Bus
Med
ical
VIP
Ove
rall
Res
iden
tial
Vis
itor
Dis
able
Bus
Med
ical
VIP
Ove
rall
07:30 57 94 3 0 1 0 0 155 85% 36% 33% 100% 0% 0% 42%
08:00 56 97 3 0 1 0 0 157 84% 38% 33% 100% 0% 0% 43%
08:30 53 119 3 0 1 0 0 176 79% 46% 33% 100% 0% 0% 48%
09:00 57 140 3 2 1 3 0 206 85% 54% 33% 100% 50% 0% 56%
09:30 54 159 4 1 1 2 0 221 81% 62% 44% 100% 33% 0% 61%
10:00 55 197 3 0 1 1 0 257 82% 76% 33% 100% 17% 0% 70%
10:30 49 215 4 0 1 1 0 270 73% 83% 44% 100% 17% 0% 74%
11:00 48 226 4 0 1 2 0 281 72% 88% 44% 100% 33% 0% 77%
11:30 48 217 4 0 1 2 0 272 72% 84% 44% 100% 33% 0% 75%
12:00 47 202 4 0 1 1 0 255 70% 78% 44% 100% 17% 0% 70%
12:30 49 210 3 1 1 1 0 265 73% 81% 33% 100% 17% 0% 73%
13:00 46 201 3 0 1 2 0 253 69% 78% 33% 100% 33% 0% 69%
13:30 45 190 4 0 1 3 0 243 67% 74% 44% 100% 50% 0% 67%
14:00 50 186 5 0 1 6 1 249 75% 72% 56% 100% 100% 50% 68%
14:30 51 163 4 0 1 4 0 223 76% 63% 44% 100% 67% 0% 61%
15:00 48 155 6 0 1 5 1 216 72% 60% 67% 100% 83% 50% 59%
15:30 46 151 6 0 1 5 1 210 69% 59% 67% 100% 83% 50% 58%
16:00 50 143 5 1 1 3 1 204 75% 55% 56% 100% 50% 50% 56%
16:30 50 111 6 1 1 4 1 174 75% 43% 67% 100% 67% 50% 48%
17:00 51 90 6 2 1 4 1 155 76% 35% 67% 100% 67% 50% 42%
17:30 52 82 5 0 1 4 1 145 78% 32% 56% 100% 67% 50% 40%
18:00 53 75 6 0 1 3 1 139 79% 29% 67% 100% 50% 50% 38%
Parking Demand
Time
Parking Utilization Rate

PARKING DEMAND BY SPACE DESIGNATION – WEEKDAY TWO
Res
iden
tial
Vis
itor
Dis
able
15 M
inut
e
Bus
Med
ical
VIP
Ove
rall
Res
iden
tial
Vis
itor
Dis
able
Bus
Med
ical
VIP
Ove
rall
07:30 55 84 3 0 1 0 1 144 82% 33% 33% 100% 0% 50% 39%
08:00 54 96 3 0 1 1 1 156 81% 37% 33% 100% 17% 50% 43%
08:30 53 118 3 0 1 2 1 178 79% 46% 33% 100% 33% 50% 49%
09:00 53 140 3 0 1 4 1 202 79% 54% 33% 100% 67% 50% 55%
09:30 49 176 4 0 1 3 1 234 73% 68% 44% 100% 50% 50% 64%
10:00 47 201 3 0 1 1 1 254 70% 78% 33% 100% 17% 50% 70%
10:30 49 220 3 0 1 5 2 280 73% 85% 33% 100% 83% 100% 77%
11:00 47 217 4 0 1 5 2 276 70% 84% 44% 100% 83% 100% 76%
11:30 44 211 4 0 1 5 1 266 66% 82% 44% 100% 83% 50% 73%
12:00 46 222 4 0 1 4 2 279 69% 86% 44% 100% 67% 100% 76%
12:30 49 209 5 0 1 3 2 269 73% 81% 56% 100% 50% 100% 74%
13:00 45 205 3 0 1 2 2 258 67% 79% 33% 100% 33% 100% 71%
13:30 46 203 5 0 1 4 2 261 69% 79% 56% 100% 67% 100% 72%
14:00 44 188 5 0 1 5 2 245 66% 73% 56% 100% 83% 100% 67%
14:30 46 176 6 0 1 6 2 237 69% 68% 67% 100% 100% 100% 65%
15:00 48 161 7 0 1 6 2 225 72% 62% 78% 100% 100% 100% 62%
15:30 50 134 7 0 1 6 1 199 75% 52% 78% 100% 100% 50% 55%
16:00 49 109 6 2 1 1 1 169 73% 42% 67% 100% 17% 50% 46%
16:30 54 111 6 2 1 1 1 176 81% 43% 67% 100% 17% 50% 48%
17:00 50 95 3 2 1 2 0 153 75% 37% 33% 100% 33% 0% 42%
17:30 52 75 2 2 1 0 0 132 78% 29% 22% 100% 0% 0% 36%
18:00 53 75 2 2 1 0 0 133 79% 29% 22% 100% 0% 0% 36%
Time
Parking Utilization RateParking Demand

PARKING DEMAND BY SPACE DESIGNATION – SATURDAY
Res
iden
tial
Vis
itor
Dis
able
15 M
inut
e
Bus
Med
ical
VIP
Ove
rall
Res
iden
tial
Vis
itor
Dis
able
Bus
Med
ical
VIP
Ove
rall
07:30 51 53 3 0 0 4 1 112 76% 21% 33% 0% 67% 50% 31%
08:00 50 57 3 0 0 5 1 116 75% 22% 33% 0% 83% 50% 32%
08:30 50 56 3 0 0 4 1 114 75% 22% 33% 0% 67% 50% 31%
09:00 49 56 3 1 0 4 1 114 73% 22% 33% 0% 67% 50% 31%
09:30 45 64 3 1 0 4 1 118 67% 25% 33% 0% 67% 50% 32%
10:00 42 59 3 0 0 0 1 105 63% 23% 33% 0% 0% 50% 29%
10:30 40 82 5 2 0 5 2 136 60% 32% 56% 0% 83% 100% 37%
11:00 40 100 4 0 0 5 2 151 60% 39% 44% 0% 83% 100% 41%
11:30 44 91 4 0 0 5 2 146 66% 35% 44% 0% 83% 100% 40%
12:00 43 78 4 0 0 4 2 131 64% 30% 44% 0% 67% 100% 36%
12:30 46 82 4 0 0 5 2 139 69% 32% 44% 0% 83% 100% 38%
13:00 48 83 3 0 0 5 1 140 72% 32% 33% 0% 83% 50% 38%
13:30 48 83 3 0 0 5 1 140 72% 32% 33% 0% 83% 50% 38%
14:00 48 87 4 0 0 5 1 145 72% 34% 44% 0% 83% 50% 40%
14:30 46 79 5 0 0 5 1 136 69% 31% 56% 0% 83% 50% 37%
15:00 44 72 5 0 0 5 1 127 66% 28% 56% 0% 83% 50% 35%
15:30 45 68 4 2 0 5 1 125 67% 26% 44% 0% 83% 50% 34%
16:00 48 66 4 2 0 6 1 127 72% 26% 44% 0% 100% 50% 35%
16:30 48 63 3 1 0 5 2 122 72% 24% 33% 0% 83% 100% 33%
17:00 50 62 4 0 0 5 2 123 75% 24% 44% 0% 83% 100% 34%
17:30 45 45 4 0 0 4 1 99 67% 17% 44% 0% 67% 50% 27%
18:00 45 37 4 0 0 2 1 89 67% 14% 44% 0% 33% 50% 24%
Time
Parking Demand Parking Utilization Rate
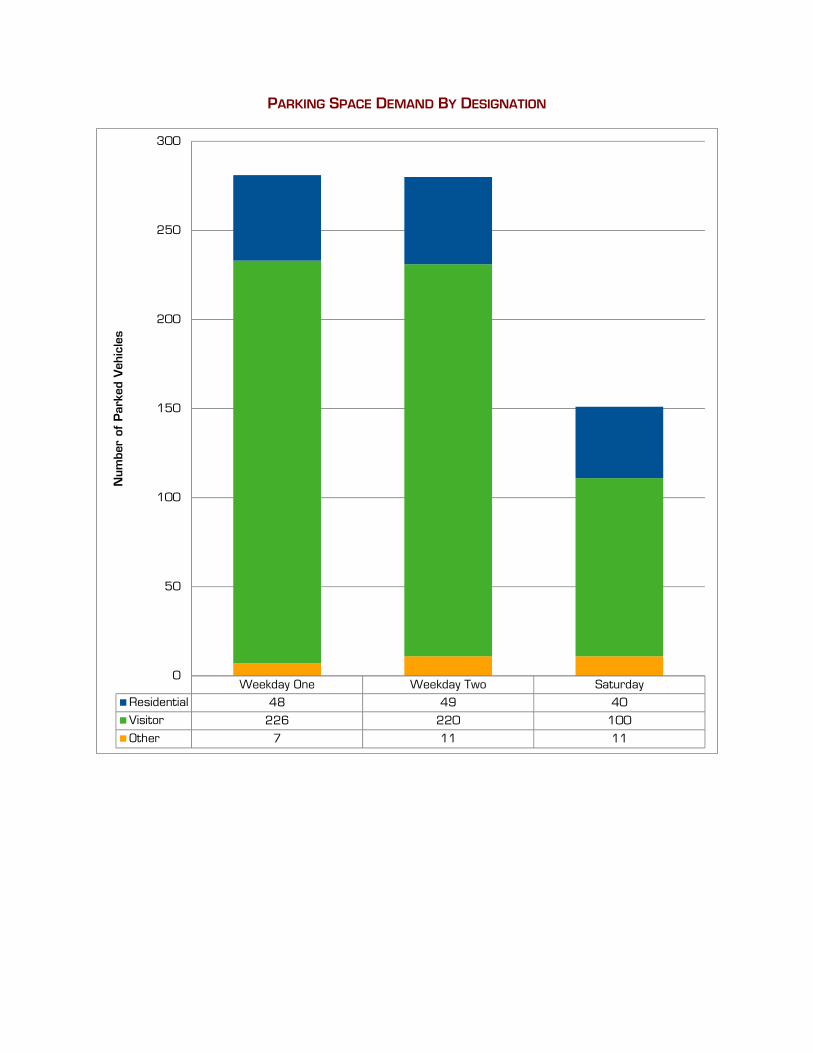
PARKING SPACE DEMAND BY DESIGNATION
Weekday One Weekday Two Saturday
Residential 48 49 40
Visitor 226 220 100
Other 7 11 11
0
50
100
150
200
250
300
Num
ber
of P
arke
d Veh
icle
s

TEMPORAL DISTRIBUTION OF OVERALL PARKING DEMAND
25%
35%
45%
55%
65%
75%
85%
Per
cent
Utiliz
atio
n
Weekday One Weekday Two Saturday
Recommended