RBC for Commercial Mortgages
1
2/15/13
Proposal
Life Insurance Company Risk-Based Capital
C-1 for Commercial Mortgages
October 26, 2012February 15, 2013

RBC for Commercial Mortgages
2
2/15/13
Summary of changes from May
Inclusion of a summary of Farm Loans in the Executive Summary
Revision of the list of pages of Life RBC requiring revision.
The examples on page 20 have been modified and updated.
A section outlining a proposal for mortgages held in Schedule BA has been added
(page 31)
A section outlining a proposed basis for RBC for Farm Loans has been added
(pages 32 – 35)
Changes from October
Edits to pages 7, 8, 19, 24, 30, 31, 35, 36
Replaced ‘internal appraisal’ with ‘internal valuation’ on page 23
Changed definition of CM2 and CM3 with respect to low DSC and low LTV
o Changed shading of charts on 15, 16, 26
o Changed the average loss values for CM2 and CM3 to reflect the revised
groups
o Changed formulas on page 25
Updated the AVR factors in Table 1 on page 25. Consistent with the NAIC 1 – 6
categories:
o The max. AVR is now the after tax proposed RBC amount
o The target AVR is approx. 80% of the max.
o The basic contribution is based on the mean annual expected loss
To bring in rolling average NOI - Paragraph on page 19

RBC for Commercial Mortgages
3
2/15/13
Contents
Executive Summary ............................................................................................................ 4
Proposal Overview .............................................................................................................. 6
Moody’s Analytics Commercial Mortgage Metrics Model ................................................ 9
ACLI’s Modeling Process................................................................................................. 13
Details of the Risk Based Capital Proposal ...................................................................... 18
Schedule BA Mortgages: .................................................................................................. 30
Proposal for Agricultural (Farm) Loans ........................................................................... 31
Proposal to Modify the Asset Valuation Reserve ............................................................. 35
Documentation of Company Information ......................................................................... 36
Glossary ............................................................................................................................ 37

RBC for Commercial Mortgages
4
2/15/13
Executive Summary
The shortcomings of the current risk based capital (RBC) formula for commercial
mortgages in good standing for life insurers, and in particular the Mortgage Experience
Adjustment Factor (MEAF), have been well documented. Over the past several years,
the American Council of life insurers (ACLI) and regulators have discussed how the
MEAF under certain market conditions magnifies even the smallest differences in
experience among companies. During this time the National Association of Insurance
Commissioners (NAIC) approved changes to the MEAF floor and ceiling for 2009-2012.
However, we recognize that these adjustments are temporary and that a permanent
replacement for the MEAF is needed.
This document outlines the proposed new RBC formula for commercial mortgages in
good standing, developed by the Commercial Mortgages RBC Working Group of the
ACLI with the following goals:
Improve the objectivity and informational quality of the regulatory tool used to
assess RBC for commercial mortgages held by life insurers;
Objectively evaluate the risk level of individual commercial mortgages in order to
assign them to risk categories requiring appropriate capital charges;
Assess risk using loan-level information, which lending professionals agree to be
critical;
Appropriately distinguish between differing levels of credit risk in the commercial
mortgages originated and held by life insurers;
Derive RBC factors for each risk category using currently available state-of-the-
art vendor analytical models to estimate the probability of default (PD), the
estimated loss given default (LGD), and the potential stressed loss, given the
initial risk levels of individual loans.
The ACLI proposes that the C-1 RBC component for a life insurer’s portfolio of
commercial mortgage loans be determined using a process similar to the method now
used to assign capital charges to corporate bonds. Individual loans would be grouped
into risk cohorts based on credit quality indicators, with capital requirements assigned to
each cohort. Readily available industry standard measures for commercial mortgages
have been shown1 to be good indicators of default probability. Having reviewed various
factors, our proposal focuses on the metrics of debt service coverage (DSC) and loan-to-
value (LTV) for loans in good standing. RBC for non-performing loans would be
computed in a fashion similar to the methods currently used for such loans.
This approach is consistent with the principle of RBC: to assess the risk of the assets held
by a company in order to help the regulator identify weakly capitalized companies. Since
1 See “Loss Characteristics of Commercial Real Estate Loan Portfolios” by Bradford Case, the Board of Governors of
the Federal Reserve, June 2003.

RBC for Commercial Mortgages
5
2/15/13
these assets are placed privately and generally held to maturity, the proposal relies on
industry accepted quality indicators. The method proposed provides transparency and
objectivity, and uses metrics that are normally required in the ongoing management of a
commercial mortgage portfolio. This process can be implemented by companies and
examined by the regulators. Capital requirements will change as loan characteristics
evolve with market conditions and as portfolio composition changes. We further note
that this proposal is similar to approaches that are now used to assess regulatory capital
requirements in the banking industry for similar assets.
The RBC charges in this proposal were developed using Moody’s Analytics Commercial
Mortgage Metrics (CMM) software and a vast data store of historical commercial
mortgage behavior, as documented in subsequent sections.

RBC for Commercial Mortgages
6
2/15/13
Proposal Overview
In order to replace the MEAF with a more informative method of assessing the C-1
component of RBC for commercial mortgages, the Commercial Mortgages RBC
Working Group of the ACLI has developed an approach for assessing the credit quality
of loans using the metrics DSC and LTV. Loans would be grouped into cohorts based on
ranges of DSC and LTV, and specific RBC charges assessed on these credit quality
cohorts.
This approach focuses on the ability of the borrower to make the payments required by
the terms of the mortgage loan. This is the key indicator of whether or not the loan will
default and is supported by recent regulatory guidance2 that encourages focusing on DSC.
This focus on DSC is complemented by a consideration of leverage, which compares the
value of the collateral to the amount of the loan and influences both default risk and the
potential for loss in the event of default.
Specifically, we propose the following model. Further details, rationale and practical
considerations are discussed in the section entitled “Details of the Risk Based Capital
Proposal”.
1) Establish five risk cohorts for commercial mortgages in good standing. Each cohort
will be assigned an RBC charge.
a) The development of the capital charges for these cohorts was based on extensive
historical data and credit loss modeling using Moody’s Analytics Commercial
Mortgage Metrics model (CMM) and is documented in the sections that follow.
2) Each loan in good standing will be assigned to one of these risk cohorts based on its
DSC and LTV.
a) DSC will be defined as the ratio of Net Operating Income (NOI) divided by
current Standardized Debt Service.
i) NOI will be the property’s income for the most recent annual period according
to the Commercial Real Estate Finance Council (CREFC) (formerly The
Commercial Mortgage Securities Association, Inc.) Methodology for
Analyzing and Reporting Property Income Statements. See Appendix A.
ii) Standardized Debt Service will be the annual debt service for the loan
calculated by amortizing the loan’s principal balance at the RBC calculation
date over a standard 25-year period at the contract interest rate.
b) LTV will be defined as the ratio of the current principal balance to a
contemporaneous property value.
i) The principal balance will be the aggregate of all loan principal pari passu or
senior to the debt held by the company at the RBC calculation date.
2 Policy Statement on Prudent Commercial Real Estate Loan Workouts (October 30, 2009), The Board of Governors of
the Federal Reserve System.

RBC for Commercial Mortgages
7
2/15/13
ii) The property value will be the value determined at loan origination and
trended forward using changes in the National Council of Real Estate
Investment Fiduciaries (NCREIF) Price iIndex since the loan’s origination
date. See Appendix B.
c) The DSC/LTV parameters that define each risk cohort will be the same for all
mortgages using office, retail, industrial or multifamily properties as collateral. A
second set of parameters will apply to mortgages with hotels and specialty
properties as collateral.
3) The RBC factor for the assigned risk cohort will be applied to the statutory carrying
value of the loan. The result for each loan will be summed to determine the RBC for
the commercial mortgages in good standing of the company.
4) Mortgages that are at least 90 days past due or in the process of foreclosure will be
assigned to a sixth and seventh category and receive factors of 18% and 23%
respectively, applied to the statutory carrying value, which includes the recognition of
impairments. While this does not constitute a change to the current factors applied to
such loans, we do acknowledge that these factors should be considered for future
review.
5) Farm Loans (Agricultural Loans) in good standing will be assigned to one of the 5
risk categories based on the LTV of each mortgage.
To implement this change, the following Life RBC forms and/or instructions must be
revised:
LR003 – Mortgage Experience Adjustment: eliminate;
LR004 – Mortgages: modify as outlined above;
LR009 – Schedule BA Mortgages: remove reliance on LR003. Affiliated
Mortgages follow a process parallel with Schedule B mortgages, while
unaffiliated mortgages will follow specific guidance.
LR010 – Asset Concentration Factor: remove reliance on LR003, and reference
values from the new lines of LR004 (revised) and LR009 (revised)
LR030 – Tax Effect: remove reliance on LR003, and reference values from the
new lines of LR004 (revised) and LR009 (revised)
The Asset Valuation Reserve (AVR) for Commercial Mortgages must also be revised if
the MEAF is to be eliminated. This proposal includes a recommendation for calculating
AVR by applying factors based on the same risk cohort classification defined for RBC.
We make no recommendation as to whether or not modifications are appropriate for the
C-1 components used in RBC calculations involving:
Commercial mortgages in the Health RBC;
Commercial mortgages in the Property and Casualty RBC;
Residential mortgages in the Life RBC;
Guaranteed mortgages in the Life RBC.

RBC for Commercial Mortgages
8
2/15/13
Limited changes may be appropriate to the Annual Statement schedules, notably
Schedule B. However, given the confidential nature of much of this information, ACLI
proposes defining a report in standard format that would be made available to regulators
upon request as part of the RBC calculations. Loan-level information on this report
would include such items as NOI, loan balance, current interest rate and property type as
outlined in Appendix D.

RBC for Commercial Mortgages
9
2/15/13
Moody’s Analytics Commercial Mortgage Metrics Model
Description of Model
Commercial Mortgage Metrics (CMM) is an analytical model developed and owned by
Moody’s Analytics. This model is a commercial application used in the marketplace by
underwriters, credit officers, risk managers, and portfolio managers in a variety of ways
to assist in risk assessment and measurement of commercial mortgage loans. Additional
detail is provided in Appendix C.
The primary commercial application of the model is the evaluation of future credit risk
for commercial mortgages both individually and within portfolios. Evaluation is
typically done by projecting potential future economic scenarios based on current and
recent past economic considerations as evaluated by domain experts, including but not
limited to Moody’s Analytics and CBRE Econometric Advisors.
This model, as it exists today, shares a similar framework with the modeling work done
by Walter Barnes and S. Michael Giliberto in the early 1990’s, which formed the basis of
the current RBC values. For ACLI’s purposes, Moody’s Analytics used CMM to model
loan behavior over actual historical periods rather than projected future scenarios.
Model Framework
CMM analyzes credit events. Credit events fundamentally depend on the financial
condition of the borrower to make required payments, including the value of the
underlying collateral, the market in which the collateral is operating and the level of
associated debt. Within the commercial mortgage market, credit events are substantially,
but not exclusively, driven by financial considerations. In addition to the obvious
question of whether this year’s income is sufficient for this year’s expenses, there may be
additional factors, including the borrower’s view of future income potential and the
ability to access other resources to cover current income shortfalls.
The CMM model has three key elements. Each will be discussed in this section:
Parameterization of the asset dynamics. This includes projections and volatility
measures for the property operating income and property value, among other
things.
Calculation of projected PD based on default algorithms applied to the modeled
asset dynamics and developed from extensive data sources and historically
observed default rates. These can include both expected and stressed values.
Calculation of LGD using empirically derived loss functions.

RBC for Commercial Mortgages
10
2/15/13
Parameterization of Asset Dynamics
CMM focuses on NOI simulations since DSC has been determined to be the most
important empirical variable related to PD. NOI simulations begin with the
characteristics of the property underlying the mortgage. Within the CMM framework,
these characteristics include current NOI, property type, occupancy and geographic
location.
The NOI is then projected using baseline economic assumptions in conjunction with
stochastic variations around that base for individual properties. The variance parameters
represent two distinct sources of risk:
Market or systemic risk
Non-systemic or idiosyncratic risk
CMM simultaneously simulates these market-wide and property idiosyncratic factors,
and the variation is used to estimate property performance risk. Variability of NOI at the
property level is overlaid on the market variability using Monte Carlo simulations.
For applications involving future periods, econometric projections from experts such as
Moody’s Analytics and CBRE Econometric Advisors form a baseline. However, for
purposes of this modeling exercise, the baseline projections were 10 year periods of
actual historic experience for loans originated each quarter between 1980 and 2000, as
discussed in the next section, and the modeled market risk was derived from the
economic cycles of the past 30 years. The historical NOI patterns used were developed
relying on data from NCREIF, CBRE Econometric Advisors, and Trepp’s CMBS Deal
Library for property types other than hotel.3 For hotels, volatilities were measured using
the data tracked by Smith Travel Research, which offers the most reliable financial
performance data in the hotel marketplace.
CMM also develops property value projections by applying an algorithm that translates
projected NOI and cap rate into likely value given the economic environment projected in
the model.
Calculation of Projected Probabilities of Default
CMM has developed default algorithms to assess the likelihood of default given the
projected DSC, LTV and market conditions. Default algorithms are based on commercial
mortgage loan experience tracked from the 1970’s through 2010. Data tracked includes
both loan level data and aggregate default rates. Data includes loans held by life insurers,
banks and CMBS.
3 Note that the data in Trepp’s CMBS Deal Library utilizes actual NOI according to the CREFC reporting standard,
which is consistent with ACLI’s proposed application.
RBC for Commercial Mortgages
11
2/15/13
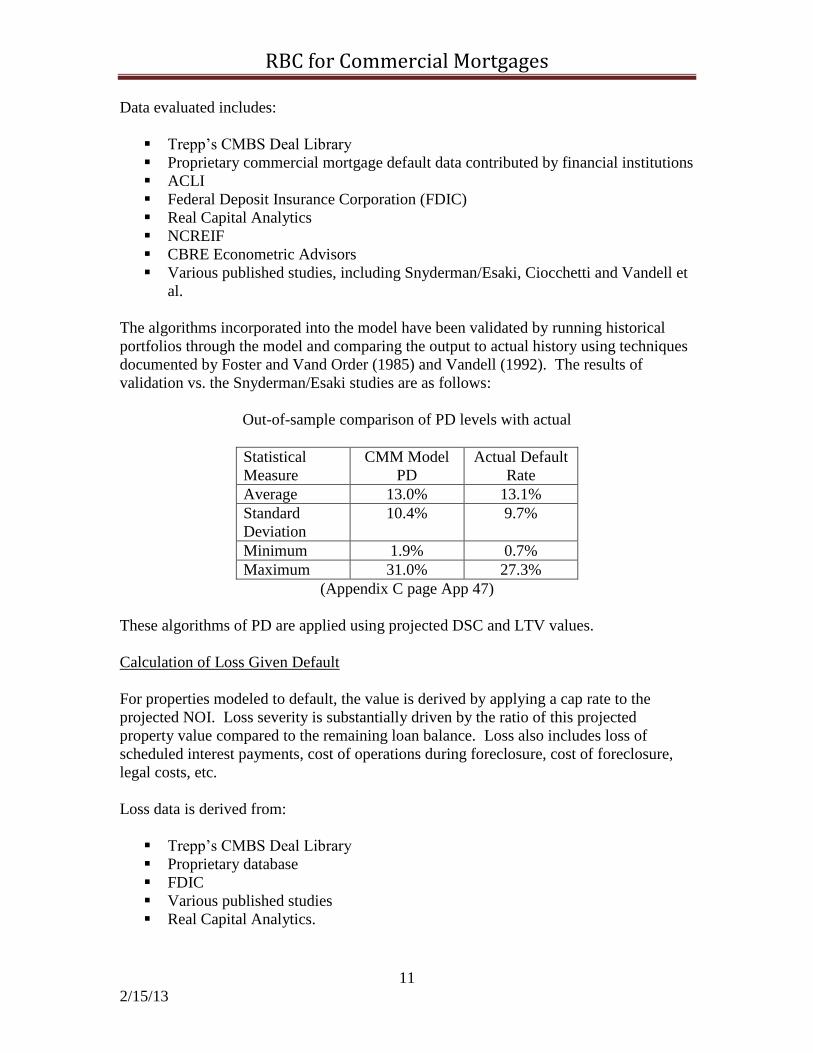
Data evaluated includes:
Trepp’s CMBS Deal Library
Proprietary commercial mortgage default data contributed by financial institutions
ACLI
Federal Deposit Insurance Corporation (FDIC)
Real Capital Analytics
NCREIF
CBRE Econometric Advisors
Various published studies, including Snyderman/Esaki, Ciocchetti and Vandell et
al.
The algorithms incorporated into the model have been validated by running historical
portfolios through the model and comparing the output to actual history using techniques
documented by Foster and Vand Order (1985) and Vandell (1992). The results of
validation vs. the Snyderman/Esaki studies are as follows:
Out-of-sample comparison of PD levels with actual
Statistical
Measure
CMM Model
PD
Actual Default
Rate
Average 13.0% 13.1%
Standard
Deviation
10.4% 9.7%
Minimum 1.9% 0.7%
Maximum 31.0% 27.3%
(Appendix C page App 47)
These algorithms of PD are applied using projected DSC and LTV values.
Calculation of Loss Given Default
For properties modeled to default, the value is derived by applying a cap rate to the
projected NOI. Loss severity is substantially driven by the ratio of this projected
property value compared to the remaining loan balance. Loss also includes loss of
scheduled interest payments, cost of operations during foreclosure, cost of foreclosure,
legal costs, etc.
Loss data is derived from:
Trepp’s CMBS Deal Library
Proprietary database
FDIC
Various published studies
Real Capital Analytics.

RBC for Commercial Mortgages
12
2/15/13
The most recent loss data are heavily weighted toward loans operating in the CMBS
market and do not reflect important options available to life insurers to minimize loss. In
particular:
Life insurers who hold whole loans or who participate jointly in a loan have a
greater ability to work with borrowers prior to default and to restructure when
feasible. In contrast, CMBS servicers are constrained in their ability to work
with borrowers to maximize return given Real Estate Mortgage Investment
Conduits (REMIC) rules.
Banks and CMBS servicers have limitations on holding assets subsequent to
foreclosure, which can lead to forced sales in a distressed market, significantly
increasing losses. Life insurers’ requirements to liquidate assets in a given
timeframe are much less restrictive, which allows for property stabilization and
sales in a more favorable market conditions.
In order to reflect these structural differences, Moody’s Analytics produced two sets of
values for use by the ACLI. One set of projections is based on the Moody’s Analytics
baseline LGD assumptions. A second set lowered the average LGD to recognize that
more than 50% of delinquent mortgages held by life insurers are restructured or
otherwise managed and result in a significantly lower loss.

RBC for Commercial Mortgages
13
2/15/13
ACLI’s Modeling Process
ACLI worked with Moody’s Analytics to simulate the historical performance of
hypothetical loans with defined initial DSC and LTV ratios, property types, and
amortization and maturity periods. The behavior of each of these loan specifications was
then projected using CMM over the 84 different 10-year periods that begin in each
calendar quarter from 1980–2000, which includes the worst real estate downturn since
the Great Depression. These 84 baseline projections, which are based on realized
historical experience, thoroughly simulates the behavior of a loan with the same original
characteristics during the economic patterns of a 30-year period.
For each of the 84 origination quarters and for each loan specification, 3,000 stochastic
projections of variation in NOI were also run, using market risk factors derived from
actual historical variation. These NOI patterns vary both by economic environment and
by potential differences in behavior for individual properties relative to the general
marketplace. By comparison, when RBC for bonds was developed in 1990, the modeling
process projected the credit loss experience of 400 bonds over 500 randomly generated
scenarios.
The projection of NOI, when combined with contract interest rate and amortization,
defines projected DSC. When combined with projected cap rates and loan balance, it
also defines projected LTV.
For each loan specification and origination quarter, the model computed the expected loss
(mean), the 90th
, the 92nd
and the 95th
percentile loss based on the 3,000 stochastic
scenarios. These results were then averaged across origination quarters in order to
estimate the mean loss and tail loss for each loan specification over the economic cycles
spanning 1980 to the present.
As a result, for example, we can estimate the mean and tail loss of a loan with
characteristics such as the following:
DSC: 1.40x
LTV: 60%
Amortization: 30 years
Maturity: 10 years
Property type: Office
The mortgage note rate in each scenario was based on the average for life insurer
commitments in the modeled year of origination. Each projection assumed average
property size and starting value for the property type and average vacancy rates given the
starting NOI.

RBC for Commercial Mortgages
14
2/15/13
Translation of Modeling into AVR and RBC Values
The modeling process produced a large database of expected losses at the mean, median,
92nd
percentile and 95th
percentile. In order to group loans into risk categories and
determine the factors to assign to each category for AVR and RBC, the following steps
were taken:
1) For each property type, amortization period and remaining maturity, three tables of
values were produced:
a. Mean expected loss
b. Tail expected loss at the 92nd
percentile
c. Excess of Tail Loss over mean loss (b – a)
Each table was two dimensional with DSC along one axis and LTV along the other.
DSC was measured from 0.40 to 2.00 in 0.20 increments and LTV from 40% to 120%
in 10% increments.
2) For each property type and amortization period, remaining maturity was eliminated as
a distinguishing factor by blending the tables based on the distribution of remaining
maturities for loans held by the life industry as of June 30, 2010. In addition, the
projected future losses were discounted to model commencement using 5% interest
and a presumption of level annual losses over the maturity period. The following
table shows the maturity weights used and the discount factors applied:
* Based on ACLI member holdings on June 30, 2010.
3) Differences in results by property type were next examined, and a set of tables was
produced that averaged across four property types: Office, Industrial, Retail and
Multifamily. Although historical experience has varied across these property types,
that variation could not be identified as resulting from fundamental differences in the
nature of the marketplace for each property type, as is discussed further below.
Hotels, which are dependent on daily rentals, do appear to have an inherently
different risk profile and were given a separate set of factors, which would also apply
to Specialty properties.
Remaining
Maturity
in years
Weight*
Discount
factor @
5.00%
2 25% 0.952381
4 19% 0.907029
6 19% 0.863838
8 12% 0.822702
10 25% 0.783526
RBC for Commercial Mortgages
15
2/15/13
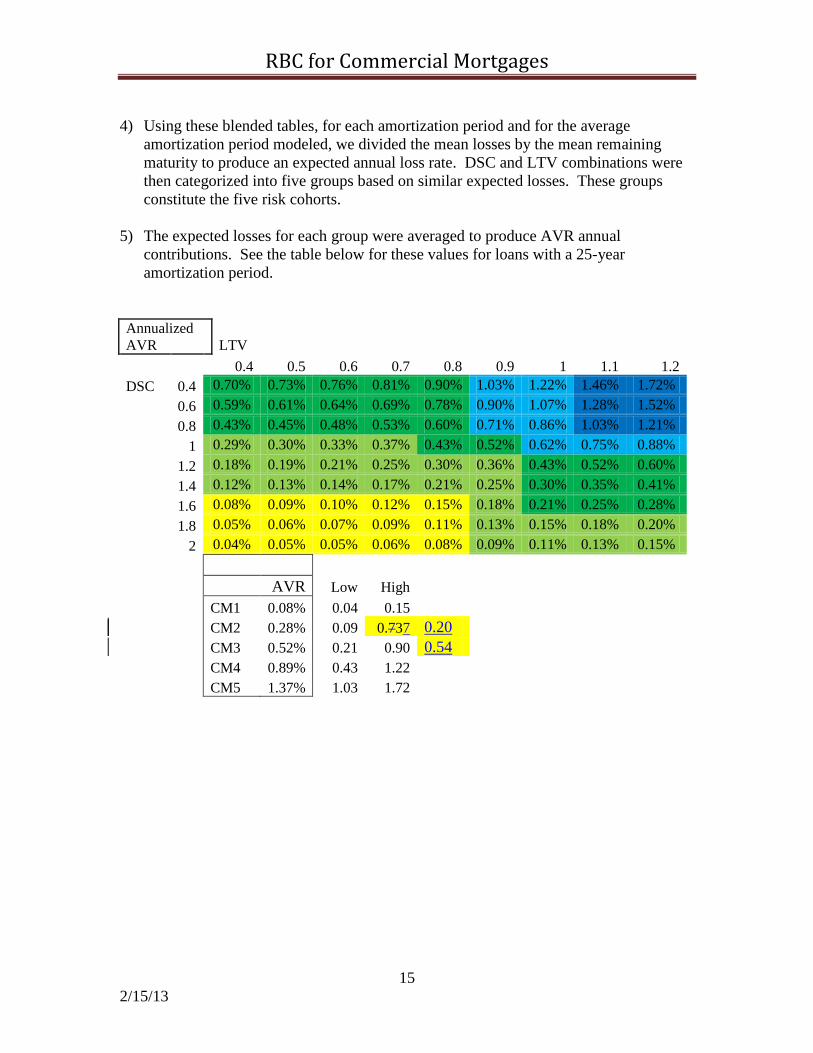
4) Using these blended tables, for each amortization period and for the average
amortization period modeled, we divided the mean losses by the mean remaining
maturity to produce an expected annual loss rate. DSC and LTV combinations were
then categorized into five groups based on similar expected losses. These groups
constitute the five risk cohorts.
5) The expected losses for each group were averaged to produce AVR annual
contributions. See the table below for these values for loans with a 25-year
amortization period.
Annualized
AVR LTV
0.4 0.5 0.6 0.7 0.8 0.9 1 1.1 1.2
DSC 0.4 0.70% 0.73% 0.76% 0.81% 0.90% 1.03% 1.22% 1.46% 1.72%
0.6 0.59% 0.61% 0.64% 0.69% 0.78% 0.90% 1.07% 1.28% 1.52%
0.8 0.43% 0.45% 0.48% 0.53% 0.60% 0.71% 0.86% 1.03% 1.21%
1 0.29% 0.30% 0.33% 0.37% 0.43% 0.52% 0.62% 0.75% 0.88%
1.2 0.18% 0.19% 0.21% 0.25% 0.30% 0.36% 0.43% 0.52% 0.60%
1.4 0.12% 0.13% 0.14% 0.17% 0.21% 0.25% 0.30% 0.35% 0.41%
1.6 0.08% 0.09% 0.10% 0.12% 0.15% 0.18% 0.21% 0.25% 0.28%
1.8 0.05% 0.06% 0.07% 0.09% 0.11% 0.13% 0.15% 0.18% 0.20%
2 0.04% 0.05% 0.05% 0.06% 0.08% 0.09% 0.11% 0.13% 0.15%
AVR Low High
CM1 0.08% 0.04 0.15
CM2 0.28% 0.09 0.737 0.20
CM3 0.52% 0.21 0.90 0.54
CM4 0.89% 0.43 1.22
CM5 1.37% 1.03 1.72
RBC for Commercial Mortgages
16
2/15/13
6) In a similar manner, the values from the chart of the excess of the discounted tail
loss over the mean loss (92nd
percentile minus the mean) were averaged for each
group to obtain preliminary RBC factors. See the second table below.
7) For the Hotel and Specialty factors, the DSC and LTV parameters of the five risk
cohorts were chosen such that the same RBC charge could appropriately be used
for a Hotel or for one of the other property types in the same risk category.
Generally, a Hotel loan under this proposal requires a lower LTV and higher DSC
in order to fall into the same risk category as a loan on one of the other four
property types. We again used the 92nd
percentile accumulated losses, determined
averages over target groups of data points, and subtracted the AVR values for the
each risk category. This resulted in the following preliminary RBC factors.
Excess of
92nd
% over
mean
LTV
0.4 0.5 0.6 0.7 0.8 0.9 1 1.1 1.2
DSC 0.4 0.31% 0.45% 0.69% 1.10% 1.76% 2.69% 3.67% 4.45% 4.98%
0.6 0.59% 0.72% 0.95% 1.33% 1.95% 2.82% 3.76% 4.51% 5.06%
0.8 0.95% 1.08% 1.31% 1.69% 2.27% 3.08% 3.95% 4.71% 5.31%
1 1.08% 1.21% 1.43% 1.79% 2.33% 3.03% 3.79% 4.48% 5.08%
1.2 0.96% 1.09% 1.30% 1.62% 2.07% 2.63% 3.24% 3.81% 4.32%
1.4 0.75% 0.87% 1.05% 1.32% 1.67% 2.10% 2.55% 2.98% 3.37%
1.6 0.56% 0.66% 0.81% 1.02% 1.28% 1.59% 1.91% 2.22% 2.51%
1.8 0.40% 0.48% 0.60% 0.76% 0.95% 1.17% 1.40% 1.63% 1.84%
2 0.29% 0.35% 0.45% 0.56% 0.70% 0.86% 1.02% 1.18% 1.34%
CM1 0.89% 0.89%
CM2 1.90% 1.71%
CM3 2.58% 3.07%
CM4 5.02% 5.02%
CM5 6.56% 6.56%
CM1 1.00%
CM2 1.76%
CM3 3.14%
CM4 4.73%
CM5 10.86%

RBC for Commercial Mortgages
17
2/15/13
8) Combining these preliminary RBC values for Hotels (7) with the preliminary
RBC values for the main property types (6), we developed the following
recommended RBC values (Note: Hotel & Specialty properties represent less
than 5% of the collateral backing life insurer Commercial Mortgages and the
Recommended RBC Values are heavily weighted to the Base Properties values):
There are two primary reasons why these recommended factors can be viewed to
overestimate risk capital requirements for life insurer originated loans:
1) Using a loan by loan analysis has the effect of assuming 100% correlation among
assets within a portfolio. While it is recognized that some degree of correlation
does exist, ignoring any offsets is clearly a conservative approach.
2) These values are derived based on Moody’s Analytics baseline LGD assumptions.
A second run was performed using lower LGD assumptions that would be
expected to more closely follow life insurer practice and experience (see page 11
above). Using these lower LGD values would have produced AVR and RBC
values as follows:
AVR RBC
CM1 0.06% 0.73%
CM2 0.21% 1.43%
CM3 0.42% 2.76%
CM4 0.74% 4.68%
CM5 1.18% 6.26%
These values are approximately 10% lower than the baseline values.
Base
Properties
Hotel &
Specialty
Recommended
RBC Values
CM1 0.89% 1.00% 0.90%
CM2 1.711.90% 1.76% 1.75%
CM3 3.072.58% 3.14% 3.00%
CM4 5.02% 4.73% 5.00%
CM5 6.56% 10.86% 7.50%

RBC for Commercial Mortgages
18
2/15/13
Details of the Risk Based Capital Proposal
Under the proposed RBC model outlined in the Overview section above, the C-1
component RBC amounts for all commercial mortgages in good standing on Schedule B
would be determined based on DSC and LTV computed at the annual statement date.
Unlike the current MEAF structure, this would reflect the migration of loans to different
risk cohorts over time. Also, the proposed model would result in a natural increase to
RBC as market conditions deteriorate prior to a credit event and the reduction of RBC
when market conditions are favorable. Rather than holding industry RBC nearly constant
and reallocating between companies, this method would allow total industry RBC to rise
or fall depending on economic circumstances and the credit quality mix of the industry
holdings themselves. This type of structure will provide companies with a greater ability
to plan appropriate capital use and allocation.
Risk factors other than DSC and LTV were considered, but were found either to not
materially impact the result, or were reasonably handled within the structure proposed.
These factors included:
Amortization period: As discussed below, all loans are standardized to a
common amortization period of 25 years, which reflects the significant risk
reduction benefit of amortization without requiring additional tables of RBC
factors.
Age of loan: Default experience varies by age of loan, with the highest default
rates occurring in the 3rd
to 6th
years. Since all loans under the proposed
model are treated as newly originated, their projected losses include these
highest risk years, which would be a conservative assumption for more
seasoned loans.
Size of loan: There are minor differences in loss experience by loan size. A
slightly higher rate of default on larger loans appears to be offset by a lower
loss percentage, since fixed expenses are spread over a greater loan balance.
The variation was considered immaterial enough not to require further
consideration in this context.
The details of the DSC and LTV calculation follow.
Debt Service Coverage (DSC)
Empirical research4 has shown that DSC is a powerful predictor of commercial mortgage
default risk. Additionally, DSC is a largely objective calculation that uses the actual
revenues and expenses of the collateral to determine NOI. For the purposes of RBC,
DSC would be calculated as the ratio of the property’s NOI to the loan’s standardized
debt service.
4 See “Loss Characteristics of Commercial Real Estate Loan Portfolios” by Bradford Case, the Board of Governors of
the Federal Reserve, June 2003.

RBC for Commercial Mortgages
19
2/15/13
The majority of commercial mortgage loans require the borrower to provide the lender
with at least annual financial statements. The NOI would be determined at the RBC
calculation date based on the most recent annual period from financial statements
provided by the borrower and analyzed based on accepted industry standards. The most
recent annual period is determined as follows:
If the borrower reports on a calendar year basis, the statements for the calendar
year ending December 31 of the year prior to the RBC calculation date will be
used. For example, if the RBC calculation date is 12/31/2012, the most recent
annual period is the calendar year that ends 12/31/2011.
If the borrower reports on a fiscal year basis, the statements for the fiscal year that
ends after June 30 of the prior calendar year and no later than June 30 of the year
of the RBC calculation date will be used. For example, if the RBC calculation
date is 12/31/2012, the most recent annual period is the fiscal year that ends after
6/30/2011 and no later than 6/30/2012.
The foregoing time periods are used to provide sufficient time for the borrower to
prepare the financial statements and provide them to the lender, and for the lender
to calculate the NOI.
The accepted industry standards we are recommending for determining NOI were
developed by the Commercial Mortgage Standards Association now known as CRE
Financial Council (CREFC)., We propose that NOI be developed using the standards
provided by instructions of the CREFC Methodology for Analyzing and Reporting
Property Income Statements (Appendix A),. which isThese standards are part of the
CREFC Investor Reporting Package (CREFC IRP Section VII.) developed to support
consistent reporting for commercial real estate loans owned by third party investors. This
reporting format and guidance would be a standardized basis for determining and
reporting NOI for RBC.
The NOI will be adjusted to use a 3 year rolling average for the DSC calculation. For
2013, a single year of NOI will be used. For 2014, 2 years will be used, weighted 65%
most recent year and 35% prior year. Thereafter, 3 years will be used weighted 50%
most recent year, 30% prior year, and 20% 2nd
prior year. This will apply when there is a
history of NOI values. For new originations, including refinancing, the above schedule
would apply by duration from origination. For the special circumstances listed below,
the specific instructions below will produce the NOI to be used, without further
averaging.
The standardized debt service would be determined as follows:
The life insurer will determine the payment required to fully amortize the
principal balance at the RBC calculation date over a 300 month (25 year) period
at the loan’s interest rate.
o For fixed interest loans the standardized debt service would be computed
using the actual contract interest rate.

RBC for Commercial Mortgages
20
2/15/13
o For a variable rate loan the standardized debt service would be computed
using the higher of the current period interest rate or the average interest
rate for the prior 12 month period.
This payment would be multiplied by 12 to determine the annual debt service.
Different amortization periods for a loan with otherwise similar characteristics could lead
to different risk profiles. This could be accounted for by developing different factors for
each possible amortization period. ACLI recommends that a more efficient way to adjust
for this is to restate the debt service to a standardized period for analysis. A 25 year
amortization is a standard used by many companies. This provides for a higher DSC for
interest only type loans but a lower DSC for short amortization loans. The
standardization of the debt service to use a 25 year amortization for all loans provides a
comparable basis to quantify risk between different loan structures. It is desirable to
avoid a situation where the RBC model may cause companies to prefer riskier loan
structures, but also to keep the process as simple and manageable as possible. Consider
the following case study where all factors are the same except for the amortization
schedule of the loans:
CM Category Cumulative
EL (7 years)
Term LTV DSC DSC
Contractual
DSC
Normalized
RBC
15 yr amort 60% 1.03 CM2 CM2 1.25%
20 yr amort 60% 1.24 CM2 CM2 1.38%
25 yr amort 60% 1.40 CM2 CM2 1.34%
30 yr amort 60% 1.52 CM1 CM2 1.28%
I/O 60% 1.96 CM1 CM2 1.12%
This example demonstrates that while different amortization periods result in different
DSC values for an identical loan, the risk as measured by the cumulative expected loss
at 92nd percentile minus mean is very similar for all amortization periods. It is
appropriate to classify identical loans with varying amortization into the same risk
category receiving the same RBC charge. Doing this can be done in one of two ways:
(1) develop different grids for assigning loans to risk categories that take the
amortization period into account or (2) use a standardized amortization period. Standard
amortization provides a less complex way to classify loans into appropriate risk
categories that can be easily implemented and reviewed.
Some would argue that the unstandardized debt service is a more relevant risk measure
for loans with shorter amortization terms, since it represents the amount the borrower is
obligated to pay by the terms of the loan. However, is important to also consider how
quickly equity is being build up, thereby reducing the potential for loss.

RBC for Commercial Mortgages
21
2/15/13
DSC in Special Situations
Cross Collateralization
Lending institutions may make individual loans and cross collateralize them with other
loans made to the same borrower. The cross collateralization gives the lending institution
the option, but not the obligation, to use the value of the cross collateralized loans to
financially support each other. Since use of the cross collateralization is initiated at the
option of the lender, the lending institution may report DSC either on a cross
collateralized pool basis or separately for each individual loan. This selection may be
made at any time but must be made consistently for all loans in the cross collateralized
pool.
Unavailable Operating Statements
There are a variety of situations where the most recent annual period’s operating
statement may not be available to assist in determining NOI. These situations will occur
in distinct categories and each category requires special consideration. The categories are:
1. Loans on owner occupied properties
a. For properties where the owner is the sole or primary tenant (50% or more
of the rentable space), property level operating statements may not be
available or meaningful. If the property is occupied and the loan, taxes
and insurance are current, it will be acceptable to derive income and a
reasonable estimate of expenses from the most recent appraisal or
equivalent and additional known actual expenses (e.g., real estate taxes
and insurance).
b. For properties where the owner is a minority tenant (49% of less of the
rentable space), the owner-occupied space should be underwritten at the
average rent per square foot of the arm’s length tenant leases. This
income estimate should be added to the other tenant leases and combined
with a reasonable estimate of expenses based on the most recent appraisal
or equivalent and additional known actual expenses (e.g., real estate taxes
and insurance).
2. Borrower does not provide the annual operating statement
a. Borrower refuses to provide the annual operating statements
i. If the leases are in place and evidenced by estoppels and
inspections, NOI would be derived from normalized underwriting
in accordance with the CREFC Methodology for Analyzing and
Reporting Property Income Statements.
ii. If there is evidence from inspection that the property is occupied,
but there is no evidence of in place leases (e.g., lease documents or
RBC for Commercial Mortgages
22
2/15/13
estoppels), NOI would be set equal to the lesser of calculated debt
service (DSC=1.0) or the NOI from the normalized underwriting.
iii. If there is no evidence from inspection that the property is
occupied and no evidence of in place leases (e.g., lease documents
or estoppels), assume NOI = $0.
b. If the borrower does not have access to a complete previous year operating
statement, determine NOI based on the CREFC guidelines for analyzing a
partial year income statement.
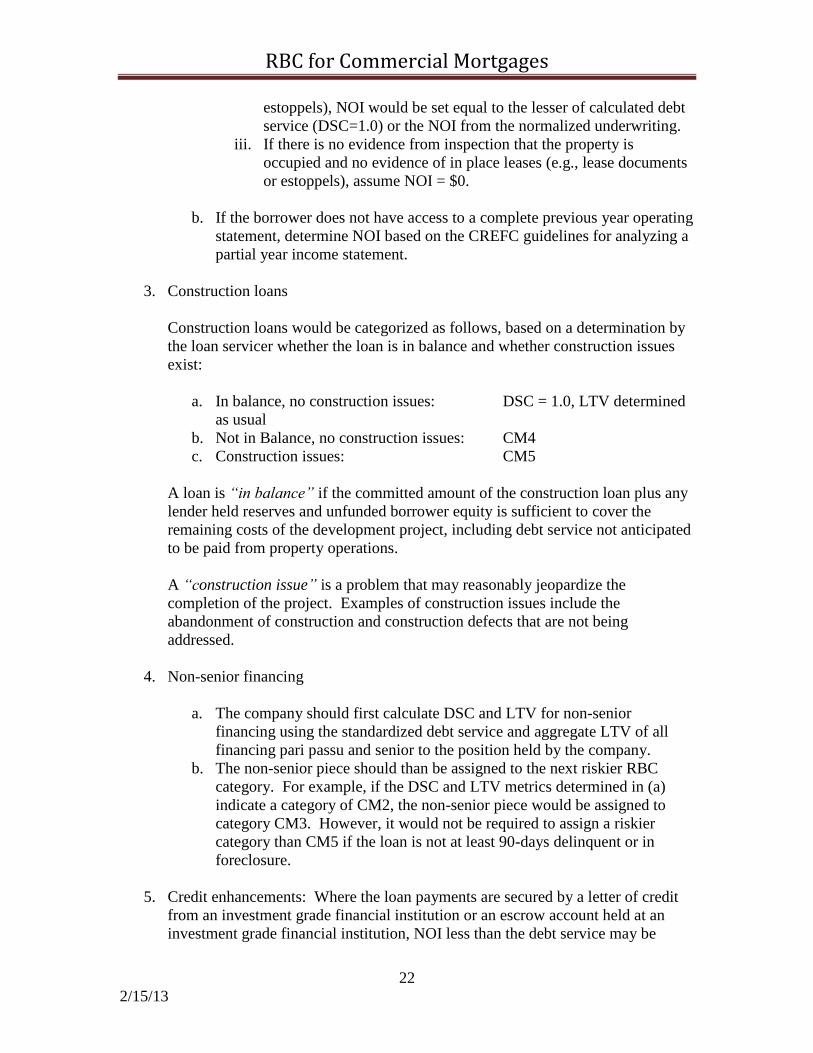
3. Construction loans
Construction loans would be categorized as follows, based on a determination by
the loan servicer whether the loan is in balance and whether construction issues
exist:
a. In balance, no construction issues: DSC = 1.0, LTV determined
as usual
b. Not in Balance, no construction issues: CM4
c. Construction issues: CM5
A loan is “in balance” if the committed amount of the construction loan plus any
lender held reserves and unfunded borrower equity is sufficient to cover the
remaining costs of the development project, including debt service not anticipated
to be paid from property operations.
A “construction issue” is a problem that may reasonably jeopardize the
completion of the project. Examples of construction issues include the
abandonment of construction and construction defects that are not being
addressed.
4. Non-senior financing
a. The company should first calculate DSC and LTV for non-senior
financing using the standardized debt service and aggregate LTV of all
financing pari passu and senior to the position held by the company.
b. The non-senior piece should than be assigned to the next riskier RBC
category. For example, if the DSC and LTV metrics determined in (a)
indicate a category of CM2, the non-senior piece would be assigned to
category CM3. However, it would not be required to assign a riskier
category than CM5 if the loan is not at least 90-days delinquent or in
foreclosure.
5. Credit enhancements: Where the loan payments are secured by a letter of credit
from an investment grade financial institution or an escrow account held at an
investment grade financial institution, NOI less than the debt service may be
RBC for Commercial Mortgages
23
2/15/13
increased by these amounts until it is equal to but not exceeding the debt service.
These situations are typically short term in nature, and are intended to bridge the
lease-up following renovation or loss of a major tenant.
6. Non-income-producing land: NOI = $0
Loan to Value (LTV)
LTV is a predictor of both default risk and the severity of loss given default, and is most
useful when considered in combination with DSC. For RBC, LTV would be determined
by dividing the principal balance of all pari passu and senior debt at the RBC calculation
date by the contemporaneous property value. The loan’s principal balance would reflect
any amortization based on payments made, and reflects the borrower’s obligation to the
lender(s). Value would be derived as follows:
Begin with the origination value developed during the underwriting process using
appropriate appraisal standards.
o If values were received from a qualified third party appraiser, those values
must be used.
o If the company performs internal appraisals valuations using a
processstandards comparable to an external appraisal, then the internal
valuationappraisal may be used.
Apply the change in the value of the NCREIF Real Property Price Index
(“NCREIF Price Index”) between the origination date and the most recent
publication to the value at origination.
o This method results in a proxy for a current property value.
o The use of an index avoids the potential for subjectivity in valuation as
well as the cost of obtaining updated property appraisals, while providing
a sound and objective means to measure changing risk profiles
consistently across the industry.
The National Council of Real Estate Investment Fiduciaries (NCREIF) is an association
of institutional real estate professionals who share a common interest in their industry.
They are investment managers, plan sponsors, academicians, consultants, appraisers,
CPAs and other service providers who have a significant involvement in institutional real
estate investments. They come together to address vital industry issues and promote
research. The NCREIF Price Index is an industry standard benchmark for U.S.
commercial real estate investment performance with data beginning in 1978 and now
covering $233 billion in property owned by institutional investors. The NCREIF Price
Index is a component of the NCREIF Total Return Index.
It is recommended companies use the NCREIF Price Index at the national level for all
combined property types. Although NCREIF develops and publishes values at more
detailed levels, the national index is recommended for the following reasons:

RBC for Commercial Mortgages
24
2/15/13
The database of properties is large in total, but for any more granular level it
reduces to small sample sizes that are not statistically sound and would result in
greater volatility.
The proposed RBC model provides consistent treatment for all property types.
Using a single index is consistent with that base recommendation.
The NCREIF Price Index includes data from all the major property types (office,
retail, industrial, multifamily and hotel), which makes it broadly applicable to any
of those property types.
Attached as Addendum A is a chart showing the current value (June 30, 2011) of
property for each $1 of initial value at the time of loan origination.
Proposed Categories and Factors
After the calculation of DSC and LTV as defined above, RBC will ultimately be
determined by applying factors from Table 1, as shown below, on a loan-by-loan basis to
the statutory carrying value of eachall commercial mortgages in a company’s investment
portfolio, net of any involuntary reserve adjustments.
The ACLI recommendation is that industrial, multifamily, office and retail properties all
be assigned to the risk categories using the parameters of DSC and LTV defined in Table
2 as shown below. The appropriateness of these factors was determined using a blend of
experience from these four property types.
We examined whether it was necessary to vary factors more granularly by property type.
An analysis of the modeled PD and expected losses produced some interesting
observations. For loans originating in 1990–1998, which would have had their entire 10
year modeled experience during a ‘stable’ economic environment, the mean and tail
losses were very similar in pattern and level for each of the four main property types.
The variations in experience were seen primarily during the 1990–1993 and 2008
downturns. Analysis of those two periods indicates the variations were due to factors that
could apply to any property type, such as overbuilding, rather than to fundamental
differences in risk characteristic among the property types.
Hotels and specialty properties, on the other hand, were observed to have a higher risk
profile in all circumstances. It is proposed that hotels be classified using the parameters
as defined in Table 3 below.

RBC for Commercial Mortgages
25
2/15/13
RBC and AVR Factors
Table 1
For All Commercial Mortgage Loans
RBC
Group
Proposed
AVR basic
Contribution
Proposed
AVR Target
Proposed
AVR Max
Proposed
RBC
Factor
CM1 0.10 % 0.350 % 0.650 % 0.90 %
CM2 0.35 % 1.100 % 1.3050 % 1.75 %
CM3 0.60 % 1.752.00 % 2.253.00 % 3.00 %
CM4 1.05 % 3.0075 % 3.755.00 % 5.00 %
CM5 1.60 % 4.255.00 % 75.50 % 7.50 %
CM6 4.20 % 107.600 % 12.00 % 18.00 %
CM7 0.00% 17.00 % 17.00 % 23.00 %
Table 2
For Office, Industrial, Retail and Multi-family
Risk category DSC limits LTV limits
CM1 1.50 ≤ DSC < and ≤ LTV < 85%
CM2 ≤ DSC < 1.50 and ≤ LTV < 55%
CM2 0.95 ≤ DSC < 1.50 and 55% ≤ LTV < 75%
CM2 1.15 ≤ DSC < 1.50 and 75% ≤ LTV < 100%
CM2 1.50 ≤ DSC < and 85% ≤ LTV < 100%
CM2 1.75 ≤ DSC < and 100% ≤ LTV <
CM3 ≤ DSC < 0.95 and 55% ≤ LTV < 85%
CM3 0.95 ≤ DSC < 1.15 and 75% ≤ LTV < 100%
CM3 1.15 ≤ DSC < 1.75 and 100% ≤ LTV <
CM4 ≤ DSC < 0.95 and 85% ≤ LTV < 105%
CM4 0.95 ≤ DSC < 1.15 and 100% ≤ LTV <
CM5 ≤ DSC < 0.95 and 105% ≤ LTV <
CM6 Loans 90 days past due but not yet in process of foreclosure
CM7 Loans in process of foreclosure

RBC for Commercial Mortgages
26
2/15/13
This translates approximately into the following visual map:
LTV
40% 50% 60% 70% 80% 90% 100% 110% 120%
DSC 0.40 CM3CM2 CM3CM2 CM3 CM3 CM3 CM4 CM4 CM5 CM5
0.60 CM3CM2 CM3CM2 CM3 CM3 CM3 CM4 CM4 CM5 CM5
0.80 CM3CM2 CM3CM2 CM3 CM3 CM3 CM4 CM4 CM5 CM5
1.00 CM2 CM2 CM2 CM2 CM3 CM3 CM4 CM5 CM5
1.20 CM2 CM2 CM2 CM2 CM2 CM2 CM3 CM3 CM3
1.40 CM2 CM2 CM2 CM2 CM2 CM2 CM3 CM3 CM3
1.60 CM1 CM1 CM1 CM1 CM1 CM2 CM3 CM3 CM3
1.80 CM1 CM1 CM1 CM1 CM1 CM2 CM2 CM2 CM2
2.00 CM1 CM1 CM1 CM1 CM1 CM2 CM2 CM2 CM2
Table 3
For Hotels and Specialty Commercial (excluding Agriculture)
Risk category DSC limits LTV limits
CM1 1.85 ≤ DSC < and ≤ LTV < 60%
CM2 1.45 ≤ DSC < 1.85 and ≤ LTV < 70%
CM2 1.85 ≤ DSC < and 60% ≤ LTV < 115%
CM3 0.90 ≤ DSC < 1.45 and ≤ LTV < 80%
CM3 1.45 ≤ DSC < 1.85 and 70% ≤ LTV <
CM3 1.85 ≤ DSC < and 115% ≤ LTV <
CM4 ≤ DSC < 0. 90 and ≤ LTV < 90%
CM4 0.90 ≤ DSC < 1.10 and 80% ≤ LTV < 90%
CM4 1.10 ≤ DSC < 1.45 and 80% ≤ LTV <
CM5 1.10 ≤ DSC < and 90% ≤ LTV <
CM6 Loans 90 days past due but not yet in process of foreclosure
CM7 Loans in process of foreclosure.
This translates approximately into the following visual map:
LTV
40% 50% 60% 70% 80% 90% 100% 110% 120%
DSC 0.40 CM4 CM4 CM4 CM4 CM4 CM5 CM5 CM5 CM5
0.60 CM4 CM4 CM4 CM4 CM4 CM5 CM5 CM5 CM5
0.80 CM4 CM4 CM4 CM4 CM4 CM5 CM5 CM5 CM5
1.00 CM3 CM3 CM3 CM3 CM4 CM5 CM5 CM5 CM5
1.20 CM3 CM3 CM3 CM3 CM4 CM4 CM4 CM4 CM4
1.40 CM3 CM3 CM3 CM3 CM4 CM4 CM4 CM4 CM4
1.60 CM2 CM2 CM2 CM3 CM3 CM3 CM3 CM3 CM3
1.80 CM2 CM2 CM2 CM3 CM3 CM3 CM3 CM3 CM3
2.00 CM1 CM1 CM2 CM2 CM2 CM2 CM2 CM2 CM3

RBC for Commercial Mortgages
27
2/15/13
Restructured Loans
One of the structural benefits a life insurer has when managing commercial mortgages is
the ability to respond to changes with a borrower, the mortgage security, or the economic
environment in a prudent manner. As a portfolio lender, life insurers are not typically
limited by REMIC or other provisions that restrict modifications to loan terms, especially
when it comes to commercial mortgages that are facing declining income.
It often makes economic sense for companies to modify the terms of a loan (e.g., lower
the interest rate for a period of time or extend the amortization or maturity) rather than
initiate a foreclosure. RBC formulas should not discourage actions that provide greater
economic benefit to the lender. The recent guidance from financial regulators5 regarding
commercial loan workouts states that:
“…the most appropriate and prudent course is to restructure or renew loans to
existing borrowers who have demonstrated an ability to pay their debts, but who
may not be in a position, at the time of the loan’s maturity, to obtain long-term
financing. The regulators recognize that prudent loan workout agreements or
restructurings are generally in the best interest of both the institution and the
borrower.
In general, renewals or restructurings of maturing loans to commercial borrowers
who have the ability to repay on reasonable terms will not be subject to adverse
classification…”
Under this proposal, performing modified commercial mortgages, also referred to as
restructured loans, would be not be treated differently from other commercial mortgages
that are not restructured. Specifically, the restructured loan would determine LTV and
DSC based on the principal balance on the RBC calculation date. The principal balance
may or may not have been reduced as part of the restructure, but will always represent the
financial obligation the borrower has to the lender. The value component of the LTV
calculation will represent the value of the property as of the restructure date adjusted
using the same NCREIF index for future periods. An example of these changes is
presented below.
5Policy Statement on Prudent Commercial Real Estate Loan Workouts (October 30, 2009), The Board of
Governors of the Federal Reserve System.

RBC for Commercial Mortgages
28
2/15/13
Restructured Loan Example
Property: Office building
Issue: Property NOI and value have declined and NOI is insufficient to cover
debt service. The proposed restructure of the loan reduces the interest rate
to improve coverage. Due to the nature of the change, the modification is
considered a Troubled Debt Restructure, automatically making the loan
impaired. The life company will write down the statutory carrying value
of the loan as part of the required impairment process.
Before Restructure After Restructure
Term 7 Years 5 Years
Origination Date 1Q2008 1Q2010
Origination Property Value $80,000,000 $58,000,000
Loan Statutory Carrying Value $55,000,000 $51,637,384
Principal Balance $55,000,000 $55,000,000
LTV 69% 95%
NCREIF Index at Origination 416.6083 295.2411
Indexed Property Value (as of 1Q2010) $56,694,233 N/A
Indexed LTV (as of 1Q2010) 97% N/A
NOI (as of 1Q2010) $4,000,000 $4,000,000
Contract Interest Rate 6.00% 4.50%
Standardized DSC 0.94 1.09
RBC Classification CM4 CM3
RBC Factor 5.00% 3.00%
RBC Amount $2,750,000 $1,549,122
Write-down $0 $3,362,616
Total “Capital” Impact $2,750,000 $4,911,738
The above example shows a loan that could likely become nonperforming and result in a
foreclosure and significant loss to the lender. However, since life companies have the
option to restructure loans, a significant loss can be avoided. Life companies use
restructuring when a loan has a temporary but significant decline in NOI and value.
Because the decline is temporary the life company can earn a greater economic return by
restructuring then loan. If the decline in NOI and value was not temporary, the life
company would foreclose, since restructuring would not lead to a greater economic
return.
The restructure of the loan in the example allows the lender to potentially recover all
principal, since the property value and NOI would be expected to increase over time.
However, the value lost as a result of the restructured terms (lower interest rate) is
recognized immediately by means of a write-down that impacts current year income and
reduces statutory surplus. The AVR factor and RBC charge subsequent to the restructure
should be seen as representing an additional cushion for losses above and beyond the
write-down already taken, if any.

RBC for Commercial Mortgages
29
2/15/13
RBC for Non-Performing Commercial Mortgages
There is no change recommended to the factors for non-performing loans. Loans 90-days
or more delinquent will be categorized as CM6 and assessed an RBC charge of 18%.
Loans that are in the in-process of foreclosure at the annual statement date will be
categorized as CM7 and assessed an RBC charge of 23%. These are the current factors
for such loans. The current process sets the RBC for each of these categories as the
category percent times the mortgage value prior to any write down, minus the value of
any write-down, but not less than the RBC for the remaining mortgage as an ‘in good
standing’ mortgage. This same process is proposed to be followed, developing the DSC
and LTV for the remaining loan to determine a CM risk category.

RBC for Commercial Mortgages
30
2/15/13
In addition to direct mortgages held in Schedule B, some companies hold mortgage like
investments in Schedule BA. Schedule BA provides for 2 classes of assets with
characteristics of mortgages – Affiliated and Unaffiliated. At year end 2011, the total
amounts for the Life company general accounts were $2,776 million of Affiliated and
$1,971 million of Unaffiliated, assets with characteristics of mortgages as held on
Schedule BA.
It is proposed that aAffiliated mMortgages would follow the procedures outlined for
directly held mortgages, and value the underlying mortgages directly. Since these are
affiliated, companies should have access to the necessary information.
For the Unaffiliated Mortgages, it is proposed that there be the following approaches.
1) For Investments that contain covenants whereby factors of maximum LTV and
minimum DSC, or equivalent thresholds must be complied with and it can be
determined that the Investments are in compliance, these investments would use
the process for directly held mortgages useing the maximum LTV and minimum
DSC.
2) Investments that are defeased with government securities will be assigned to
CM1.
3) Other investments comprised primarily of senior debt will be assigned to CM2.
4) All other investments in this category will be assigned CM3. This would include
assets such as a mortgage fund that invests in mezzanine or sub debt, or
investments that cannot be determined to be in compliance with the covenants.
RBC for Commercial Mortgages
31
2/15/13
ACLI is proposing that the risk for Agricultural Loans (Farm Loans) be measured using
the Loan-to-Value ratio based on the collateral value derived in the underwriting process,
or as updated through underwriting precipitated by a change to the loan documents
(restructure or supplemental borrowing) or through re-appraisal or re-evaluation. In
addition, the values will be updated at least each 5th
anniversary using the company’s
documented process for updating loan collateral values within its risk management
procedures.
Farm Loans held by life insurers total $18 Billion, which collectively constitutes less than
6% of the total mortgages held by life insurers, and about 0.5% of the total general
account assets of life insurers. They are concentrated in 4 companies, each of whom has
been engaged in offering Farm Loans for more than 100 years, and for whom Farm Loans
represent between 1% and 3% of the company’s general account assets. In reviewing the
portfolios of the key companies, typically more than 80% of outstanding loan amounts
have had the collateral re-valued during the past 5 years.
Farm Loans is a broad class of loans backed by collateral to farms or agricultural related
business. Farm Loans not only consist of farms that raise crops or livestock, but also
extend to timber and forestry, and to businesses that support the agriculture industry.
Farm Loans are classified into categories based on the underlying business utilizing the
collateral. As each of these categories presents somewhat different risks, the proposal is
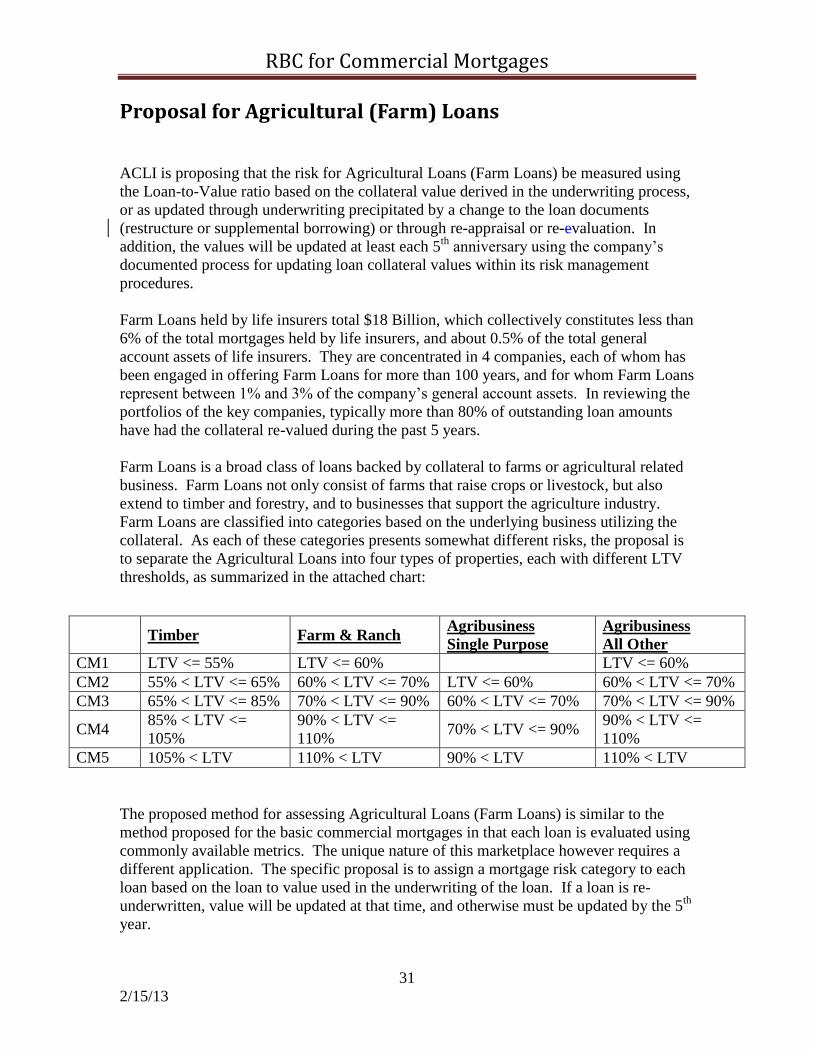
to separate the Agricultural Loans into four types of properties, each with different LTV
thresholds, as summarized in the attached chart:
The proposed method for assessing Agricultural Loans (Farm Loans) is similar to the
method proposed for the basic commercial mortgages in that each loan is evaluated using
commonly available metrics. The unique nature of this marketplace however requires a
different application. The specific proposal is to assign a mortgage risk category to each
loan based on the loan to value used in the underwriting of the loan. If a loan is re-
underwritten, value will be updated at that time, and otherwise must be updated by the 5th
year.
Timber Farm & Ranch
Agribusiness
Single Purpose
Agribusiness
All Other
CM1 LTV <= 55% LTV <= 60% LTV <= 60%
CM2 55% < LTV <= 65% 60% < LTV <= 70% LTV <= 60% 60% < LTV <= 70%
CM3 65% < LTV <= 85% 70% < LTV <= 90% 60% < LTV <= 70% 70% < LTV <= 90%
CM4 85% < LTV <=
105%
90% < LTV <=
110% 70% < LTV <= 90%
90% < LTV <=
110%
CM5 105% < LTV 110% < LTV 90% < LTV 110% < LTV

RBC for Commercial Mortgages
32
2/15/13
In general, the nature of both the operating income of the borrowers and the business
operations are different from other commercial mortgages, and justify these variations.
With regard to income, it is recognized that agricultural commodity prices are sometimes
volatile. Loans are underwritten with this volatility in mind, and underwriters do not rely
on projections of “stabilized income” for Farm Loans. More importantly, for many, if
not most Farm Loans, the operations and earnings of the borrower are generally broader
than and do not generally rely solely on the income from the underlying loan collateral.
It is typical for a borrower’s operations to be financed by multiple lenders, including
various real estate loans, operating lines of credit, equipment lease financing and/or
vendor financing. Profitability of a borrower’s operations is paramount, but it is
generally not possible to allocate income to particular loans. Underwriting relies heavily
on the lender’s assessment of the ability of the borrower to service all outstanding loans.
It is uncommon for lenders of Farm Loans to require annual or ongoing financial reports
making it difficult if not impossible to utilize on-going enterprise DSC as a measuring
tool. Projected enterprise DSC, not necessarily collateral DSC, is determined at loan
origination, using sustainable commodity prices and operating expenses. Additionally,
the vast majority of Farm Loans are recourse loans, meaning that if there is a default;
recovery is not limited to the value of the underlying collateral. In the event of default,
the collateral becomes the primary source of recovery with its value determined by the
market
Moody’s Analytics was not asked to model agricultural loans as they do not possess a
database of loans from which to parameterize their model. Industry experience, however,
suggests that LTV is a good indicator of performance, and we recommend LTV as the
basis for RBC charges. For purposes of updating property values, we have concluded
that no single index can reasonably reflect the wide variety of agricultural properties held
by the life industry. Consequently we believe that it is both reasonable and necessary to
rely on company practices. Our survey of three major agricultural lenders found that a
majority of loans had the collateral re-valued within five years by normal course of
events. We recommend that these valuations be used for RBC purposes. We also
recommend that the company’s documented internal processes for updating values be
used for those loans that are not updated through another event, at least each 5th year.

RBC for Commercial Mortgages
33
2/15/13
Definitions of each type of Farm Loan:
Timber: A loan is classified as a timber loan if more than 50% of the collateral market
value (land and timber) of the security is attributable to land supporting a timber crop that
is or will be of commercial value.
Farm & Ranch: Farm and ranch land utilized in the production of agricultural
commodities of all kinds, including grains, cotton, sugar, nuts, fruits, vegetables, forage
crops and livestock of all kinds, including, beef, swine, poultry, fowl and fish. Loans
included in this category are those in which agricultural land accounts for more than 50%
of total collateral market value.
Agribusiness Single Purpose: Specialized collateral utilized in the production, further
processing, adding value or manufacturing of an agricultural commodity or forest
product. In order for a loan to be classified as such, the market value of the single-
purpose (special use) collateral would account for more than 50% of total collateral
market value.
This collateral is generally not multi-functional and can only be used for a specific
production, manufacturing and/or processing function within a specific sub-sector of the
food or agribusiness industry and whereby such assets are not strategically important in
nature to the overall industry capacity. These assets can be shut down or replicated easily
in other locations, or existing plants can be expanded to absorb shuttered capacity. The
assets are not generally limited in nature by environmental or operational permits and/or
regulatory requirements. An example would be a poultry processing plant located in the
Southeast of the United States where there is excess capacity inherent to the industry and
production capacity is easily replaceable.
Other loans included in this category are those collateralized by single purpose (special
use) confinement livestock production facilities in which the special use facilities account
for more than 50% of total collateral market value.
Agribusiness All Other: Multiple-use collateral utilized in the production, further
processing, adding value or manufacturing of an agricultural commodity or forest
product. In order for a loan to be classified as such, the market value of any single use
portion may not be greater than 50% of total collateral market value.
This collateral is multi-functional in nature, adaptable to other manufacturing, processing,
or servicing food or agribusiness industries or sub-industries. Assets could also be very
strategic in nature and not easily replaceable either due to cost, location, environmental
permitting and/or government regulations. These assets may be single purpose in nature,
but so vital to the industry capacity needs that they will be generally purchased by
another like processing company or strategic or financial buyer. An example of these
types of assets are strategically located and highly automated cold storage facilities
whereby they can be used for dry storage, distribution centers or converted into

RBC for Commercial Mortgages
34
2/15/13
warehouse or other type uses. Another example may be a cheese processing plant that is
strategically located within the heart of the dairy industry, limited permits, environmental
restrictions that would limit added capacity, or high barriers to entry to build a like
facility within the industry. For example, one of the largest cheese plants in the industry
is located in California and it is not easily replicated within the cheese processing
industry due to its location, capacity, costs, access to fluid milk supply and related feed
and water, as well as highly regulated environmental and government restrictions.
Other loans included in this category are those in which more than 50% of the collateral
market value is accounted for by chattel assets or other assets related to the business and
financial operations of agribusinesses, including inventories, accounts, trade receivables,
cash and brokerage accounts, machinery, equipment, livestock and other assets utilized
for or generated by agribusiness operations.
RBC for Commercial Mortgages
35
2/15/13
Proposal to Modify the Asset Valuation Reserve
Modifying the Asset Valuation Reserve (AVR) for Commercial Mortgages was not a
driving force behind the research and the need for modifications. However, the current
AVR is based on the Mortgage Experience Adjustment Factor, which this proposal
recommends be discontinued. Given that, we propose a complementary revised AVR
calculation below.
AVR is a reserve that stabilizes the income statement effect of variations in default
experience around the mean expected losses. For bonds AVR is developed by
contributing an amount, based on the NAIC asset category, which can be higher or lower
depending on how close the reserve is to a defined maximum.
We propose that the AVR for commercial mortgages follow a process parallel to that
currently in place and used for bonds. The risk categorization process used for the RBC
would also be used for the AVR. Once a commercial mortgage is assigned to a category
(i.e., CM1-CM7), that classification will be used to determine both the AVR and the RBC
using the factors in Table 1 above.
Proposed values for the annual contribution to AVR were determined using the mean
expected loss values generated by the modeling performed by Moody’s Analytics as
documented in the section on ACLI’s Modeling Process above. Using the weighted
average maturity values for the property types, the mean cumulative expected loss was
divided by the average remaining maturity to develop a mean annual expected loss.
These were then categorized into homogenous categories that form the basis of the risk
categories discussed above and results in the recommended AVR levels in Table 1.

RBC for Commercial Mortgages
36
2/15/13
Documentation of Company Information
This proposal for RBC uses values that are not part of an insurer’s annual statement. and
may not appropriately belong there The documentation of these calculations shall remain
and be treated as confidential and privileged. as required under state statutes that
correspond to Section 8 of NAIC Model #312 – Risk Based Capital (RBC) Model Act.
We propose that these calculations be documented in a common format, and that the
documentation be available to the commissioner to examine on request as part of the
RBC Report, and that the confidentiality of the documentation of these calculations shall
be protected as required under the state’s statutes corresponding to the provisions of
Section 8 of NAIC Model #312.. We expect the documentation of these calculations to
be shared by the commissioner with the NAIC for analysis. When sharing any
information, the commissioner should maintain the confidentiality of the information
with a written agreement from the NAIC to maintain its confidentiality and privileged
status and to maintain a comprehensive written information security program that
includes administrative, technical, and physical safeguards to protect the security and
confidentiality of the information. Appendix D to this document outlines a proposed
format to be used to document these values.

RBC for Commercial Mortgages
37
2/15/13
Glossary
Amortizing: A loan in which the principal amount is being partially repaid with each
payment, generally scheduled to be fully repaid over a specified period of time.
Floating Rate Loan: A loan in which the amount of interest to be paid is not fixed, but
rather varies based on an index values generally available, e.g. London Interbank
Offered Rate (LIBOR)
Commercial Mortgage: a mortgage granted to a business or trust for the purpose of
acquiring or refinancing commercial property, and secured by real property classified or
zoned as having commercial use.
Construction Loan: a loan on a commercial property for the purpose of building or
improving the property. Generally, the property will not be income producing while
under construction.
I/O: Interest only loan—a loan in which interest only is being paid, and no principal
payments are currently included in the loan payments.
Impairment/Impaired Loan: A loan is impaired when, based on current information and
events, it is probable that a creditor will be unable to collect all amounts due according to
the contractual terms of the loan agreement. All amounts due according to the
contractual terms means that both the contractual interest payments and the contractual
principal payments of a loan will be collected as scheduled in the loan agreement.
Pari Passu: More than one loan sharing the same seniority level.
Senior / Seniority: When the borrower has Mmore than one loan where the junior loan
absorbs losses before losses flow to the senior lender(s).
Statutory Carrying Value: Statutory book value adjusted for permanent impairments and
involuntary reservesvaluation allowance.
Troubled Debt Restructure/Restructured Loan: The restructuring of a debt constitutes a
Troubled Debt Restructure if the creditor for economic or legal reasons related to the
debtor’s financial difficulties grants a concession to the debtor that it would not otherwise
consider.

Appendices
Appendix A – CREFC IRP reporting standard
Appendix B – NCREIF Price Index
Appendix C – Commercial Mortgage Metrics
Appendix D – Documentation requirements
Appendix E – Life RBC pages and instructions
APP p1

VII. CREFC/MBAMethodology for Analyzing and Reporting Property Income Statements
Page 64 CREFC IRP Version 5.1 Effective 12/1/2010

CREFC Investor Reporting Package
MBA/CREFC Methodology for Analyzing and Reporting Property Income Statements
(Operating Statement Analysis Report, NOI Adjustment Worksheet, Comparative Financial Status Report, Property File, Periodic File, and the Financial File)
Note: These instructions are for the completion of the NOI Adjustment Worksheets (“NOIWS”) and the Operating Statement Analysis Report (“OSAR”), and when used in conjunction with the attached Master Coding Matrix, constitute the CREFC/MBA methodology for determining standard Net Operating Income/Net Cash Flow (NOI/NCF). The information included in the NOIWS and OSAR flow through to the related files and supplemental reports that are part of the CREFC IRP. The Servicers will use best efforts to utilize this methodology. However, to the extent that the servicing agreement calls for different methodologies, the user should adhere to the terms of the servicing agreement.
The operating data from borrowers is used by many different parties for purposes of analysis; therefore, it is necessary to provide this information in a more standardized format. The following pages define a methodology for standardizing the analysis and reporting of this data to provide a framework for consistent reporting across different Servicers. The reports discussed below show underwriting information and ongoing information for subsequent years, as well as the most recent financial information available. The mortgage issuer has the responsibility for providing the original underwriting information at securitization (“At Contribution Information”) to the Servicer and Sub-servicer for the mortgages they originate. This information must be incorporated into the OSAR by the Servicer or sub-servicer as reported by the Issuer. This will allow for meaningful analysis based on historical data.
The responsibility for collecting financial and property operating information from the borrower for each transaction is usually placed on the Servicer or Sub-servicer but it may vary with each transaction. Collecting and analyzing this information is an extremely important task because the results provide investors and others the ability to measure the performance of the underlying collateral. This, in turn, provides insight as to the performance of the loan.
The operating information collected from the borrowers should be used to populate the NOIWS and the OSAR. The NOIWS and the OSAR are then used to populate the related files and supplemental reports. CREFC/MBA standardization methodology for NOI/NCF calls for the utilization of standard templates, which vary by property type, for the NOIWS and the OSAR. These templates have been customized as to revenue and expense categories for the various property types. The four property type templates of the OSAR and NOIWS are as follows:
1. Multifamily including Mobile Home Parks and Co-ops 2. Healthcare 3. Lodging 4. Commercial (including Retail, Office, Industrial/Warehouse, Self-Storage and Mixed Use)
The attached Master Coding Matrix should be used to categorize underlying revenues and expenses in the NOIWS and OSAR into the proper broader revenue and expense categories that have been established for each property type.
NOI Adjustment Worksheet (NOIWS)�� The NOIWS documents any adjustments, which could include normalization and/or annualization
adjustments, made to the borrower’s actual data by the Servicer to determine normalized NOI and NCF. The NOIWS is a critical component in the reporting process and must be completed and accompany the OSAR since the normalized NOI and NCF will flow through to the OSAR. Please refer to the Revenue/Expense matrix for the items that require adjustment or elimination from the analysis. The Servicer will enter the borrower submitted data in the actual column of the NOIWS with the exception of line items that are classified as “ELIMINATE” on the Master Coding Matrix. All elimination or adjustment comments should be noted in the comments section of both the NOIWS and
Page 65 CREFC IRP Version 5.1 Effective 12/1/2010

CREFC Investor Reporting Package
OSAR as discussed below. Comments related to items eliminated per the Master Coding Matrix are not required.
� The NOIWS and the OSAR should be completed by the Servicer on a quarterly basis. However the 1st quarter analysis will not be required unless a property is analyzed on a trailing 12 month basis, or if the loan is on the Watch List. Servicers should still collect the 1st quarter statements in the event analysis on a trailing 12 month basis is required in the future.
� Any annualization of the reported data should be footnoted on the NOIWS.
� While the borrower’s reporting requirements (both content and frequency) will be dictated by the underlying loan documents, the servicing agreement typically requires that a servicer complete the NOIWS or the OSAR within a specific time frame once they have received the borrower’s most recent operating statement. There are typically two kinds of reporting periods; interim and fiscal year-end,and there are different requirements for each.
o Interim information is for periods of less than 12 months, and is typically unaudited. The property data should be normalized, regardless of the number of months, and may be annualized provided that there is at least 6 months of information available.
o Fiscal year end information should also be normalized and may be annualized to address large differences in reported cash flow. To maintain comparability between reported fiscal years, annualization should only be done with 6 or more months of operating results and operating results of less than 6 months should not be reported. If a loan is assumed, the servicer should attempt to get at least 6 months of operating data to allow annualization and reporting of fiscal year end information that year. For annualized statements, the beginning and ending date of the statement from the borrower used to annualize should be reported.
Normalization and Reporting of Financial Information
Normalization of operating statement information helps to facilitate a meaningful comparison of a property’s ongoing performance to its performance at the time of underwriting. Consequently, all reported property operating statement results should be normalized. By normalizing the operating statement there is an increased level of consistency from the initial contribution by the underwriter and each subsequent year.
Provided below are some general operating statement normalization guidelines. These are not intended to be all-inclusive, as there may be other categories which need adjustment and for which the servicer is expected to use its discretion. However, if Servicers adhere consistently to the methodology outlined below, comparisons both within and across transactions should become more meaningful over time.
Reporting:
� In the Income Section of the NOIWS and OSAR (excluding the template for Lodging), both categories, Gross Potential Rent and vacancy/collection loss, should be used in combination together, or these two categories should be left blank. If blank, then only the Base Rent category should be used to illustrate the net rent received (net of vacancy and collection loss).
� The Master Coding Matrix will determine whether an item is eliminated or adjusted from the analysis when reporting data from the borrower's income statement. Eliminated items are not included in the borrower actual activity on the NOIWS. Comments related to items eliminated per the Master Coding Matrix are not required. Adjustments are made to the borrower actual activity and could relate to annualization and/or normalization. The Master Coding Matrix is property type specific as discussed below.
� The Master Coding Matrix details specific revenue and expense items that should be adjusted for normalization purposes when completing the NOIWS and the OSAR.
Page 66 CREFC IRP Version 5.1 Effective 12/1/2010

CREFC Investor Reporting Package
� The Master Coding Matrix also details specific revenue items that should be eliminated from the analysis when completing the NOIWS and the OSAR. No comments are required for items eliminated from the analysis per the Master Coding Matrix.
Additional Normalization Guidance:
� Non-recurring extraordinary income. A tax refund as a result of a tax appeal, a lease buyout, or insurance proceeds should always be adjusted out of income. Income received for a period other than the year in question should be adjusted. If a material amount of past due rent for a prior year was paid and recorded in the current year, the servicer should back this amount out of income and footnote the action, unless such payment is consistently made on a year-to-year basis.
� Care should be used when reflecting percentage/overage rents to ensure that they relate to the appropriate period and that the numbers are supported by a trend in prior years or by tenant sales information.
� Assume a property management fee of at least 3-5% of EGI, or Departmental Revenue for Lodging. Usually 5% is an accurate estimate however; on larger properties 3% or 4% may be sufficient. However, do not use a management fee less than what was used for the underwriting (if such information is available).
� Property Taxes should reflect the actual amount due or paid directly by the servicer for the related reporting period, excluding any delinquent taxes or credits from prior years (which would cause the number to be higher or lower).
� Insurance should reflect, if escrowed, the actual amount due or paid directly by the servicer for the related reporting period. If non-escrowed, use the greater of borrower actual or underwritten.
� Legal fees related to the operation of the property should be included in the analysis, but any legal fees or consulting fees not pertaining directly to the operation of the property should be excluded. - e.g., fees for closing the loan restructure.
� Corporate or entity level expenses should be eliminated.
� Debt Service - When reporting debt service, it is always preferable to have the actual amount due from the borrower for the period included in the operating statement. Additional guidance for fixed rate, interest only and floating rate loans includes:
o Fixed rate and interest only - If the servicer does not have a full year of payment history, the servicer should estimate a full year amount. Any estimates should be footnoted as to the methodology used. For fixed rate loans without partial interest only periods, the servicer can multiply the required debt service paid in one month by the number of months for the relevant period. For fixed rate loans with partial interest only periods, the servicer should report the actual debt service due for the relevant operating statement period. In the year of conversion from interest only to amortizing, the servicer should include a footnote detailing the current years DSCR assuming the amortizing payment was made for the whole year.
o Floating rate – The servicer should include the total amount due from the borrower for the related period. Any estimates should be footnoted as to the methodology used. If the borrower was required to purchase a Rate Cap Agreement1 to limit their interest rate exposure, this activity should be treated as follows:
1 The Servicer will need to track specific Rate Cap Agreement information in order to identify the loans that should reflect Rate Cap proceeds during the year. At a minimum, this information should include the LIBOR strike price which the servicer would compare to the actual LIBOR range for the applicable reporting period. If the strike price is met, then the servicer would know to look for Rate Cap proceeds.
Page 67 CREFC IRP Version 5.1 Effective 12/1/2010

CREFC Investor Reporting Package
� If the funds received pursuant to the Rate Cap Agreement are included on the Borrower’s financial statements, the funds should be included in Other Income and footnoted2.
� If the funds received pursuant to the Rate Cap Agreement are not included on the Borrower’s financial statements, the funds should be adjusted into Other Income and footnoted2.
� If the expenses associated with the Rate Cap Agreement are paid upfront in a lump sum, the expense should be eliminated from the analysis.
� If the expenses associated with the Rate Cap Agreement are paid annually and included on the Borrower’s financial statements, the associated expenses should be included in Other Expenses and footnoted.
� If the expenses associated with the Rate Cap Agreement are paid annually and not included on the Borrower’s financial statements, the associated expenses should be adjusted into Other Expenses and footnoted.
Capital Expenditures/ Tenant Improvements and Leasing Commissions
In general, Capital Expenditures and TI's/LC's should be normalized to the values used for Underwriting unless the servicing agreement dictates otherwise. If there are significant variances from Underwriting, the reasons for these variances should be footnoted.
� Actual major capital expenditures that were not anticipated should be reflected as Extraordinary Capital Expenditures on the NOIWS. Extraordinary Capital Expenditures should then be adjusted out of the normalized column and will therefore be reflected as zero on the OSAR. A comment explaining the nature of these expenditures should be included on both the NOIWS and OSAR.
� Normalize Capital expenditures and TI's/LC's in the following order of preference:
1) Normalize all capital expenditures, TI’s and LC’s to original underwriting, unless alternative directions are specified in the Servicing Agreement.
2) If detailed underwriting was not provided to the servicer, utilize the total underwritten capital expenditures that are normally disclosed in the Annex A.
3) If neither of the above mentioned sources is available, utilize actual contributions into the related reserve account(s).
Operating Statement Analysis Report (OSAR)
� Once the Servicer has completed the NOIWS (or has performed its own normalization for transactions which do not require a NOIWS) for a given quarter, the Servicer should use the “normalized” data to populate the OSAR, filling in the appropriate period end date in the “as of date” field. However the 1st quarter analysis will not be required unless a property is analyzed on a trailing 12 month basis, or if the loan is on the Watch List.
� The suggested footnotes (see below) from the most recent annual NOIWS should flow through to the OSAR. The OSAR will contain the original underwritten details (“At Contribution Information”
2 If the loan is secured by multiple properties, the Rate Cap costs should be allocated between properties in the same manner as the debt service.
Page 68 CREFC IRP Version 5.1 Effective 12/1/2010

CREFC Investor Reporting Package
column), if provided by the issuer, the three most recent sequential years of normalized operating information and the most recent interim period.
� Underwritten values are an important tool used to compare current operating cash flows to original expected performance. The mortgage issuer has the responsibility for providing the original underwriting information at securitization (“At Contribution Information”) to the servicer and sub-servicer for the mortgages they originate. This information must be incorporated into the OSAR by the servicer or sub-servicer. When two types of underwriting data are available, utilize cash flows based on in-place rents rather than stabilized cash flows.
Updating the Reports
Upon completion of both the NOIWS and the OSAR, the file should be made available electronically in an Excel format (or an acceptable alternative). Some of the information calculated in the OSAR such as NCF and DSCR is used to update the CFSR, Periodic, Property, and Financial File. The CFSR should also be made available electronically in an Excel format (or an acceptable alternative). Both reports are usually required by the servicing agreement to be forwarded to the Trustee prior to the distribution date each month. Often they are also available from the Master Servicer’s web site.
Footnote Disclosure
Investors are interested in both understanding the Servicer’s normalization process and the reasons behind any fluctuations in a property’s performance. The servicer explains the normalization and annualization adjustments in the footnotes and provides variance comments in the operating statement analysis related to property performance fluctuations in excess of the thresholds discussed below on the NOIWS and OSAR. No variance commentary will be required on quarterly statements unless the loan is on the Watch List.
� Variances of greater than 20% (either higher or lower) between the current full year and from the prior full year must be explained in the applicable comments section of the OSAR for the following line items:
- Effective Gross Income or Departmental Income - Total Operating Expenses or Total General/unallocated - Total Capital Items
� Variances of greater than 20% (either higher or lower) between the current full year and from the prior full year for any DSCR must be explained in the applicable comments section of the OSAR.
� Operating variance comments are only required for annual statement analysis that exceed the thresholds discussed above or on quarterly statement analysis if the loan is on the Watch List. (NOTE:1st quarter analysis is only required if the loan is on the Watch List or is analyzed on a trailing 12 month basis). This commentary should address the property level issues causing these variances and could be included in the DSCR comments section or in the relevant sections above (i.e. expense or capital).
� If there are variances from underwriting that exceed the thresholds noted above for the first 3 years of reporting or while the underwriting is still relevant for operating statement analysis, the reasons for those variances should be footnoted.
The NOIWS/OSAR comment sections should always be used to explain normalization and annualization adjustments and any required elimination comments made to arrive at the Normalized NOI and NCF. The comments should contain appropriate detail as defined below. (Comments from the latest NOIWS should be carried forward to the OSAR.) The NOIWS and OSAR include the same three comment sections including Income, Expense and Capital Items. The OSAR includes an additional DSCR comment section that is used to explain any variances, as discussed above, between underwriting and/or prior years DSCR. The servicer comments should include reference to any eliminations made to the borrower's actual operating statement that are not specifically listed in the Master Coding Matrix, as well as any normalization or annualization adjustments included in the adjustment column. These comments could be
Page 69 CREFC IRP Version 5.1 Effective 12/1/2010

CREFC Investor Reporting Package
included in the appropriate section (i.e. income or expense) or could be combined together in one of those sections. Comments related to items eliminated per the Master Coding Matrix are not required
The comments section of the NOIWS and OSAR is used to communicate information regarding the performance of the property to investors, clients, rating agencies, and other interested parties. These comments are used frequently to monitor changes in property performance. The operating statement variance comment should provide a verbal picture of current property performance. When developing comments for an OSAR, the comments may address the following:
a) Define the problem/issue and explain the situation b) Indicate the source of the information (i.e. Property manager, borrower, Primary
Servicer) c) Identify causes for increases/reductions in revenues that exceed the thresholds mentioned
above.d) Identify causes for increases/reductions in expenses that exceed the thresholds mentioned
above.e) Normalization comments are critical for all revenue and expense items f) Include Market data, if relevant and available. g) Provide Borrower comments that substantiate the Borrowers reported revenues and
expenses as necessary to address variances h) Provide the property manager's/borrower's plan to improve cash flow if the property is on
the Watchlist or not performing as well as expected based on the original underwriting, if still relevant.
Example: Issue: YE2004 DSCR: NOI 0.97 / NCF 0.75 Property Type: Multi-family
Notes and Assumptions or DSCR:Per property manager, the property has tightened leasing requirements after having a number of problematic tenants. The property manager believes this will save the property money on eviction and turnover expenses. The property has also engaged in an aggressive collections campaign to make sure tenants keep up with payments. Occupancy has rebounded slightly to 76% as of April 5, 2005. The property manager hopes to have occupancy in to the mid eighties by July 2005 by increasing occupancy 3% each month. To accomplish this goal the property has engaged in an aggressive marketing campaign and is advertising heavily with postcards. Reis reports a fourth quarter 2004 vacancy rate of 9.0% up from 8.9% in the third quarter and 8.4% a year earlier.
Income Comments: Total revenues for the YE2004 are down 11% from YE2003 due to an overall drop in occupancy of 22% over the same period. According to the Borrower, “base rent is down due to specials and concessions” in order to increase and stabilize occupancy.
Expense Comments:Repairs and maintenance expenditures increased 34% over 2003 due to an increase in general repairs including some concrete repairs, exterior painting, refurbishing at turnover, upgraded some entrance lobbies and general repair to exteriors. Management fees were normalized per CREFC guidelines.
Capital Items Comments:Capital items were normalized as per CREFC guidelines. No capital improvements were made in 2004.
Page 70 CREFC IRP Version 5.1 Effective 12/1/2010

CREFC Investor Reporting Package
Example:Issue: YTD DSCR at 6/30/05: NOI 0.94/NCF 0.89 Property Type: Multi-family
Pari Passu Notes
Sharing of Data on Pari Passu Notes and Subordinate Debt Structures
The sharing of information between Servicers is crucial to the dissemination of accurate data to the bond holders and rating agencies. The following guidelines should be utilized when servicing a loan that contains a Pari Passu component to ensure that all the Servicers are reporting the same information to the appropriate Trustee:
1) The lead Servicer (A1 note servicer) requests quarterly debt service information from the downstream Servicer(s) of the (A2 - A6, etc.) notes
2) The downstream Servicer(s) then provide the quarterly debt service amounts to the lead Servicer who performs the OSAR calculation
3) The lead Servicer then distributes the OSAR to the downstream Servicer(s) so each Servicer can post the OSAR with the same data
A list of contacts has been established that contains the contact information for the responsible party at each servicer. This will enable the lead servicer to communicate with the downstream Servicer(s) as needed. Any downstream servicer who has questions should communicate with the lead servicer. The contact list will be posted on the CREFC website at www.crefc.org and can be utilized for Pari Passu notes or subordinate debt structures.
Notes and Assumptions or DSCR:Per the Borrower, the decline in occupancy at YE2004 and the resulting decrease in base rents is a result of more home purchases in the subject’s market. The Borrower expressed optimism that with increasing interest rates and an improving economy that occupancy will return to prior year levels in excess of 90%
Income Comments: Total revenues for the 2nd Quarter 2005 are down due to a decrease in base rents charged from 2004. Occupancy has increased from 85% at YE2004 to 94% at 6/30/05.
Expense Comments:Management fees normalized to 4 %. Taxes have been normalized to the amount paid by the servicer for the related period. Repair and maintenance expenses are down slightly.
Capital Items Comments:Capital items were normalized as per CREFC guidelines. No capital improvements were made in 2005.
Page 71 CREFC IRP Version 5.1 Effective 12/1/2010

COMMERCIAL OPERATING STATEMENT ANALYSIS REPORT (includes Retail/Office/Industrial/Warehouse/Mixed Use/Self Storage)as of MM/DD/YY
PROPERTY OVERVIEW
Property ID 1001-001 Paid Thru DateDebt Outside Trust
(1) $ %
Note A-Scheduled Loan Balance -$ MM/DD/YY X or Blank -$ 0.00% Note B-Scheduled Loan Balance -$ MM/DD/YY X or Blank -$ 0.00% Note C-Scheduled Loan Balance -$ MM/DD/YY X or Blank -$ 0.00% Property Name Property Type Property Address, City, State Current Net Rentable SF/Units/Beds/Rooms Use second box to specify sqft.,units… Year Built/Year Renovated YYYY YYYY Cap Ex Reserve (annually)/per Unit.etc. (2) -$ -$ specify annual/per unit… Statement Ending Date Underwriting MM/DD/YY MM/DD/YY MM/DD/YY MM/DD/YY Occupancy Rate (physical) 0.00% 0.00% 0.00% 0.00% 0.00% Occupancy Date MM/DD/YY MM/DD/YY MM/DD/YY MM/DD/YY MM/DD/YY
(1) "X" if debt is outside of the trust, otherwise leave blank(2) Total $ amount of Capital Reserves required annually by loan documents
INCOME: Number of Mos. Covered (prcdng yr to base) (prcdng yr to 2nd prcdng) Period Ended At Contribution 3rd Preceding 2nd Preceding Preceding Yr. TTM/YTD YYYY-U/W YYYY-YYYY Statement Ending Date Information (fm NOI Adj Sheet) as of / /XX Variance Variance Gross Potential Rent (3) Less: Vacancy Loss
OR Base Rent (3) Expense Reimbursement Percentage Rent Parking Income Other Income
*Effective Gross Income(3) Use either Gross Potential (with Vacancy Loss) or Base Rents; use negative $amt for Vacancy Loss
OPERATING EXPENSES: Real Estate Taxes Property Insurance Utilities Repairs and Maintenance Janitorial Management Fees Payroll & Benefits Advertising & Marketing Professional Fees General and Administrative Other Expenses Ground Rent *Total Operating Expenses
Operating Expense Ratio
*Net Operating Income
Leasing Commissions Tenant Improvements Capital Expenditures Extraordinary Capital Expenditures Total Capital Items
*Net Cash Flow
Debt Service - A Note Debt Service - B Note Debt Service - C Note
*Net Cash Flow after Debt Service
*DSCR: (NOI/Debt Service) - A Note *DSCR: (NOI/Debt Service) - A & B Note *DSCR: (NOI/Debt Service) - A, B & C Note
*DSCR: (NCF/Debt Service) - A Note *DSCR: (NCF/Debt Service) - A & B Note *DSCR: (NCF/Debt Service) - A, B & C Note
Source of Financial Data:(ie. operating statements, financial statements, tax return, other)
Notes and Assumptions: Years above will roll, always showing a 3yr sequential history. Comments from the most recent NOI Adjustment Worksheet should be carried forward to Operating Statement Analysis Report. Year-over-year variances (either higher or lower) must be explained and noted for the following: >20% DSCR change, >20% EGI/Total Operating Expenses or Total CapitalItems. Quarterly variance comments may be necessary if the loan is on the Watch List.Income: Comments
Expense: Comments
Capital Items: Comments
DSCR: Comments
* Used in the CREFC Comparative Financial Status Report/CREFC Property File/CREFC Loan Periodic Update File. Note that information for multiple property loans must be consolidated (if available) for reporting to the CREFC Loan Periodic Update file.
CREFC Investor Reporting Package
Allocated Loan Amount/Percentage
Page 72 CREFC IRP Version 5.1 Effective 12/1/2010
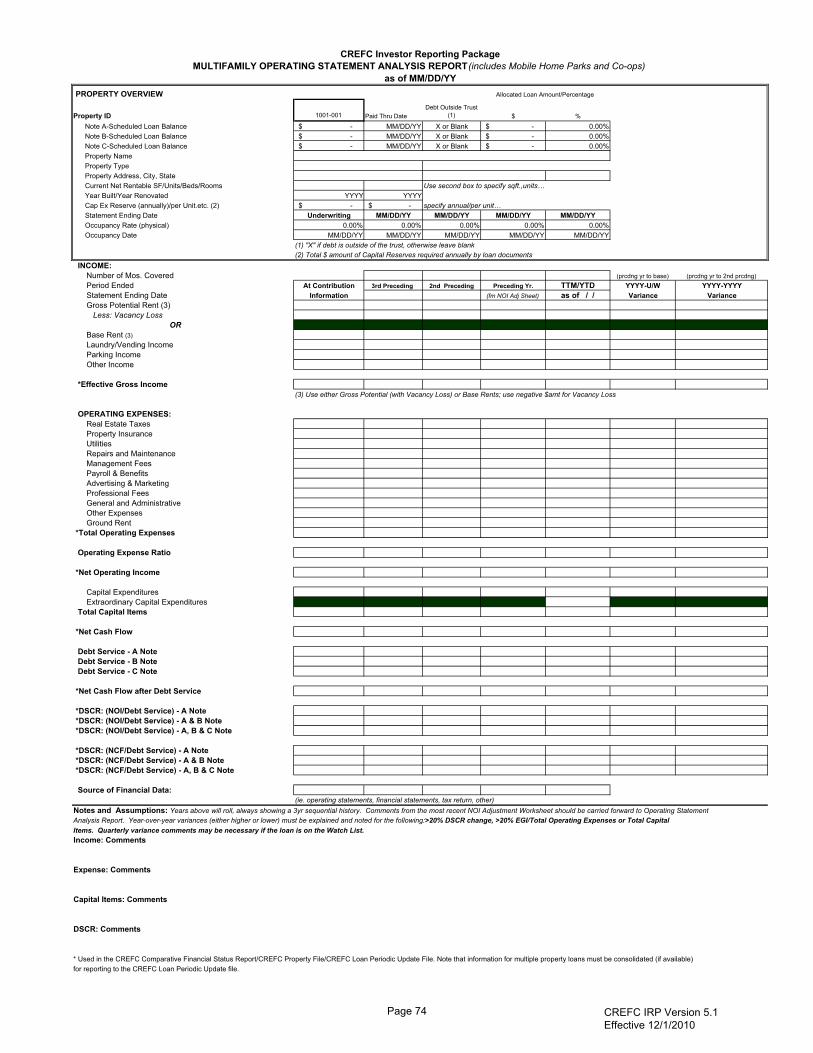
COMMERCIAL NOI ADJUSTMENT WORKSHEET (includes Retail/Office/Industrial/Warehouse/Mixed Use/Self Storage)as of MM/DD/YY
PROPERTY OVERVIEW
Property ID 1001-001 Paid Thru DateDebt Outside Trust
(1) $ %
Note A-Scheduled Loan Balance -$ MM/DD/YY X or Blank -$ 0.00% Note B-Scheduled Loan Balance -$ MM/DD/YY X or Blank -$ 0.00% Note C-Scheduled Loan Balance -$ MM/DD/YY X or Blank -$ 0.00% Property Name Property Type Property Address, City, State Current Net Rentable SF/Units/Pads,Beds Use second box to specify sqft.,units… Year Built/Year Renovated YYYY YYYY Cap Ex Reserve (annually)/per Unit.etc. (2) -$ -$ specify annual/per unit… Statement Ending Date MM/DD/YY Occupancy Rate (physical) 0.00% Occupancy Date MM/DD/YY
(1) "X" if debt is outside of the trust, otherwise leave blank(2) Total $ amount of Capital Reserves required annually by loan documents
Statement Ending Date YYYY NotesBorrower Adjustment Normalized
INCOME: Actual Gross Potential Rent (3) Less: Vacancy Loss
OR Base Rent (3) Expense Reimbursement Percentage Rent Parking Income Other Income
Effective Gross Income (3) Use either Gross Potential (with Vacancy Loss) or Base Rents; use negative $amt for Vacancy Loss
OPERATING EXPENSES: Real Estate Taxes Property Insurance Utilities Repairs and Maintenance Janitorial Management Fees Payroll & Benefits Expense Advertising & Marketing Professional Fees General and Administrative Other Expenses For self-storage include franchise fees Ground Rent Total Operating Expenses
Operating Expense Ratio
Net Operating Income
Leasing Commissions Tenant Improvements Capital Expenditures Extraordinary Capital Expenditures Total Capital Items
Net Cash Flow
Debt Service - A Note Debt Service - B Note Debt Service - C Note
Net Cash Flow after debt service
DSCR: (NOI/Debt Service) - A Note DSCR: (NOI/Debt Service) - A & B Note DSCR: (NOI/Debt Service) - A, B & C Note
DSCR: (NCF/Debt Service) - A Note DSCR: (NCF/Debt Service) - A & B Note DSCR: (NCF/Debt Service) - A, B & C Note
Source of Financial Data:(i.e.. operating statements, financial statements, tax return, other)
Notes and Assumptions: This report should be completed for "Normalization" of Borrower's numbers. Methodology used is per MBA/CREFC Standard Methodology unless otherwise noted. The "Normalized" column and corresponding comments should roll through to the Operating Statement Analysis Report.Income: Comments
Expense: Comments
Capital Items: Comments
CREFC Investor Reporting Package
Allocated Loan Amount/Percentage
Page 73 CREFC IRP Version 5.1 Effective 12/1/2010

MULTIFAMILY OPERATING STATEMENT ANALYSIS REPORT(includes Mobile Home Parks and Co-ops)as of MM/DD/YY
PROPERTY OVERVIEW
Property ID 1001-001 Paid Thru DateDebt Outside Trust
(1) $ %
Note A-Scheduled Loan Balance -$ MM/DD/YY X or Blank -$ 0.00% Note B-Scheduled Loan Balance -$ MM/DD/YY X or Blank -$ 0.00% Note C-Scheduled Loan Balance -$ MM/DD/YY X or Blank -$ 0.00% Property Name Property Type Property Address, City, State Current Net Rentable SF/Units/Beds/Rooms Use second box to specify sqft.,units… Year Built/Year Renovated YYYY YYYY Cap Ex Reserve (annually)/per Unit.etc. (2) -$ -$ specify annual/per unit… Statement Ending Date Underwriting MM/DD/YY MM/DD/YY MM/DD/YY MM/DD/YY Occupancy Rate (physical) 0.00% 0.00% 0.00% 0.00% 0.00% Occupancy Date MM/DD/YY MM/DD/YY MM/DD/YY MM/DD/YY MM/DD/YY
(1) "X" if debt is outside of the trust, otherwise leave blank(2) Total $ amount of Capital Reserves required annually by loan documents
INCOME: Number of Mos. Covered (prcdng yr to base) (prcdng yr to 2nd prcdng) Period Ended At Contribution 3rd Preceding 2nd Preceding Preceding Yr. TTM/YTD YYYY-U/W YYYY-YYYY Statement Ending Date Information (fm NOI Adj Sheet) as of / / Variance Variance Gross Potential Rent (3) Less: Vacancy Loss
OR Base Rent (3) Laundry/Vending Income Parking Income Other Income
*Effective Gross Income(3) Use either Gross Potential (with Vacancy Loss) or Base Rents; use negative $amt for Vacancy Loss
OPERATING EXPENSES: Real Estate Taxes Property Insurance Utilities Repairs and Maintenance Management Fees Payroll & Benefits Advertising & Marketing Professional Fees General and Administrative Other Expenses Ground Rent *Total Operating Expenses
Operating Expense Ratio
*Net Operating Income
Capital Expenditures Extraordinary Capital Expenditures Total Capital Items
*Net Cash Flow
Debt Service - A Note Debt Service - B Note Debt Service - C Note
*Net Cash Flow after Debt Service
*DSCR: (NOI/Debt Service) - A Note *DSCR: (NOI/Debt Service) - A & B Note *DSCR: (NOI/Debt Service) - A, B & C Note
*DSCR: (NCF/Debt Service) - A Note *DSCR: (NCF/Debt Service) - A & B Note *DSCR: (NCF/Debt Service) - A, B & C Note
Source of Financial Data:(ie. operating statements, financial statements, tax return, other)
Notes and Assumptions: Years above will roll, always showing a 3yr sequential history. Comments from the most recent NOI Adjustment Worksheet should be carried forward to Operating StatementAnalysis Report. Year-over-year variances (either higher or lower) must be explained and noted for the following: >20% DSCR change, >20% EGI/Total Operating Expenses or Total CapitalItems. Quarterly variance comments may be necessary if the loan is on the Watch List.Income: Comments
Expense: Comments
Capital Items: Comments
DSCR: Comments
* Used in the CREFC Comparative Financial Status Report/CREFC Property File/CREFC Loan Periodic Update File. Note that information for multiple property loans must be consolidated (if available) for reporting to the CREFC Loan Periodic Update file.
CREFC Investor Reporting Package
Allocated Loan Amount/Percentage
Page 74 CREFC IRP Version 5.1 Effective 12/1/2010

MULTIFAMILY NOI ADJUSTMENT WORKSHEET (includes Mobile Home Parks and Co-ops)as of MM/DD/YY
PROPERTY OVERVIEW
Property ID 1001-001 Paid Thru DateDebt Outside Trust
(1) $ %
Note A-Scheduled Loan Balance -$ MM/DD/YY X or Blank -$ 0.00% Note B-Scheduled Loan Balance -$ MM/DD/YY X or Blank -$ 0.00% Note C-Scheduled Loan Balance -$ MM/DD/YY X or Blank -$ 0.00% Property Name Property Type Property Address, City, State Current Net Rentable SF/Units/Pads,Beds Use second box to specify sqft.,units… Year Built/Year Renovated YYYY YYYY Cap Ex Reserve (annually)/per Unit.etc. (2) -$ -$ specify annual/per unit… Statement Ending Date MM/DD/YY Occupancy Rate (physical) 0.00% Occupancy Date MM/DD/YY
(1) "X" if debt is outside of the trust, otherwise leave blank(2) Total $ amount of Capital Reserves required annually by loan documents
Statement Ending Date YYYY NotesBorrower Adjustment Normalized
INCOME: Actual Gross Potential Rent (3) Include Pad/RV rent Less: Vacancy Loss
OR Base Rent (3) Laundry/Vending Income Parking Income Other Income Include forfeited security/late fees/pet
Effective Gross Income(3) Use either Gross Potential (with Vacancy Loss) or Base Rents; use negative $ amt for Vacancy Loss
OPERATING EXPENSES: Real Estate Taxes Property Insurance Utilities Repairs and Maintenance Management Fees Payroll & Benefits Expense Advertising & Marketing Professional Fees General and Administrative Other Expenses Ground Rent Total Operating Expenses
Operating Expense Ratio
Net Operating Income
Capital Expenditures Extraordinary Capital Expenditures Total Capital Items
Net Cash Flow
Debt Service - A Note Debt Service - B Note Debt Service - C Note
Net Cash Flow after Debt Service
DSCR: (NOI/Debt Service) - A Note DSCR: (NOI/Debt Service) - A & B Note DSCR: (NOI/Debt Service) - A, B & C Note
DSCR: (NCF/Debt Service) - A Note DSCR: (NCF/Debt Service) - A & B Note DSCR: (NCF/Debt Service) - A, B & C Note
Source of Financial Data:(i.e.. operating statements, financial statements, tax return, other)
Notes and Assumptions: This report should be completed for "Normalization" of Borrower's numbers. Methodology used is per MBA/CREFC Standard Methodology unless otherwise noted. The "Normalized" column and corresponding comments should roll through to the Operating Statement Analysis ReportIncome: Comments
Expense: Comments
Capital Items: Comments
CREFC Investor Reporting Package
Allocated Loan Amount/Percentage
Page 75 CREFC IRP Version 5.1 Effective 12/1/2010

LODGING OPERATING STATEMENT ANALYSIS REPORTas of MM/DD/YY
PROPERTY OVERVIEW
Property ID 1001-001 Paid Thru DateDebt Outside Trust
(1) $ % Note A-Scheduled Loan Balance -$ MM/DD/YY X or Blank -$ 0.00% Note B-Scheduled Loan Balance -$ MM/DD/YY X or Blank -$ 0.00% Note C-Scheduled Loan Balance -$ MM/DD/YY X or Blank -$ 0.00% Property Name Property Type Property Address, City, State Current Net Rentable SF/Units/Beds/Rooms Use second box to specify sqft.,units… Year Built/Year Renovated YYYY YYYY Cap Ex Reserve (annually)/per Unit.etc. (2) -$ -$ specify annual/per unit… Statement Ending Date Underwriting MM/DD/YY MM/DD/YY MM/DD/YY MM/DD/YY Occupancy Rate (physical) 0.00% 0.00% 0.00% 0.00% 0.00% Occupancy Date MM/DD/YY MM/DD/YY MM/DD/YY MM/DD/YY MM/DD/YY Average Daily Rate $0.00 $0.00 $0.00 $0.00 $0.00 Rev per Av. Room $0.00 $0.00 $0.00 $0.00 $0.00
(1) "X" if debt is outside of the trust, otherwise leave blank(2) Total $ amount of Capital Reserves required annually by loan documents
INCOME: Number of Mos. Covered (prcdng yr to base) (prcdng yr to 2nd prcdng) Period Ended At Contribution 3rd Preceding 2nd Preceding Preceding Yr. TTM/YTD YYYY-U/W YYYY-YYYY Statement Ending Date Information (fm NOI Adj Sheet) as of / / Variance Variance Room Revenue Food & Beverage Revenues Telephone Revenue Other Departmental Revenue Other Income
*DEPARTMENTAL REVENUE/EGI
OPERATING EXPENSES:Departmental Room Food & Beverage Telephone Expenses Other Dept. ExpensesDEPARTMENTAL EXPENSES:
DEPARTMENTAL INCOME:
General/Unallocated Real Estate Taxes Property Insurance Utilities Repairs and Maintenance Franchise Fee Management Fees Payroll & Benefits Advertising & Marketing Professional Fees General and Administrative Other Expenses Ground RentTOTAL GENERAL/Unallocated(For CREFC files, Total Operating Exp. = Dept. Exp + Total General/Unallocated) Operating Expense Ratio=[Total Operating Exp.] / [Departmental Revenue/EGI] *Net Operating Income
Capital Expenditures Extraordinary Capital Expenditures Total Capital Items
*Net Cash Flow
Debt Service - A Note Debt Service - B Note Debt Service - C Note
*Net Cash Flow after Debt Service
*DSCR: (NOI/Debt Service) - A Note *DSCR: (NOI/Debt Service) - A & B Note *DSCR: (NOI/Debt Service) - A, B & C Note
*DSCR: (NCF/Debt Service) - A Note *DSCR: (NCF/Debt Service) - A & B Note *DSCR: (NCF/Debt Service) - A, B & C Note
Source of Financial Data:(ie. operating statements, financial statements, tax return, other)
Notes and Assumptions: Years above will roll, always showing a 3yr sequential history. Comments from the most recent NOI Adjustment Worksheet should be carried forward to Operating StatementAnalysis Report. Year-over-year variances (either higher or lower) must be explained and noted for the following: >20% DSCR change, >20% EGI/Total Operating Expenses or Total CapitalItems. Quarterly variance comments may be necessary if the loan is on the Watch List.Income: Comments
Expense: Comments
Capital Items: Comments
DSCR: Comments
* Used in the CREFC Comparative Financial Status Report/CREFC Property File/CREFC Loan Periodic Update File. Note that information for multiple property loans must be consolidated (if available) for reporting to the CREFC Loan Periodic Update file.
CREFC Investor Reporting Package
Allocated Loan Amount/Percentage
Page 76 CREFC IRP Version 5.1 Effective 12/1/2010

LODGING NOI ADJUSTMENT WORKSHEET as of MM/DD/YY
PROPERTY OVERVIEW
Property ID 1001-001 Paid Thru DateDebt Outside Trust
(1) $ %
Note A-Scheduled Loan Balance -$ MM/DD/YY X or Blank -$ 0.00% Note B-Scheduled Loan Balance -$ MM/DD/YY X or Blank -$ 0.00% Note C-Scheduled Loan Balance -$ MM/DD/YY X or Blank -$ 0.00% Property Name Property Type Property Address, City, State Current Net Rentable SF/Units/Pads,Beds Use second box to specify sqft.,units… Year Built/Year Renovated YYYY YYYY Cap Ex Reserve (annually)/per Unit.etc. (2) -$ -$ specify annual/per unit… Statement Ending Date MM/DD/YY Occupancy Rate (physical) 0.00% Occupancy Date MM/DD/YY Average Daily Rate $0.00 Rev per Av. Room $0.00
(1) "X" if debt is outside of the trust, otherwise leave blank(2) Total $ amount of Capital Reserves required annually by loan documents.
Statement Ending Date YYYY NotesBorrower Adjustment Normalized
INCOME: Actual Room Revenue Food & Beverage Revenues Telephone Revenue Other Departmental Revenue Other Income
DEPARTMENTAL REVENUE/EGI:
OPERATING EXPENSES:Departmental Room Food & Beverage Telephone Expenses Other Dept. ExpensesDEPARTMENTAL EXPENSES:
DEPARTMENTAL INCOME:
General/Unallocated Real Estate Taxes Property Insurance Utilities Repairs and Maintenance Franchise Fee Management Fees Payroll & Benefits Advertising & Marketing Professional Fees General and Administrative Other Expenses Ground RentTOTAL GENERAL/Unallocated(For CREFC files, Total Operating Exp. = Dept. Exp + Total General/Unallocated) Operating Expense Ratio=[Total Operating Exp.] / [Departmental Revenue/EGI] Net Operating Income
Capital Expenditures Extraordinary Capital Expenditures Total Capital Items
Net Cash Flow
Debt Service - A Note Debt Service - B Note Debt Service - C Note
Net Cash Flow after debt service
DSCR: (NOI/Debt Service) - A Note DSCR: (NOI/Debt Service) - A & B Note DSCR: (NOI/Debt Service) - A, B & C Note
DSCR: (NCF/Debt Service) - A Note DSCR: (NCF/Debt Service) - A & B Note DSCR: (NCF/Debt Service) - A, B & C Note
Source of Financial Data:(i.e.. operating statements, financial statements, tax return, other)
Notes and Assumptions: This report should be completed for "Normalization" of Borrower's numbers. Methodology used is per MBA/CREFC Standard Methodology unless otherwise noted. The "Normalized" column and corresponding comments should roll through to the Operating Statement Analysis Report.Income: Comments
Expense: Comments
Capital Items: Comments
CREFC Investor Reporting Package
Allocated Loan Amount/Percentage
Page 77 CREFC IRP Version 5.1 Effective 12/1/2010

HEALTHCARE OPERATING STATEMENT ANALYSIS REPORTas of MM/DD/YY
PROPERTY OVERVIEW
Property ID 1001-001 Paid Thru DateDebt Outside Trust
(1) $ %
Note A-Scheduled Loan Balance -$ MM/DD/YY X or Blank -$ 0.00% Note B-Scheduled Loan Balance -$ MM/DD/YY X or Blank -$ 0.00% Note C-Scheduled Loan Balance -$ MM/DD/YY X or Blank -$ 0.00% Property Name Property Type Property Address, City, State Current Net Rentable SF/Units/Beds/Rooms Use second box to specify sqft.,units… Year Built/Year Renovated YYYY YYYY Cap Ex Reserve (annually)/per Unit.etc. (2) -$ -$ specify annual/per unit… Statement Ending Date Underwriting MM/DD/YY MM/DD/YY MM/DD/YY MM/DD/YY Occupancy Rate (physical) 0.00% 0.00% 0.00% 0.00% 0.00% Occupancy Date MM/DD/YY MM/DD/YY MM/DD/YY MM/DD/YY MM/DD/YY
(1) "X" if debt is outside of the trust, otherwise leave blank(2) Total $ amount of Capital Reserves required annually by loan documents
INCOME: Number of Mos. Covered (prcdng yr to base) (prcdng yr to 2nd prcdng) Period Ended At Contribution 3rd Preceding 2nd Preceding Preceding Yr. TTM/YTD YYYY-U/W YYYY-YYYY Statement Ending Date Information (fm NOI Adj Sheet) as of / / Variance Variance Gross Potential Rent (3) Less: Vacancy Loss
OR Private Pay (3) Medicare/Medicaid Nursing/Medical Income Meals Income Other Income
*Effective Gross Income(3) Use either Gross Potential (with Vacancy Loss) or Private Pay/Medicare/Medicaid; use negative $amt for Vacancy Loss
OPERATING EXPENSES: Real Estate Taxes Property Insurance Utilities Repairs and Maintenance Management Fees Payroll & Benefits Advertising & Marketing Professional Fees General and Administrative Room expense - housekeeping Meal expense Other Expenses Ground Rent *Total Operating Expenses
Operating Expense Ratio
*Net Operating Income
Capital Expenditures Extraordinary Capital Expenditures Total Capital Items
*Net Cash Flow
Debt Service - A Note Debt Service - B Note Debt Service - C Note
*Net Cash Flow after Debt Service
*DSCR: (NOI/Debt Service) - A Note *DSCR: (NOI/Debt Service) - A & B Note *DSCR: (NOI/Debt Service) - A, B & C Note
*DSCR: (NCF/Debt Service) - A Note *DSCR: (NCF/Debt Service) - A & B Note *DSCR: (NCF/Debt Service) - A, B & C Note
Source of Financial Data:(ie. operating statements, financial statements, tax return, other)
Notes and Assumptions: Years above will roll, always showing a 3yr sequential history. Comments from the most recent NOI Adjustment Worksheet should be carried forward to Operating StatementAnalysis Report. Year-over-year variances (either higher or lower) must be explained and noted for the following: >20% DSCR change, >20% EGI/Total Operating Expenses or Total CapitalItems. Quarterly variance comments may be necessary if the loan is on the Watch List.Income: Comments
Expense: Comments
Capital Items: Comments
DSCR: Comments
* Used in the CREFC Comparative Financial Status Report/CREFC Property File/CREFC Loan Periodic Update File. Note that information for multiple property loans must be consolidated (if available) for reporting to the CREFC Loan Periodic Update file.
CREFC Investor Reporting Package
Allocated Loan Amount/Percentage
Page 78 CREFC IRP Version 5.1 Effective 12/1/2010

HEALTHCARE NOI ADJUSTMENT WORKSHEET as of MM/DD/YY
PROPERTY OVERVIEW
Property ID 1001-001 Paid Thru DateDebt Outside Trust
(1) $ %
Note A-Scheduled Loan Balance -$ MM/DD/YY X or Blank -$ 0.00% Note B-Scheduled Loan Balance -$ MM/DD/YY X or Blank -$ 0.00% Note C-Scheduled Loan Balance -$ MM/DD/YY X or Blank -$ 0.00% Property Name Property Type Property Address, City, State Current Net Rentable SF/Units/Pads,Beds Use second box to specify sqft.,units… Year Built/Year Renovated YYYY YYYY Cap Ex Reserve (annually)/per Unit.etc. (2) -$ -$ specify annual/per unit… Statement Ending Date MM/DD/YY Occupancy Rate (physical) 0.00% Occupancy Date MM/DD/YY
(1) "X" if debt is outside of the trust, otherwise leave blank(2) Total $ amount of Capital Reserves required annually by loan documents
Statement Ending Date YYYY NotesBorrower Adjustment Normalized
INCOME: Actual Gross Potential Rent (3) Less: Vacancy Loss
OR Private Pay (3) Medicare/Medicaid Nursing/Medical Income Meals Income Other Income
Effective Gross Income(3) Use either Gross Potential (with Vacancy Loss) or Private Pay/Medicare/Medicaid; use negative $amt for Vacancy Loss
OPERATING EXPENSES: Real Estate Taxes Property Insurance Utilities Repairs and Maintenance Management Fees Payroll & Benefits Advertising & Marketing Professional Fees General and Administrative Room expense - housekeeping Meal expense Other Expenses Ground Rent Total Operating Expenses
Operating Expense Ratio
Net Operating Income
Capital Expenditures Extraordinary Capital Expenditures Total Capital Items
Net Cash Flow
Debt Service - A Note Debt Service - B Note Debt Service - C Note
Net Cash Flow after debt service
DSCR: (NOI/Debt Service) - A Note DSCR: (NOI/Debt Service) - A & B Note DSCR: (NOI/Debt Service) - A, B & C Note
DSCR: (NCF/Debt Service) - A Note DSCR: (NCF/Debt Service) - A & B Note DSCR: (NCF/Debt Service) - A, B & C Note
Source of Financial Data:(i.e.. operating statements, financial statements, tax return, other)
Notes and Assumptions: This report should be completed for "Normalization" of Borrower's numbers. Methodology used is per MBA/CREFC Standard Methodology unless otherwise noted. The "Normalized" column and corresponding comments should roll through to the Operating Statement Analysis Report.Income: Comments
Expense: Comments
Capital Items: Comments
CREFC Investor Reporting Package
Allocated Loan Amount/Percentage
Page 79 CREFC IRP Version 5.1 Effective 12/1/2010

CREFC Investor Reporting PackageMaster Coding Matrix
Multi Family Multi Family Commercial Commercial Commercial Commercial Commercial Lodging Health Care Multi Family Mobile Home Office Retail Industrial Mixed Use Self Storage Lodging Health Care
Co-op Warehouse
Revenue LegendGPR Gross Potential Rent x x x x x x x xVAC Vacancy Loss x x x x x x x xBR Base Rent x x x x x x xER Expense Reimbursements x x x xPR Percentage Rent x xLV Laundry / Vending Income x xPI Parking Income x x x xOI Other Income x x x x x x x x xRMRV Room Revenue xFBV Food & Bev Revenues xTLRV Telephone Revenue x xODR Other Departmental Revenue xPRI Private Pay xMED Medicare/Medicaid Revenues xNUR Nursing/Medical Income xMLS Meals Income x
Revenue Line ItemsApplication Fees OI OI OI OI OI OI OI ********* *********Bad Debt OI/ADJUST OI/ADJUST OI/ADJUST OI/ADJUST OI/ADJUST OI/ADJUST OI/ADJUST OI/ADJUST OI/ADJUSTBase Rent BR BR BR BR BR BR BR ********* *********Beverage Revenue ********* ********* ********* ********* ********* ********* ********* FBV *********Box & Lock Sales ********* ********* ********* ********* ********* ********* OI ********* *********Cable OI OI ********* ********* ********* ********* ********* ********* *********CAM ********* ********* ER ER ********* ER ********* ********* *********Club House Rental OI OI ********* ********* ********* ********* ********* ********* *********Concessions VAC VAC VAC VAC VAC VAC VAC ********* VACEmployee Rent BR BR ********* ********* ********* ********* ********* ********* *********Escalation Income ********* BR BR BR BR BR BR ********* *********Operating Escalation Income ********* ********* ER ER ER ER ********* ********* *********FASB 13 Straight Line Lease Income ELIMINATE ELIMINATE ELIMINATE ELIMINATE ELIMINATE ELIMINATE ELIMINATE ELIMINATE ELIMINATEFood & Beverage Revenues ********* ********* ********* ********* ********* ********* ********* FBV MLSForfeited Security Deposits OI OI OI OI OI OI OI OI OIGain on Sale ELIMINATE ELIMINATE ELIMINATE ELIMINATE ELIMINATE ELIMINATE ELIMINATE ELIMINATE ELIMINATEGarage PI PI PI PI ********* PI ********* OI OIGross Potential Rent GPR GPR GPR GPR GPR GPR GPR ********* GPRGross Rent BR BR BR BR BR BR BR ********* *********Insurance Proceeds OI/ADJUST OI/ADJUST OI/ADJUST OI/ADJUST OI/ADJUST OI/ADJUST OI/ADJUST OI/ADJUST OI/ADJUSTInterest Income ELIMINATE ELIMINATE ELIMINATE ELIMINATE ELIMINATE ELIMINATE ELIMINATE ELIMINATE ELIMINATELaundry LV LV ********* OI ********* OI ********* ********* *********Laundry / Vending LV LV ********* OI ********* OI ********* ********* *********Meals Income ********* ********* ********* ********* ********* ********* ********* ********* MLSMedicare/Medicaid Revenues ********* ********* ********* ********* ********* ********* ********* ********* MEDMiscellaneous Income OI OI OI OI OI OI OI OI OIMobile Home Sales ********* ELIMINATE ********* ********* ********* ********* ********* ********* *********NSF Fees OI OI OI OI OI OI OI OI OINursing/Medical ********* ********* ********* ********* ********* ********* ********* ********* NUROther Departmental Revenues ********* ********* ********* ********* ********* ********* ********* ODR *********Other Income OI OI OI OI OI OI OI OI OIPad Rental ********* BR ********* ********* ********* ********* ********* ********* *********Parking Income PI PI PI PI OI PI OI OI OIPast Tenants Rent BR/ADJUST BR/ADJUST BR/ADJUST BR/ADJUST BR/ADJUST BR/ADJUST BR/ADJUST BR/ADJUST BR/ADJUSTPercentage Rent ********* ********* ********* PR ********* PR ********* ********* *********Prepaid Rent BR/ADJUST BR/ADJUST BR/ADJUST BR/ADJUST BR/ADJUST BR/ADJUST BR/ADJUST BR/ADJUST BR/ADJUSTPrivate Pay ********* ********* ********* ********* ********* ********* ********* ********* PRIReimbursments OI OI ER ER ER ER ********* ********* *********Rent BR BR BR BR BR BR BR ********* *********Rent Abatements VAC VAC VAC VAC VAC VAC VAC ********* VACRent Loss BR/ADJUST BR/ADJUST BR/ADJUST BR/ADJUST BR/ADJUST BR/ADJUST BR/ADJUST BR/ADJUST BR/ADJUSTRent on Park Owned Homes ********* BR ********* ********* ********* ********* ********* ********* *********Room Revenue ********* ********* ********* ********* ********* ********* ********* RMRV *********Sales OI OI OI OI ********* ********* ********* ********* *********Sales Taxes Collected ELIMINATE ELIMINATE ELIMINATE ELIMINATE ELIMINATE ELIMINATE ELIMINATE ELIMINATE ELIMINATESecurity Deposits Collected ELIMINATE ELIMINATE ELIMINATE ELIMINATE ELIMINATE ELIMINATE ELIMINATE ********* *********Security Deposit Interest ELIMINATE ELIMINATE ELIMINATE ELIMINATE ELIMINATE ELIMINATE ELIMINATE ELIMINATE ELIMINATESecurity Deposits Returned ELIMINATE ELIMINATE ELIMINATE ELIMINATE ELIMINATE ELIMINATE ELIMINATE ********* *********Storage OI OI OI OI OI OI OI ********* *********Straight line lease income ELIMINATE ELIMINATE ELIMINATE ELIMINATE ELIMINATE ELIMINATE ELIMINATE ELIMINATE ELIMINATETax Reimbursement ********* ********* ER ER ER ER ********* ********* *********Telephone Commissions ********* ********* ********* ********* ********* ********* ********* TLRV *********Telephone Revenue ********* ********* ********* ********* ********* ********* ********* TLRV *********Temporary Tenants OI OI OI OI OI OI OI ********* *********Utilities ********* ********* ER ER ER ER ********* ********* *********Vacancy Loss VAC VAC VAC VAC VAC VAC VAC ********* VACVending LV LV OI OI OI OI OI OI OI
Page 80 CREFC IRP Version 5.1 Effective 12/1/2010

CREFC Investor Reporting PackageMaster Coding Matrix
Multi Family Multi Family Commercial Commercial Commercial Commercial Commercial Lodging Health Care Multi Family Mobile Home Office Retail Industrial Mixed Use Self Storage Lodging Health Care
Co-op WarehouseExpense Legend
RET Real Estate Taxes x x x x x x x x xPINS Property Insurance x x x x x x x x xUTL Utilities x x x x x x x x xR&M Repairs and Maintenance x x x x x x x x xFFEE Franchise Fees xJAN Janitorial x x x xMFEE Management Fees x x x x x x x x xP&B Payroll & Benefits x x x x x x x x xA&M Advertising & Marketing x x x x x x x x xPFEE Professional Fees x x x x x x x x xG&A General and Administrative x x x x x x x x xOEXP Other Expenses x x x x x x x x xGDR Ground Rent x x x x x x x x xRMSE Room Expense (Departmental) xRMSHK Room Expense-Housekeeping xF&B Food & Beverage (Departmental) xMLSE Meals Expense xDTEL Telephone (Departmental) xODE Other Departmental Expense xLC Leasing Comissions x x x x xTI Tenant Improvements x x x x xCAPEX Capital Expenditures x x x x x x x x xECAPEX Extraordinary Capital Expenditures x x x x x x x x x
Expense Line Items401K P&B P&B P&B P&B P&B P&B P&B P&B P&BAccounting or Tax Fees PFEE PFEE PFEE PFEE PFEE PFEE PFEE PFEE PFEEAdministrative Fee G&A G&A G&A G&A G&A G&A G&A G&A G&AAdvalorem Tax G&A G&A G&A G&A G&A G&A G&A G&A G&AAdvertising A&M A&M A&M A&M A&M A&M A&M A&M A&MAdvertising & Marketing A&M A&M A&M A&M A&M A&M A&M A&M A&MAlarm System G&A G&A G&A G&A G&A G&A G&A G&A G&AAmortization ELIMINATE ELIMINATE ELIMINATE ELIMINATE ELIMINATE ELIMINATE ELIMINATE ELIMINATE ELIMINATEAncillary Expense OEXP OEXP OEXP OEXP OEXP OEXP OEXP OEXP OEXPAnswering Service G&A G&A G&A G&A G&A G&A G&A G&A G&AApartment Finder/Guide A&M ********** ********** ********** ********** ********** ********** ********** **********Appliance CAPEX CAPEX CAPEX CAPEX CAPEX CAPEX CAPEX CAPEX CAPEXArchitectural Fees PFEE PFEE PFEE PFEE PFEE PFEE PFEE PFEE PFEEAsset Management Fees MFEE MFEE MFEE MFEE MFEE MFEE MFEE MFEE MFEEAttorney Fees PFEE PFEE PFEE PFEE PFEE PFEE PFEE PFEE PFEEAuto Repairs G&A G&A G&A G&A G&A G&A G&A G&A G&ABad Debt OEXP/ADJUST OEXP/ADJUST OEXP/ADJUST OEXP/ADJUST OEXP/ADJUST OEXP/ADJUST OEXP/ADJUST OEXP/ADJUST OEXP/ADJUSTBank Charges G&A G&A G&A G&A G&A G&A G&A G&A G&ABanners A&M A&M A&M A&M A&M A&M A&M A&M A&MBonuses P&B P&B P&B P&B P&B P&B P&B P&B P&BBookkeeping Fees PFEE PFEE PFEE PFEE PFEE PFEE PFEE PFEE PFEEBrochures A&M A&M A&M A&M A&M A&M A&M A&M A&MBroker Commission / Fees G&A G&A LC LC LC LC G&A G&A G&ABuilding Lights UTL UTL UTL UTL UTL UTL UTL UTL UTLBuilding Signage A&M A&M A&M A&M A&M A&M A&M A&M A&MBusiness License G&A G&A G&A G&A G&A G&A G&A G&A G&ACable G&A G&A G&A G&A G&A G&A G&A G&A G&ACAM R&M R&M R&M R&M R&M R&M R&M R&M R&MCapital Expenditures CAPEX CAPEX CAPEX CAPEX CAPEX CAPEX CAPEX CAPEX CAPEXCleaning R&M R&M JAN JAN JAN JAN R&M R&M RMSHKCommissions G&A G&A LC LC LC LC LC G&A G&AComputer Repairs G&A G&A G&A G&A G&A G&A G&A G&A G&AContract Labor (Carpet Cleaning) P&B P&B P&B P&B P&B P&B P&B P&B P&BContract Labor-Make Ready P&B P&B P&B P&B P&B P&B P&B P&B P&BContract Work P&B P&B P&B P&B P&B P&B P&B P&B P&BCourtesy Patrol G&A G&A G&A G&A G&A G&A G&A G&A G&ACredit Card Fees ********** ********** ********** ********** ********** ********** ********** G&A **********Credit Check G&A G&A G&A G&A G&A G&A G&A G&A G&ADepreciation ELIMINATE ELIMINATE ELIMINATE ELIMINATE ELIMINATE ELIMINATE ELIMINATE ELIMINATE ELIMINATEDumpster Rental UTL UTL UTL UTL UTL UTL UTL UTL UTLEducation G&A G&A G&A G&A G&A G&A G&A G&A G&AElectrical R&M R&M R&M R&M R&M R&M R&M R&M R&MElectricity UTL UTL UTL UTL UTL UTL UTL UTL UTLElevator R&M R&M R&M R&M R&M R&M R&M R&M R&MEmployee Benefits P&B P&B P&B P&B P&B P&B P&B P&B P&BEmployee Expense P&B P&B P&B P&B P&B P&B P&B P&B P&BEmployee Insurance P&B P&B P&B P&B P&B P&B P&B P&B P&BEngineering Fees PFEE PFEE PFEE PFEE PFEE PFEE PFEE PFEE PFEEEntertainment G&A G&A G&A G&A G&A G&A G&A G&A G&AEquipment Lease / Rental G&A G&A G&A G&A G&A G&A G&A G&A G&AEquipment Repairs R&M R&M R&M R&M R&M R&M R&M R&M R&MEviction Expense G&A G&A G&A G&A G&A G&A G&A G&A G&AExtraordinary Capital Expenditures ECAPEX ECAPEX ECAPEX ECAPEX ECAPEX ECAPEX ECAPEX ECAPEX ECAPEXExterminating Service R&M R&M R&M R&M R&M R&M R&M R&M R&MFF & E Reserve CAPEX CAPEX CAPEX CAPEX CAPEX CAPEX CAPEX CAPEX CAPEXFICA P&B P&B P&B P&B P&B P&B P&B P&B P&BFinancing Fees ELIMINATE ELIMINATE ELIMINATE ELIMINATE ELIMINATE ELIMINATE ELIMINATE ELIMINATE ELIMINATEFinders Fee A&M A&M A&M A&M A&M A&M A&M A&M A&MFire Extinguisher & Moving Exp. G&A G&A G&A G&A G&A G&A G&A G&A G&AFire Prevention G&A G&A G&A G&A G&A G&A G&A G&A G&AFlood Insurance PINS PINS PINS PINS PINS PINS PINS PINS PINSFloor Covering Replacement R&M R&M R&M R&M R&M R&M R&M R&M R&MFood & Beverage Expense (Departmental) ********** ********** ********** ********** ********** ********** ********** F&B MLSEFranchise Fees ********** ********** ********** ********** ********** ********** ********** FFEE A&MFreight & Shipping G&A G&A G&A G&A G&A G&A G&A G&A G&AGas UTL UTL UTL UTL UTL UTL UTL UTL UTLGeneral & Administrative G&A G&A G&A G&A G&A G&A G&A G&A G&A
Page 81 CREFC IRP Version 5.1 Effective 12/1/2010
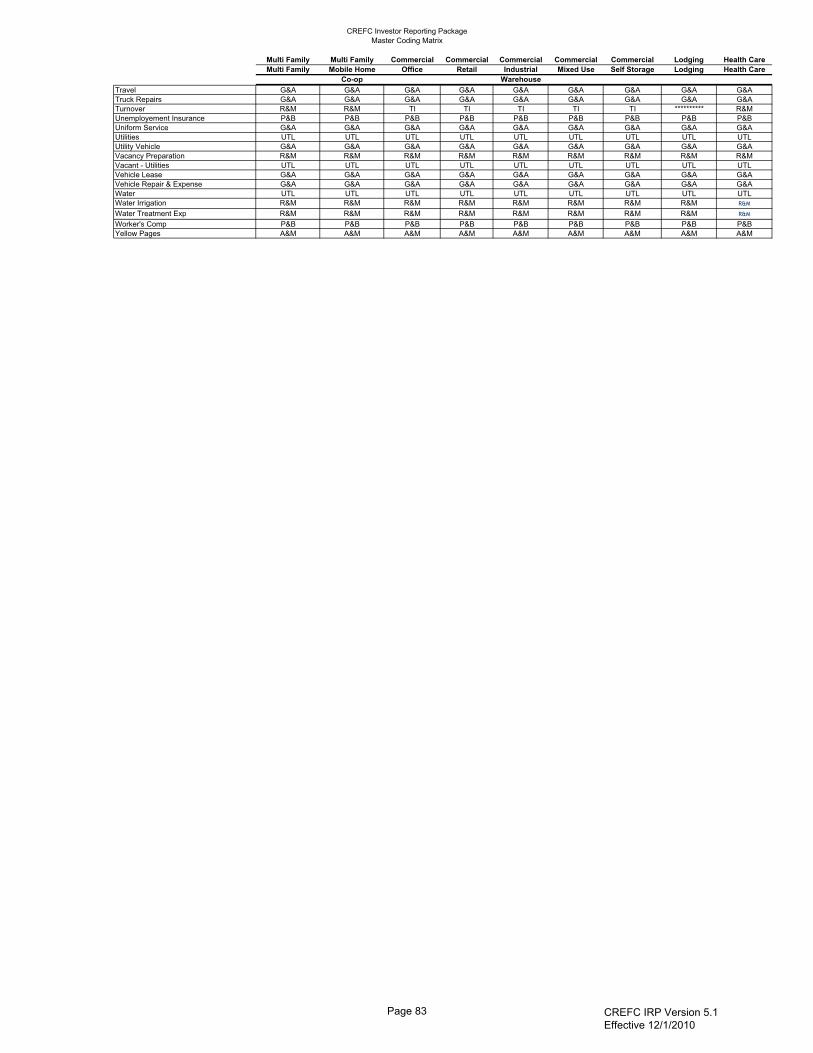
CREFC Investor Reporting PackageMaster Coding Matrix
Multi Family Multi Family Commercial Commercial Commercial Commercial Commercial Lodging Health Care Multi Family Mobile Home Office Retail Industrial Mixed Use Self Storage Lodging Health Care
Co-op WarehouseGeneral Building OEXP OEXP OEXP OEXP OEXP OEXP OEXP OEXP OEXPGround Rent GDR GDR GDR GDR GDR GDR GDR GDR GDRHazard Liability PINS PINS PINS PINS PINS PINS PINS PINS PINSHealth Benefits P&B P&B P&B P&B P&B P&B P&B P&B P&BHeat UTL UTL UTL UTL UTL UTL UTL UTL UTLHVAC R&M R&M R&M R&M R&M R&M R&M R&M R&MInsurance PINS PINS PINS PINS PINS PINS PINS PINS PINSInterest ELIMINATE ELIMINATE ELIMINATE ELIMINATE ELIMINATE ELIMINATE ELIMINATE ELIMINATE ELIMINATEJanitorial R&M R&M JAN JAN JAN JAN ********** ********** **********Labor Plumbing P&B P&B P&B P&B P&B P&B P&B P&B P&BLand Lease GDR GDR GDR GDR GDR GDR GDR GDR GDRLandscaping (Exterior) R&M R&M R&M R&M R&M R&M R&M R&M R&MLandscaping/Plants (Interior) R&M R&M R&M R&M R&M R&M R&M R&M R&MLawn & Grounds R&M R&M R&M R&M R&M R&M R&M R&M R&MLeased Equipment G&A G&A G&A G&A G&A G&A G&A G&A G&ALeasing Comissions ********** ********** LC LC LC LC LC ********** G&ALeasing Office Expense G&A G&A G&A G&A G&A G&A G&A G&A G&ALegal Fees/Expense PFEE PFEE PFEE PFEE PFEE PFEE PFEE PFEE PFEELicenses G&A G&A G&A G&A G&A G&A G&A G&A G&ALife Insurance ELIMINATE ELIMINATE ELIMINATE ELIMINATE ELIMINATE ELIMINATE ELIMINATE ELIMINATE ELIMINATELife Safety G&A G&A G&A G&A G&A G&A G&A G&A G&ALoan Principal ELIMINATE ELIMINATE ELIMINATE ELIMINATE ELIMINATE ELIMINATE ELIMINATE ELIMINATE ELIMINATELocks/Keys R&M R&M R&M R&M R&M R&M R&M R&M R&MMaid Service R&M R&M JAN JAN JAN JAN ********** RMSE RMSHKMake Ready R&M R&M R&M R&M R&M R&M R&M R&M R&MManagement Fees MFEE MFEE MFEE MFEE MFEE MFEE MFEE MFEE MFEEManager Salaries P&B P&B P&B P&B P&B P&B P&B P&B P&BMarketing A&M A&M A&M A&M A&M A&M A&M A&M A&MMeals Expense ********** ********** ********** ********** ********** ********** ********** F&B MLSEMechanical R&M R&M R&M R&M R&M R&M R&M R&M R&MMedia Commissions A&M A&M A&M A&M A&M A&M A&M A&M A&MMileage G&A G&A G&A G&A G&A G&A G&A G&A G&AMiscellaneous OEXP OEXP OEXP OEXP OEXP OEXP OEXP OEXP OEXPMiscellaneous G & A G&A G&A G&A G&A G&A G&A G&A G&A G&AModel Apartment G&A ********** ********** ********** ********** ********** ********** ********** **********Newspaper ads A&M A&M A&M A&M A&M A&M A&M A&M A&MNon-CAM Electric UTL UTL UTL UTL UTL UTL UTL UTL UTLOffice Supplies G&A G&A G&A G&A G&A G&A G&A G&A G&AOther Departmental Expense ********** ********** ********** ********** ********** ********** ********** ODE **********Other Expenses/Costs OEXP OEXP OEXP OEXP OEXP OEXP OEXP OEXP OEXPOwners Draw ELIMINATE ELIMINATE ELIMINATE ELIMINATE ELIMINATE ELIMINATE ELIMINATE ELIMINATE ELIMINATEPainting R&M R&M R&M R&M R&M R&M R&M R&M R&MParking Lot R&M R&M R&M R&M R&M R&M R&M R&M R&MParking lot Electric UTL UTL UTL UTL UTL UTL UTL UTL UTLParking Lot Lighting Repair R&M R&M R&M R&M R&M R&M R&M R&M R&MParking Lot Lights UTL UTL UTL UTL UTL UTL UTL UTL UTLPartnership Fees ELIMINATE ELIMINATE ELIMINATE ELIMINATE ELIMINATE ELIMINATE ELIMINATE ELIMINATE ELIMINATEPayroll & Benefits P&B P&B P&B P&B P&B P&B P&B P&B P&BPayroll Taxes P&B P&B P&B P&B P&B P&B P&B P&B P&BPermits G&A G&A G&A G&A G&A G&A G&A G&A G&APersonal Property Taxes G&A G&A G&A G&A G&A G&A G&A G&A G&APest Control R&M R&M R&M R&M R&M R&M R&M R&M R&MPlumbing R&M R&M R&M R&M R&M R&M R&M R&M R&MPool R&M R&M ********** ********** ********** R&M ********** R&M R&MPostage G&A G&A G&A G&A G&A G&A G&A G&A G&APrinting G&A G&A G&A G&A G&A G&A G&A G&A G&AProfessional Fees PFEE PFEE PFEE PFEE PFEE PFEE PFEE PFEE PFEEPromotions A&M A&M A&M A&M A&M A&M A&M A&M A&MProperty Insurance PINS PINS PINS PINS PINS PINS PINS PINS PINSPublic Relations G&A G&A G&A G&A G&A G&A G&A G&A G&ARate Cap Agreement costs-upfront ELIMINATE ELIMINATE ELIMINATE ELIMINATE ELIMINATE ELIMINATE ELIMINATE ELIMINATE ELIMINATERate Cap Agreement costs-ongoing OEXP OEXP OEXP OEXP OEXP OEXP OEXP OEXP OEXPReal Estate Taxes RET RET RET RET RET RET RET RET RETRental Commissions G&A G&A LC LC LC LC G&A G&A G&ARental Expense G&A G&A G&A G&A G&A G&A G&A G&A G&ARepair Escrow CAPEX CAPEX CAPEX CAPEX CAPEX CAPEX CAPEX CAPEX CAPEXRepairs & Maintenance R&M R&M R&M R&M R&M R&M R&M R&M R&MResident Relations A&M A&M A&M A&M A&M A&M A&M A&M A&MRoom Expense (Departmental) ********** ********** ********** ********** ********** ********** ********** RMSE **********Room Expense-Housekeeping ********** ********** ********** ********** ********** ********** ********** RMSE RMSHKRubbish Removal R&M R&M R&M R&M R&M R&M R&M R&M R&MSalaries P&B P&B P&B P&B P&B P&B P&B P&B P&BSalaries Maintenance P&B P&B P&B P&B P&B P&B P&B P&B P&BSales Tax Paid ELIMINATE ELIMINATE ELIMINATE ELIMINATE ELIMINATE ELIMINATE ELIMINATE ELIMINATE ELIMINATEScavenger R&M R&M R&M R&M R&M R&M R&M R&M R&MSecurity G&A G&A G&A G&A G&A G&A G&A G&A G&ASec.Vehicle & Maint. Vehicle G&A G&A G&A G&A G&A G&A G&A G&A G&ASeptic UTL UTL UTL UTL UTL UTL UTL UTL UTLSewer UTL UTL UTL UTL UTL UTL UTL UTL UTLSignage A&M A&M A&M A&M A&M A&M A&M A&M A&MSnow Removal R&M R&M R&M R&M R&M R&M R&M R&M R&MSpace Designs & Drawings G&A G&A G&A G&A G&A G&A G&A G&A G&ASubcontracted Labor P&B P&B P&B P&B P&B P&B P&B P&B P&BSubscriptions/Dues G&A G&A G&A G&A G&A G&A G&A G&A G&ASupplies R&M R&M R&M R&M R&M R&M R&M R&M R&MSupplies-Cleaning R&M R&M JAN JAN JAN JAN ***** ***** RMSHKSupplies-Marketing A&M A&M A&M A&M A&M A&M A&M A&M A&MTelephone G&A G&A G&A G&A G&A G&A G&A G&A G&ATelephone (Departmental) ********** ********** ********** ********** ********** ********** ********** DTEL **********Temporary Help P&B P&B P&B P&B P&B P&B P&B P&B P&BTenant Improvements ********** ********** TI TI TI TI TI ********** **********Tenant Relations A&M A&M A&M A&M A&M A&M A&M A&M A&MTrash Removal (including contract) UTL UTL UTL UTL UTL UTL UTL UTL UTL
Page 82 CREFC IRP Version 5.1 Effective 12/1/2010

CREFC Investor Reporting PackageMaster Coding Matrix
Multi Family Multi Family Commercial Commercial Commercial Commercial Commercial Lodging Health Care Multi Family Mobile Home Office Retail Industrial Mixed Use Self Storage Lodging Health Care
Co-op WarehouseTravel G&A G&A G&A G&A G&A G&A G&A G&A G&ATruck Repairs G&A G&A G&A G&A G&A G&A G&A G&A G&ATurnover R&M R&M TI TI TI TI TI ********** R&MUnemployement Insurance P&B P&B P&B P&B P&B P&B P&B P&B P&BUniform Service G&A G&A G&A G&A G&A G&A G&A G&A G&AUtilities UTL UTL UTL UTL UTL UTL UTL UTL UTLUtility Vehicle G&A G&A G&A G&A G&A G&A G&A G&A G&AVacancy Preparation R&M R&M R&M R&M R&M R&M R&M R&M R&MVacant - Utilities UTL UTL UTL UTL UTL UTL UTL UTL UTLVehicle Lease G&A G&A G&A G&A G&A G&A G&A G&A G&AVehicle Repair & Expense G&A G&A G&A G&A G&A G&A G&A G&A G&AWater UTL UTL UTL UTL UTL UTL UTL UTL UTLWater Irrigation R&M R&M R&M R&M R&M R&M R&M R&M R&M
Water Treatment Exp R&M R&M R&M R&M R&M R&M R&M R&M R&M
Worker's Comp P&B P&B P&B P&B P&B P&B P&B P&B P&BYellow Pages A&M A&M A&M A&M A&M A&M A&M A&M A&M
Page 83 CREFC IRP Version 5.1 Effective 12/1/2010
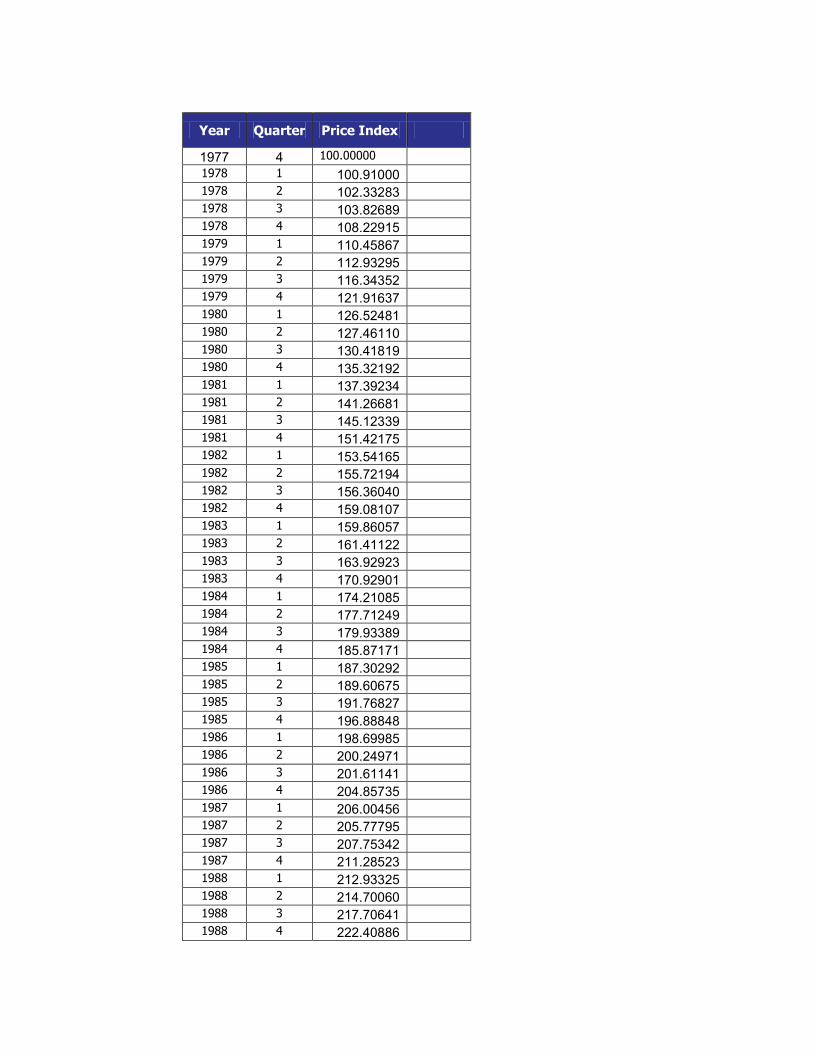
NCREIF Price Index
The National Council of Real Estate Investment Fiduciaries (NCREIF) is an association of institutional real estate professionals who share a common interest in their industry.
They are investment managers, plan sponsors, academicians, consultants, appraisers, CPA's and other service providers who have a significant involvement in institutional estate investments. They come together to address vital industry issues and to promote research.
NCREIF was established to serve the institutional real estate investment community as a non-partisan collector, processor, validator and disseminator of real estate performance information. The members of NCREIF agree to contribute data for all properties in their portfolios from time of purchase to time of sale. ACLI proposes to use the NCREIF Property Price Index as a basis to develop market values for the underlying properties when computing the Risk Based Capital. The Price Index has been tracked since 1978, and provides a long history of property value returns. Over that time period the number of properties tracked has consistently increased. This index is the index with the longest historical values developed on a consistent basis. The index is developed tracking the actual property incomes as reported by the owners, values that are developed through property transactions, and updated appraised values for properties on which there was no transaction. As such, the values each period are based on all of the underlying properties, not on just a small subset that were part of a transaction. Within the Price Index, ACLI proposes the use of the national index which is a single national factor for all property types. While NCREIF develops and publishes values at more detailed levels, it is recommended to use the national average for the following reasons:
• The database of properties is large in total, but for any particular more granular level reduces quickly providing for greater volatility potentially impacted by a small number of properties. NCREIF currently tracks about 6,800 properties with a value on June 30, 2011 of $263 billion – ALCI members hold approximately 35,000 mortgages
• The basic recommendation provides for equal treatment of the key property types – using a single index is consistent with that base recommendation.
• Individual properties will be using their own property specific NOI in the calculation, impacting the greater driver of default at a property level value.
Attached is a chart showing the current values of the NCREIF Price Index by year and quarter.

Year Quarter Price Index
1977 4 100.00000
1978 1 100.91000
1978 2 102.33283
1978 3 103.82689
1978 4 108.22915
1979 1 110.45867
1979 2 112.93295
1979 3 116.34352
1979 4 121.91637
1980 1 126.52481
1980 2 127.46110
1980 3 130.41819
1980 4 135.32192
1981 1 137.39234
1981 2 141.26681
1981 3 145.12339
1981 4 151.42175
1982 1 153.54165
1982 2 155.72194
1982 3 156.36040
1982 4 159.08107
1983 1 159.86057
1983 2 161.41122
1983 3 163.92923
1983 4 170.92901
1984 1 174.21085
1984 2 177.71249
1984 3 179.93389
1984 4 185.87171
1985 1 187.30292
1985 2 189.60675
1985 3 191.76827
1985 4 196.88848
1986 1 198.69985
1986 2 200.24971
1986 3 201.61141
1986 4 204.85735
1987 1 206.00456
1987 2 205.77795
1987 3 207.75342
1987 4 211.28523
1988 1 212.93325
1988 2 214.70060
1988 3 217.70641
1988 4 222.40886

1989 1 223.67660
1989 2 225.64495
1989 3 228.12704
1989 4 231.22957
1990 1 231.83077
1990 2 233.54632
1990 3 233.61638
1990 4 228.10303
1991 1 225.52547
1991 2 222.77406
1991 3 219.65522
1991 4 205.77301
1992 1 203.38604
1992 2 198.32173
1992 3 195.06926
1992 4 187.52008
1993 1 185.90740
1993 2 182.89570
1993 3 183.00544
1993 4 180.53487
1994 1 180.58903
1994 2 180.60709
1994 3 180.76963
1994 4 181.89040
1995 1 182.58159
1995 2 183.16585
1995 3 183.99010
1995 4 183.60372
1996 1 185.09091
1996 2 186.09040
1996 3 188.10017
1996 4 190.86525
1997 1 192.23948
1997 2 194.43101
1997 3 197.75578
1997 4 204.10374
1998 1 209.04305
1998 2 214.70811
1998 3 219.13110
1998 4 224.12729
1999 1 226.57028
1999 2 228.83598
1999 3 231.74220
1999 4 235.19516
2000 1 237.26487
2000 2 240.94248
2000 3 244.65299
2000 4 249.61945

2001 1 251.26694
2001 2 253.57859
2001 3 253.95896
2001 4 251.90189
2002 1 251.22176
2002 2 251.09615
2002 3 251.47279
2002 4 252.42839
2003 1 253.33713
2003 2 254.88249
2003 3 256.15690
2003 4 259.71748
2004 1 262.62632
2004 2 267.43238
2004 3 273.28915
2004 4 283.04557
2005 1 290.03679
2005 2 302.47937
2005 3 312.64268
2005 4 326.43022
2006 1 334.52569
2006 2 344.39420
2006 3 353.31401
2006 4 366.77527
2007 1 376.53150
2007 2 390.65143
2007 3 401.55060
2007 4 413.15541
2008 1 416.50197
2008 2 415.46072
2008 3 411.38920
2008 4 374.32304
2009 1 343.06706
2009 2 321.52245
2009 3 306.98964
2009 4 296.95107
2010 1 295.13967
2010 2 300.98344
2010 3 309.04979
2010 4 320.02106
2011 1 327.22154
2011 2 336.61279
2011 3 344.42221
2011 4 351.86173 2012 1 357.21003
2012 2 363.13972 2012 3 368.04210 2012 4 374.48284


3 MAY 2011
MODELING METHODOLOGY FROM MOODY’S ANALYTICS QUANTITATIVE RESEARCH
Authors
Jun Chen
Jing Zhang
Contact Us
Americas +1-212-553-1653 [email protected]
Europe +44.20.7772.5454 [email protected]
Asia (Excluding Japan) +85 2 2916 1121 [email protected]
Japan +81 3 5408 4100 [email protected]
Modeling Commercial Real Estate Loan Credit Risk: An Overview Version 2.0
Abstract
Commercial real estate (CRE) exposures represent a large share of credit portfolios for many banks, insurance companies, and asset managers. It is critical that these institutions properly measure and manage the credit risk of these portfolios. In this paper, we present the Moody’s Analytics framework for measuring commercial real estate loan credit risk, which is the model at the core of our Commercial Mortgage Metrics (CMM)™ product. We describe our modeling approaches for default probability, loss given default (LGD), Expected Loss (EL), and other related risk measures.
Our framework first models the CRE collateral stochastic process, as driven by both market-wide and idiosyncratic factors. We then apply a Monte Carlo technique to simulate the future paths of the collateral net operating income (NOI) and market value. A CRE loan credit event is doubly triggered by the collateral financial condition at the time of default: both the sustainable NOI falls below the total debt service, and the property market value falls below the total outstanding loan balance.
Moreover, in order to capture the actual observed borrower default behavior, we empirically calibrate the conditional probability of default (PD) function to large historical datasets. We also calculate the unconditional EDF™ (Expected Default Frequency) credit measures as the integration of conditional PD values over the many future paths of NOI and market value. We model LGD through the same process; therefore, LGD and PD are structurally correlated and consistently estimated within the same coherent framework. Built upon EDF measures and LGD, we also calculate other measures such as EL, Yield Degradation (YD), Unexpected Loss (UL), and Stressed EDF measures and loss. By establishing a strong economic causality relationship between credit risks and real estate market- and property-specific covariates, the model also enables large-scale scenario analysis and stress testing.
Additionally, our model facilitates many different business applications, including loan origination, pricing and valuation, risk monitoring, surveillance, regulatory compliance, and portfolio management.

2

MODELING COMMERCIAL REAL ESTATE LOAN CREDIT RISK: AN OVERVIEW 3
Table of Contents
1 Introduction ........................................................................................................................................................... 5
2 Model Outputs and Applications .......................................................................................................................... 6
2.1 Model Outputs ............................................................................................................................................................................................................. 6
2.2 Business Applications ................................................................................................................................................................................................... 7
3 Modeling Framework ............................................................................................................................................. 9
3.1 Understanding Commercial Mortgage Credit Events ..............................................................................................................................................9
3.2 Model Setup and Details ............................................................................................................................................................................................ 11
4 Empirical Data ...................................................................................................................................................... 19
5 Model Validation ................................................................................................................................................ 20
5.1 Walk-forward Tests ................................................................................................................................................................................................... 20
5.2 k-fold Tests ................................................................................................................................................................................................................ 21
5.3 Validating Model Calibration ................................................................................................................................................................................... 22
6 Summary .............................................................................................................................................................. 23
References ................................................................................................................................................................... 25

4

MODELING COMMERCIAL REAL ESTATE LOAN CREDIT RISK: AN OVERVIEW 5
1 Introduction Commercial real estate (CRE) exposures represent a large share of credit portfolios for many financial institutions, including banks, insurance companies, and asset managers. According to the Federal Deposit Insurance Corporation (FDIC), CRE loans comprised about 22% ($1.6 trillion) of all outstanding loans held by U.S. commercial banks and savings institutions as of September 2010.1 For many insurance companies, CRE loans, with a total balance of approximately $300 billion, represent an important asset class in their investment portfolios. 2 In addition, CRE instruments comprise a large portion of the underlying collateral backing structured products. Specifically, as of the third quarter of 2010, there was approximately $706 billion outstanding in commercial mortgage backed securities (CMBS) owned by asset managers, banks, and insurance companies. 3
Given these challenges, financial institutions continue to seek better risk management of their CRE exposures. Toward this goal, the first step is to measure the credit risk of these CRE portfolios, including the standalone credit risk assessment of individual loans, as well as their correlation and concentration effects at the portfolio level. In this paper, we present the Moody’s Analytics framework for measuring the credit risks of individual CRE loans. Specifically, we describe our modeling approaches for default probability, loss given default, Expected Loss (EL), and other related risk measures. For the Moody’s Analytics approach for measuring CRE asset correlation within a portfolio context, see Patel and Zhang (2009).
For these institutions, the risk that borrowers fail to pay either the interest and/or principal on these CRE loans poses a significant challenge. In fact, significant credit loss from commercial mortgages can often wipe out the capital cushion and lead to the failure of a financial institution. During the past 30 years, we have witnessed the failures of numerous financial institutions, both in the late 1980s to early1990s and also in the recent financial crisis, caused to large degree by CRE-specific loan losses.
In our framework, we begin by modeling the asset process of the underlying CRE collateral. We consider the stochastic evolution of a commercial property’s financial performance, including income and market value, as driven by both market-wide and idiosyncratic factors. We first estimate the local market-specific parameters that govern those processes utilizing extensive historical datasets, then we apply a Monte Carlo technique to simulate the future paths of the collateral’s net operating income (NOI) and market value. The Monte Carlo technique enables the model to capture the path-dependency of the survival probability and the remaining credit risks as the future unfolds.
An important model feature is that a CRE loan credit event is doubly triggered by the collateral financial condition at the time of default: both the sustainable NOI falls below the total debt service, and the property market value falls below the total outstanding loan balance. Moreover, since the CRE market operates in an opaque environment that is neither complete nor perfectly efficient, the conditional probability of the default (PD) function is empirically calibrated to large historical datasets in order to capture the actual observed borrower default behavior. We calculate the unconditional EDF (Expected Default Frequency) credit measure as the integration of conditional PD values over the many future paths of NOI and market value.
Finally, we model loss given default (LGD) via the same process; hence, LGD and PD are structurally correlated and consistently estimated in the same coherent framework. Built upon EDF credit measures and LGD, the model also calculates other measures such as EL, Yield Degradation (YD), Unexpected Loss (UL), and Stressed EDF measures and loss. By establishing a strong economic causality relationship between credit risks, the real estate market, and property-specific covariates, the model also enables large-scale scenario analysis and stress testing. Another significant benefit is our model’s ability to accurately differentiate the credit risks of senior/junior structure of the multiple loans on the same collateral, as well as that of mezzanine loans.
In addition to the analytical modeling framework, we have sourced very extensive U.S. commercial real estate market data and forecasts at the metropolitan and submarket levels, where available. These local market data and forecasts are embedded within our Commercial Mortgage Metrics (CMM) system, making it a transparent, one-stop solution where users can consistently measure credit risks across different property types and geographic locations. In the meantime, the
1 FDIC Standard Report #5 (All Commercial Banks–National) as of 9/30/2010.
2 Flow of Funds Accounts of the United States, third quarter 2010.
3 The Compendium of Statistics, update December 30, 2010, published by the CRE Finance Council.

6
CMM system enables total control over the inputs on the collateral’s most recent financial statistics, including NOI and market value (either transaction- or appraisal-based) together with loan characteristics such as coupon rates.
The credit measures produced by our model have many business applications for CRE practitioners. These include risk assessment and asset selection, risk-based pricing and valuation, risk monitoring and surveillance, regulatory compliance and internal control, loss forecast and provisioning, scenario analysis and stress testing, and portfolio management. For example, loan officers and underwriters can objectively and systematically assess the credit risks of a CRE loan located in any given U.S. market; at the back end, credit risk managers and portfolio managers can quickly monitor the most recent credit profiles of individual loans, as well as entire portfolios. By establishing a strong economic causality relationship between credit risks and real estate market and property-specific covariates, the model also enables large-scale scenario analysis and stress testing. For example, CMM allows users to compare results from a baseline scenario and a stressed scenario. Users can also input their own commercial real estate market-specific views and test credit risks from those views.
The remainder of the paper is organized as follows.
• Section 2 describes model outputs and their practical applications.
• Section 3 describes the modeling framework and inner workings of the model.
• Section 4 discusses the empirical data.
• Section 5 documents the model validation findings.
• Section 6 summarizes the paper and provides concluding remarks.
2 Model Outputs and Applications In this section, we focus on the end results of our CMM model, and discuss how various practitioners can use these results to make more informed business decisions.
2.1 Model Outputs The Moody’s Analytics CMM model estimates the credit risk of commercial real estate loans, combining user-provided portfolios with market-wide data and forward-looking scenarios.
The model provides estimates of the following risk measures, both for a single commercial real estate loan as well as for a portfolio of loans.
• EDF (Expected Default Frequency) credit measure—measures the probability that a commercial real estate loan experiences a default event in the future. We estimate EDF credit measures throughout the loan term, and the model estimates an annual EDF measure for a particular point in time within the loan term. We then calculate cumulative EDF measures to measure the cumulative holding period risks.
• Loss given default (LGD)—refers to expected loss amount, typically as a percentage of outstanding unpaid loan balance, at the time of the default event, if the default event occurs.
• Expected Loss (EL)—measures the expected losses of a commercial real estate loan due to default events. Mathematically, for a given point in time, EL = EDF x LGD. This relationship also holds for cumulative holding period measures.
• Yield Degradation (YD)—measures the annualized reduction of expected yields from a commercial real estate loan due to losses related to default events throughout the loan term. YD is similar to the measure of annualized EL, with the main difference being that YD takes into account the timing of expected losses and discounts losses according to the timing, whereas, annualized EL does not involve discounting and time-value of loss.
• Unexpected Loss (UL)—defined as a one standard deviation of loss from the loss distribution. We estimate the one standard deviation of loss based on a full range of loss distribution derived from Monte Carlo simulations of all possible combinations of systematic market risk factors and non-systematic idiosyncratic loan and property-specific risk factors.

MODELING COMMERCIAL REAL ESTATE LOAN CREDIT RISK: AN OVERVIEW 7
• Stressed EDF measure and loss—measures the point estimate of EDF measures or loss from a full range of EDF credit measure or loss distribution derived from Monte Carlo simulations. Typically, we measure the Stressed EDF at a user-specified stressed point, such as a confidence level greater than 50%, for the tail risk at the right-hand side of the distribution.
2.2 Business Applications Underwriters, credit officers, risk managers, and portfolio managers can use Moody’s Analytics CMM for a variety of different business applications. For institutions that employ internal rating systems as the foundation of many business decisions, they can either map the EDF credit measures and LGD outputs to their internal rating scales, or combine them with other qualitative inputs to derive an internal rating. Alternatively, they can use CMM to benchmark and calibrate their own internal risk rating systems.
CMM applications include risk assessment and asset selection, risk-based pricing and valuation, risk monitoring and surveillance, regulatory compliance and internal control, loss forecast and provisioning, scenario analysis and stress testing, and portfolio management.
Using CMM in Internal Ratings Systems
Internal rating systems serve as the foundation of many business decisions within financial institutions such as credit approval, limit setting, regulatory compliance, risk-based pricing, and active portfolio management. An effective internal rating system has the following attributes.
• Separates default and recovery risk.
• Provides powerful differentiation of relative ranking of risk.
• Well-calibrated to provide appropriate distinctions of risk.
• Contains well-documented definitions, assumptions, and methodologies.
• Combines qualitative assessment and quantitative assessment where appropriate.
We developed CMM with the above attributes in mind. CMM measures CRE loan default risk via EDF credit measures and recovery risk via its LGD. As shown later in this paper, the model proves to be powerful, forward-looking, and accurately calibrated to real loss experience. For documentation, this introductory paper, together with the detailed and comprehensive modeling documents, provides model transparency for users. Therefore, CMM is ideal as a quantitatively-based internal ratings system for CRE exposures. If institutions use internal rating scales not generated in absolute scales, such as PD and LGD, they can map the EDF credit measures and LGD outputs to their own internal rating scales.
Many institutions find that market-based information, when available, is particularly relevant and powerful in internal risk rating assessment. CMM credit measures utilize a significant amount of CRE market information, and we construct them to reflect all the relevant property type and location-specific market information. Thus, if the user finds it appropriate to combine qualitative assessment with quantitative components, CMM credit measures are particularly useful as the market-based quantitative assessment component of an internal rating system. In fact, we make it feasible and efficient to implement such an approach in the Moody’s Analytics RiskAnalyst™ system. An internal rating system must provide sufficient differentiation of default risk. To calibrate such a system, regulators typically expect a sizeable amount of realized default events and loss severity data spanning at least a full economic cycle. Many institutions do not possess enough internal data and can benefit from using CMM credit measures to benchmark and calibrate internal risk systems.
Risk Assessment and Asset Selection
CMM can be very effective during an institution’s credit underwriting process. Commercial mortgage underwriters and credit officers can benefit significantly by using CMM to directly measure and compare credit risks at loan origination for given loan and property characteristics. For example, CMM allows users to run multiple “what-if” analyses to compare how credit risks, including PD, LGD, and EL, would change if either one or both the Debt-service Coverage

8
Ratio (DSCR) and loan-to-value (LTV) change. Underwriters can use this information to risk-base price loans according to a specific combination of DSCR and LTV.
Another invaluable feature of CMM is its embedded local real estate market data and forecasts, which make it possible to compare loan risks across different property types and geographic locations. For example, a national financial institution often conducts CRE lending in many locales throughout the country, and individual underwriter expertise and assessment may vary significantly between local offices. CMM enables centralized credit risk management to objectively and consistently measure credit risk without overly relying upon individual judgments from dozens of or even hundreds of different credit underwriters.
Risk-based Pricing and Valuation
A financial asset such as a commercial mortgage must be appropriately compensated for its given risks. Because commercial mortgages fit well in held-for-investment portfolios, the long-term credit risks become, de facto, the most important source of risk. As such, CMM can help determine the trade-offs between loan pricing and future risks. This type of risk-based pricing and valuation can be performed both at the primary market and the secondary market levels.
Risk Monitoring and Early Warning
The credit quality of commercial mortgages can change quickly as the market environment or property-specific conditions change. Because the credit risk measure outputs from CMM are objective and forward-looking, risk managers can target their risk assessment and mitigation resources toward cases where they can be the most effective. Annual reviews and other traditional credit processes cannot maintain the same degree of speed, consistency, and objectivity. Within CMM, accurate and timely information from the commercial real estate market can be applied consistently across the entire portfolio, which is often difficult and expensive to duplicate using traditional credit analysis processes.
Regulatory Compliance and Internal Governence
The probability of default associated with an internal rating plays a central role in the calculation of capital requirements within the Basel II framework. Banks may use external PD models, such as EDF measures from CMM, as part of their internal ratings, either for regulatory capital calculations or for fulfilling internal governance and external regulatory requirements.
Loss Forecast and Provisioning
Loan loss provisions are expenses charged to a bank’s earnings when adding to the allowance for possible bad debt. In estimating the provisioning amount, one can use a credit risk model to estimate the potential credit losses on loans. The model should respond to changes in the risk environment across the economy as a whole. In other words, a provisioning calculation should be as forward-looking as possible. In fact, both the International Accounting Standard Board (IASB) and the Basel Committee on Bank Supervision are moving toward the more forward-looking “expected loss” approach and away from the “incurred loss” approach (e.g., Basel Committee on Banking Supervision, 2009). All CMM credit measures are forward-looking assessments that respond to changes in the CRE market cycle and produce accurate estimates of credit losses over a long period. Consequently, these credit measures are appropriate for expected loss-based provisioning calculations.
Scenario Analysis and Stress Testing
The future remains inherently uncertain. No single person or entity, nor the market as a whole, possesses a crystal ball that predicts exactly what will occur. We built the CMM system so that it contains several embedded commercial real estate market forecast scenarios, and also allows users to input their own views regarding specific property types and/or geographic locations. Such functionality is particularly valuable for risk managers when comparing possible outcomes from different economic outlooks. Forecast scenarios are also becoming more and more a daily business necessity, given increased regulator and internal risk controller requirements for periodic stress tests. The CMM on-demand scenario analytic capabilities can significantly improve an institution’s readiness to meet such continuous demands.
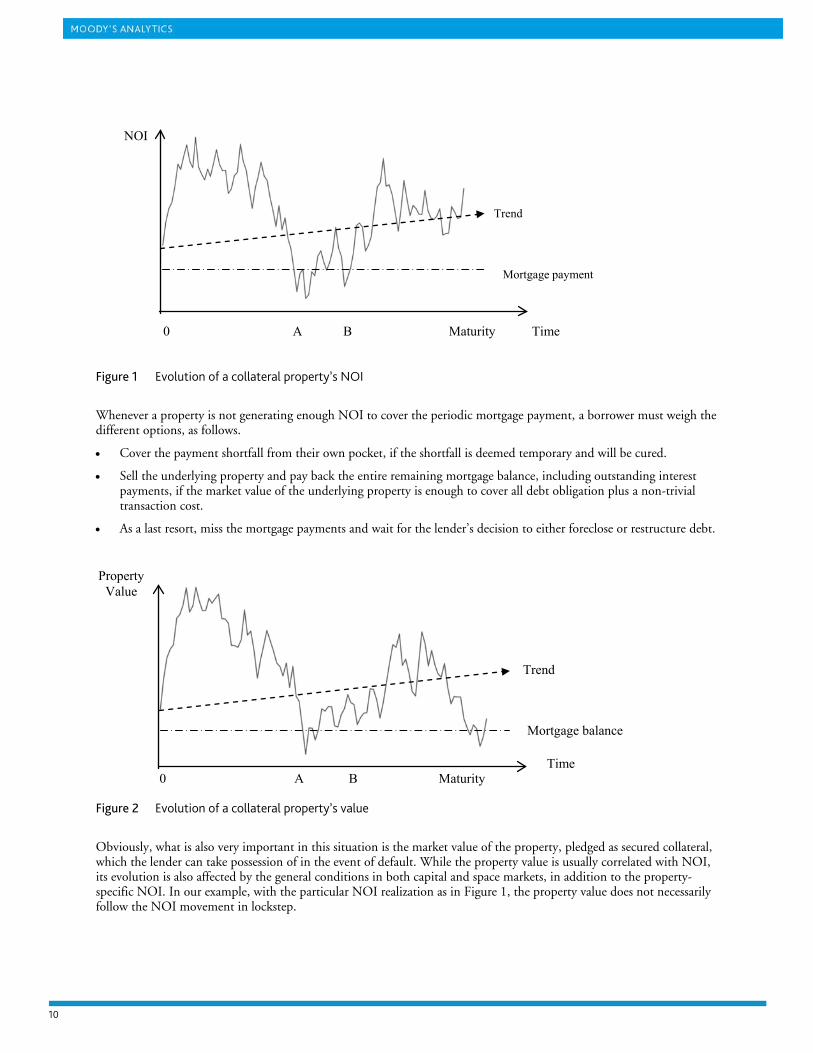
MODELING COMMERCIAL REAL ESTATE LOAN CREDIT RISK: AN OVERVIEW 9
Portfolio Management
Portfolio management entails making numerous decisions, such as taking on additional exposures, selling or hedging existing exposures, and calculating the prices at which to do so. The Moody’s Analytics CMM system provides a framework that enables you to make informed decisions regarding which loans to create, under what terms, and at what price(s). In addition, risk managers can use CMM portfolio functionality to construct strategies that exploit the relative price differences between property types and local CRE markets. Additionally, the EDF measures and LGD outputs from CMM can serve as inputs to calculations performed by portfolio management systems such as Moody’s Analytics RiskFrontier™
.
3 Modeling Framework In this section, we first describe how credit events occur for commercial real estate loans in the real world. We use an example to illustrate the importance of the collateral financials in affecting a loan’s credit risk. Next, we present the conceptual framework as well as details of the model’s inner workings, including specifics on the asset process, the PD model, and the LGD model. We then describe how the components work together within the CMM system. Finally, we explain how CMM implements scenario analysis and stress testing.
3.1 Understanding Commercial Mortgage Credit Events Since our objective is to accurately measure the probabilities of a credit event occurring and the resulting losses associated with the credit events, first and foremost, it is important to examine why and how credit events and losses happen in the real world. We want to make sure our model succinctly and consistently emulates real world phenomena and captures its essence.
Why would any commercial real estate loan borrower default on their debt obligations? In principle, there are two primary reasons under the so-called double trigger framework. The first is that cash flow from the property is inadequate to cover the scheduled mortgage payment; the second is that the underlying commercial properties, which serve as the secured collateral for most commercial real estate loans, are worth less than the mortgages. In other words, a commercial mortgage borrower’s ownership value, inclusive of property resale value , plus current and future incomes, less the market value of the mortgage (including current outstanding payments), becomes less than zero in the event of default. We point out that the borrower’s equity value is its economic value and takes into account embedded options, so it may differ from the book equity measure. Also, because commercial real estate is an asset class primarily focused on producing an inflation-adjusted rental income stream while preserving capital value, it is more productive to separate and focus on the income side of the ownership value. We illustrate the double trigger framework with the following example.
Double trigger framework example
When a commercial mortgage is originated, the mortgage lender typically requires cushions in both leverage and debt service coverage. For example, a LTV ratio of 70% and a DSCR of 1.30 may be the threshold underwriting criteria for a particular lender. Under this threshold, the maximum loan amount a borrower can obtain is $7,000,000, if the market value of the property is worth $10,000,000; and the maximum annual debt service a lender would allow is $538,462, if the property is currently generating $700,000 in annual net operating income (NOI). In fact, since both ratios need to satisfy the threshold underwriting ratios, the actual mortgage may either carry a loan amount of less than $7,000,000 or the annual debt service is less than the $538,462. The point here is that most commercial mortgages, if underwritten appropriately and absent of fraud, should, in theory, carry no or very little credit risk at origination. What drives the credit risk is the inherent future uncertainty, which can potentially be quantified.
For simplicity, assume that a commercial mortgage originates with $7,000,000 loan amount, with annual debt service of $538,462, based on a $10,000,000 property generating $700,000 NOI a year. The realization of future NOI of the property is unknown and can follow an infinite number of possible paths. In the particular NOI path illustrated in Figure 1, there are periods around points A and B where the collateral’s NOI is not sufficient to cover mortgage payments.

10
Figure 1 Evolution of a collateral property’s NOI
Whenever a property is not generating enough NOI to cover the periodic mortgage payment, a borrower must weigh the different options, as follows.
• Cover the payment shortfall from their own pocket, if the shortfall is deemed temporary and will be cured.
• Sell the underlying property and pay back the entire remaining mortgage balance, including outstanding interest payments, if the market value of the underlying property is enough to cover all debt obligation plus a non-trivial transaction cost.
• As a last resort, miss the mortgage payments and wait for the lender’s decision to either foreclose or restructure debt.
Figure 2 Evolution of a collateral property’s value
Obviously, what is also very important in this situation is the market value of the property, pledged as secured collateral, which the lender can take possession of in the event of default. While the property value is usually correlated with NOI, its evolution is also affected by the general conditions in both capital and space markets, in addition to the property-specific NOI. In our example, with the particular NOI realization as in Figure 1, the property value does not necessarily follow the NOI movement in lockstep.
A B Time
Property Value
Maturity 0
Mortgage balance
Trend
NOI
Time
Mortgage payment
A B Maturity 0
Trend

MODELING COMMERCIAL REAL ESTATE LOAN CREDIT RISK: AN OVERVIEW 11
As illustrated in Figure 2, the property value drops below the mortgage balance around point A, but not point B. Toward the end, the property value declines again around loan maturity even though the property’s NOI remains well above the scheduled mortgage payment amount, shown in Figure 1.
It is straightforward to make the following observations with this particular example, as shown in Table 1.
Table 1 Decision analysis on default probabilities
Decision Point DSCR LTV Decision Analysis Credit Risk Measurement
A < 1.0 > 100% High probability of default EDFA
B < 1.0 < 100% Not a clear-cut default choice EDFB
Maturity > 1.0 ≈ 100% High refinancing risk EDFMaturity
While the above discussions illustrate the financial aspects of CRE borrower default drivers, we should note that decades of actual experience with commercial mortgage defaults also clearly teach us that a borrower’s decision to default is not purely a financial matter. For a CRE asset that is illiquid and difficult to value and to sell easily, the borrower’s decision to default is influenced by both financial facts and subjective assessment of the situation, leading to the so-called “sub-optimal” (non-ruthless) default behaviors observed at the aggregate level. 4
To create a credit risk model that is relevant for business users, we must anchor the analysis on empirical data. While theoretical thinking is very useful as a starting point in disentangling the causes and consequences from a rational economic-reasoning perspective, a model will not be accurate and useful for business applications if it is simply an intellectual exercise without the benefit of actually-observed historical data. Thus, our approach to modeling CRE credit events is to combine rational economic reasoning perspectives with insights gleaned from careful analysis of empirical data.
We emphasize here that a vast majority of borrowers do make very rational and near-optimal decisions regarding defaults; it is the inability to observe and record many loan, property, and borrower-specific decision factors that lead to empirically-observed, “sub-optimal” default rates in aggregate. Furthermore, even perfectly explainable and rational behavior on the individual level can still appear to be “sub-optimal” using aggregate data alone.
3.2 Model Setup and Details Because commercial mortgage credit events fundamentally depend on the realized financial conditions of the underlying collateral and the market environment it operates within, our modeling process starts by understanding and quantifying the dynamic processes and uncertainties surrounding CRE assets. In addition, at the time of financial distress, because commercial mortgage borrowers make default decisions based beyond purely financial considerations, we employ empirical data and statistical analysis to measure the “sub-optimal” or “behavioral” aspect of mortgage defaults. In other words, our modeling framework can be thought of as consisting of two major parts: the underlying commercial properties’ stochastic dynamics following a structural approach; and empirically calibrated default probability measurements, conditional upon realized property financials.
4 Note here that “sub-optimal” is viewed from the borrower’s perspective. In fact, since the lender takes the opposite position, the
“sub-optimal” borrower’s behavior actually adds value to the lenders’ CRE portfolio. Because, in aggregate, CRE borrowers do not exercise their default options ruthlessly, most lenders’ CRE operation has been able to live through the cyclical troughs of the CRE market downturns without being completely destroyed.

12
Figure 3 The CMM modeling framework consists of two major parts
Mathematically, a commercial real estate loan’s EDF credit measure at a particular point in time t is:
𝐸𝐷𝐹𝑡 = �𝑃𝑟𝑜𝑏(𝑋𝑡) ∙ 𝑃𝑟𝑜𝑏(𝐷𝑒𝑓𝑎𝑢𝑙𝑡|𝑋𝑡) (1)
where Xt denotes all the relevant financial variables at the loan, property, and market levels measured at time t,
Prob(Xt) measures the probability of a particular realization of Xt,
and Prob(Default|Xt) is a conditional default probability function given the realized Xt. EDFt, (i.e. the unconditional EDF), is simply an integration of the probabilities of all possible realizations of Xt multiplied by corresponding conditional default rates for those realizations.
We find that this composite modeling approach leads to the most effective credit risk model by combining the best of both worlds. On the one hand, the dynamics of variable, Xt, follows a structural stochastic process that is fully parameterized based on extensive historical observations of the commercial property financials. On the other hand, the calibration of the conditional default rate function Prob(Default|Xt), derived from rigorous statistical analysis, captures the “sub-optimal” exercise of the default options, and therefore, produces accurate and realistic EDF measures. This composite approach is similar in spirit to the Moody’s Analytics EDF credit measure model approach for publicly traded firms, as that model is also a structural approach with a robust implementation grounded in empirical data.
Another benefit of our modeling approach is that it naturally leads to LGD measures that are economically and structurally correlated to PD, because LGDt can be estimated as another conditional function that draws Xt as the dependent variables. This method offers significant improvement over an ad hoc approach to approximate the relationship between PD and LGD.
In essence, our CMM model consists of three key elements.
• Parameterizations of Asset Dynamics and Volatility (the Asset dynamics model). In this step, the CRE collateral’s NOI and value processes in the future are parameterized, based on its property type and geographic location, in conjunction with the known financial and leasing information at the starting point.
• Calculation of EDF Measure (the EDF model). At a future time t, given realized NOI and values generated by Monte Carlo simulations, the model first calculates the default drivers, including DSCR and LTV, and then estimates conditional PD through the conditional default rate function Prob(Default|Xt). Provided by the known distribution characteristics of NOI and value from the first step, the model then estimates unconditional EDF measures as well as Stressed EDF measures as point estimates from the full range of conditional PD distributions.
• Calculation of LGD (the LGD model). Given a simulated market value of the collateral at a future time t, the model estimates conditional LGD through an empirically-determined loss function. An unconditional LGD is the weighted sum of conditional LGD values, with weights being the corresponding conditional PD values.
We can also easily calculate other risk measures such as EL, UL, and yield degradation since the model performs a full Monte Carlo simulation from which EDF measures and LGD have been calculated. The remainder of this section offers a brief introduction to these key model elements.

MODELING COMMERCIAL REAL ESTATE LOAN CREDIT RISK: AN OVERVIEW 13
3.2.1 Asset Dynamics and Volatility
Asset dynamics refers to the inner workings and quantifiable causal relationships of the commercial properties’ financial performance, and asset volatility refers to the uncertainty around the financial performance. While conceptually one can measure all sorts of financial-related variables including rents, occupancy rates, revenue, expense, NOI, capital expenditure, and market value etc., the direct drivers behind commercial mortgage defaults are mainly DSCR and LTV, which are, in turn, driven by NOI and the property’s market value.
Modern financial theory views any asset, including commercial real estate, as having two independent sources of risk drivers:
• One related to the overall market movement, also known as market or systematic risk
• Another related to the specifics of individual assets, also known as non-systematic or idiosyncratic risk
Intuitively, this separation is no different than the commonly practiced attribution analysis, where both performance (returns) and risks (volatility) can be traced back to either market-wide trends or asset-specific conditions. It has been established that the process of a commercial property’s income or value can be approximated as follows:
𝑃𝑖,𝑡 = 𝑃𝑚,𝑡 + 𝜀𝑖,𝑡 (2)
where Pi,t represents the realization of NOI or value in log form for the ith property at time t, and Pm,t represents the market-wide index at the same time t, and εi,t is the idiosyncratic component of the Pi,t movement that remains after stripping out the market-driven component.
The specification also means that, in terms of risk composition,
Variance [𝑃𝑖,𝑡] = Variance [𝑃𝑚,𝑡] + Variance[𝜀𝑖,𝑡] (3)
The importance of a risk model when considering both systematic and idiosyncratic risks is illustrated in Figure 4, which shows a typical CRE asset that displays substantially higher total risk than market risk alone.
Figure 4 Distributions of NOI amounts or values
0 1 2 3 4 5 6 7 8 9 10Year
0 1 2 3 4 5 6 7 8 9 10Year
Systematic component
Non-systematic component
Systematic risk
Non-systematic risk Total risk
Market volatility only
Total volatility
68% of realizations
95% of realizations

14
Because real estate is a very location- and property type-specific business, the market here is defined by property types and metropolitan areas. In other words, the San Francisco office market is considered a distinct market from the San Francisco apartment market or the New York office market, and so on. Drawing from a large historical time-series database, which includes both market-wide performance statistics and property-specific operating financials covering a substantial portion of the U.S., we can estimate and parameterize the asset dynamics and volatilities as specified in Equations (2) and (3) for most of the active CRE markets in the U.S.
To help understand how CMM implements the Monte Carlo simulations of the collateral NOI, we provide an example of the actually observed property-level NOI values of office properties in the San Francisco office market.
Figure 5 Property-level observations of normalized NOI for San Francisco office properties.
Since DSCR is determined to be the most important empirical variable, in CMM Monte Carlo simulations, we focus on the NOI simulations based on the observed historical patterns by property type and metropolitan areas, such as the one shown in Figure 5. In particular, we simultaneously simulate the random realization of independent factors: the market-wide and the property idiosyncratic factors. For example, as shown in Figure 6, the market factor could rise, stay flat, or lower in the future.
Meanwhile, a particular realization of the collateral’s NOI can also deviate from the market factor by idiosyncratic variations. Given a particular realization of the market path, the final realized NOI could be better than, the same as, or worse than the market-wide growth rates. We have observed in the actual model implementation that the end results of CMM’s NOI simulations for the San Francisco office market are indeed quite similar to that shown in Figure 5, which confirms the validity and robustness of our collateral models.
Figure 6 The asset risk of a commercial property comes from both market and idiosyncratic sources
-50
0
50
100
150
200
250
300
1999 2000 2001 2002 2003 2004 2005 2006 2007 2008 2009
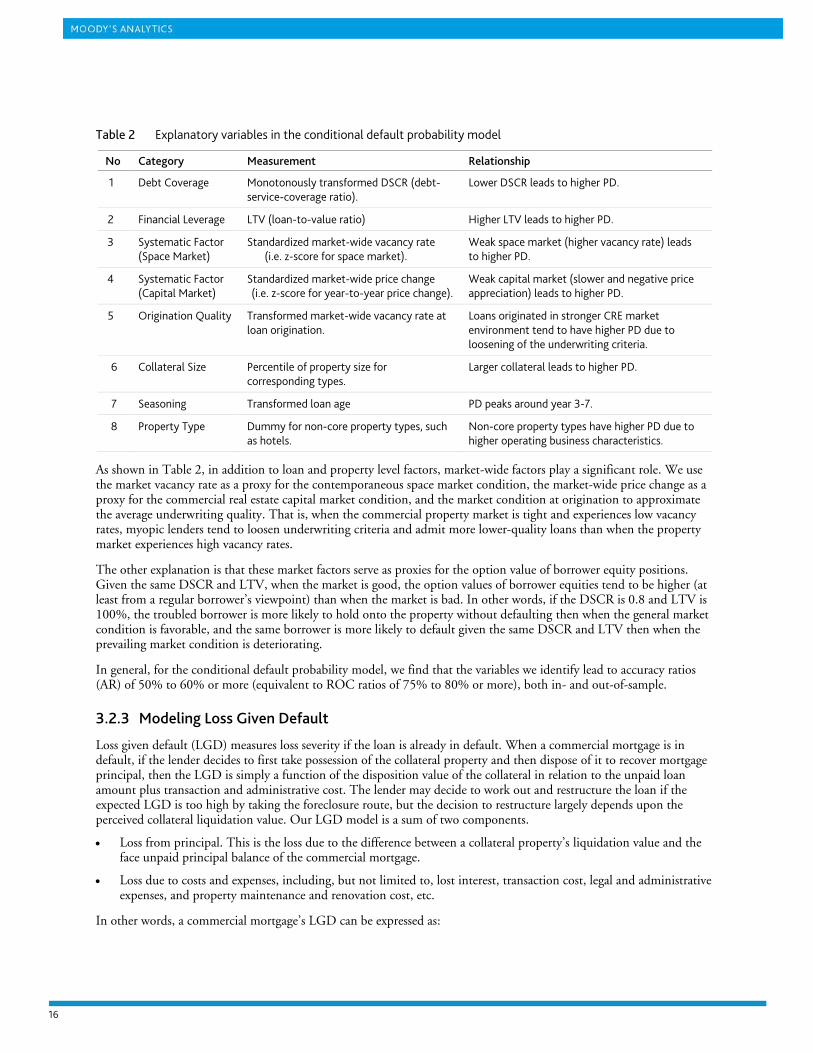
MODELING COMMERCIAL REAL ESTATE LOAN CREDIT RISK: AN OVERVIEW 15
3.2.2 Modeling Conditional Default Probability
Once we fully specify the asset processes, the next problem is to solve the probability of borrowers choosing to default, based on a particular realization of NOI and market value of the underlying collateral. Fundamentally, this is a question about the conditional default probability. Note, that in an abstract structural default modeling approach, such as the Merton model, a loan would automatically default once the market value of the asset falls below that of the mortgage, since the amount of the debt serves as the absorbing boundary. While still incorporating this powerful notion, our modeling framework expands to include the following very important practical considerations, making the model truly relevant in the real business world.
• The market value of a specific asset is actually unknown and is a somewhat subjective measure in the case of commercial real estate. As such, in an empirical model, we must resort to other directly-observable measures to complement imprecise measures of the asset value. It is also important to recognize that a periodic income stream should be explicitly factored into the valuation equation of a CRE asset.
• Net operating income (NOI), which is directly observable and ubiquitously measured and recorded, is of predominant financial and decision-making importance to commercial mortgage borrowers. Notice that a particular CRE asset is fundamentally an income-producing asset, and, unlike a corporation, it has no potential to grow its business base, since its physical size and location are fixed once built. As we find throughout our empirical work, the debt-service-coverage ratio (DSCR), which measures the level of NOI relative to the periodic mortgage payments, explains a large portion of the historical default incidents.
• Defaulting (or not) is a borrower’s choice, rather than a strict rule that must be followed. While financial factors such as DSCR and LTV are of critical importance, choices are behavioral in nature and subjective to both quantifiable and non-quantifiable factors. Note here, we consider that the conditional default rate is not only a default probability conditional upon known financial and operating ratios, but it is also a probability of a borrower choosing to default. To date, it appears to us that the best way to model this kind of behavioral issue is through extensive statistical analysis using large panel datasets, which is exactly what we incorporate.
Effectively, our conditional default probability model is a multi-factor empirical function that links empirical default rates to key explanatory variables at both the property/loan and the market levels. Our empirical research identifies the following key statistically-significant variables in explaining historical defaults.
• Asset level financial ratios: DSCR, LTV, and collateral size
• Market cycle factors: vacancy rate, market-wide price changes, and market condition at origination
• Other: core vs. non-core collateral and loan seasoning
The functional model form looks like:
𝑃𝑟𝑜𝑏(𝐷𝑒𝑓𝑎𝑢𝑙𝑡|𝑋𝑡) = 𝑓[𝑇1(𝐷𝑆𝐶𝑅𝑡),𝑇2(𝐿𝑇𝑉𝑡), … ] (4)
where Xt denotes all the explanatory variables listed above,
T1 and T2 are semi-parametric transformations of DSCR and LTV,
and f is a logistic function to capture the non-linear relationship between PD and explanatory variables.
16
Table 2 Explanatory variables in the conditional default probability model
No Category Measurement Relationship
1 Debt Coverage Monotonously transformed DSCR (debt-service-coverage ratio).
Lower DSCR leads to higher PD.
2 Financial Leverage LTV (loan-to-value ratio) Higher LTV leads to higher PD.
3 Systematic Factor (Space Market)
Standardized market-wide vacancy rate (i.e. z-score for space market).
Weak space market (higher vacancy rate) leads to higher PD.
4 Systematic Factor (Capital Market)
Standardized market-wide price change (i.e. z-score for year-to-year price change).
Weak capital market (slower and negative price appreciation) leads to higher PD.
5 Origination Quality Transformed market-wide vacancy rate at loan origination.
Loans originated in stronger CRE market environment tend to have higher PD due to loosening of the underwriting criteria.
6 Collateral Size Percentile of property size for corresponding types.
Larger collateral leads to higher PD.
7 Seasoning Transformed loan age PD peaks around year 3-7.
8 Property Type Dummy for non-core property types, such as hotels.
Non-core property types have higher PD due to higher operating business characteristics.
As shown in Table 2, in addition to loan and property level factors, market-wide factors play a significant role. We use the market vacancy rate as a proxy for the contemporaneous space market condition, the market-wide price change as a proxy for the commercial real estate capital market condition, and the market condition at origination to approximate the average underwriting quality. That is, when the commercial property market is tight and experiences low vacancy rates, myopic lenders tend to loosen underwriting criteria and admit more lower-quality loans than when the property market experiences high vacancy rates.
The other explanation is that these market factors serve as proxies for the option value of borrower equity positions. Given the same DSCR and LTV, when the market is good, the option values of borrower equities tend to be higher (at least from a regular borrower’s viewpoint) than when the market is bad. In other words, if the DSCR is 0.8 and LTV is 100%, the troubled borrower is more likely to hold onto the property without defaulting then when the general market condition is favorable, and the same borrower is more likely to default given the same DSCR and LTV then when the prevailing market condition is deteriorating.
In general, for the conditional default probability model, we find that the variables we identify lead to accuracy ratios (AR) of 50% to 60% or more (equivalent to ROC ratios of 75% to 80% or more), both in- and out-of-sample.
3.2.3 Modeling Loss Given Default
Loss given default (LGD) measures loss severity if the loan is already in default. When a commercial mortgage is in default, if the lender decides to first take possession of the collateral property and then dispose of it to recover mortgage principal, then the LGD is simply a function of the disposition value of the collateral in relation to the unpaid loan amount plus transaction and administrative cost. The lender may decide to work out and restructure the loan if the expected LGD is too high by taking the foreclosure route, but the decision to restructure largely depends upon the perceived collateral liquidation value. Our LGD model is a sum of two components.
• Loss from principal. This is the loss due to the difference between a collateral property’s liquidation value and the face unpaid principal balance of the commercial mortgage.
• Loss due to costs and expenses, including, but not limited to, lost interest, transaction cost, legal and administrative expenses, and property maintenance and renovation cost, etc.
In other words, a commercial mortgage’s LGD can be expressed as:

MODELING COMMERCIAL REAL ESTATE LOAN CREDIT RISK: AN OVERVIEW 17
𝐿𝐺𝐷𝑡 = 𝑔[𝑇3(𝐿𝑇𝑉𝑡),𝑌] (5)
where T3 is a transformation function of LTV to make it linear to LGDt ,
Y denotes the empirical variables proxy for disposition costs,
and g is a linear specification.
From a theoretical standpoint, the principal loss part of a commercial mortgage’s LGD is simply the ratio of principal shortfall from collateral liquidation and remaining loan balance, i.e.,
𝐿𝐺𝐷𝑃𝑟𝑖𝑛𝑐𝑖𝑝𝑎𝑙 = −𝐶𝑜𝑙𝑙𝑎𝑡𝑒𝑟𝑎𝑙 𝑉𝑎𝑙𝑢𝑒 − 𝐿𝑜𝑎𝑛 𝐴𝑚𝑜𝑢𝑛𝑡
𝐿𝑜𝑎𝑛 𝐴𝑚𝑜𝑢𝑛𝑡=
1𝐿𝑇𝑉
− 1 (6)
LGDPrincipal should be an inverse function of LTV if the CRE market is efficient, with negligible transaction costs. Because the CRE market is not as efficient and carries significant transaction costs, the liquidation price of distressed commercial properties tends to trade below the market price of comparable non-distressed assets. We find that the degree of distress in the actual loss severities data could be partially proxied by another observable variable: time to liquidation.
Drawing upon a large and updated historical LGD dataset, we can confirm the model’s empirical validity. Using actual observable variables, empirical evidence clearly supports the statistical and economic significance of LTV, time to liquidation, and collateral size. Beyond what is explained above, time to liquidation is directly correlated to lost interest, transaction, and property maintenance cost. Collateral size captures the percentage cost of some relatively fixed expenses on the legal and administrative sides. For example, $1 million legal and administrative cost would add 2% LGD to a $50 million loan, while the same cost would add 10% LGD to a $10 million loan. Altogether, our empirical model explains about 50% of the historical loan-level LGD variation.
Table 3 Explanatory variables in the conditional LGD model
No Category Measurement Relationship
1 Loss on Principal 1/LTV Higher LTV leads to higher LGD.
2 Loss on Interest and property maintenance cost.
Time to resolution (time lag between first missed payment and eventual resolution).
Longer time to resolution leads to higher LGD.
3 Administration and legal cost.
Percentile of the collateral size by property types.
Larger collateral corresponds to slightly lower LGD due to some fixed costs on asset liquidation.
Since the implementation of CMM model uses Monte Carlo simulation techniques, we can simulate numerous future asset income and value paths. These simulated asset values provide a direct measure of loss from principal, thus enabling an LGD measure that is also structurally and causally correlated to the EDF measure.
3.2.4 Putting It All Together
In summary, our CMM model applies an asset-based composite approach that combines a structural asset evolution process and empirically calibrated functions for both EDF measures and LGD. The steps to calculate EDF and LGD measures for a given commercial real estate loan include the following.
1. Simulate a large number of asset income paths and values by considering both systematic and idiosyncratic uncertainties.
2. Calculate a series of DSCR, LTV, and other explanatory variables along each simulation path.

18
3. On each simulation path i, estimate its conditional EDF and LGD measures at time t, EDFi,t and LGDi,t, given the simulated realizations of DSCRi,t, LTVi,t and other contemporaneous explanatory variables using Equation 4 and Equation 5.
4. Calculate unconditional EDF measure at time t, EDFt, by using Equation (1).
5. Calculate unconditional EL at time t, ELt, using the formula:
𝐸𝐿𝑡 =∑ (𝐸𝐷𝐹𝑖,𝑡 × 𝐿𝐺𝐷𝑖,𝑡)𝑁𝑖=1
𝑁 (7)
where i refers to individual simulation path that has equal probability of asset realization, and N is the total number of simulation trials. Unconditional LGD at time t, LGDt, follows by LGDt=ELt/EDFt.
One key benefit of implementing the Monte Carlo simulation technology is the resulting full-range distribution of conditional PD and conditional loss rates through a large number of random draws. Very naturally, from there we obtain all the point estimates regarding UL and various stressed EDF measures and stressed loss rates at any user-specified confidence levels.
3.2.5 “What-if” Questions and Scenario Analysis
As our model adopts a strong economically sensible causative specification during each step, it provides users with a powerful and reliable framework in which they can ask “what-if” questions regarding the model’s various inputs and then examine the effects on credit risks of any input changes. For example, a user may be interested in comparing the EDF measures between the baseline economic forecast scenario (S0) and a stressed economic forecast scenario (S1). Furthermore, the user may also want to test the differences of EDF measures if the future CRE market volatility differs from the past, which is a legitimate exercise, given the vast amount of literature pointing to the existence of time-varying volatilities. It would be of tremendous business value to complete the report shown in Table 4 by leveraging CMM as one of the main tools.
Table 4 Scenario analysis over the holding period: an example of model flows
Scenario Macroeconomic Assumptions
CRE Market Assumptions
CRE Asset Volatility
CRE Portfolio EDF
CRE Portfolio EL
S0:
Base case
GDP0
Unemployment0
… …
NOI growth0
Value growth0
… …
1.0 times historical market vol
EDF0 EL0
S1:
Stressed case
GDP1
Unemployment1
… …
NOI growth1
Value growth1
… …
x times historical market vol
EDF1 EL1
Users can change one or all three categories of forward-looking assumptions to conduct scenario analysis. In addition, both macroeconomic and CRE market outlook scenarios can be either direct user inputs or sourced to third-party vendors within the CMM application. In fact, there are a number of third-party vendors who provide forward-looking macroeconomic and CRE market scenarios as fee-based forecasting services. Users may find it cost-effective and informative to take advantage of the available location-specific forecasts from those forecasters. For example, CMM users can use the CRE markets forecasts provided by CBRE Econometric Advisors (EA) and/or macroeconomic forecasts provided by Moody’s Economy.com.
Macroeconomic Outlook
CRE Market Outlook
CMM Output: Credit Risk Measures
Forward-looking Volatility

MODELING COMMERCIAL REAL ESTATE LOAN CREDIT RISK: AN OVERVIEW 19
Moody’s Analytics does not endorse any third-party forecast services nor validates their accuracy. Rather, in absence of a large, publicly traded market for the CRE asset class, we find that the forward-looking views given by industry experts provide useful perspectives, although the eventual market movement may occasionally deviate from their actual forecasts.
4 Empirical Data A model is only as good as the empirical data allows. The shortage of long-term, detailed reliable data poses a major challenge for developing a credit risk model for commercial real estate loans. In the process of developing our model, we assembled a collection of datasets covering different aspects of the CRE asset and loan markets. Collectively, these datasets serve as the foundation for both model development and model validation.
The datasets used in CMM model development and validation provide both aggregate market statistics and property- and loan-level information. Data sources include the following.
• National Council of Real Estate Investment Fiduciaries (NCREIF)—provides aggregate market statistics, mainly capital appreciation, income, and total returns, for five major property types and more than 50 metropolitan areas. Some series are offered at the property subtype levels. Despite some shortcomings, the NCREIF dataset is widely regarded as the industry benchmark measurement in terms of aggregate market movement. The earliest data points go as far back as 1978 in the NCREIF database.
• CB Richard Ellis Econometric Advisors (CBRE EA)—provides aggregate market statistics, mainly market rents and vacancies, at the MSA and submarket (is applicable) levels. CBRE EA market rent data are probably the most well-constructed rent indices, which carefully control for many idiosyncrasies in the actual observed lease rates. The earliest data from CBRE EA goes back to 1980 for office and industrial properties. CBRE EA data also covers multifamily, retail, and hotel property types.
• Real Capital Analytics (RCA)—provides disaggregated property-level transaction data on price and cap rates (if available) for any commercial property transactions valued over $5 million in the U.S. One can examine the aggregate statistics at any level as long as sufficient transactions exist. This data powers the Moody’s/REAL Commercial Property Price Index (CPPI), and the earliest observations begin in 2000.
• Trepp’s CMBS Deal Library—one of the largest commercially available databases of the U.S. CMBS universe. The Deal Library contains comprehensive information and history on both individual loans and properties that serve as collateral within the CMBS transactions. Since CMBS is a relatively young segment of the commercial mortgage market, the useful history for empirical research goes back approximately ten years.
• American Council of Life Insurers (ACLI)—publishes periodic reports on the commitment profiles and credit performance of commercial mortgages originated and held by life insurance companies. ACLI data offers the longest aggregate time-series of loan performance spanning several CRE market cycles, beginning in 1965. Hence, this database serves as an invaluable data source for the most credible through-the-cycle analysis for held-for-investment commercial mortgages.
• Federal Deposit Insurance Corporation (FDIC)—publishes quarterly bank-specific reports that detail the holdings and credit performance of banks’ loans and leases, including longer-term commercial mortgages and short-term construction loans. Data goes back to 1992, and provides a unique perspective as it is the only public source for the credit performance of the CRE loan portfolios held by banks and savings institutions, the largest players in the CRE lending marketplace.
• Proprietary data contributed by financial institutions—through its business relationships, Moody’s obtains proprietary access to historic loan-level data from lenders in the commercial mortgage business. The earliest observations of such datasets go back as far as the 1970s.
• Various published studies and reports, including the series of studies conducted by Snyderman and Esaki et al. The unique importance of the Snyderman-Esaki studies lies in its tabular mortality tables that track individual loan cohorts from cradle-to-grave in terms of default rates. These loan cohorts were originated from 1972 through 1997 by major life insurance companies and experienced 2,700 defaults (15.3%) out of the 17,978 total loans originated. The data is widely used by market participants in benchmarking and in conducting scenario analyses throughout cycles.
While each of the above datasets is indispensible for our model development, none is completely sufficient on its own. We take a mosaic approach that pieces all the information and empirical analysis together within the coherent

20
overarching framework explained in Section 3. The final CMM model is the result of exhaustive empirical analyses and careful triangulation from complementing insights garnered from multiple data sources.
5 Model Validation Validating a quantitative risk model is both a theoretical and an empirical problem. By theoretical, we refer to the general guidelines of model development, which involve not only academic rigor, but also sound and time-proven business experience. Validation refers to whether or not the model makes econometric sense as well as common business sense, and also whether or not the model specifies an economically-sensible and long-lasting causative relationship that links credit risks with key risk drivers.
Model theoretical validation also involves imposing a parsimonious structure and designing the model so that it is intuitive and simple to understand. A parsimonious structure allows the model to focus on the most important factors while leaving out “accidental” variables that are either redundant or have a one-time transient effect only. Meanwhile, an intuitive model is more traceable and more likely to be used appropriately by regular business users with limited statistical backgrounds. Moreover, a model should be theoretically validated by examining the directional response of PD/LGD to explanatory variables. For example, one would expect PD to increase with the decline of DSCR, and this type of directional relationship can be first validated through a theoretical angle. Finally, common sense and business experience also apply when checking the theoretical reasonableness of model results. For example, since we will not be able to predict ex ante which loans will default and which will not default, a model is probably poorly constructed if it consistently outputs PDs in the 95% to 100% range for an input DSCR of 1.0.
Beyond theoretical considerations, a model must be empirically validated, most importantly, through the out-of-sample data. Moody’s Analytics has pioneered and refined the use of empirical validation in commercial credit models, and we validate the CMM model using those proven testing processes.
It is useful to consider the model’s empirical validation from two separate yet related metrics.
• Model power—the ability of the model to rank-order individual loans from more to less risk. Power describes how well a model discriminates between defaulting (“bad”) and non-defaulting (“good”) loans.
• Model calibration—the consistency of the aggregate-level EDF and LGD measures when compared to the actual realization for a portfolio of loans. It also measures relative risk magnitudes between subsets of a portfolio. For example, whether or not a model can predict correctly if group A has twice the default rates as group B.
These two dimensions are indispensible for a good model, as model power ensures its ability to rank score individual risks, and model calibration ensures the EDF level closely matches the actual default rates throughout portfolios and through time.
For model power, we apply walk-forward, k-fold, and cross-validation techniques. These tests include out-of-sample testing (using defaults and non-defaults that were not used in the model development, such as “hold-out” sample) and comparisons to alternative model specifications.
5.1 Walk-forward Tests The walk-forward testing approach allows users to test models and modeling methodologies while controlling for sample and time dependence 5
5 See Dwyer and Kocagil (2005).
. It proceeds as follows. We estimate the model up to a certain year and score the observations in the next year. These model scores are out-of-time and out-of-sample. We then re-estimate the model including one more year of data and repeat the analysis for the next year and continue until the end of the sample. For each version of the model, we calculate the accuracy ratio of next year’s scores by comparing them to actual realized default rates. Under this approach, we select the development dataset prior to a certain cutoff date, and the validation dataset begins after that date. Multiple tests can be conducted as one moves the cutoff dates backward and forward. This technique reduces the chances of “over-fitted” models, since the testing process never uses data used to fit model parameters. At the same time, the approach allows modelers to take greater advantage of the data by using as much of the information as possible to fit

MODELING COMMERCIAL REAL ESTATE LOAN CREDIT RISK: AN OVERVIEW 21
and to test the models. The results from our out-of-sample tests show a high degree of discriminatory power of CMM model, shown in Table 5.
Table 5 Out-of-sample model power from the walk-forward method
Development Data Out-of-sample Year ROC Ratio 6 Accuracy Ratio
Up to 2006 2007 77.6% 55.2%
Up to 2007 2008 80.8% 61.6%
Up to 2008 2009 78.8% 57.6%
A model is considered to be better than a random guess if the ROC ratio is above 50% and the accuracy ratio is above 0%. A perfect model achieves the maximum possible 100% for both ROC and accuracy ratios.
Figure 7 A typical CMM model validation power curve
5.2 k-fold Tests Similar results on the model’s power can be obtained using alternative validation techniques such as k-fold and cross-validation analysis. The k-fold analysis tests model stability vis-à-vis different data segments. In this analysis, we divide commercial mortgages into k sub-sample (we typically set k = 5). We then estimate the model on the sample while excluding the observations in the set {k=1}. This model is used to score the observations in the set {k=1}. Such scores represent true out-of-sample estimates. We repeat this process for each of the k sub-samples. Afterward, we combine the out-of-sample scores into one data set and calculate the accuracy ratios and the power curve. We then compare these results with the corresponding in-sample accuracy ratios and power curve. In addition, we check to see whether the parameter estimates for each explanatory variable are stable across the different samples. We find that model performance is well maintained both in- and out-of-sample in the k-fold analysis.
As shown in Table 6, our out-of-sample analysis also confirms that the model’s discriminatory powers remain consistent across different property types.
6 The ROC ratio is also commonly called the area under the ROC curve (AUROC), where ROC refers to receiver operating
characteristics.
Random Guess
The more distance, the better the model’s Predictive Power
CMM Model

22
Table 6 Out-of-sample power curves by property types
Property Type ROC Ratio Accuracy Ratio
Office 80.8% 61.6%
Retail 81.7% 63.4%
Industrial 79.7% 59.4%
Multifamily 81.8% 63.6%
Hotel 86.8% 73.6%
5.3 Validating Model Calibration In terms of validating model calibration, we conduct a thorough out-of-sample exercise. That is, we first develop a version of the model using the latest default data from the 2000s era and then apply the model to a pseudo-historical commercial mortgage portfolio of the life insurers to compare the modeled PD/LGD to actual realized default rates and loss severities. Since calibration is about the correct overall aggregate levels of the risk measures, we focus on the 10-year cumulative PD values for vintages 1985 through 1995, which we were able to track their credit performance through 2002 7 Table 7. The out-of-sample model results match closely with realized defaults, as shown in and Figure 8.
Table 7 Out-of-sample comparison of PD levels with actual
Statistical Measure CMM Model PD Actual Default Rate
Average 13.0% 13.1%
Standard Deviation 10.4% 9.7%
Minimum 1.9% 0.7%
Maximum 31.0% 27.3%
Figure 8 Comparison of the cumulative 10-year model PD and actual, realized default rates
Additional calibration exercises simulate a representative commercial mortgage industry portfolio throughout its history and compare model PD and EL to actual, realized default rates and charge-off rates (proxy for credit losses) using the
7 See Snyderman (1991) and Esaki and Goldman (2005).
0%
5%
10%
15%
20%
25%
30%
35%
85 86 87 88 89 90 91 92 93 94 95
Cumulative Default Rate
Origination Cohort
Model PD Actual Default Rate

MODELING COMMERCIAL REAL ESTATE LOAN CREDIT RISK: AN OVERVIEW 23
aggregate time-series statistics of the CRE loan portfolios held by FDIC banks. The result also confirms that calibration of model PD, LGD, and EL is largely consistent with banks’ historical experience.
Because model calibration also involves relative risk measurements between subsets of a portfolio, we conduct another validation exercise to compare out-of-sample PD level accuracy by buckets. In this exercise, we bucket out-of-sample observations into 30 buckets based on our estimated PD and then compare the average PDs with actual realized default rates for each group, shown in Figure 9. The overall PD levels appear to fit quite well across rating groups based on estimated PD.
Figure 9 Fitting between PD Buckets and actual realized default rates
Using a variety of validation techniques, we find that the model estimates credit risks reasonably well, conditional upon accurate inputs. We believe that the model produces satisfactory risk measurements over the past several commercial real estate cycles given the empirical evidence we have access to; we also believe that the model is applicable to all the major segments of the market: insurance companies, CMBS, and commercial banks.
The CMM application is flexible enough to allow the user to conduct historical analyses. As a result, users can perform back-testing using an institution’s historical portfolios to compare model results to see if they match realized default and loss rates when using the validation metrics from the power, as well as the calibration perspectives. Before users implement the CMM application within their organizations, we encourage them to thoroughly understand and evaluate the model to ensure appropriate use.
6 Summary The commercial real estate and commercial mortgage markets continue to evolve. We have seen numerous changes on many important fronts: demand for commercial real estate space driven by macroeconomic forces, local supplies driven by each MSA’s physical layout and zonings, and capital sources increasingly fluid and global in nature. Furthermore, the recent credit crisis has heightened regulatory scrutiny of commercial mortgage lending.
Despite all the changing factors, we find that a commercial property’s financials, transpired through DSCR and LTV, continue to play a dominant role in affecting mortgage defaults and losses. Other market-wide factors, such as the prevailing commercial real estate market condition and underwriting pressures, continue to influence the magnitude of point-in-time default rates through their impact on default option values and borrower behaviors. This little-changed relationship between a loan’s financial performance and its credit risk makes a quantitative model not only possible, but extremely useful for any serious risk management practice.
After extensive research on a very rich collection of both public and private data sets, we have developed unprecedented insights into the drivers of credit risks of commercial mortgages. The result is our CMM modeling framework, which balances the need for a highly predictive model with a robust, intuitive, transparent, and highly flexible model.
Based on all the evidence seen to date, we firmly believe that our CMM framework will prove indispensible for financial institutions when implementing quantitative credit risk tools in loan origination, portfolio management, scenario analysis, stress testing, and meeting regulatory requirements.
24
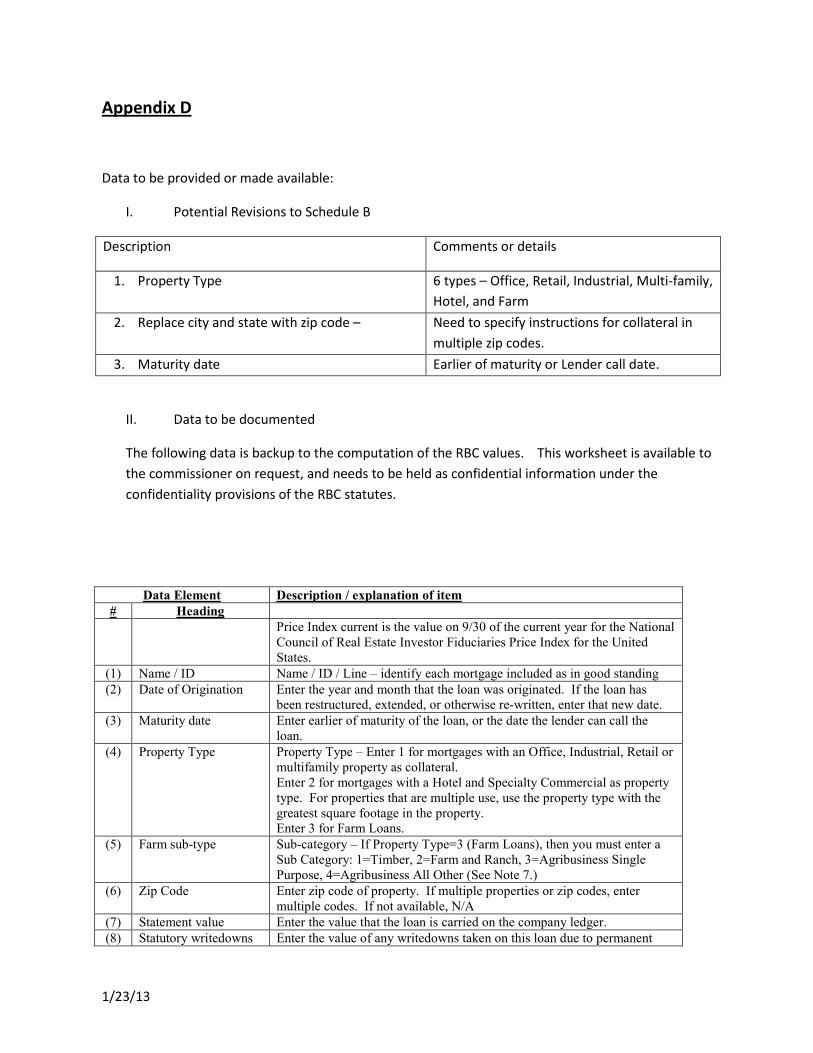
MODELING COMMERCIAL REAL ESTATE LOAN CREDIT RISK: AN OVERVIEW 25
References
Acknowledgements
The authors thank Kevin (Qibin) Cai for substantive research assistance.
Copyright © 2011 Moody's Analytics, Inc. and/or its licensors and affiliates. All rights reserved.
References
Black, Fischer, and Myron Scholes, 1973, “The Pricing of Options and Corporate Liabilities.” Journal of Political Economy, Vol 81, No 3, 637–659.
Chen, Jun and Yongheng Deng, 2004. “Commercial Mortgage Workout Strategy and Conditional Default Probability: Evidence from Special Serviced CMBS Loans.” Real Estate Research Institute funded paper.
Crosbie, Peter and Jeff Bohn, 2003. “Modeling Default Risk.” Moody’s KMV White Paper.
Dwyer, Douglas W. and Ahmet E. Kocagil, 2005. “Moody’s KMVTM RiskCalcTM V3.1, United States.” Moody’s KMV White Paper.
Esaki, Howard and Masumi Goldman, 2005. “Commercial Mortgage Defaults: 30 Years of History.” CMBS World, 21-29, Winter 2005.
Merton, Robert C., 1973, “Theory of Rational Optional Pricing.” Bell Journal of Economics, Vol 4, No 1, 141–183.
Patel, Nihil and Jing Zhang, 2009, “Modeling CRE Correlations in Credit Portfolios,” Moody’s KMV white paper, 2009.
Snyderman, Mark P., 1991. “Commercial Mortgages: Default Occurrence and Estimated Yield Impact.” Journal of Portfolio Management, Fall 1991.
Vandell, Kerry D., 1992. “Predicting Commercial Mortgage Foreclosure Experience.” AREUEA Journal, Vol 20, No 1, 55-88.
Wheaton, William, Ray Torto, Jon Southard and Robert Hopkins, 2001. “Evaluating Real Estate Risk: Debt Applications.” Real Estate Finance, Vol 18 No 3, 29-41.

1/23/13
Appendix D
Data to be provided or made available:
I. Potential Revisions to Schedule B
Description Comments or details
1. Property Type 6 types – Office, Retail, Industrial, Multi-family, Hotel, and Farm
2. Replace city and state with zip code – Need to specify instructions for collateral in multiple zip codes.
3. Maturity date Earlier of maturity or Lender call date.
II. Data to be documented
The following data is backup to the computation of the RBC values. This worksheet is available to the commissioner on request, and needs to be held as confidential information under the confidentiality provisions of the RBC statutes.
Data Element Description / explanation of item # Heading Price Index current is the value on 9/30 of the current year for the National
Council of Real Estate Investor Fiduciaries Price Index for the United States.
(1) Name / ID Name / ID / Line – identify each mortgage included as in good standing (2) Date of Origination Enter the year and month that the loan was originated. If the loan has
been restructured, extended, or otherwise re-written, enter that new date. (3) Maturity date Enter earlier of maturity of the loan, or the date the lender can call the
loan. (4) Property Type Property Type – Enter 1 for mortgages with an Office, Industrial, Retail or
multifamily property as collateral. Enter 2 for mortgages with a Hotel and Specialty Commercial as property type. For properties that are multiple use, use the property type with the greatest square footage in the property. Enter 3 for Farm Loans.
(5) Farm sub-type Sub-category – If Property Type=3 (Farm Loans), then you must enter a Sub Category: 1=Timber, 2=Farm and Ranch, 3=Agribusiness Single Purpose, 4=Agribusiness All Other (See Note 7.)
(6) Zip Code Enter zip code of property. If multiple properties or zip codes, enter multiple codes. If not available, N/A
(7) Statement value Enter the value that the loan is carried on the company ledger. (8) Statutory writedowns Enter the value of any writedowns taken on this loan due to permanent

1/23/13
impairment. (9) Involuntary Reserve Enter the amount of any involuntary reserve amount. Involuntary reserves
are reserves that are held as an offset to a particular asset that is clearly a troubled asset and are included on Page 3 Line 25 of the Annual Statement.
(10) Original Loan Balance?
Enter the loan balance at the time of origination of the loan.
(11) Principal balance to Co.
Enter the value of the loan balance owed by the borrower.
(12) Balloon payment at maturity
Enter the amount of any balloon or principle payment due at maturity.
(13) Principal balance total Enter the total amount of mortgage outstanding that is senior to or pari passu with the company’s mortgage
(14) NOI second prior Enter the NOI from the year prior to the value in (15) See Note 1. (15) NOI prior Enter the NOI from the prior year to the value in (16) See Note 1. (16) NOI Enter the Net Operating Income for the most recent 12 month fiscal period
with an end-date between July1 of the year prior to this report and June 30 of the year of this report. The NOI should be reported following the guidance of the Commercial Real Estate Finance Council Investor Reporting Profile v.5.0. Section VII. See Notes 1, 2, 3, 4, and 5 below.
(17) Interest rate Enter the Annual interest rate at which the loan is accruing. - If the rate is floating, enter the larger of the current month rate or
the average rate of interest for the prior 12 months, or - If the rate is fixed by the contract, not level over the year, but
level for the next 12 months, use current rate. If the ‘Total Loan Balance’ consists of multiple loans, use an average loan interest rate weighted by principal balance.
(18) Trailing 12 month debt service
Enter actual 12 months debt service for prior 12 months
(19) Original Property Value
Enter the loan balance at the time of origination of the loan.
(20) Property Value Property Value is the value of the Property at time of loan origination, or at time of revaluation due to impairment underwriting, restructure, extension, or other re-writing.
(21) Year of valuation Year of the valuation date defining the value in (20). (22) Quarter of valuation Calendar quarter of the valuation date defining the value in (20). (23) Credit Enhancement Enter the full dollar amount of any credit enhancement. (see Note 4.) (24) Senior Loan? Enter yes if the senior position, no if not. (see Note 6.) (25) Construction Loan? Enter ‘Yes’ if this is a construction loan. (see Note 3.) (26) Construction – not in
balance Enter ‘Yes” if his is a construction loan that is not in balance. (see Note 3.)
(27) Construction – Issues Enter ‘Yes” if this is a construction loan with issues. (see Note 3.) (28) Land Loan? Enter ‘Yes’ if this is a loan on non-income producing land. (see Note 5.) (29) 90 days past due? Enter ‘Yes’ if payments are 90 days past due. (30) In process of
foreclosure? Enter ‘Yes’ if the loan is in process of foreclosure.
(31) Is current payment lower than a payment based on the Loan Interest?
Yes / No
(32) Is loan interest a floating rate?
Yes / No
(33) If not floating, does loan reset during term?
Yes / No - Some fixed rate loans define in the loan document a change to a new rate during the life of the loan, which may be a pre=determined rate or may be the then current market rate. Generally any such changes are

1/23/13
less frequent than annual. . (34) Is negative
amortization allowed? Yes / No
(35) Amortization type? 1 = fully amortizing 2 = amortizing with balloon, 3 = full I/O 4 = partial I/O, then amortizing
(36) Rolling Average NOI For 2012 – 100% of NOI For 2014 – 65% NOI + 35% NOI Prior For 2015 – 50% NOI + 30% NOI Prior + 20% NOI 2nd Prior For loans originated or valued within the current year use 100% NOI. For loans originated 2012 or later and within 2 years, use 65% NOI and 35% NOI Prior
(37) RBC Debt Service RBC Debt Service Amount is the amount of 12 monthly principal and interest payments required to amortize the Total Loan Balance (13) using a Standardized Amortization period of 300 months and the Annual Loan Interest Rate (17).
(38) DCR Debt Coverage Ratio is the ratio of the Net Operating Income (36) divided by the RBC Debt Service (37) rounded down to 2 decimal places. See Note 3 below for special circumstances.
(39) NCREIF Index at Valuation
Price index is the value of the NCREIF Price Index on the last day of the calendar quarter that includes the date defined in (21) and (22).
(40) Contemporaneous Property Value
Contemporaneous Value is the Property Value (20) times the ratio (rounded to 4 decimal places) of the Price Index current to the Price Index at valuation (39).
(41) LTV The Loan to Value ratio is the Total Loan Value (13) divided by the Contemporaneous Value (40) rounded to the nearest percent.
(42) CM category Commercial Mortgage Risk category is the risk category determined by applying the DCR (10) and the LTV (15) to the criteria in Figure (4), Figure (5) or Figure (6). See Notes 2, 3, 4, 5, and 6 below for special circumstances.

1
Appendix E

2
RBC Instructions LR003 – Mortgage Experience Adjustment:
LR004 – Mortgages:
LR009 – Schedule BA Mortgages:
LR010 – Asset Concentration Factor:
LR030 – Tax Effect:
3
MORTGAGES LR004
Basis of Factors
Mortgages in Good Standing
The pre-tax factors for commercial mortgages were developed based on analysis using the Commercial Mortgage Metrics model of Moody’s Analytics and documented in a report
from the American Council of Life Insurers on February 15, 2013. The factors provide for differing levels of risk, the levels determined by a contemporaneous debt service
coverage ratio and the contemporaneous loan-to-value. The 0.14 percent pre-tax factor on insured and guaranteed mortgages represents approximately 30-60 days interest lost due
to possible delay in recovery on default. The pre-tax factor of 0.68 percent for residential mortgages reflects a significantly lower risk than commercial mortgages. The pre-tax
factors were developed by dividing the post-tax factor by 0.7375 (0.7375 is calculated by taking 1.0 less the result of 0.75 multiplied by 0.35).
Mortgages 90 Days Overdue, Not in Process of Foreclosure
The category pre-tax factor for commercial and farm mortgages of 18 percent is based on data taken from the Society of Actuaries “Commercial Mortgage Credit Risk Study.” For
insured and guaranteed or residential mortgages, factors are set at twice the level for those “in good standing” to reflect the increased likelihood of default losses.
Mortgages in Process of Foreclosure
Mortgages in process of foreclosure are considered to be as risky as Class 5 bonds and are assigned the same category pre-tax factor of 23 percent for commercial and farm
mortgages.
Due and Unpaid Taxes on Overdue Mortgages and Mortgages in Foreclosure
The factor for due and unpaid taxes on overdue mortgages and mortgages in foreclosure is 100 percent.
Specific Instructions for Application of the Formula
Column (1)
Insured or guaranteed mortgages should be reported separately from residential and commercial mortgages. Insured or guaranteed loans include only those mortgage loans insured
or guaranteed by the Federal Housing Administration, under the National Housing Act (Canada) or by the Veterans Administration (exclusive of any portion insured by FHA.).
Mortgage loans guaranteed by another company (affiliated or unaffiliated) are not to be included in the insured or guaranteed category.
Except for Lines (1) through (3), (26) and (27), calculations are done on an individual mortgage basis and then the summary amounts are entered in this column for each class of
mortgage investment. Refer to the mortgage calculation worksheet A (Figure 1) for how the individual mortgage calculations are completed for Other Than In Good Standing
mortgages on Lines (16) through (25). Refer to the mortgage calculation worksheet B (Figure 3) for how the individual mortgage calculations are completed for In Good Standing -
Commercial mortgages on Lines (4) through (8) and for In Good Standing - Farm mortgages on Lines (10) through (14). Line (28) should equal Page 2, Column 3, Lines 3.1 plus
3.2, plus Schedule B, Part 1 Footnotes 3 and 4, first of the two amounts in the footnotes.
Column (2)
Companies are permitted to reduce the book/adjusted carrying value of mortgage loans reported in Schedule B by any involuntary reserves. Involuntary reserves are equivalent to
valuation allowances specified in SSAP No. 37 paragraph 16. These reserves are held as an offset for a particular troubled mortgage loan that would be required to be written down
if the impairment was permanent.
Column (3)
Column (3) is calculated as the net of Column (1) less Column (2).
Column (4)

4
Summary amounts of the individual mortgage calculations are entered in this column for each class of mortgage investments. Refer to the mortgage calculation worksheets.
Cumulative writedowns include the total amount of writedowns, amounts non-admitted and involuntary reserves that have been taken or established with respect to a particular
mortgage.
Column (5)
For Lines (4) and (10), the pre-tax factor is equal to 0.0090
For Lines (5) and (11), the pre-tax factor is equal to 0.0175
For Lines (6) and (12), the pre-tax factor is equal to 0.0300
For Lines (7) and (13), the pre-tax factor is equal to 0.0500
For Lines (8) and (14), the pre-tax factor is equal to 0.0750
For Lines (16) through (25), the average factor column is calculated as Column (6) divided by Column (3).
For Lines (26) and (27), the pre-tax factor is 1.0.
Column (6)
For Lines (4) through (8), (10) through (14) and (16) through (25), summary amounts are entered for Column (6) based on calculations done on an individual mortgage basis. Refer
to the mortgage calculation worksheets A and B. For Lines (1) through (3), (26) and (27), the RBC subtotal is multiplied by the factor to calculate Column (6).
(Figure 1)
Mortgage Worksheet A
Other Than In Good Standing
(1) (2) (3) (4) (5) (6) (7) (7a) (8) (9) (10)
Name / ID
Book/Adjusted
Carrying
Value
Involuntary
Reserve
Adjustment§
RBC
Subtotal£
Cumulative
Writedowns*
Category
Factor
In Good
Standing
Factor
In good
standing
category
Col (6) X
[Col (4)+(5)]
- Col (5)
Col (4) X
Col (7)
RBC
Requirement‡
(1) All Mortgages Without
Cumulative Writedowns
XXX † †
†
All Mortgages With
Cumulative
Writedowns:
(2)
(3)
(4)
(5)
(6)
(7)
(8)
(9)
(10)
(11)
(12)
(13)
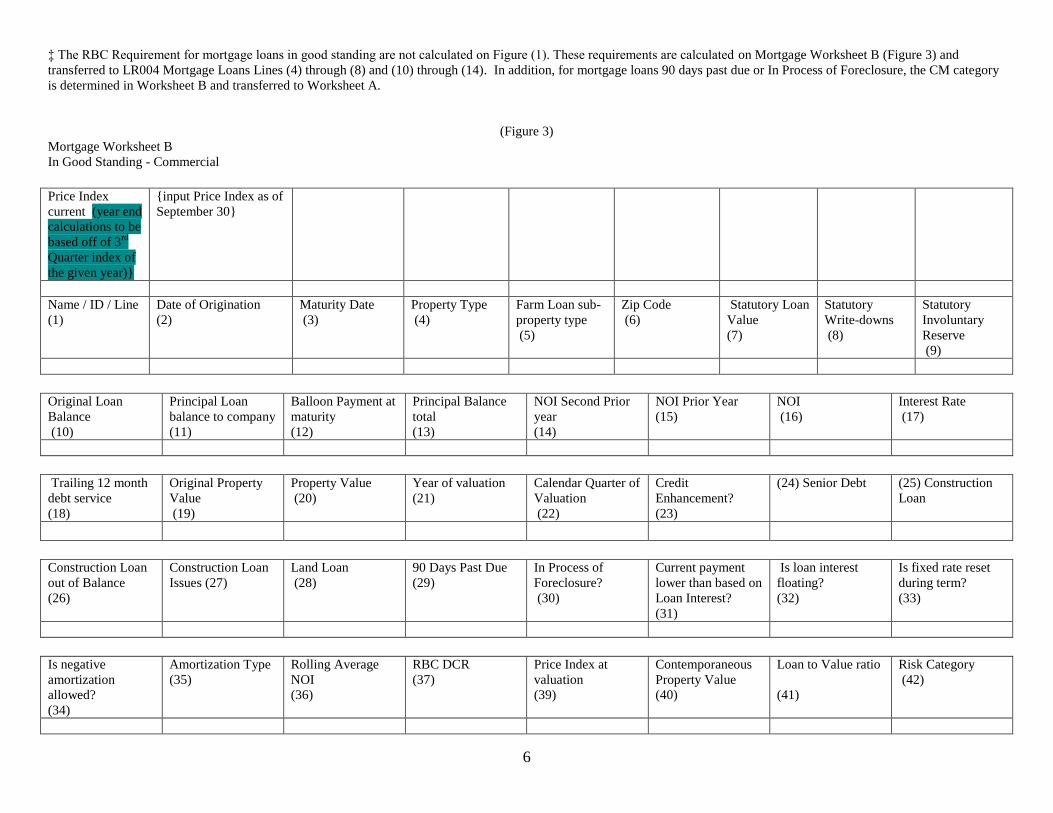
5
(14)
(15)
Total Mortgages
This worksheet is prepared on a loan-by-loan basis for each of the mortgage categories listed in (Figure 2) that are applicable. The Column (2), (3), (5) and (10) subtotals for each
category are carried over and entered in Columns (1), (2), (4) and (6) of the Mortgages (LR004) in the risk-based capital formula. Small mortgages aggregated into one line on
Schedule B can be treated as one mortgage on this worksheet. NOTE: This worksheet will be available in the risk-based capital filing software.
† See (Figure 2) for factors to use in the calculation. The In Good Standing Factor will be based on the CM category developed in Worksheet B and reported in Column 7a.
‡ The RBC Requirement column is calculated as the greater of Column (8) or Column (9), but not less than zero.
§ Involuntary reserves are reserves held as an offset to a particular asset that is clearly a troubled asset and are included on Page 3, Line 25 of the annual statement.
£ Column (4) is calculated as Column (2) less Column (3).
* Cumulative writedowns include the total amount of writedowns, amounts non-admitted and involuntary reserves that have been taken or established with respect to a particular
mortgage.
(Figure 2)
The mortgage factors are used in conjunction with the mortgage worksheets (Figures 1 and 3) to calculate the RBC Requirement for each individual mortgage. The factors are used
in Columns (6) and (7) of the mortgage worksheet and are dependent on which of the 10 mortgage categories below the mortgage falls into. The following factors are used for each
category of mortgages:
Mortgage Factors For Other Than In Good Standing
LR004
Line
Number
Category
Factor†
In Good
Standing
Factor
In Good Standing – Category CM1 N/A‡ 0.0090
In Good Standing – Category CM2 N/A‡ 0.0175
In Good Standing – Category CM3 N/A‡ 0.0300
In Good Standing – Category CM4 N/A‡ 0.0500
In Good Standing – Category CM5 N/A‡ 0.0750
90 Days Past Due
(16) Farm Mortgages 0.1800 ‡
(17) Residential Mortgages-Insured or Guaranteed 0.0027 0.0014
(18) Residential Mortgages-All Other 0.0140 0.0068
(19) Commercial Mortgages-Insured or Guaranteed 0.0027 0.0014
(20) Commercial Mortgages-All Other 0.1800 ‡
In Process of Foreclosure
(21) Farm Mortgages 0.2300 ‡
(22) Residential Mortgages-Insured or Guaranteed 0.0054 0.0014
(23) Residential Mortgages-All Other 0.0270 0.0068
(24) Commercial Mortgages-Insured or Guaranteed 0.0054 0.0014
(25) Commercial Mortgages-All Other 0.2300 ‡
† The category factor is a factor used for a particular category of mortgage loans that are not in good standing.
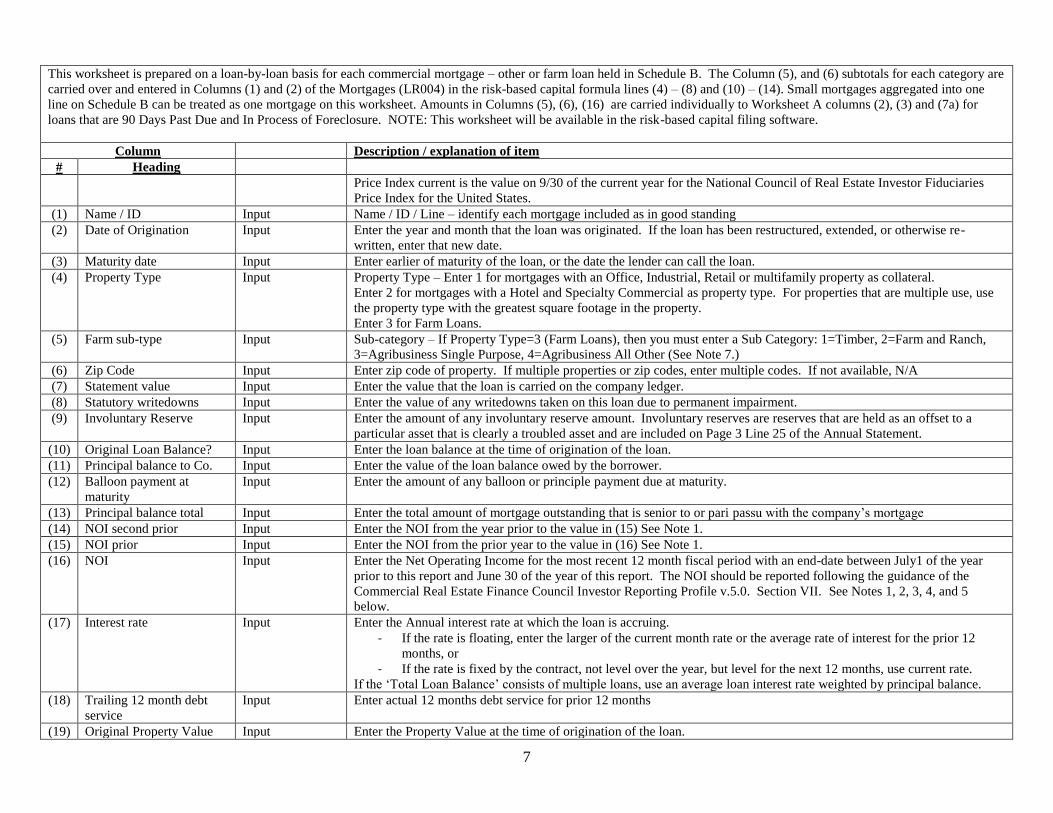
6
‡ The RBC Requirement for mortgage loans in good standing are not calculated on Figure (1). These requirements are calculated on Mortgage Worksheet B (Figure 3) and
transferred to LR004 Mortgage Loans Lines (4) through (8) and (10) through (14). In addition, for mortgage loans 90 days past due or In Process of Foreclosure, the CM category
is determined in Worksheet B and transferred to Worksheet A.
(Figure 3)
Mortgage Worksheet B In Good Standing - Commercial
Price Index
current (year end
calculations to be
based off of 3rd
Quarter index of
the given year)}
{input Price Index as of
September 30}
Name / ID / Line
(1)
Date of Origination
(2)
Maturity Date
(3)
Property Type
(4)
Farm Loan sub-
property type
(5)
Zip Code
(6)
Statutory Loan
Value
(7)
Statutory
Write-downs
(8)
Statutory
Involuntary
Reserve
(9)
Original Loan
Balance
(10)
Principal Loan
balance to company
(11)
Balloon Payment at
maturity
(12)
Principal Balance
total
(13)
NOI Second Prior
year
(14)
NOI Prior Year
(15)
NOI
(16)
Interest Rate
(17)
Trailing 12 month
debt service
(18)
Original Property
Value
(19)
Property Value
(20)
Year of valuation
(21)
Calendar Quarter of
Valuation
(22)
Credit
Enhancement?
(23)
(24) Senior Debt
(25) Construction
Loan
Construction Loan
out of Balance
(26)
Construction Loan
Issues (27)
Land Loan
(28)
90 Days Past Due
(29)
In Process of
Foreclosure?
(30)
Current payment
lower than based on
Loan Interest?
(31)
Is loan interest
floating?
(32)
Is fixed rate reset
during term?
(33)
Is negative
amortization
allowed?
(34)
Amortization Type
(35)
Rolling Average
NOI
(36)
RBC DCR
(37)
Price Index at
valuation
(39)
Contemporaneous
Property Value
(40)
Loan to Value ratio
(41)
Risk Category
(42)

7
This worksheet is prepared on a loan-by-loan basis for each commercial mortgage – other or farm loan held in Schedule B. The Column (5), and (6) subtotals for each category are
carried over and entered in Columns (1) and (2) of the Mortgages (LR004) in the risk-based capital formula lines (4) – (8) and (10) – (14). Small mortgages aggregated into one
line on Schedule B can be treated as one mortgage on this worksheet. Amounts in Columns (5), (6), (16) are carried individually to Worksheet A columns (2), (3) and (7a) for
loans that are 90 Days Past Due and In Process of Foreclosure. NOTE: This worksheet will be available in the risk-based capital filing software.
Column Description / explanation of item
# Heading
Price Index current is the value on 9/30 of the current year for the National Council of Real Estate Investor Fiduciaries
Price Index for the United States.
(1) Name / ID Input Name / ID / Line – identify each mortgage included as in good standing
(2) Date of Origination Input Enter the year and month that the loan was originated. If the loan has been restructured, extended, or otherwise re-
written, enter that new date.
(3) Maturity date Input Enter earlier of maturity of the loan, or the date the lender can call the loan.
(4) Property Type Input Property Type – Enter 1 for mortgages with an Office, Industrial, Retail or multifamily property as collateral.
Enter 2 for mortgages with a Hotel and Specialty Commercial as property type. For properties that are multiple use, use
the property type with the greatest square footage in the property.
Enter 3 for Farm Loans.
(5) Farm sub-type Input Sub-category – If Property Type=3 (Farm Loans), then you must enter a Sub Category: 1=Timber, 2=Farm and Ranch,
3=Agribusiness Single Purpose, 4=Agribusiness All Other (See Note 7.)
(6) Zip Code Input Enter zip code of property. If multiple properties or zip codes, enter multiple codes. If not available, N/A
(7) Statement value Input Enter the value that the loan is carried on the company ledger.
(8) Statutory writedowns Input Enter the value of any writedowns taken on this loan due to permanent impairment.
(9) Involuntary Reserve Input Enter the amount of any involuntary reserve amount. Involuntary reserves are reserves that are held as an offset to a
particular asset that is clearly a troubled asset and are included on Page 3 Line 25 of the Annual Statement.
(10) Original Loan Balance? Input Enter the loan balance at the time of origination of the loan.
(11) Principal balance to Co. Input Enter the value of the loan balance owed by the borrower.
(12) Balloon payment at
maturity
Input Enter the amount of any balloon or principle payment due at maturity.
(13) Principal balance total Input Enter the total amount of mortgage outstanding that is senior to or pari passu with the company’s mortgage
(14) NOI second prior Input Enter the NOI from the year prior to the value in (15) See Note 1.
(15) NOI prior Input Enter the NOI from the prior year to the value in (16) See Note 1.
(16) NOI Input Enter the Net Operating Income for the most recent 12 month fiscal period with an end-date between July1 of the year
prior to this report and June 30 of the year of this report. The NOI should be reported following the guidance of the
Commercial Real Estate Finance Council Investor Reporting Profile v.5.0. Section VII. See Notes 1, 2, 3, 4, and 5
below.
(17) Interest rate Input Enter the Annual interest rate at which the loan is accruing.
- If the rate is floating, enter the larger of the current month rate or the average rate of interest for the prior 12
months, or
- If the rate is fixed by the contract, not level over the year, but level for the next 12 months, use current rate.
If the ‘Total Loan Balance’ consists of multiple loans, use an average loan interest rate weighted by principal balance.
(18) Trailing 12 month debt
service
Input Enter actual 12 months debt service for prior 12 months
(19) Original Property Value Input Enter the Property Value at the time of origination of the loan.

8
(20) Property Value Input Property Value is the value of the Property at time of loan origination, or at time of revaluation due to impairment
underwriting, restructure, extension, or other re-writing.
(21) Year of valuation Input Year of the valuation date defining the value in (20).
(22) Quarter of valuation Input Calendar quarter of the valuation date defining the value in (20).
(23) Credit Enhancement Input Enter the full dollar amount of any credit enhancement. (see Note 4.)
(24) Senior Loan? Input Enter yes if the senior position, no if not. (see Note 6.)
(25) Construction Loan? Input Enter ‘Yes’ if this is a construction loan. (see Note 3.)
(26) Construction – not in
balance
Input Enter ‘Yes” if his is a construction loan that is not in balance. (see Note 3.)
(27) Construction – Issues Input Enter ‘Yes” if this is a construction loan with issues. (see Note 3.)
(28) Land Loan? Input Enter ‘Yes’ if this is a loan on non-income producing land. (see Note 5.)
(29) 90 days past due? Input Enter ‘Yes’ if payments are 90 days past due.
(30) In process of foreclosure? Input Enter ‘Yes’ if the loan is in process of foreclosure.
(31) Is current payment lower
than a payment based on
the Loan Interest?
Input Yes / No
(32) Is loan interest a floating
rate?
Input Yes / No
(33) If not floating, does loan
reset during term?
Input Yes / No - Some fixed rate loans define in the loan document a change to a new rate during the life of the loan, which
may be a pre=determined rate or may be the then current market rate. Generally any such changes are less frequent than
annual. .
(34) Is negative amortization
allowed?
Input Yes / No
(35) Amortization type? Input 1 = fully amortizing
2 = amortizing with balloon,
3 = full I/O
4 = partial I/O, then amortizing
(36) Rolling Average NOI Computation For 2012 – 100% of NOI
For 2014 – 65% NOI + 35% NOI Prior
For 2015 – 50% NOI + 30% NOI Prior + 20% NOI 2nd
Prior
For loans originated or valued within the current year use 100% NOI.
For loans originated 2012 or later and within 2 years, use 65% NOI and 35% NOI Prior
(37) RBC Debt Service Computation RBC Debt Service Amount is the amount of 12 monthly principal and interest payments required to amortize the Total
Loan Balance (13) using a Standardized Amortization period of 300 months and the Annual Loan Interest Rate (17).
(38) DCR Computation Debt Coverage Ratio is the ratio of the Net Operating Income (36) divided by the RBC Debt Service (37) rounded down
to 2 decimal places. See Note 3 below for special circumstances.
(39) NCREIF Index at
Valuation
Computation Price index is the value of the NCREIF Price Index on the last day of the calendar quarter that includes the date defined in
(21) and (22).
(40) Contemporaneous
Property Value
Computation Contemporaneous Value is the Property Value (20) times the ratio (rounded to 4 decimal places) of the Price Index
current to the Price Index at valuation (39).
(41) LTV Computation The Loan to Value ratio is the Total Loan Value (13) divided by the Contemporaneous Value (40) rounded to the nearest
percent.
(42) CM category Computation Commercial Mortgage Risk category is the risk category determined by applying the DCR (10) and the LTV (15) to the
criteria in Figure (4), Figure (5) or Figure (6). See Notes 2, 3, 4, 5, and 6 below for special circumstances.

9
Note 1: Net Operating Income (NOI): The majority of commercial mortgage loans require the borrower to provide the lender with at least annual financial statements. The NOI
would be determined at the RBC calculation date based on the most recent annual period from financial statements provided by the borrower and analyzed based on accepted
industry standards. The most recent annual period is determined as follows:
If the borrower reports on a calendar year basis, the statements for the calendar year ending December 31 of the year prior to the RBC calculation date will be used. For
example, if the RBC calculation date is 12/31/2012, the most recent annual period is the calendar year that ends 12/31/2011.
If the borrower reports on a fiscal year basis, the statements for the fiscal year that ends after June 30 of the prior calendar year and no later than June 30 of the year of the
RBC calculation date will be used. For example, if the RBC calculation date is 12/31/2012, the most recent annual period is the fiscal year that ends after 6/30/2011 and
no later than 6/30/2012.
The foregoing time periods are used to provide sufficient time for the borrower to prepare the financial statements and provide them to the lender, and for the lender to
calculate the NOI.
The accepted industry standards we are recommending for determining NOI were developed by the Commercial Mortgage Standards Association now known as CRE
Financial Council (CREFC). We propose that NOI be developed using the standards provided by the CREFC Methodology for Analyzing and Reporting Property Income
Statements (Appendix A). These standards are part of the CREFC Investor Reporting Package (CREFC IRP Section VII.) developed to support consistent reporting for
commercial real estate loans owned by third party investors. This guidance would be a standardized basis for determining NOI for RBC.
The NOI will be adjusted to use a 3 year rolling average for the DSC calculation. For 2013, a single year of NOI will be used. For 2014, 2 years will be used, weighted 65%
most recent year and 35% prior year. Thereafter, 3 years will be used weighted 50% most recent year, 30% prior year, and 20% 2nd
prior year. This will apply when there is a
history of NOI values. For new originations, including refinancing, the above schedule would apply by duration from origination. For the special circumstances listed below,
the specific instructions below will produce the NOI to be used, without further averaging.
Note 2: Unavailable Operating Statements
There are a variety of situations where the most recent annual period’s operating statement may not be available to assist in determining NOI. These situations will occur in distinct
categories and each category requires special consideration. The categories are:
1. Loans on owner occupied properties
a. For properties where the owner is the sole or primary tenant (50% or more of the rentable space), property level operating statements may not be available or
meaningful. If the property is occupied and the loan, taxes and insurance are current, it will be acceptable to derive income and a reasonable estimate of
expenses from the most recent appraisal or equivalent and additional known actual expenses (e.g., real estate taxes and insurance).
b. For properties where the owner is a minority tenant (49% of less of the rentable space), the owner-occupied space should be underwritten at the average rent per
square foot of the arm’s length tenant leases. This income estimate should be added to the other tenant leases and combined with a reasonable estimate of
expenses based on the most recent appraisal or equivalent and additional known actual expenses (e.g., real estate taxes and insurance).
2. Borrower does not provide the annual operating statement
a. Borrower refuses to provide the annual operating statements
i. If the leases are in place and evidenced by estoppels and inspections, NOI would be derived from normalized underwriting in accordance with the
CREFC Methodology for Analyzing and Reporting Property Income Statements.
ii. If there is evidence from inspection that the property is occupied, but there is no evidence of in place leases (e.g., lease documents or estoppels), NOI
would be set equal to the lesser of calculated debt service (DSC=1.0) or the NOI from the normalized underwriting.
iii. If there is no evidence from inspection that the property is occupied and no evidence of in place leases (e.g., lease documents or estoppels), assume NOI
= $0.

10
b. If the borrower does not have access to a complete previous year operating statement, determine NOI based on the CREFC guidelines for analyzing a partial year
income statement.
Note 3: Construction loans
Construction loans would be categorized as follows, based on a determination by the loan servicer whether the loan is in balance and whether construction issues exist:
a. In balance, no construction issues: DSC = 1.0, LTV determined as usual
b. Not in Balance, no construction issues: CM4
c. Construction issues: CM5
A loan is “in balance” if the committed amount of the construction loan plus any lender held reserves and unfunded borrower equity is sufficient to cover the remaining
costs of the development project, including debt service not anticipated to be paid from property operations.
A “construction issue” is a problem that may reasonably jeopardize the completion of the project. Examples of construction issues include the abandonment of
construction and construction defects that are not being addressed.
Note 4: Credit enhancements: Where the loan payments are secured by a letter of credit from an investment grade financial institution or an escrow account held at an
investment grade financial institution, NOI less than the debt service may be increased by these amounts until it is equal to but not exceeding the debt service. These situations
are typically short term in nature, and are intended to bridge the lease-up following renovation or loss of a major tenant.
Note 5: Non-income-producing land: NOI = $0
Note 6: Non-senior financing
a. The company should first calculate DSC and LTV for non-senior financing using the standardized debt service and aggregate LTV of all financing pari passu and
senior to the position held by the company.
b. The non-senior piece should than be assigned to the next riskier RBC category. For example, if the DSC and LTV metrics determined in (a) indicate a category
of CM2, the non-senior piece would be assigned to category CM3. However, it would not be required to assign a riskier category than CM5 if the loan is not at
least 90-days delinquent or in foreclosure.
Note 7: Definitions of each type of Farm Mortgage:
Timber: A loan is classified as a timber loan if more than 50% of the collateral market value (land and timber) of the security is attributable to land supporting a timber
crop that is or will be of commercial value.
Farm & Ranch: Farm and ranch land utilized in the production of agricultural commodities of all kinds, including grains, cotton, sugar, nuts, fruits, vegetables, forage
crops and livestock of all kinds, including, beef, swine, poultry, fowl and fish. Loans included in this category are those in which agricultural land accounts for more than
50% of total collateral market value.
Agribusiness Single Purpose: Specialized collateral utilized in the production, further processing, adding value or manufacturing of an agricultural commodity or forest
product. In order for a loan to be classified as such, the market value of the single-purpose (special use) collateral would account for more than 50% of total collateral
market value.
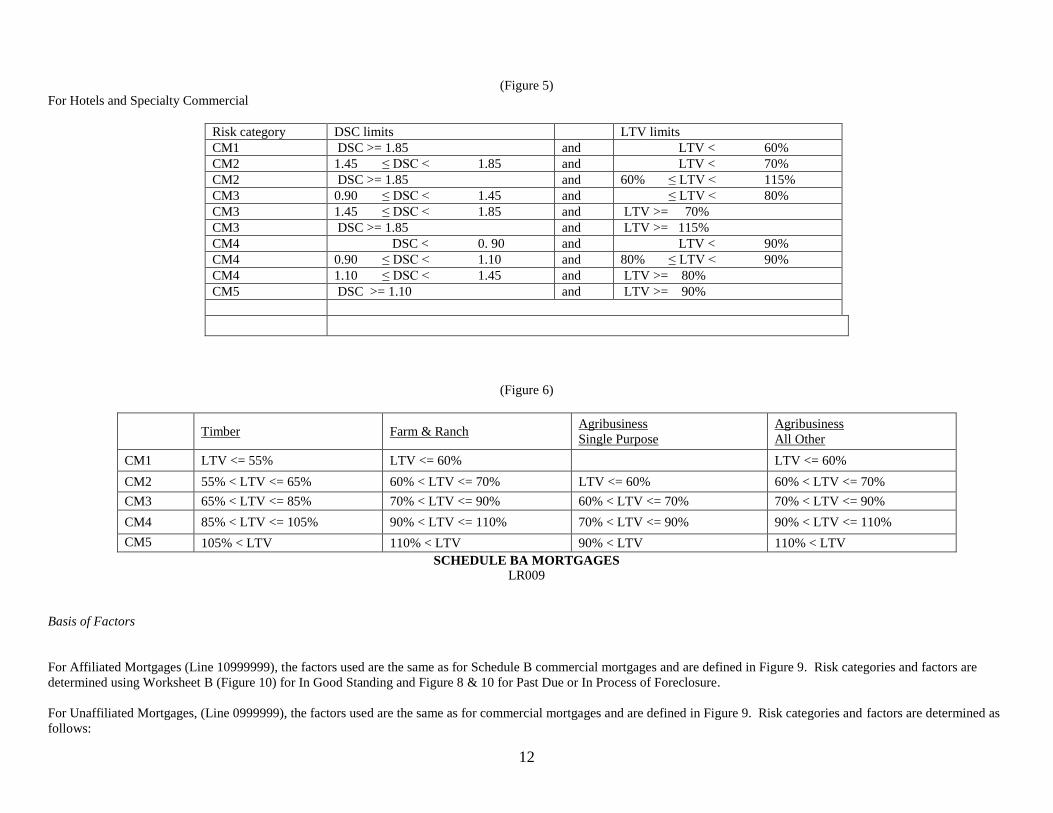
11
This collateral is generally not multi-functional and can only be used for a specific production, manufacturing and/or processing function within a specific sub-sector of
the food or agribusiness industry and whereby such assets are not strategically important in nature to the overall industry capacity. These assets can be shut down or
replicated easily in other locations, or existing plants can be expanded to absorb shuttered capacity. The assets are not generally limited in nature by environmental or
operational permits and/or regulatory requirements. An example would be a poultry processing plant located in the Southeast of the United States where there is excess
capacity inherent to the industry and production capacity is easily replaceable.
Other loans included in this category are those collateralized by single purpose (special use) confinement livestock production facilities in which the special use facilities
account for more than 50% of total collateral market value.
Agribusiness All Other: Multiple-use collateral utilized in the production, further processing, adding value or manufacturing of an agricultural commodity or forest
product. In order for a loan to be classified as such, the market value of any single use portion may not be greater than 50% of total collateral market value.
This collateral is multi-functional in nature, adaptable to other manufacturing, processing, or servicing food or agribusiness industries or sub-industries. Assets could also
be very strategic in nature and not easily replaceable either due to cost, location, environmental permitting and/or government regulations. These assets may be single
purpose in nature, but so vital to the industry capacity needs that they will be generally purchased by another like processing company or strategic or financial buyer. An
example of these types of assets are strategically located and highly automated cold storage facilities whereby they can be used for dry storage, distribution centers or
converted into warehouse or other type uses. Another example may be a cheese processing plant that is strategically located within the heart of the dairy industry, limited
permits, environmental restrictions that would limit added capacity, or high barriers to entry to build a like facility within the industry. For example, one of the largest
cheese plants in the industry is located in California and it is not easily replicated within the cheese processing industry due to its location, capacity, costs, access to fluid
milk supply and related feed and water, as well as highly regulated environmental and government restrictions.
Other loans included in this category are those in which more than 50% of the collateral market value is accounted for by chattel assets or other assets related to the
business and financial operations of agribusinesses, including inventories, accounts, trade receivables, cash and brokerage accounts, machinery, equipment, livestock and
other assets utilized for or generated by agribusiness operations.
(Figure 4)
For Office, Industrial, Retail and Multi-family
Risk category DSC limits LTV limits
CM1 DSC >= 1.50 and LTV < 85%
CM2 DSC < 1.50 and LTV < 55%
CM2 0.95 ≤ DSC < 1.50 and 55% ≤ LTV < 75%
CM2 1.15 ≤ DSC < 1.50 and 75% ≤ LTV < 100%
CM2 DSC >= 1.50 and 85% ≤ LTV < 100%
CM2 DSC >= 1.75 and LTV >= 100%
CM3 DSC < 0.95 and 55% ≤ LTV < 85%
CM3 0.95 ≤ DSC < 1.15 and 75% ≤ LTV < 100%
CM3 1.15 ≤ DSC < 1.75 and LTV >= 100%
CM4 DSC < 0.95 and 85% ≤ LTV < 105%
CM4 0.95 ≤ DSC < 1.15 and LTV >= 100%
CM5 DSC < 0.95 and LTV >= 100%

12
(Figure 5)
For Hotels and Specialty Commercial
Risk category DSC limits LTV limits
CM1 DSC >= 1.85 and LTV < 60%
CM2 1.45 ≤ DSC < 1.85 and LTV < 70%
CM2 DSC >= 1.85 and 60% ≤ LTV < 115%
CM3 0.90 ≤ DSC < 1.45 and ≤ LTV < 80%
CM3 1.45 ≤ DSC < 1.85 and LTV >= 70%
CM3 DSC >= 1.85 and LTV >= 115%
CM4 DSC < 0. 90 and LTV < 90%
CM4 0.90 ≤ DSC < 1.10 and 80% ≤ LTV < 90%
CM4 1.10 ≤ DSC < 1.45 and LTV >= 80%
CM5 DSC >= 1.10 and LTV >= 90%
(Figure 6)
Timber Farm & Ranch
Agribusiness
Single Purpose
Agribusiness
All Other
CM1 LTV <= 55% LTV <= 60% LTV <= 60%
CM2 55% < LTV <= 65% 60% < LTV <= 70% LTV <= 60% 60% < LTV <= 70%
CM3 65% < LTV <= 85% 70% < LTV <= 90% 60% < LTV <= 70% 70% < LTV <= 90%
CM4 85% < LTV <= 105% 90% < LTV <= 110% 70% < LTV <= 90% 90% < LTV <= 110%
CM5 105% < LTV 110% < LTV 90% < LTV 110% < LTV
SCHEDULE BA MORTGAGES
LR009
Basis of Factors
For Affiliated Mortgages (Line 10999999), the factors used are the same as for Schedule B commercial mortgages and are defined in Figure 9. Risk categories and factors are
determined using Worksheet B (Figure 10) for In Good Standing and Figure 8 & 10 for Past Due or In Process of Foreclosure.
For Unaffiliated Mortgages, (Line 0999999), the factors used are the same as for commercial mortgages and are defined in Figure 9. Risk categories and factors are determined as
follows:

13
1) For Investments that contain covenants whereby factors of maximum LTV and minimum DSC, or equivalent thresholds must be complied with and it can be
determined that the Investments are in compliance, these investments would use the process for directly held mortgages using the maximum LTV and minimum DSC
using Worksheet B (Figure 10) and transferred to LR009 lines (1) for mortgages with covenants that are in compliance.
2) Investments that are defeased with government securities will be assigned to CM1.
3) Other investments comprised primarily of senior debt will be assigned to CM2.
4) All other investments in this category will be assigned CM3. This would include assets such as a mortgage fund that invests in mezzanine or sub debt, or investments
that cannot be determined to be in compliance with the covenants.
Specific Instructions for Application of the Formula
Column (1)
Line (17) should equal Schedule BA Part 1, Column 14, Line 0999999 plus Line 1099999.
Column (2)
Companies are permitted to reduce the book/adjusted carrying value of mortgage loans reported in Schedule BA by any involuntary reserves. Involuntary reserves are equivalent to
valuation allowances specified in the codification of statutory accounting principles. They are non-AVR reserves reported on Annual Statement Page 3, Line 25. These reserves are
held as an offset for a particular troubled Schedule BA mortgage loan that would be required to be written down if the impairment was permanent.
Column (3)
Column (3) is calculated as the net of Column (1) less Column (2).
Column (4)
For Lines (4) through (7), summary amounts of the individual mortgage calculations are entered in this column for each class of mortgage investments. Refer to the Schedule BA
mortgage calculation worksheet (Figure 4).
Column (5)
See Figure 9 for computation of appropriate factors.
Column (6)
For Lines (1) through (3) the RBC subtotal is multiplied by the factor to calculate Column (6).
For Lines (4) through (7), summary amounts are entered for Column (6) based on calculations done on an individual mortgage basis. Refer to the Schedule BA mortgage
calculation worksheet (Figure 10).
(Figure 8)
Schedule BA Mortgage Worksheet A
Affiliated Other Than in Good Standing (1) (2) (3) (4) (5) (6) (7) (7a) (8) (9) (10)
Name / ID
Book/Adjusted
Carrying
Value
Involuntary
Reserve
Adjustment§
RBC
Subtotal£
Cumulative
Writedowns*
Category
Factor
In Good
Standing
Factor
In good
standing
category
Col (6) X
[Col (4)+(5)]
- Col (5)
Col (4) X
Col (7)
RBC
Requirement‡
(1) All Mortgages Without
Cumulative Writedowns
XXX † †
†

14
All Mortgages With
Cumulative
Writedowns:
(2)
(3)
(4)
(5)
(6)
(7)
(8)
(9)
(10)
(11)
(12)
(13)
(14)
(15)
Total Mortgages
This worksheet is prepared on a loan-by-loan basis for each of the mortgage categories listed in (Figure 9) that are applicable. The Column (2), (3), (5) and (10) subtotals for each
category are carried over and entered in Columns (1), (2), (4) and (6) of the Mortgages (LR009) in the risk-based capital formula. Small mortgages aggregated into one line on
Schedule BA can be treated as one mortgage on this worksheet. NOTE: This worksheet will be available in the risk-based capital filing software.
† See (Figure 9) for factors to use in the calculation. The In Good Standing Factor will be based on the CM category developed in Worksheet B and reported in Column 7a.
‡ The RBC Requirement column is calculated as the greater of Column (8) or Column (9), but not less than zero.
§ Involuntary reserves are reserves held as an offset to a particular asset that is clearly a troubled asset and are included on Page 3, Line 25 of the annual statement.
£ Column (4) is calculated as Column (2) less Column (3).
* Cumulative writedowns include the total amount of writedowns, amounts non-admitted and involuntary reserves that have been taken or established with respect to a particular
mortgage.
(Figure 9)
The mortgage factors are used in conjunction with the mortgage worksheets (Figures 8 and 10) to calculate the RBC Requirement for each individual mortgage in an affiliated
structure. The factors are used in Columns (6) and (7) of the mortgage worksheet and are dependent on which of the 10 mortgage categories below the mortgage falls into.
Residential Mortgages and Commercial Mortgages Insured or Guaranteed are classified as Category CM1. The following factors are used for each category of mortgages:
Schedule BA Mortgage Factors
LR009
Line
Number
Category
Factor†
In Good
Standing
Factor
(2) Unaffiliated – defeased with government securities N/A‡ 0.0090
(3) Unaffiliated investments comprised primarily of
Senior Debt
N/A‡ 0.0175

15
(4) Unaffiliated – all other unaffiliated mortgages N/A‡ 0.0300
Various In Good Standing – Category CM1 N/A‡ 0.0090
Various In Good Standing – Category CM2 N/A‡ 0.0175
Various In Good Standing – Category CM3 N/A‡ 0.0300
Various In Good Standing – Category CM4 N/A‡ 0.0500
Various In Good Standing – Category CM5 N/A‡ 0.0750
90 Days Overdue, not in process of foreclosure
(11) Unaffiliated 0.1800 ‡
(12) Affiliated 0.1800 ‡
In Process of Foreclosure
(14) Unaffiliated 0.2300 ‡
(15) Affiliated 0.2300 ‡
† The category factor is a factor used for a particular category of mortgage loans that are not in good standing.
‡ The RBC Requirement for mortgage loans in good standing are not calculated on Figure (8). These requirements are calculated on Schedule BA Mortgage Worksheet B and
transferred to LR009 Schedule BA Mortgage Loans Line (2) and (6) – (10). .
(Figure 10)
Mortgage Worksheet B In Good Standing - Commercial
Price Index
current (year end
calculations to be
based off of 3rd
Quarter index of
the given year)}
{input Price Index as of
September 30}
Name / ID / Line
(1)
Date of Origination
(2)
Maturity Date
(3)
Property Type
(4)
Farm Loan sub-
property type
(5)
Zip Code
(6)
Statutory Loan
Value
(7)
Statutory
Write-downs
(8)
Statutory
Involuntary
Reserve
(9)

16
Original Loan
Balance
(10)
Principal Loan
balance to company
(11)
Balloon Payment at
maturity
(12)
Principal Balance
total
(13)
NOI Second Prior
year
(14)
NOI Prior Year
(15)
NOI
(16)
Interest Rate
(17)
Trailing 12 month
debt service
(18)
Original Property
Value
(19)
Property Value
(20)
Year of valuation
(21)
Calendar Quarter of
Valuation
(22)
Credit
Enhancement?
(23)
(24) Senior Debt
(25) Construction
Loan
Construction Loan
out of Balance
(26)
Construction Loan
Issues (27)
Land Loan
(28)
90 Days Past Due
(29)
In Process of
Foreclosure?
(30)
Current payment
lower than based on
Loan Interest?
(31)
Is loan interest
floating?
(32)
Is fixed rate reset
during term?
(33)
Is negative
amortization
allowed?
(34)
Amortization Type
(35)
Schedule BA
mortgage?
(36)
Affiliated Mortgage
(37)
Covenant – Max
LTV
(39)
Covenant – Min
DCR
(40)
Loan Covenants in
compliance?
(41)
Defeased with
government
securities?
(42)
Primarily Senior
positions?
(43)
Rolling Average
NOI
(44)
RBC DCR
(45)
Price Index at
valuation
(46)
Contemporaneous
Property Value
(47)
Loan to Value ratio
(48)
Risk Category
(49)
This worksheet is prepared on a loan-by-loan basis for each commercial mortgage – other or farm loan held in Schedule B. The Column (5), and (6) subtotals for each category are
carried over and entered in Columns (1) and (2) of the Mortgages (LR004) in the risk-based capital formula lines (4) – (8) and (10) – (14). Small mortgages aggregated into one
line on Schedule B can be treated as one mortgage on this worksheet. Amounts in Columns (5), (6), (16) are carried individually to Worksheet A columns (2), (3) and (7a) for
loans that are 90 Days Past Due and In Process of Foreclosure. NOTE: This worksheet will be available in the risk-based capital filing software.
Column Description / explanation of item
# Heading
Price Index current is the value on 9/30 of the current year for the National Council of Real Estate Investor Fiduciaries
Price Index for the United States.
(1) Name / ID Input Name / ID / Line – identify each mortgage included as in good standing
(2) Date of Origination Input Enter the year and month that the loan was originated. If the loan has been restructured, extended, or otherwise re-
written, enter that new date.
(3) Maturity date Input Enter earlier of maturity of the loan, or the date the lender can call the loan.
(4) Property Type Input Property Type – Enter 1 for mortgages with an Office, Industrial, Retail or multifamily property as collateral.
Enter 2 for mortgages with a Hotel and Specialty Commercial as property type. For properties that are multiple use, use
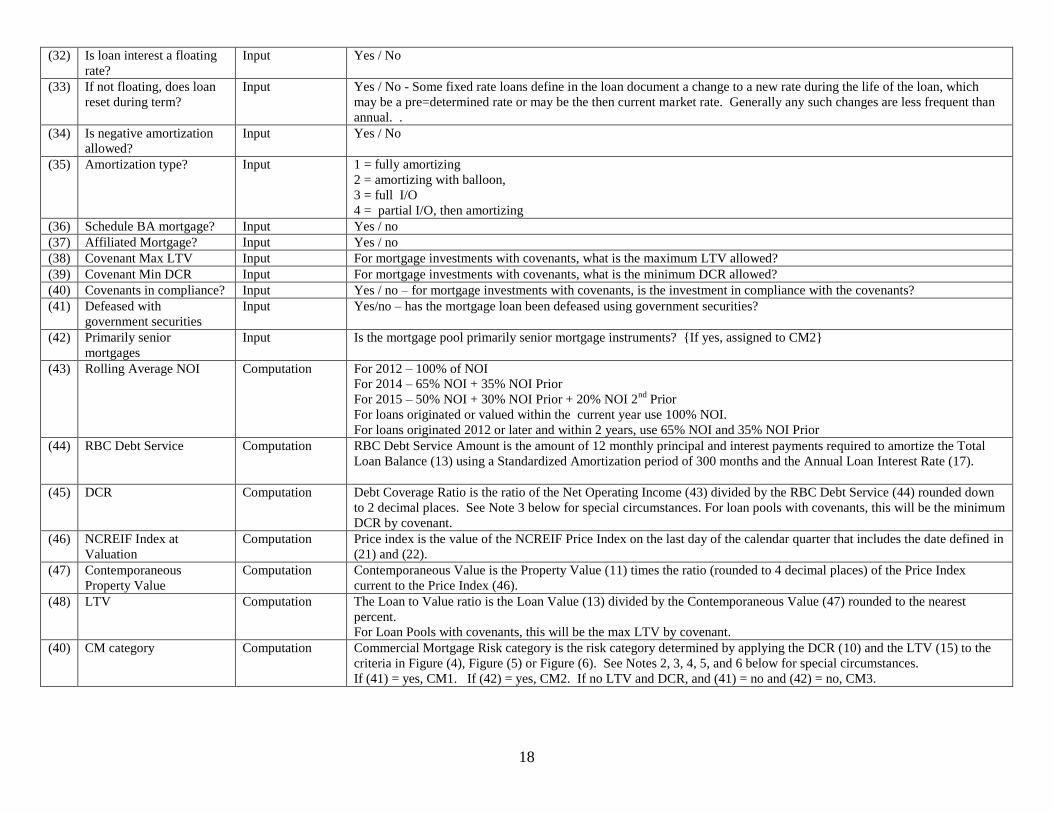
17
the property type with the greatest square footage in the property.
Enter 3 for Farm Loans.
(5) Farm sub-type Input Sub-category – If Property Type=3 (Farm Loans), then you must enter a Sub Category: 1=Timber, 2=Farm and Ranch,
3=Agribusiness Single Purpose, 4=Agribusiness All Other (See Note 7.)
(6) Zip Code Input Enter zip code of property. If multiple properties or zip codes, enter multiple codes. If not available, N/A
(7) Statement value Input Enter the value that the loan is carried on the company ledger.
(8) Statutory writedowns Input Enter the value of any writedowns taken on this loan due to permanent impairment.
(9) Involuntary Reserve Input Enter the amount of any involuntary reserve amount. Involuntary reserves are reserves that are held as an offset to a
particular asset that is clearly a troubled asset and are included on Page 3 Line 25 of the Annual Statement.
(10) Original Loan Balance? Input Enter the loan balance at the time of origination of the loan.
(11) Principal balance to Co. Input Enter the value of the loan balance owed by the borrower.
(12) Balloon payment at
maturity
Input Enter the amount of any balloon or principle payment due at maturity.
(13) Principal balance total Input Enter the total amount of mortgage outstanding that is senior to or pari passu with the company’s mortgage
(14) NOI second prior Input Enter the NOI from the year prior to the value in (15) See Note 1.
(15) NOI prior Input Enter the NOI from the prior year to the value in (16) See Note 1.
(16) NOI Input Enter the Net Operating Income for the most recent 12 month fiscal period with an end-date between July1 of the year
prior to this report and June 30 of the year of this report. The NOI should be reported following the guidance of the
Commercial Real Estate Finance Council Investor Reporting Profile v.5.0. Section VII. See Notes 1, 2, 3, 4, and 5
below.
(17) Interest rate Input Enter the Annual interest rate at which the loan is accruing.
- If the rate is floating, enter the larger of the current month rate or the average rate of interest for the prior 12
months, or
- If the rate is fixed by the contract, not level over the year, but level for the next 12 months, use current rate.
If the ‘Total Loan Balance’ consists of multiple loans, use an average loan interest rate weighted by principal balance.
(18) Trailing 12 month debt
service
Input Enter actual 12 months debt service for prior 12 months
(19) Original Loan Balance? Input Enter the loan balance at the time of origination of the loan.
(20) Property Value Input Property Value is the value of the Property at time of loan origination, or at time of revaluation due to impairment
underwriting, restructure, extension, or other re-writing.
(21) Year of valuation Input Year of the valuation date defining the value in (20).
(22) Quarter of valuation Input Calendar quarter of the valuation date defining the value in (20).
(23) Credit Enhancement Input Enter the full dollar amount of any credit enhancement. (see Note 4.)
(24) Senior Loan? Input Enter yes if the senior position, no if not. (see Note 6.)
(25) Construction Loan? Input Enter ‘Yes’ if this is a construction loan. (see Note 3.)
(26) Construction – not in
balance
Input Enter ‘Yes” if his is a construction loan that is not in balance. (see Note 3.)
(27) Construction – Issues Input Enter ‘Yes” if this is a construction loan with issues. (see Note 3.)
(28) Land Loan? Input Enter ‘Yes’ if this is a loan on non-income producing land. (see Note 5.)
(29) 90 days past due? Input Enter ‘Yes’ if payments are 90 days past due.
(30) In process of foreclosure? Input Enter ‘Yes’ if the loan is in process of foreclosure.
(31) Is current payment lower
than a payment based on
the Loan Interest?
Input Yes / No
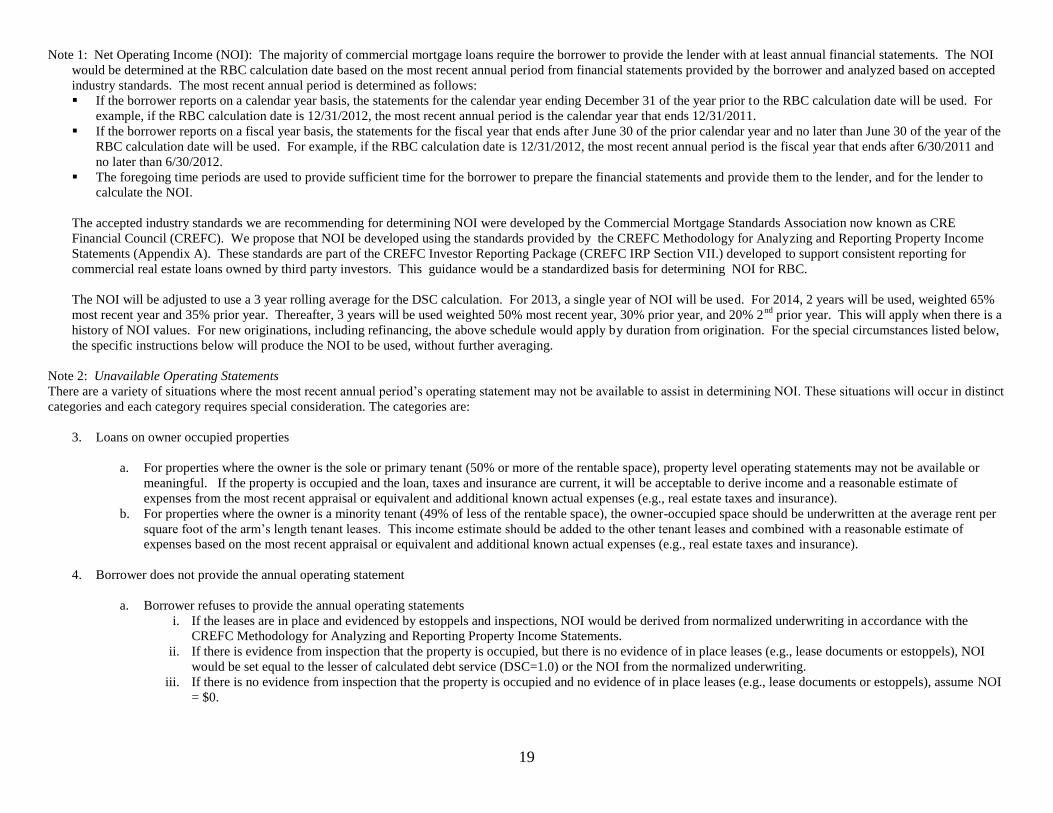
18
(32) Is loan interest a floating
rate?
Input Yes / No
(33) If not floating, does loan
reset during term?
Input Yes / No - Some fixed rate loans define in the loan document a change to a new rate during the life of the loan, which
may be a pre=determined rate or may be the then current market rate. Generally any such changes are less frequent than
annual. .
(34) Is negative amortization
allowed?
Input Yes / No
(35) Amortization type? Input 1 = fully amortizing
2 = amortizing with balloon,
3 = full I/O
4 = partial I/O, then amortizing
(36) Schedule BA mortgage? Input Yes / no
(37) Affiliated Mortgage? Input Yes / no
(38) Covenant Max LTV Input For mortgage investments with covenants, what is the maximum LTV allowed?
(39) Covenant Min DCR Input For mortgage investments with covenants, what is the minimum DCR allowed?
(40) Covenants in compliance? Input Yes / no – for mortgage investments with covenants, is the investment in compliance with the covenants?
(41) Defeased with
government securities
Input Yes/no – has the mortgage loan been defeased using government securities?
(42) Primarily senior
mortgages
Input Is the mortgage pool primarily senior mortgage instruments? {If yes, assigned to CM2}
(43) Rolling Average NOI Computation For 2012 – 100% of NOI
For 2014 – 65% NOI + 35% NOI Prior
For 2015 – 50% NOI + 30% NOI Prior + 20% NOI 2nd
Prior
For loans originated or valued within the current year use 100% NOI.
For loans originated 2012 or later and within 2 years, use 65% NOI and 35% NOI Prior
(44) RBC Debt Service Computation RBC Debt Service Amount is the amount of 12 monthly principal and interest payments required to amortize the Total
Loan Balance (13) using a Standardized Amortization period of 300 months and the Annual Loan Interest Rate (17).
(45) DCR Computation Debt Coverage Ratio is the ratio of the Net Operating Income (43) divided by the RBC Debt Service (44) rounded down
to 2 decimal places. See Note 3 below for special circumstances. For loan pools with covenants, this will be the minimum
DCR by covenant.
(46) NCREIF Index at
Valuation
Computation Price index is the value of the NCREIF Price Index on the last day of the calendar quarter that includes the date defined in
(21) and (22).
(47) Contemporaneous
Property Value
Computation Contemporaneous Value is the Property Value (11) times the ratio (rounded to 4 decimal places) of the Price Index
current to the Price Index (46).
(48) LTV Computation The Loan to Value ratio is the Loan Value (13) divided by the Contemporaneous Value (47) rounded to the nearest
percent.
For Loan Pools with covenants, this will be the max LTV by covenant.
(40) CM category Computation Commercial Mortgage Risk category is the risk category determined by applying the DCR (10) and the LTV (15) to the
criteria in Figure (4), Figure (5) or Figure (6). See Notes 2, 3, 4, 5, and 6 below for special circumstances.
If (41) = yes, CM1. If (42) = yes, CM2. If no LTV and DCR, and (41) = no and (42) = no, CM3.

19
Note 1: Net Operating Income (NOI): The majority of commercial mortgage loans require the borrower to provide the lender with at least annual financial statements. The NOI
would be determined at the RBC calculation date based on the most recent annual period from financial statements provided by the borrower and analyzed based on accepted
industry standards. The most recent annual period is determined as follows:
If the borrower reports on a calendar year basis, the statements for the calendar year ending December 31 of the year prior to the RBC calculation date will be used. For
example, if the RBC calculation date is 12/31/2012, the most recent annual period is the calendar year that ends 12/31/2011.
If the borrower reports on a fiscal year basis, the statements for the fiscal year that ends after June 30 of the prior calendar year and no later than June 30 of the year of the
RBC calculation date will be used. For example, if the RBC calculation date is 12/31/2012, the most recent annual period is the fiscal year that ends after 6/30/2011 and
no later than 6/30/2012.
The foregoing time periods are used to provide sufficient time for the borrower to prepare the financial statements and provide them to the lender, and for the lender to
calculate the NOI.
The accepted industry standards we are recommending for determining NOI were developed by the Commercial Mortgage Standards Association now known as CRE
Financial Council (CREFC). We propose that NOI be developed using the standards provided by the CREFC Methodology for Analyzing and Reporting Property Income
Statements (Appendix A). These standards are part of the CREFC Investor Reporting Package (CREFC IRP Section VII.) developed to support consistent reporting for
commercial real estate loans owned by third party investors. This guidance would be a standardized basis for determining NOI for RBC.
The NOI will be adjusted to use a 3 year rolling average for the DSC calculation. For 2013, a single year of NOI will be used. For 2014, 2 years will be used, weighted 65%
most recent year and 35% prior year. Thereafter, 3 years will be used weighted 50% most recent year, 30% prior year, and 20% 2nd
prior year. This will apply when there is a
history of NOI values. For new originations, including refinancing, the above schedule would apply by duration from origination. For the special circumstances listed below,
the specific instructions below will produce the NOI to be used, without further averaging.
Note 2: Unavailable Operating Statements
There are a variety of situations where the most recent annual period’s operating statement may not be available to assist in determining NOI. These situations will occur in distinct
categories and each category requires special consideration. The categories are:
3. Loans on owner occupied properties
a. For properties where the owner is the sole or primary tenant (50% or more of the rentable space), property level operating statements may not be available or
meaningful. If the property is occupied and the loan, taxes and insurance are current, it will be acceptable to derive income and a reasonable estimate of
expenses from the most recent appraisal or equivalent and additional known actual expenses (e.g., real estate taxes and insurance).
b. For properties where the owner is a minority tenant (49% of less of the rentable space), the owner-occupied space should be underwritten at the average rent per
square foot of the arm’s length tenant leases. This income estimate should be added to the other tenant leases and combined with a reasonable estimate of
expenses based on the most recent appraisal or equivalent and additional known actual expenses (e.g., real estate taxes and insurance).
4. Borrower does not provide the annual operating statement
a. Borrower refuses to provide the annual operating statements
i. If the leases are in place and evidenced by estoppels and inspections, NOI would be derived from normalized underwriting in accordance with the
CREFC Methodology for Analyzing and Reporting Property Income Statements.
ii. If there is evidence from inspection that the property is occupied, but there is no evidence of in place leases (e.g., lease documents or estoppels), NOI
would be set equal to the lesser of calculated debt service (DSC=1.0) or the NOI from the normalized underwriting.
iii. If there is no evidence from inspection that the property is occupied and no evidence of in place leases (e.g., lease documents or estoppels), assume NOI
= $0.
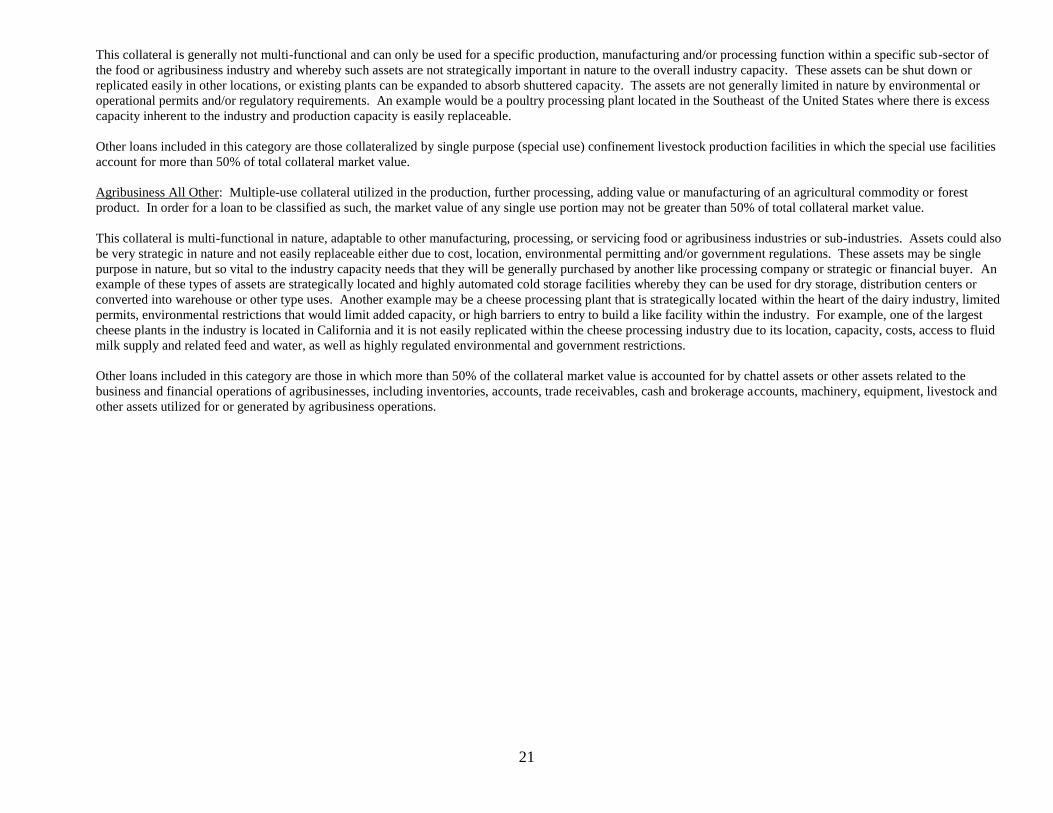
20
b. If the borrower does not have access to a complete previous year operating statement, determine NOI based on the CREFC guidelines for analyzing a partial year
income statement.
Note 3: Construction loans
Construction loans would be categorized as follows, based on a determination by the loan servicer whether the loan is in balance and whether construction issues exist:
d. In balance, no construction issues: DSC = 1.0, LTV determined as usual
e. Not in Balance, no construction issues: CM4
f. Construction issues: CM5
A loan is “in balance” if the committed amount of the construction loan plus any lender held reserves and unfunded borrower equity is sufficient to cover the remaining
costs of the development project, including debt service not anticipated to be paid from property operations.
A “construction issue” is a problem that may reasonably jeopardize the completion of the project. Examples of construction issues include the abandonment of
construction and construction defects that are not being addressed.
Note 4: Credit enhancements: Where the loan payments are secured by a letter of credit from an investment grade financial institution or an escrow account held at an
investment grade financial institution, NOI less than the debt service may be increased by these amounts until it is equal to but not exceeding the debt service. These situations
are typically short term in nature, and are intended to bridge the lease-up following renovation or loss of a major tenant.
Note 5: Non-income-producing land: NOI = $0
Note 6: Non-senior financing
c. The company should first calculate DSC and LTV for non-senior financing using the standardized debt service and aggregate LTV of all financing pari passu and
senior to the position held by the company.
d. The non-senior piece should than be assigned to the next riskier RBC category. For example, if the DSC and LTV metrics determined in (a) indicate a category
of CM2, the non-senior piece would be assigned to category CM3. However, it would not be required to assign a riskier category than CM5 if the loan is not at
least 90-days delinquent or in foreclosure.
Note 7: Definitions of each type of Farm Mortgage:
Timber: A loan is classified as a timber loan if more than 50% of the collateral market value (land and timber) of the security is attributable to land supporting a timber
crop that is or will be of commercial value.
Farm & Ranch: Farm and ranch land utilized in the production of agricultural commodities of all kinds, including grains, cotton, sugar, nuts, fruits, vegetables, forage
crops and livestock of all kinds, including, beef, swine, poultry, fowl and fish. Loans included in this category are those in which agricultural land accounts for more than
50% of total collateral market value.
Agribusiness Single Purpose: Specialized collateral utilized in the production, further processing, adding value or manufacturing of an agricultural commodity or forest
product. In order for a loan to be classified as such, the market value of the single-purpose (special use) collateral would account for more than 50% of total collateral
market value.

21
This collateral is generally not multi-functional and can only be used for a specific production, manufacturing and/or processing function within a specific sub-sector of
the food or agribusiness industry and whereby such assets are not strategically important in nature to the overall industry capacity. These assets can be shut down or
replicated easily in other locations, or existing plants can be expanded to absorb shuttered capacity. The assets are not generally limited in nature by environmental or
operational permits and/or regulatory requirements. An example would be a poultry processing plant located in the Southeast of the United States where there is excess
capacity inherent to the industry and production capacity is easily replaceable.
Other loans included in this category are those collateralized by single purpose (special use) confinement livestock production facilities in which the special use facilities
account for more than 50% of total collateral market value.
Agribusiness All Other: Multiple-use collateral utilized in the production, further processing, adding value or manufacturing of an agricultural commodity or forest
product. In order for a loan to be classified as such, the market value of any single use portion may not be greater than 50% of total collateral market value.
This collateral is multi-functional in nature, adaptable to other manufacturing, processing, or servicing food or agribusiness industries or sub-industries. Assets could also
be very strategic in nature and not easily replaceable either due to cost, location, environmental permitting and/or government regulations. These assets may be single
purpose in nature, but so vital to the industry capacity needs that they will be generally purchased by another like processing company or strategic or financial buyer. An
example of these types of assets are strategically located and highly automated cold storage facilities whereby they can be used for dry storage, distribution centers or
converted into warehouse or other type uses. Another example may be a cheese processing plant that is strategically located within the heart of the dairy industry, limited
permits, environmental restrictions that would limit added capacity, or high barriers to entry to build a like facility within the industry. For example, one of the largest
cheese plants in the industry is located in California and it is not easily replicated within the cheese processing industry due to its location, capacity, costs, access to fluid
milk supply and related feed and water, as well as highly regulated environmental and government restrictions.
Other loans included in this category are those in which more than 50% of the collateral market value is accounted for by chattel assets or other assets related to the
business and financial operations of agribusinesses, including inventories, accounts, trade receivables, cash and brokerage accounts, machinery, equipment, livestock and
other assets utilized for or generated by agribusiness operations.

22
(Figure 11)
For Office, Industrial, Retail and Multi-family
Risk category DSC limits LTV limits
CM1 1.50 ≤ DSC and LTV < 85%
CM2 DSC < 1.50 and LTV < 55%
CM2 0.95 ≤ DSC < 1.50 and 55% ≤ LTV < 75%
CM2 1.15 ≤ DSC < 1.50 and 75% ≤ LTV < 100%
CM2 1.50 ≤ DSC and 85% ≤ LTV < 100%
CM2 1.75 ≤ DSC and 100% ≤ LTV
CM3 DSC < 0.95 and 55% ≤ LTV < 85%
CM3 0.95 ≤ DSC < 1.15 and 75% ≤ LTV < 100%
CM3 1.15 ≤ DSC < 1.75 and 100% ≤ LTV
CM4 DSC < 0.95 and 85% ≤ LTV < 105%
CM4 0.95 ≤ DSC < 1.15 and 100% ≤ LTV
CM5 DSC < 0.95 and 105% ≤ LTV
(Figure 12)
For Hotels and Specialty Commercial
Risk category DSC limits LTV limits
CM1 1.85 ≤ DSC and LTV < 60%
CM2 1.45 ≤ DSC < 1.85 and LTV < 70%
CM2 1.85 ≤ DSC and 60% ≤ LTV < 115%
CM3 0.90 ≤ DSC < 1.45 and ≤ LTV < 80%
CM3 1.45 ≤ DSC < 1.85 and 70% ≤ LTV
CM3 1.85 ≤ DSC and 115% ≤ LTV
CM4 DSC < 0. 90 and LTV < 90%
CM4 0.90 ≤ DSC < 1.10 and 80% ≤ LTV < 90%
CM4 1.10 ≤ DSC < 1.45 and 80% ≤ LTV
CM5 1.10 ≤ DSC and 90% ≤ LTV
(Figure 13)
For Farm Loans:
Timber Farm & Ranch
Agribusiness
Single Purpose
Agribusiness
All Other
23
CM1 LTV <= 55% LTV <= 60% LTV <= 60%
CM2 55% < LTV <= 65% 60% < LTV <= 70% LTV <= 60% 60% < LTV <= 70%
CM3 65% < LTV <= 85% 70% < LTV <= 90% 60% < LTV <= 70% 70% < LTV <= 90%
CM4 85% < LTV <= 105% 90% < LTV <= 110% 70% < LTV <= 90% 90% < LTV <= 110%
CM5 105% < LTV 110% < LTV 90% < LTV 110% < LTV

24
ASSET CONCENTRATION FACTOR
LR010
Basis of Factors
The purpose of the concentration factor is to reflect the additional risk of high concentrations in single exposures (represented by an individual issuer of a security or a holder of a
mortgage, etc.) The concentration factor doubles the risk-based capital pre-tax factor (with a maximum of 45 percent pre-tax) of the 10 largest asset exposures excluding various
low risk categories or categories that already have a maximum factor. Since the risk-based capital of the assets included in the concentration factor has already been counted once
in the basic formula, this factor itself only serves to add in the additional risk-based capital required. The calculation is completed on a consolidated basis; however, the
concentration factor is reduced by amounts already included in the concentration factors of subsidiaries to avoid double-counting.
Specific Instructions for Application of the Formula
The 10 largest asset exposures should be developed by consolidating the assets of the parent with the assets of the company’s insurance and investment subsidiaries. The
concentration factor component on any asset already reflected in the subsidiary’s RBC for the concentration factor should be deducted from Column (4). This consolidation
process affects higher tiered companies only. Companies on the lowest tier of the organizational chart will prepare the asset concentration on a “stand alone” basis.
The 10 largest exposures should exclude the following: affiliated and non-affiliated common stock, affiliated preferred stock, home office properties, policy loans, bonds for which
AVR and RBC are zero, Class 1 bonds, Class 1 unaffiliated preferred stock, Class 1 Hybrids, Class CM1 mortgages and any other asset categories with RBC factors less than 0.8
percent post-tax (this includes residential mortgages in good standing, insured or guaranteed mortgages, and cash and short-term investments).
In determining the assets subject to the concentration factor for both C1o and C1cs, the ceding company should exclude any asset whose performance inures primarily (>50
percent) to one reinsurer under modified coinsurance or funds withheld arrangements. The reinsurer should include 100 percent of such asset. Any asset where no one reinsurer
receives more than 50 percent of its performance should remain with the ceding company.
Assets should be aggregated by issuer before determining the 10 largest exposures. Aggregations should be done separately for bonds and preferred stock (the first six digits of the
CUSIP number can be used as a starting point) (please note that the same issuer may have more than one unique series of the first six digits of the CUSIP), mortgages and real
estate. Securities held within Schedule BA partnerships should be aggregated by issuer as if the securities are held directly. Likewise, where joint venture real estate is mortgaged
by the insurer, both the mortgage and the joint venture real estate should be considered as part of a single exposure. Tenant exposure is not included. For bonds and unaffiliated
preferred stock, aggregations should be done first for classes 2 through 6. After the 10 largest issuer exposures are chosen, any Class 1 bonds, Class 1 unaffiliated preferred stock
or Class 1Hybrids from any of these issuers should be included before doubling the risk-based capital. For some companies, following the above steps may generate less than 10
“issuer” exposures. These companies should list all available exposures.
Replicated assets other than synthetically created indices should be included in the asset concentration calculation in the same manner as other assets.
The book/adjusted carrying value of each asset is listed in Column (2).
The RBC factor will correspond to the risk-based capital category of the asset reported previously in the formula before application of the size factor for bonds. The RBC filing
software automatically allows for an overall 45 percent RBC cap.
Lines (23) through (28)
The Asset Concentration RBC Requirement for a particular property plus the Real Estate RBC Requirement for a particular property cannot exceed the book/adjusted carrying
value of the property. Any properties exceeding the book/adjusted carrying value must be adjusted down to the book/adjusted carrying value in Column (6) of the Asset
Concentration.

25
Line (24), Column (4) is calculated as Line (23), Column (2) multiplied by 0.2300 plus Line (24), Column (2) multiplied by 0.2000, but not greater than Line (23), Column (2).
Line (26), Column (4) is calculated as Line (25), Column (2) multiplied by 0.1500 plus Line (26), Column (2) multiplied by 0.1200, but not greater than Line (25), Column (2).
Line (28), Column (4) is calculated as Line (27), Column (2) multiplied by 0.2300 plus Line (28), Column (2) multiplied by 0.2000, but not greater than Line (27), Column (2).
Lines (29) through (48)
The Asset Concentration RBC Requirement for a particular mortgage plus the LR004 Mortgages RBC Requirement or LR009 Schedule BA Mortgages RBC Requirement for a
particular mortgage can not exceed 45 percent of the book/adjusted carrying value of the mortgage. Any mortgages exceeding 45 percent of the book/adjusted carrying value must
be adjusted down in Column (6) of the Asset Concentration.
Line (33), Column (4) is calculated as the greater of 0.1800 multiplied by [(Line (32) plus Line (33)] less Line (33) or Line (32) multiplied by the appropriate factor for the CM
class to which the loan is assigned.
Line (35), Column (4) is calculated as the greater of 0.0140 multiplied by [(Line (34) plus Line (35)] less Line (35) or Line (34) multiplied by 0.0068.
Line (37), Column (4) is calculated as the greater of 0.1800 multiplied by [(Line (36) plus Line (37)] less Line (37) or Line (36) multiplied by the appropriate factor for the CM
class to which the loan is assigned the factor for the appropriate CM category based on the DSC and LTV of the loan.
Line (39), Column (4) is calculated as the greater of 0.2300 multiplied by [(Line (38) plus Line (39)] less Line (39) or Line (38) multiplied by the appropriate factor for the CM
class to which the loan is assigned Line (41), Column (4) is calculated as the greater of 0.0270 multiplied by [(Line (40) plus Line (41)] less Line (41) or Line (40) multiplied by
0.0068.
Line (43), Column (4) is calculated as the greater of 0.2300 multiplied by [(Line (42) plus Line (43)] less Line (43) or Line (42) multiplied by the appropriate factor for the CM
class to which the loan is assigned Line (46), Column (4) is calculated as the greater of 0.1800 multiplied by [(Line (45) plus Line (46)] less Line (46) or Line (45) multiplied by
the appropriate factor for the CM class to which the loan is assigned Line (48), Column (4) is calculated as the greater of 0.2300 multiplied by [(Line (47) plus Line (48)] less Line
(48) or Line (47) multiplied by the appropriate factor for the CM class to which the loan is assigned

26
LR003 – eliminate the current page. The current page is used to compute the company’s experience adjustment factor. Under the
new RBC and AVR methodology, this value will no longer be used and is not needed to be determined.

27
LR004 – Replace with next page MORTGAGES
Company Name Cocode: 00000
MORTGAGES
(1) (2) (3) (4) (5) (6)
Involuntary
Book / Adjusted Reserve Cumulative Average RBC
Annual Statement Source Carrying Value Adjustment† RBC Subtotal Writedowns‡ Factor Requirement
In Good Standing
(1) Farm Mortgages AVR Default Component Column 1 Line 35 $0 $0 $0 XXX X 0.0260 § = $0
(2) Residential Mortgages-Insured or Guaranteed AVR Default Component Column 1 Line 36 $0 $0 $0 XXX X 0.0014 = $0
(3) Residential Mortgages-All Other AVR Default Component Column 1 Line 37 $0 $0 $0 XXX X 0.0068 = $0
(4) Commercial Mortgages-Insured or Guaranteed AVR Default Component Column 1 Line 38 $0 $0 $0 XXX X 0.0014 = $0
(5) Commercial Mortgages-All Other AVR Default Component Column 1 Line 39 $0 $0 $0 XXX X 0.0260 § = $0
(6) Restructured Mortgages AVR Default Component Column 1 Line 40 $0 $0 $0 XXX X 0.0900 * = $0
90 Days Overdue, Not in Process of Foreclosure
(7) Farm Mortgages AVR Default Component Column 1 Line 41 $0 $0 $0 $0 X 0.1800 £ = $0
(8) Residential Mortgages-Insured or Guaranteed AVR Default Component Column 1 Line 42 $0 $0 $0 $0 X 0.0000 £ = $0
(9) Residential Mortgages-All Other AVR Default Component Column 1 Line 43 $0 $0 $0 $0 X 0.0000 £ = $0
(10) Commercial Mortgages-Insured or Guaranteed AVR Default Component Column 1 Line 44 $0 $0 $0 $0 X 0.1800 £ = $0
(11) Commercial Mortgages-All Other AVR Default Component Column 1 Line 45 $0 $0 $0 $0 X 0.1800 £ = $0
In Process of Foreclosure
(12) Farm Mortgages AVR Default Component Column 1 Line 46 $0 $0 $0 $0 X 0.2300 £ = $0
(13) Residential Mortgages-Insured or Guaranteed AVR Default Component Column 1 Line 47 $0 $0 $0 $0 X 0.0000 £ = $0
(14) Residential Mortgages-All Other AVR Default Component Column 1 Line 48 $0 $0 $0 $0 X 0.0000 £ = $0
(15) Commercial Mortgages-Insured or Guaranteed AVR Default Component Column 1 Line 49 $0 $0 $0 $0 X 0.2300 £ = $0
(16) Commercial Mortgages-All Other AVR Default Component Column 1 Line 50 $0 $0 $0 $0 X 0.2300 £ = $0
Due and Unpaid Taxes
(17) Due and Unpaid Taxes on Mortgages Schedule B Part 1 Footnote #3 $0 X 1.000 = $0
Overdue, Not in Process of Foreclosure 1st amount
(18) Due and Unpaid Taxes on Foreclosed Schedule B Part 1 Footnote #4 $0 X 1.000 = $0
Mortgages 1st amount
(19) Total Mortgages (including due and unpaid taxes) Sum of Lines (1) through (18) $0 $0 $0 $0 $0
(Column (1) should equal Page 2 Column 3 Lines 3.1 + 3.2 + Schedule B Part 1 Footnote #3
1st amount + Schedule B Part 1 Footnote #4 1st amount).
(20) Reduction in RBC for MODCO/Funds Withheld
Reinsurance Ceded Agreements Company Records (enter a pre-tax amount) $0
(21) Increase in RBC for MODCO/Funds Withheld
Reinsurance Assumed Agreements Company Records (enter a pre-tax amount) $0
(22) Total Mortgages
(including MODCO/Funds Withheld.) Lines (19) - (20) + (21) $0
†
Involuntary reserves are reserves that are held as an offset to a particular asset that is clearly a troubled asset and are included on Page 3 Line 25 of the Annual
Statement.
‡ Cumulative writedowns include the total amount of writedowns, non-admissions, and involuntary reserves that have been taken or established with respect to a particular mortgage.
§ For Lines (1) and (5), Column (5) is equal to 0.0260 multiplied times the experience adjustment factor on LR003 Mortgage Experience Adjustment Factor Line (13).
*
For Line (6), Column (5) is the greater of 0.0900 or 0.0260 multiplied by [the experience adjustment factor calculated on LR003 Mortgage Experience Adjustment Factor Line (13)] plus
0.0200.
£ For Lines (7) through (16), Column (5) is calculated as Column (6) divided by Column (3).
28
LR004 – revised MORTGAGES
Company Name Cocode: 00000
MORTGAGES
(1) (2) (3) (4) (5) (6)
Involuntary
Book / Adjusted Reserve Cumulative Average RBC
Annual Statement Source Carrying Value Adjustment† RBC Subtotal Writedowns‡ Factor Requirement
In Good Standing
(1) Residential Mortgages-Insured or Guaranteed AVR Default Component Column 1 Line new $0 $0 $0 XXX X 0.0014 = $0
(2) Residential Mortgages-All Other AVR Default Component Column 1 Line new $0 $0 $0 XXX X 0.0068 = $0
(3) Commercial Mortgages-Insured or Guaranteed AVR Default Component Column 1 Line new $0 $0 $0 XXX X 0.0014 = $0
(4) Commercial Mortgage class 1 AVR Default Component Column 1 Line new XXX 0.0090 Col.(3) X Col (5)
(5) Commercial Mortgage class 2 AVR Default Component Column 1 Line new XXX 0.0175 Col.(3) X Col (5) (6) Commercial Mortgage class 3 AVR Default Component Column 1 Line new XXX 0.0300 Col.(3) X Col (5) (7) Commercial Mortgage class 4 AVR Default Component Column 1 Line new XXX 0.0500 Col.(3) X Col (5) (8) Commercial Mortgage class 5 AVR Default Component Column 1 Line new XXX 0.0750 Col.(3) X Col (5) (9) Total Commercial Mortgages all other Lines (4) + (5) + (6) + (7) + (8) XXX
(10) Farm Mortgages – Class 1 AVR Default Component Column 1 Line new XXX 0.0090 = Col.(3) X Col (5) (11) Farm Mortgages – Class 2 AVR Default Component Column 1 Line new XXX 0.0175 Col.(3) X Col (5) (12) Farm Mortgages – Class 3 AVR Default Component Column 1 Line new XXX 0.0300 Col.(3) X Col (5) (13) Farm Mortgages – Class 4 AVR Default Component Column 1 Line new XXX 0.0500 Col.(3) X Col (5) (14) Farm Mortgages – Class 5 AVR Default Component Column 1 Line new XXX 0.0750 Col.(3) X Col (5) (15) Total Farm Mortgages Lines (10)+(11)+(12)+(13)+(14) XXX
90 Days Overdue, Not in Process of Foreclosure
(16) Farm Mortgages AVR Default Component Column 1 Line 41 $0 $0 $0 $0 X 0.1800 £ = $0
(17) Residential Mortgages-Insured or Guaranteed AVR Default Component Column 1 Line 42 $0 $0 $0 $0 X 0.0000 £ = $0
(18) Residential Mortgages-All Other AVR Default Component Column 1 Line 43 $0 $0 $0 $0 X 0.0000 £ = $0
(19) Commercial Mortgages-Insured or Guaranteed AVR Default Component Column 1 Line 44 $0 $0 $0 $0 X 0.1800 £ = $0
(20) Commercial Mortgages-All Other AVR Default Component Column 1 Line 45 $0 $0 $0 $0 X 0.1800 £ = $0
In Process of Foreclosure
(21) Farm Mortgages AVR Default Component Column 1 Line 46 $0 $0 $0 $0 X 0.2300 £ = $0
(22) Residential Mortgages-Insured or Guaranteed AVR Default Component Column 1 Line 47 $0 $0 $0 $0 X 0.0000 £ = $0
(23) Residential Mortgages-All Other AVR Default Component Column 1 Line 48 $0 $0 $0 $0 X 0.0000 £ = $0
(24) Commercial Mortgages-Insured or Guaranteed AVR Default Component Column 1 Line 49 $0 $0 $0 $0 X 0.2300 £ = $0
(25) Commercial Mortgages-All Other AVR Default Component Column 1 Line 50 $0 $0 $0 $0 X 0.2300 £ = $0
Due and Unpaid Taxes
(26) Due and Unpaid Taxes on Mortgages Schedule B Part 1 Footnote #3 $0 X 1.000 = $0
Overdue, Not in Process of Foreclosure 1st amount
(27) Due and Unpaid Taxes on Foreclosed Schedule B Part 1 Footnote #4 $0 X 1.000 = $0
Mortgages 1st amount
(28)
Total Mortgages (including due and unpaid
taxes)
Sum of Lines (1)+(2)+(3)+9)+(15)+(16 thru
27) $0 $0 $0 $0 $0
(Column (1) should equal Page 2 Column 3 Lines 3.1 + 3.2 + Schedule B Part 1 Footnote #3
1st amount + Schedule B Part 1 Footnote #4 1st amount).
(29)
Reduction in RBC for MODCO/Funds
Withheld
Reinsurance Ceded Agreements Company Records (enter a pre-tax amount) $0
(30) Increase in RBC for MODCO/Funds Withheld

29
Reinsurance Assumed Agreements Company Records (enter a pre-tax amount) $0
(31) Total Mortgages
(including MODCO/Funds Withheld.) Lines (28) - (29) + (30) $0
†
Involuntary reserves are reserves that are held as an offset to a particular asset that is clearly a troubled asset and are included on Page 3 Line 25 of the Annual
Statement.
‡ Cumulative writedowns include the total amount of writedowns, non-admissions, and involuntary reserves that have been taken or established with respect to a particular mortgage.
£ For Lines (7) through (16), Column (5) is calculated as Column (6) divided by Column (3).

30
Replace this page with the following page:
LR009 SCHEDULE BA
MORTGAGES Company Name
Cocode:
00000
SCHEDULE BA MORTGAGES
(1) (2) (3) (4) (5) (6)
Involuntary
Book / Adjusted Reserve Cumulative Average RBC
Annual Statement Value Carrying Value
Adjustment
†
RBC
Subtotal
Writedowns
‡ Factor Requirement
(1) Insured or Guaranteed
Schedule BA Part 1
Column 12 Line 0999999 + $0 $0 $0 XXX X 0.0014 = $0
in Good Standing Line1099999, in part
(2) All Other in Good Standing
Schedule BA Part 1
Column 12 Line 0999999 + $0 $0 $0 XXX X 0.0260 § = $0
Line1099999, in part
(3) Restructured
AVR Equity Component
Column 1 Line 44 $0 $0 $0 XXX X 0.0900 * = $0
(4) Insured or Guaranteed 90
Schedule BA Part 1
Column 12 Line 0999999 +
$0
$0 $0 $0 X 0.0000 £ = $0
Days Overdue Line1099999, in part
(5) All Other 90 Days Overdue
Schedule BA Part 1
Column 12 Line 0999999 +
$0
$0 $0 $0 X 0.0000 £ = $0
Line1099999, in part
(6) Insured or Guaranteed
Schedule BA Part 1
Column 12 Line 0999999 +
$0
$0 $0 $0 X 0.0000 £ = $0
in Process of Foreclosure Line1099999, in part
(7) All Other in Process of
Schedule BA Part 1
Column 12 Line 0999999 +
$0
$0 $0 $0 X 0.0000 £ = $0
Foreclosure Line1099999, in part
(8)
Total Schedule BA
Mortgages
Sum of Lines (1) through
(7) $0 $0 $0 $0 $0
(pre-MODCO/Funds
Withheld)
(9)
Reduction in RBC for
MODCO/Funds Withheld
Reinsurance Ceded Company Records (enter a $0

31
Agreements pre-tax amount)
(10)
Increase in RBC for
MODCO/Funds Withheld
Reinsurance Assumed
Agreements
Company Records (enter a
pre-tax amount) $0
(11)
Total Schedule BA
Mortgages
(including MODCO/Funds
Withheld.) Lines (8) - (9) + (10) $0
† Involuntary reserves are reserves that are held as an offset to a particular asset that is clearly a troubled asset and are included
on Page 3 Line 25 of the Annual Statement.
‡ Cumulative writedowns include the total amount of writedowns, non-admissions, and involuntary reserves that have been
taken or established with respect to a particular mortgage.
§ For Line (2), Column (5) is equal to 0.0260 multiplied times the experience adjustment factor on LR003 Mortgage Experience
Adjustment Factor Line (13).
* For Line (3), Column (5) is the greater of 0.0900 or 0.0260 multiplied by [the experience adjustment factor calculated on
LR003 Mortgage Experience Adjustment Factor Line (13)] plus 0.0200.
£ For Lines (4) through (7), Column (5) is calculated as Column (6) divided by Column (3).
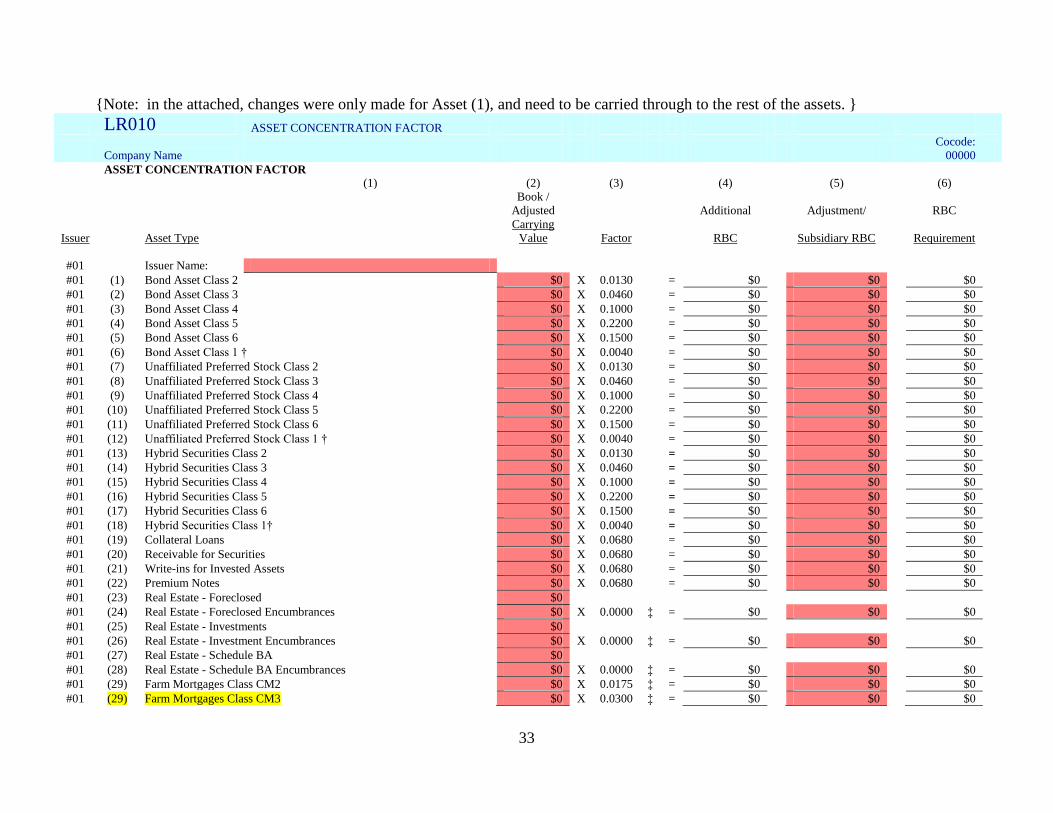
32
LR009 – revised Schedule BA MORTGAGES
Company Name Cocode: 00000
Schedule BA MORTGAGES
(1) (2) (3) (4) (5) (6)
Involuntary
Book / Adjusted Reserve Cumulative Average RBC
Annual Statement Source Carrying Value Adjustment† RBC Subtotal Writedowns‡ Factor Requirement
In Good Standing
(1) Commercial Mortgages-Insured or Guaranteed $0 $0 $0 XXX X 0.0014 = $0
(1) Unaffiliated Mortgages with covenants Schedule BA line 0999999 in part £ From worksheet
(2)
Unaffiliated Mortgages defeased with
government securities
Schedule BA line 0999999 in part .0090
(3) Unaffiliated Mortgages primarily Senior Schedule BA line 0999999 in part .0175
(4) Unaffiliated Mortgages –all other Schedule BA Line 0099999 in part .0300 Col.(3) X Col (5) (5) Affiliated Mortgage class 1 Schedule BA Line 1099999 in part 0.0090 = Col.(3) X Col (5) (6) Affiliated Mortgage class 2 Schedule BA Line 1099999 in part 0.0175 Col.(3) X Col (5) (7) Affiliated Mortgage class 3 Schedule BA Line 1099999 in part 0.0300 Col.(3) X Col (5) (8) Affiliated Mortgage class 4 Schedule BA Line 1099999 in part 0.0500 Col.(3) X Col (5) (9) Affiliated Mortgage class 5 Schedule BA Line 1099999 in part 0.0750 Col.(3) X Col (5)
(10) Total in good standing
90 Days Overdue, Not in Process of Foreclosure
(12) Insured or Guaranteed
(11) Unaffiliated Schedule BA line 0999999 in part $0 $0 $0 $0 X £ = $0
(12) Affiliated Schedule BA Line 1099999 in part $0 $0 $0 $0 X £ = $0
(13) Total 90 days overdue
In Process of Foreclosure
(16) Insured or Guaranteed
(14) Unaffiliated Mortgages Schedule BA line 0999999 in part $0 $0 $0 $0 X £ = $0
(15) Affiliated Mortgages Schedule BA Line 1099999 in part $0 $0 $0 $0 X £ = $0
(16) Total in process of foreclosure
(17) Totals Lines (11) + (15) + (19)
(18) Reduction in RBC for MODCO/Funds Withheld
Reinsurance Ceded Agreements Company Records (enter a pre-tax amount) $0
(19) Increase in RBC for MODCO/Funds Withheld
Reinsurance Assumed Agreements Company Records (enter a pre-tax amount) $0
(20) Total Mortgages
(Including MODCO/Funds Withheld.) Lines (19) - (20) + (21) $0
† Involuntary reserves are reserves that are held as an offset to a particular asset that is clearly a troubled asset and are included
on Page 3 Line 25 of the Annual Statement.
‡ Cumulative writedowns include the total amount of writedowns, non-admissions, and involuntary reserves that have been
taken or established with respect to a particular mortgage.
£ For Lines (1), (11), (12), (14) and (15), Column (5) is calculated as Column (6) divided by Column (3).

33
{Note: in the attached, changes were only made for Asset (1), and need to be carried through to the rest of the assets. }
LR010 ASSET CONCENTRATION FACTOR
Company Name Cocode:
00000 ASSET CONCENTRATION FACTOR
(1) (2) (3) (4) (5) (6)
Book /
Adjusted Additional Adjustment/ RBC
Issuer Asset Type
Carrying
Value Factor RBC Subsidiary RBC Requirement
#01 Issuer Name:
#01 (1) Bond Asset Class 2 $0 X 0.0130 = $0 $0 $0
#01 (2) Bond Asset Class 3 $0 X 0.0460 = $0 $0 $0
#01 (3) Bond Asset Class 4 $0 X 0.1000 = $0 $0 $0
#01 (4) Bond Asset Class 5 $0 X 0.2200 = $0 $0 $0
#01 (5) Bond Asset Class 6 $0 X 0.1500 = $0 $0 $0
#01 (6) Bond Asset Class 1 † $0 X 0.0040 = $0 $0 $0
#01 (7) Unaffiliated Preferred Stock Class 2 $0 X 0.0130 = $0 $0 $0
#01 (8) Unaffiliated Preferred Stock Class 3 $0 X 0.0460 = $0 $0 $0
#01 (9) Unaffiliated Preferred Stock Class 4 $0 X 0.1000 = $0 $0 $0
#01 (10) Unaffiliated Preferred Stock Class 5 $0 X 0.2200 = $0 $0 $0
#01 (11) Unaffiliated Preferred Stock Class 6 $0 X 0.1500 = $0 $0 $0
#01 (12) Unaffiliated Preferred Stock Class 1 † $0 X 0.0040 = $0 $0 $0
#01 (13) Hybrid Securities Class 2 $0 X 0.0130 = $0 $0 $0
#01 (14) Hybrid Securities Class 3 $0 X 0.0460 = $0 $0 $0
#01 (15) Hybrid Securities Class 4 $0 X 0.1000 = $0 $0 $0
#01 (16) Hybrid Securities Class 5 $0 X 0.2200 = $0 $0 $0
#01 (17) Hybrid Securities Class 6 $0 X 0.1500 = $0 $0 $0
#01 (18) Hybrid Securities Class 1† $0 X 0.0040 = $0 $0 $0
#01 (19) Collateral Loans $0 X 0.0680 = $0 $0 $0
#01 (20) Receivable for Securities $0 X 0.0680 = $0 $0 $0
#01 (21) Write-ins for Invested Assets $0 X 0.0680 = $0 $0 $0
#01 (22) Premium Notes $0 X 0.0680 = $0 $0 $0
#01 (23) Real Estate - Foreclosed $0
#01 (24) Real Estate - Foreclosed Encumbrances $0 X 0.0000 ‡ = $0 $0 $0
#01 (25) Real Estate - Investments $0
#01 (26) Real Estate - Investment Encumbrances $0 X 0.0000 ‡ = $0 $0 $0
#01 (27) Real Estate - Schedule BA $0
#01 (28) Real Estate - Schedule BA Encumbrances $0 X 0.0000 ‡ = $0 $0 $0
#01 (29) Farm Mortgages Class CM2 $0 X 0.0175 ‡ = $0 $0 $0
#01 (29) Farm Mortgages Class CM3 $0 X 0.0300 ‡ = $0 $0 $0

34
#01 (29) Farm Mortgages Class CM4 $0 X 0.0500 ‡ = $0 $0 $0
#01 (29) Farm Mortgages Class CM5 $0 X 0.0750 ‡ = $0 $0 $0
#01 (30) Commercial Mortgages Class CM2 $0 X 0.0175 ‡ = $0 $0 $0
#01 (30) Commercial Mortgages Class CM3 $0 X 0.0300 ‡ = $0 $0 $0
#01 (30) Commercial Mortgages Class CM4 $0 X 0.0500 ‡ = $0 $0 $0
#01 (30) Commercial Mortgages Class CM5 $0 X 0.0750 ‡ = $0 $0 $0
#01 (32) Farm Mortgages - 90 Days Overdue $0
#01 (33) Farm Mortgages - 90 Days Overdue - Cumulative Writedowns $0 X 0.0000 ‡ = $0 $0 $0
#01 (34) Residential Mortgages - 90 Days Overdue $0
#01 (35) Residential Mortgages - 90 Days Overdue - Cumulative Writedowns $0 X 0.0000 ‡ = $0 $0 $0
#01 (36) Commercial Mortgages - 90 Days Overdue $0
#01 (37) Commercial Mortgages - 90 Days Overdue - Cumulative Writedowns $0 X 0.0000 ‡ = $0 $0 $0
#01 (38) Farm Mortgages in Foreclosure $0
#01 (39) Farm Mortgages in Foreclosure - Cumulative Writedowns $0 X 0.0000 ‡ = $0 $0 $0
#01 (40) Residential Mortgages in Foreclosure $0
#01 (41) Residential Mortgages in Foreclosure - Cumulative Writedowns $0 X 0.0000 ‡ = $0 $0 $0
#01 (42) Commercial Mortgages in Foreclosure $0
#01 (43) Commercial Mortgages in Foreclosure - Cumulative Writedowns $0 X 0.0000 ‡ = $0 $0 $0
#01 (44) Unaffiliated Mortgages with covenants $0 X ‡ = $0 $0 $0
Unaffiliated Mortgages defeased with government securities .0090
Unaffiliated Mortgages primarily Senior .0175
Unaffiliated Mortgages –all other .0300
Affiliated Mortgage class 1 0.0090
Affiliated Mortgage class 2 0.0175
Affiliated Mortgage class 3 0.0300
Affiliated Mortgage class 4 0.0500
Affiliated Mortgage class 5 0.0750
Total in good standing 0.0750
#01 (45) Schedule BA Mortgages 90 Days Overdue $0
#01 (46) Schedule BA Mortgages 90 Days Overdue - Cumulative Writedowns $0 X 0.0000 ‡ = $0 $0 $0
#01 (47) Schedule BA Mortgages in Process of Foreclosure $0
#01 (48) Schedule BA Mortgages Foreclosed - Cumulative Writedowns $0 X 0.0000 ‡ = $0 $0 $0
#01 (49) Non-Guaranteed Low Income Housing Tax Credits $0 X 0.0230 = $0 $0 $0
#01 (50) Other Schedule BA Assets $0 X 0.1500 = $0 $0 $0
#01
#01 (51) Sum of Lines (1) through (50) $0 $0 $0 $0
(51) Sum of Lines (1) through (50) $0 $0 $0 $0
† After the ten largest issuer exposures are chosen, any class 1 bonds or preferred stocks from any of these issuers should be included.
‡
Refer to the instructions for the Asset Concentration Factor for details of this
calculation.

35
LR030 CALCULATION OF TAX EFFECT FOR LIFE RISK-BASED CAPITAL
Company Name Cocode: 00000
CALCULATION OF TAX EFFECT FOR LIFE RISK-BASED CAPITAL
(1) (2)
Source
RBC
Amount Tax Factor RBC Tax Effect
ASSET RISKS
Bonds
(001) Long-term Bonds – Class 1 LR002 Bonds Column (2) Line (2) + LR016 Off-Balance Sheet Collateral $0 X 0.2625 = $0
Column (3) Line (2)
(002) Long-term Bonds – Class 2 LR002 Bonds Column (2) Line (3) + LR016 Off-Balance Sheet Collateral $0 X 0.2625 = $0
Column (3) Line (3)
(003) Long-term Bonds – Class 3 LR002 Bonds Column (2) Line (4) + LR016 Off-Balance Sheet Collateral $0 X 0.2625 = $0
Column (3) Line (4)
(004) Long-term Bonds – Class 4 LR002 Bonds Column (2) Line (5) + LR016 Off-Balance Sheet Collateral $0 X 0.2625 = $0
Column (3) Line (5)
(005) Long-term Bonds – Class 5 LR002 Bonds Column (2) Line (6) + LR016 Off-Balance Sheet Collateral $0 X 0.2625 = $0
Column (3) Line (6)
(006) Long-term Bonds – Class 6 LR002 Bonds Column (2) Line (7) + LR016 Off-Balance Sheet Collateral $0 X 0.3500 = $0
Column (3) Line (7)
(007) Short-term Bonds – Class 1 LR002 Bonds Column (2) Line (10) $0 X 0.2625 = $0
(008) Short-term Bonds – Class 2 LR002 Bonds Column (2) Line (11) $0 X 0.2625 = $0
(009) Short-term Bonds – Class 3 LR002 Bonds Column (2) Line (12) $0 X 0.2625 = $0
(010) Short-term Bonds – Class 4 LR002 Bonds Column (2) Line (13) $0 X 0.2625 = $0
(011) Short-term Bonds – Class 5 LR002 Bonds Column (2) Line (14) $0 X 0.2625 = $0
(012) Short-term Bonds – Class 6 LR002 Bonds Column (2) Line (15) $0 X 0.3500 = $0
(013) Bond Reduction - Reinsurance LR002 Bonds Column (2) Line (18) $0 X 0.3500 = $0
(014) Bond Increase - Reinsurance LR002 Bonds Column (2) Line (19) $0 X 0.3500 = $0
(015)
Non-Exempt Class 1 U.S.
Government Agency LR002 Bonds Column (2) Line (21) $0 X 0.2625 = $0
(016) Bonds Size Factor LR002 Bonds Column (2) Line (25) - LR002 Bonds Column (2) Line (20) $0 X 0.2625 = $0
Mortgages
In Good Standing
(017) Farm Mortgages LR004 Mortgages Column (6) Line (15) $0 X 0.2625 = $0
(018) Residential Mortgages - Insured LR004 Mortgages Column (6) Line (1) $0 X 0.2625 = $0
(019) Residential Mortgages - Other LR004 Mortgages Column (6) Line (2) $0 X 0.2625 = $0
(020) Commercial Mortgages - Insured LR004 Mortgages Column (6) Line (3) $0 X 0.2625 = $0

36
(021) Commercial Mortgages - Other LR004 Mortgages Column (6) Line (9) $0 X 0.2625 = $0
90 Days Overdue
(023) Farm Mortgages LR004 Mortgages Column (6) Line (16) $0 X 0.2625 = $0
(024) Residential Mortgages - Insured LR004 Mortgages Column (6) Line (17) $0 X 0.2625 = $0
(025) Residential Mortgages - Other LR004 Mortgages Column (6) Line (18) $0 X 0.2625 = $0
(026) Commercial Mortgages - Insured LR004 Mortgages Column (6) Line (19) $0 X 0.2625 = $0
(027) Commercial Mortgages - Other LR004 Mortgages Column (6) Line (20) $0 X 0.2625 = $0
In Process of Foreclosure
(028) Farm Mortgages LR004 Mortgages Column (6) Line (21) $0 X 0.2625 = $0
(029) Residential Mortgages - Insured LR004 Mortgages Column (6) Line (22) $0 X 0.2625 = $0
(030) Residential Mortgages - Other LR004 Mortgages Column (6) Line (23) $0 X 0.2625 = $0
(031) Commercial Mortgages - Insured LR004 Mortgages Column (6) Line (24) $0 X 0.2625 = $0
(032) Commercial Mortgages - Other LR004 Mortgages Column (6) Line (25) $0 X 0.2625 = $0
(033) Due & Unpaid Taxes Mortgages LR004 Mortgages Column (6) Line (26) $0 X 0.2625 = $0
(034) Due & Unpaid Taxes-Foreclosures LR004 Mortgages Column (6) Line (27) $0 X 0.2625 = $0
(035) Mortgage Reduction - Reinsurance LR004 Mortgages Column (6) Line (29) $0 X 0.3500 = $0
(036) Mortgage Increase - Reinsurance LR004 Mortgages Column (6) Line (30) $0 X 0.3500 = $0
Preferred Stock and Hybrid Securities
(037)
Unaffiliated Preferred Stock and
Hybrids Class 1 LR005 Unaffiliated Preferred and Common Stock Column (5) Line (1) + Line (8) $0 X 0.2625 = $0
+ LR016 Off-Balance Sheet Collateral Column (3) Line (9)
(038)
Unaffiliated Preferred Stock and
Hybrids Class 2 LR005 Unaffiliated Preferred and Common Stock Column (5) Line (2) + Line (9) $0 X 0.2625 = $0
+ LR016 Off-Balance Sheet Collateral Column (3) Line (10)
(039)
Unaffiliated Preferred Stock and
Hybrids Class 3 LR005 Unaffiliated Preferred and Common Stock Column (5) Line (3) + Line (10) $0 X 0.2625 = $0
+ LR016 Off-Balance Sheet Collateral Column (3) Line (11)
(040)
Unaffiliated Preferred Stock and
Hybrids Class 4 LR005 Unaffiliated Preferred and Common Stock Column (5) Line (4) + Line (11) $0 X 0.2625 = $0
+ LR016 Off-Balance Sheet Collateral Column (3) Line (12)
(041)
Unaffiliated Preferred Stock and
Hybrids Class 5 LR005 Unaffiliated Preferred and Common Stock Column (5) Line (5) + Line (12) $0 X 0.2625 = $0
+ LR016 Off-Balance Sheet Collateral Column (3) Line (13)
(042)
Unaffiliated Preferred Stock and
Hybrids Class 6 LR005 Unaffiliated Preferred and Common Stock Column (5) Line (6) + Line (13) $0 X 0.3500 = $0
+ LR016 Off-Balance Sheet Collateral Column (3) Line (14)
(043)
Preferred Stock Reduction-
Reinsurance LR005 Unaffiliated Preferred and Common Stock Column (5) Line (16) $0 X 0.3500 = $0
(044)
Preferred Stock Increase-
Reinsurance LR005 Unaffiliated Preferred and Common Stock Column (5) Line (17) $0 X 0.3500 = $0
Separate Accounts
(045) Guaranteed Index LR006 Separate Accounts Column (3) Line (1) $0 X 0.2625 = $0

37
(046) Nonindex-Book Reserve LR006 Separate Accounts Column (3) Line (2) $0 X 0.2625 = $0
(047)
Separate Accounts Nonindex-Market
Reserve LR006 Separate Accounts Column (3) Line (3) $0 X 0.2625 = $0
(048)
Separate Accounts Reduction-
Reinsurance LR006 Separate Accounts Column (3) Line (5) $0 X 0.3500 = $0
(049)
Separate Accounts Increase-
Reinsurance LR006 Separate Accounts Column (3) Line (6) $0 X 0.3500 = $0
(050) Synthetic GICs LR006 Separate Accounts Column (3) Line (8) $0 X 0.2625 = $0
(051) Separate Account Surplus LR006 Separate Accounts Column (3) Line (13) $0 X 0.2625 = $0
Real Estate
(052) Company Occupied Real Estate LR007 Real Estate Column (3) Line (3) $0 X 0.3500 = $0
(053) Foreclosed Real Estate LR007 Real Estate Column (3) Line (6) $0 X 0.3500 = $0
(054) Investment Real Estate LR007 Real Estate Column (3) Line (9) $0 X 0.3500 = $0
(055) Real Estate Reduction - Reinsurance LR007 Real Estate Column (3) Line (11) $0 X 0.3500 = $0
(056) Real Estate Increase - Reinsurance LR007 Real Estate Column (3) Line (12) $0 X 0.3500 = $0
Schedule BA
(057)
Sch BA Real Estate Excluding Low
Income LR007 Real Estate Column (3) Line (16) $0 X 0.3500 = $0
Housing Tax Credits
(058)
Guaranteed Low Income Housing
Tax Credits LR007 Real Estate Column (3) Line (17) $0 X 0.0000 = $0
(059)
Non-Guaranteed Low Income
Housing Tax Credits LR007 Real Estate Column (3) Line (18) $0 X 0.0000 = $0
(060)
Sch BA Real Estate Reduction -
Reinsurance LR007 Real Estate Column (3) Line (20) $0 X 0.3500 = $0
(061)
Sch BA Real Estate Increase -
Reinsurance LR007 Real Estate Column (3) Line (21) $0 X 0.3500 = $0
(062) Sch BA Bond Class 1 LR008 Other Long-Term Assets Column (5) Line (2) $0 X 0.2625 = $0
(063) Sch BA Bond Class 2 LR008 Other Long-Term Assets Column (5) Line (3) $0 X 0.2625 = $0
(064) Sch BA Bond Class 3 LR008 Other Long-Term Assets Column (5) Line (4) $0 X 0.2625 = $0
(065) Sch BA Bond Class 4 LR008 Other Long-Term Assets Column (5) Line (5) $0 X 0.2625 = $0
(066) Sch BA Bond Class 5 LR008 Other Long-Term Assets Column (5) Line (6) $0 X 0.2625 = $0
(067) Sch BA Bond Class 6 LR008 Other Long-Term Assets Column (5) Line (7) $0 X 0.3500 = $0
(068) BA Bond Reduction - Reinsurance LR008 Other Long-Term Assets Column (5) Line (9) $0 X 0.3500 = $0
(069) BA Bond Increase - Reinsurance LR008 Other Long-Term Assets Column (5) Line (10) $0 X 0.3500 = $0
(070) BA Preferred Stock Class 1 LR008 Other Long-Term Assets Column (5) Line (12.3) $0 X 0.2625 = $0
(071) BA Preferred Stock Class 2 LR008 Other Long-Term Assets Column (5) Line (13) $0 X 0.2625 = $0
(072) BA Preferred Stock Class 3 LR008 Other Long-Term Assets Column (5) Line (14) $0 X 0.2625 = $0
(073) BA Preferred Stock Class 4 LR008 Other Long-Term Assets Column (5) Line (15) $0 X 0.2625 = $0
(074) BA Preferred Stock Class 5 LR008 Other Long-Term Assets Column (5) Line (16) $0 X 0.2625 = $0
(075) BA Preferred Stock Class 6 LR008 Other Long-Term Assets Column (5) Line (17) $0 X 0.3500 = $0
(076)
BA Preferred Stock Reduction-
Reinsurance LR008 Other Long-Term Assets Column (5) Line (19) $0 X 0.3500 = $0

38
(077)
BA Preferred Stock Increase -
Reinsurance LR008 Other Long-Term Assets Column (5) Line (20) $0 X 0.3500 = $0
(078) Rated Surplus Notes LR008 Other Long-Term Assets Column (5) Line (31) $0 X 0.2625 = $0
(079) Rated Capital Notes LR008 Other Long-Term Assets Column (5) Line (41) $0 X 0.2625 = $0
(080) BA Common Stock Affiliated LR008 Other Long-Term Assets Column (5) Line (48.3) $0 X 0.3500 = $0
(081) BA Collateral Loans LR008 Other Long-Term Assets Column (5) Line (50) $0 X 0.2625 = $0
(082) Other BA Assets LR008 Other Long-Term Assets Column (5) Line (51.3) + LR016 Off-Balance $0 X 0.3500 = $0
Sheet Collateral Column (3) Line (17) + Line (18)
(083)
Other BA Assets Reduction-
Reinsurance LR008 Other Long-Term Assets Column (5) Line (53) $0 X 0.3500 = $0
(084)
Other BA Assets Increase -
Reinsurance LR008 Other Long-Term Assets Column (5) Line (54) $0 X 0.3500 = $0
(085) BA Mortgages - Insured LR009 Schedule BA Mortgages Column (6) Line (1) $0 X 0.2625 = $0
(086) BA Mortgages-All Other LR009 Schedule BA Mortgages Column (6) Line (8) $0 X 0.2625 = $0
(087) BA Mortgages 90 days Overdue LR009 Schedule BA Mortgages Column (6) Lines (9) + (10) + (11) $0 X 0.2625 = $0
(088) BA Mortgages Foreclosed - Insured LR009 Schedule BA Mortgages Column (6) Line (13) $0 X 0.2625 = $0
(89)
BA Mortgages Foreclosed –
Unaffiliated LR009 Schedule BA Mortgages Column (6) Line (14)
(090)
BA Mortgages Foreclosed -
Affiliated LR009 Schedule BA Mortgages Column (6) Line (15) $0 X 0.2625 = $0
(091) Reduction - Reinsurance LR009 Schedule BA Mortgages Column (6) Line (18) $0 X 0.3500 = $0
(092) Increase - Reinsurance LR009 Schedule BA Mortgages Column (6) Line (19) $0 X 0.3500 = $0
Miscellaneous
(093) Asset Concentration Factor LR010 Asset Concentration Factor Column (6) Line (51) Grand Total Page $0 X 0.2625 = $0
(094) Miscellaneous Assets LR012 Miscellaneous Assets Column (2) Line (7) $0 X 0.2625 = $0
(095)
Derivatives - Collateral and
Exchange Traded LR012 Miscellaneous Assets Column (2) Lines (8) + (9) + (10) $0 X 0.2625 = $0
(096) Derivatives Class 1 LR012 Miscellaneous Assets Column (2) Line (11) $0 X 0.2625 = $0
(097) Derivatives Class 2 LR012 Miscellaneous Assets Column (2) Line (12) $0 X 0.2625 = $0
(098) Derivatives Class 3 LR012 Miscellaneous Assets Column (2) Line (13) $0 X 0.2625 = $0
(099) Derivatives Class 4 LR012 Miscellaneous Assets Column (2) Line (14) $0 X 0.2625 = $0
(100) Derivatives Class 5 LR012 Miscellaneous Assets Column (2) Line (15) $0 X 0.2625 = $0
(101) Derivatives Class 6 LR012 Miscellaneous Assets Column (2) Line (16) $0 X 0.3500 = $0
(102)
Miscellaneous Assets Reduction-
Reinsurance LR012 Miscellaneous Assets Column (2) Line (19) $0 X 0.3500 = $0
(103)
Miscellaneous Assets Increase-
Reinsurance LR012 Miscellaneous Assets Column (2) Line (20) $0 X 0.3500 = $0
(104) Replications LR013 Replication (Synthetic Asset) Transactions and Mandatorily $0 X 0.2625 = $0
Convertible Securities Column (7) Line (9999999)
(105) Reinsurance LR014 Reinsurance Column (4) Line (17) $0 X 0.3500 = $0
(106) Investment Affiliates LR037 Summary for Affiliated Investments Column (4) Line (6) $0 X 0.3500 = $0
(107) Investment in Parent LR037 Summary for Affiliated Investments Column (4) Line (10) $0 X 0.3500 = $0

39
(108)
Other Affiliate: Property and
Casualty Insurers LR037 Summary for Affiliated Investments Column (4) Line (11) $0 X 0.3500 = $0
not Subject to Risk-Based Capital
(109)
Other Affiliate: Life Insurers not
Subject to LR037 Summary for Affiliated Investments Column (4) Line (12) $0 X 0.3500 = $0
Risk-Based Capital
(110) Publicly Traded Insurance Affiliates LR037 Summary for Affiliated Investments Column (4) Line (14) $0 X 0.3500 = $0
(111) Subtotal for C-1o Assets Sum of Lines (1) through (110), Recognizing the Deduction of Lines (013), $0 $0
(035), (043), (048), (055), (060), (068), (076), (083), (091) and (102)
C-0 Affiliated Common Stock
(112) Off-Balance Sheet and Other Items LR015 Off-Balance Sheet and Other Items Column (4) Line (24) + (28) $0 X 0.2625 = $0
(113)
Off-Balance Sheet Items Reduction-
Reinsurance LR015 Off-Balance Sheet and Other Items Column (4) Line (25) $0 X 0.3500 = $0
(114)
Off-Balance Sheet Items Increase-
Reinsurance LR015 Off-Balance Sheet and Other Items Column (4) Line (26) $0 X 0.3500 = $0
(115)
Affiliated US Property-Casualty
Insurers LR037 Summary for Affiliated Investments Column (4) Line (1) $0 X 0.3500 = $0
Directly Owned
(116)
Affiliated US Life Insurers Directly
Owned LR037 Summary for Affiliated Investments Column (4) Line (2) $0 X 0.3500 = $0
(117)
Affiliated US Health Insurers
Directly and LR037 Summary for Affiliated Investments Column (4) Line (3) $0 X 0.3500 = $0
Indirectly Owned
(118)
Affiliated US Property-Casualty
Insurers LR037 Summary for Affiliated Investments Column (4) Line (4) $0 X 0.3500 = $0
Indirectly Owned
(119)
Affiliated US Life Insurers
Indirectly Owned LR037 Summary for Affiliated Investments Column (4) Line (5) $0 X 0.3500 = $0
(120)
Affiliated Alien Life Insurers -
Canadian LR037 Summary for Affiliated Investments Column (4) Line (8) $0 X 0.3500 = $0
(121)
Affiliated Alien Life Insurers - All
Others LR037 Summary for Affiliated Investments Column (4) Line (9) $0 X 0.0000 = $0
(122)
Subtotal for C-0 Affiliated Common
Stock Lines (112)-(113)+(114)+(115)+(116)+(117)+(118)+(119)+(120)+(121) $0 $0
Common Stock
(123) Unaffiliated Common Stock LR005 Unaffiliated Preferred and Common Stock Column (5) Line (26) + $0 X 0.3500 = $0
LR016 Off-Balance Sheet Collateral Column (3) Line (16)
(124) Stock Reduction - Reinsurance LR005 Unaffiliated Preferred and Common Stock Column (5) Line (27) $0 X 0.3500 = $0
(125) Stock Increase - Reinsurance LR005 Unaffiliated Preferred and Common Stock Column (5) Line (28) $0 X 0.3500 = $0
(126) BA Common Stock Unaffiliated LR008 Other Long-Term Assets Column (5) Line (47) $0 X 0.3500 = $0
(127)
BA Common Stock Affiliated - C-
1cs LR008 Other Long-Term Assets Column (5) Line (49.2) $0 X 0.3500 = $0

40
(128)
Common Stock Concentration
Factor LR011 Common Stock Concentration Factor Column (6) Line (6) $0 X 0.3500 = $0
(129)
Affiliated Preferred Stock and
Common Stock - LR037 Summary for Affiliated Investments Column (4) Line (7) $0 X 0.3500 = $0
Holding Company in Excess of
Indirect Subs
(130)
Affiliated Preferred Stock and
Common Stock - LR037 Summary for Affiliated Investments Column (4) Line (13) $0 X 0.3500 = $0
All Other
(131) Total for C-1cs Assets Lines (123) - (124) + (125) + (126) + (127) + (128) + (129) + (130) $0 $0
Insurance Risk
(132) Disability Income Premium LR017 Health Premiums Column (2) Lines (19) through (25) $0 X 0.3500 = $0
(133) Long-Term Care Premium LR017 Health Premiums Column (2) Line (26) + LR021 Long-Term Care $0 X 0.3500 = $0
Column (4) Line (7)
(134) Life Insurance C-2 Risk LR023 Life Insurance Column (2) Line (8) $0 X 0.3500 = $0
(135) Group Insurance C-2 Risk LR023 Life Insurance Column (2) Lines (20) and (21) $0 X 0.3500 = $0
(136)
Disability and Long-Term Care
Health LR022 Health Claim Reserves Column (4) Line (9) + Line (15) $0 X 0.3500 = $0
Claim Reserves
(137) Premium Stabilization Credit LR024 Premium Stabilization Reserves Column (2) Line (10) $0 X 0.0000 = $0
(138) Total C-2 Risk Lines (132) + (133) + (134) + (135) + (136) + (137) $0 $0
(139) Interest Rate Risk C-3a LR025 Interest Rate Risk Column (3) Line (36) $0 X 0.3500 = $0
(140) Health Credit Risk LR026 Health Credit Risk Column (2) Line (7) $0 X 0.0000 = $0
(141) Market Risk LR025 Interest Rate Risk Column (3) Line (37) $0 X 0.3500 = $0
(142) Business Risk LR027 Business Risk Column (2) Line (40) $0 X 0.3500 = $0
(143) Health Administrative Expenses LR027 Business Risk Column (2) Line (57) $0 X 0.0000 = $0
(144) Total Tax Effect Lines (111) + (122) + (131) + (138) + (139) + (140) + (141) + (142) + (143) $0 $0
† Denotes lines that are deducted from the total rather than added.

1
Appendix E

2
RBC Instructions LR003 – Mortgage Experience Adjustment:
LR004 – Mortgages:
LR009 – Schedule BA Mortgages:
LR010 – Asset Concentration Factor:
LR030 – Tax Effect:
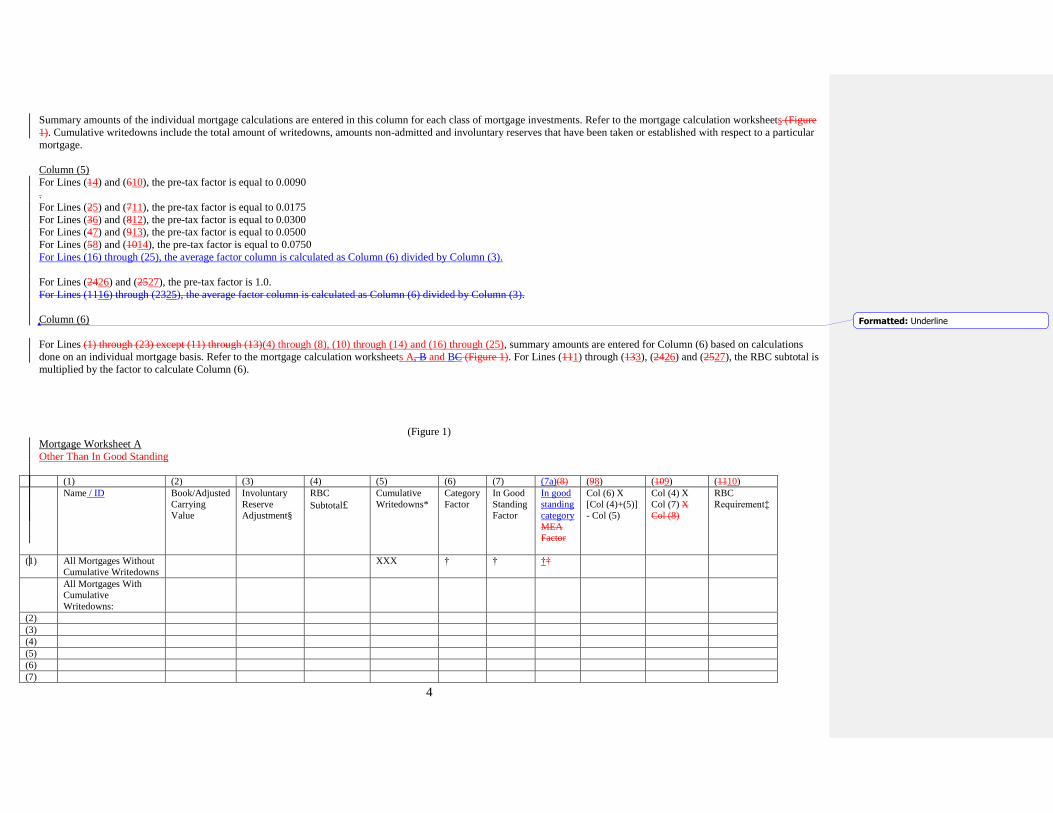
3
MORTGAGES LR004
Basis of Factors
Mortgages in Good Standing
The pre-tax factors for commercial mortgages were developed based on analysis using the Commercial Mortgage Metrics model of Moody’s Analytics and documented in a report
from the American Council of Life Insurers on. October 26, 2012February 15, 2013. The factors provide for differing levels of risk, the levels determined by a contemporaneous
debt service coverage ratio and the contemporaneous loan-to-value. The 0.14 percent pre-tax factor on insured and guaranteed mortgages represents approximately 30-60 days
interest lost due to possible delay in recovery on default. The pre-tax factor of 0.68 percent for residential mortgages reflects a significantly lower risk than commercial mortgages.
The pre-tax factors were developed by dividing the post-tax factor by 0.7375 (0.7375 is calculated by taking 1.0 less the result of 0.75 multiplied by 0.35).
Mortgages 90 Days Overdue, Not in Process of Foreclosure
The category pre-tax factor for commercial and farm mortgages of 18 percent is based on data taken from the Society of Actuaries “Commercial Mortgage Credit Risk Study.” For
insured and guaranteed or residential mortgages, factors are set at twice the level for those “in good standing” to reflect the increased likelihood of default losses.
Mortgages in Process of Foreclosure
Mortgages in process of foreclosure are considered to be as risky as Class 5 bonds and are assigned the same category pre-tax factor of 23 percent for commercial and farm
mortgages.
Due and Unpaid Taxes on Overdue Mortgages and Mortgages in Foreclosure
The factor for due and unpaid taxes on overdue mortgages and mortgages in foreclosure is 100 percent.
Specific Instructions for Application of the Formula
Column (1)
Insured or guaranteed mortgages should be reported separately from residential and commercial mortgages. Insured or guaranteed loans include only those mortgage loans insured
or guaranteed by the Federal Housing Administration, under the National Housing Act (Canada) or by the Veterans Administration (exclusive of any portion insured by FHA.).
Mortgage loans guaranteed by another company (affiliated or unaffiliated) are not to be included in the insured or guaranteed category.
Except for Lines (111) through (133), (2426) and (2527), calculations are done on an individual mortgage basis and then the summary amounts are entered in this column for each
class of mortgage investment. Refer to the mortgage calculation worksheet A (Figure 1) for how the individual mortgage calculations are completed for Other Than In Good
Standing mortgages on Lines (1416) through (2325). Refer to the mortgage calculation worksheet B (Figure 23) for how the individual mortgage calculations are completed for In
Good Standing - Commercial mortgages on Lines (14) through (58)3 and for In Good Standing - Farm mortgages on Lines (610) through (1014). Line (2628) should equal Page
2, Column 3, Lines 3.1 plus 3.2, plus Schedule B, Part 1 Footnotes 3 and 4, first of the two amounts in the footnotes.
Column (2)
Companies are permitted to reduce the book/adjusted carrying value of mortgage loans reported in Schedule B by any involuntary reserves. Involuntary reserves are equivalent to
valuation allowances specified in SSAP No. 37 paragraph 1316. They are non-AVR reserves reported on the Annual Statement Page 3, Line 25. These reserves are held as an
offset for a particular troubled mortgage loan that would be required to be written down if the impairment was permanent.
Column (3)
Column (3) is calculated as the net of Column (1) less Column (2).
Column (4)

4
Summary amounts of the individual mortgage calculations are entered in this column for each class of mortgage investments. Refer to the mortgage calculation worksheets (Figure
1). Cumulative writedowns include the total amount of writedowns, amounts non-admitted and involuntary reserves that have been taken or established with respect to a particular
mortgage.
Column (5)
For Lines (14) and (610), the pre-tax factor is equal to 0.0090
.
For Lines (25) and (711), the pre-tax factor is equal to 0.0175
For Lines (36) and (812), the pre-tax factor is equal to 0.0300
For Lines (47) and (913), the pre-tax factor is equal to 0.0500
For Lines (58) and (1014), the pre-tax factor is equal to 0.0750
For Lines (16) through (25), the average factor column is calculated as Column (6) divided by Column (3).
For Lines (2426) and (2527), the pre-tax factor is 1.0.
For Lines (1116) through (2325), the average factor column is calculated as Column (6) divided by Column (3).
Column (6)
For Lines (1) through (23) except (11) through (13)(4) through (8), (10) through (14) and (16) through (25), summary amounts are entered for Column (6) based on calculations
done on an individual mortgage basis. Refer to the mortgage calculation worksheets A, B and BC (Figure 1). For Lines (111) through (133), (2426) and (2527), the RBC subtotal is
multiplied by the factor to calculate Column (6).
(Figure 1)
Mortgage Worksheet A
Other Than In Good Standing
(1) (2) (3) (4) (5) (6) (7) (7a)(8) (98) (109) (1110)
Name / ID
Book/Adjusted
Carrying
Value
Involuntary
Reserve
Adjustment§
RBC
Subtotal£
Cumulative
Writedowns*
Category
Factor
In Good
Standing
Factor
In good
standing
category
MEA
Factor
Col (6) X
[Col (4)+(5)]
- Col (5)
Col (4) X
Col (7) X
Col (8)
RBC
Requirement‡
(1) All Mortgages Without
Cumulative Writedowns
XXX † †
††
All Mortgages With
Cumulative
Writedowns:
(2)
(3)
(4)
(5)
(6)
(7)
Formatted: Underline

5
(8)
(9)
(10)
(11)
(12)
(13)
(14)
(15)
Total Mortgages
This worksheet is prepared on a loan-by-loan basis for each of the mortgage categories listed in (Figure 2) that are applicable. The Column (2), (3), (5) and (1110) subtotals for
each category are carried over and entered in Columns (1), (2), (4) and (6) of the Mortgages (LR004) in the risk-based capital formula. Small mortgages aggregated into one line
on Schedule B can be treated as one mortgage on this worksheet. NOTE: This worksheet will be available in the risk-based capital filing software.
† See (Figure 2) for factors to use in the calculation. The In Good Standing Factor will be based on the CM category developed in Worksheet B and reported in Column 7a.
‡ The RBC Requirement column is calculated as the greater of Column (98) or Column (109), but not less than zero.
§ Involuntary reserves are reserves held as an offset to a particular asset that is clearly a troubled asset and are included on Page 3, Line 25 of the annual statement.
£ Column (4) is calculated as Column (2) less Column (3).
* Cumulative writedowns include the total amount of writedowns, amounts non-admitted and involuntary reserves that have been taken or established with respect to a particular
mortgage.
(Figure 2)
The mortgage factors are used in conjunction with the mortgage worksheets (Figures 1 and 3) to calculate the RBC Requirement for each individual mortgage. The factors are used
in Columns (6), (7) and (87) of the mortgage worksheet and are dependent on which of the 16 10 mortgage categories below the mortgage falls into. The following factors are used
for each category of mortgages:
Mortgage Factors For Other Than In Good Standing
LR004
Line
Number
Category
Factor†
In Good
Standing
Factor
In Good Standing – Category CM1 N/A‡ N/A‡0.0090
In Good Standing – Category CM2 N/A‡ 0.0175
In Good Standing – Category CM3 N/A‡ 0.0300
In Good Standing – Category CM4 N/A‡ 0.0500
In Good Standing – Category CM5 N/A‡ 0.0750
90 Days Past Due
(1416) Farm Mortgages 0.1800 ‡
(1517) Residential Mortgages-Insured or Guaranteed 0.0027 0.0014
(1618) Residential Mortgages-All Other 0.0140 0.0068
(1719) Commercial Mortgages-Insured or Guaranteed 0.0027 0.0014
(1820) Commercial Mortgages-All Other 0.1800 0‡
In Process of Foreclosure
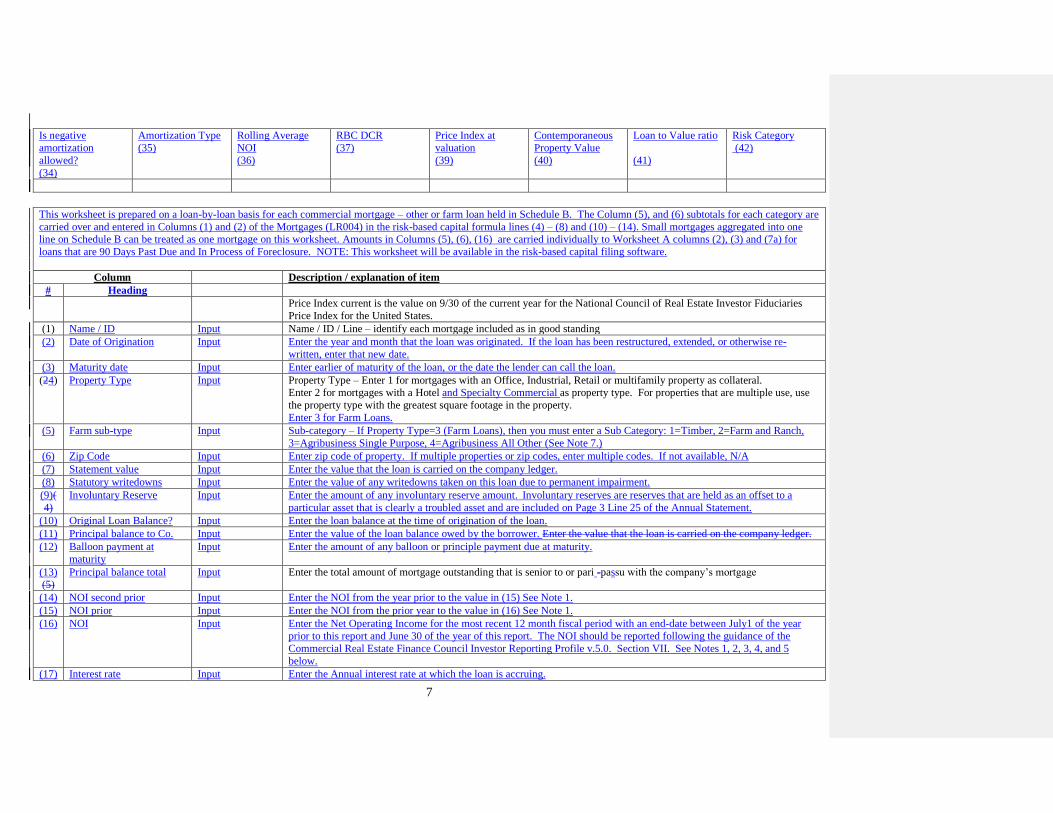
6
(1921) Farm Mortgages 0.2300 ‡
(2022) Residential Mortgages-Insured or Guaranteed 0.0054 0.0014
(2123) Residential Mortgages-All Other 0.0270 0.0068
(2224) Commercial Mortgages-Insured or Guaranteed 0.0054 0.0014
(2325) Commercial Mortgages-All Other 0.2300 ‡
† The category factor is a factor used for a particular category of mortgage loans that are not in good standing.
‡ The RBC Requirement for mortgage loans in good standing are not calculated on Figure (1). These requirements are calculated on Mortgage Worksheet B (Figure 3) and
transferred to LR004 Mortgage Loans Lines (14) through (138) and (10) through (14). In addition, for mortgage loans 90 days past due or In Process of Foreclosure, the CM
category is determined in Worksheet B and transferred to Worksheet A.
(Figure 3)
Mortgage Worksheet B In Good Standing - Commercial
Price Index
current (year end
calculations to be
based off of 3rd
Quarter index of
the given year)}
{input Price Index as of
September 30}
Name / ID / Line
(1)
Date of Origination
(2)
Maturity Date
(3)
Property Type
(4)
Farm Loan sub-
property type
(5)
Zip Code
(6)
Statutory Loan
Value
(7)
Statutory
Write-downs
(8)
Statutory
Involuntary
Reserve
(9)
Original Loan
Balance
(910)
Principal Loan
balance to company
(110)
Balloon Payment at
maturity
(121)
Principal Balance
total
(132)
NOI Second Prior
year
(143)
NOI Prior Year
(154)
NOI
(165)
Interest Rate
(167)
Trailing 12 month
debt service
(187)
Original Property
Value
(198)
Property Value
(20)
Year of valuation
(21)
Calendar Quarter of
Valuation
(22)
Credit
Enhancement?
(23)
(24) Senior Debt
(25) Construction
Loan
Construction Loan
out of Balance
(26)
Construction Loan
Issues (27)
Land Loan
(28)
90 Days Past Due
(29)
In Process of
Foreclosure?
(30)
Current payment
lower than based on
Loan Interest?
(31)
Is loan interest
floating?
(32)
Is fixed rate reset
during term?
(33)
Formatted: Font: 10 pt, Not Bold
Formatted: Font: 10 pt, Not Bold
Formatted: Highlight
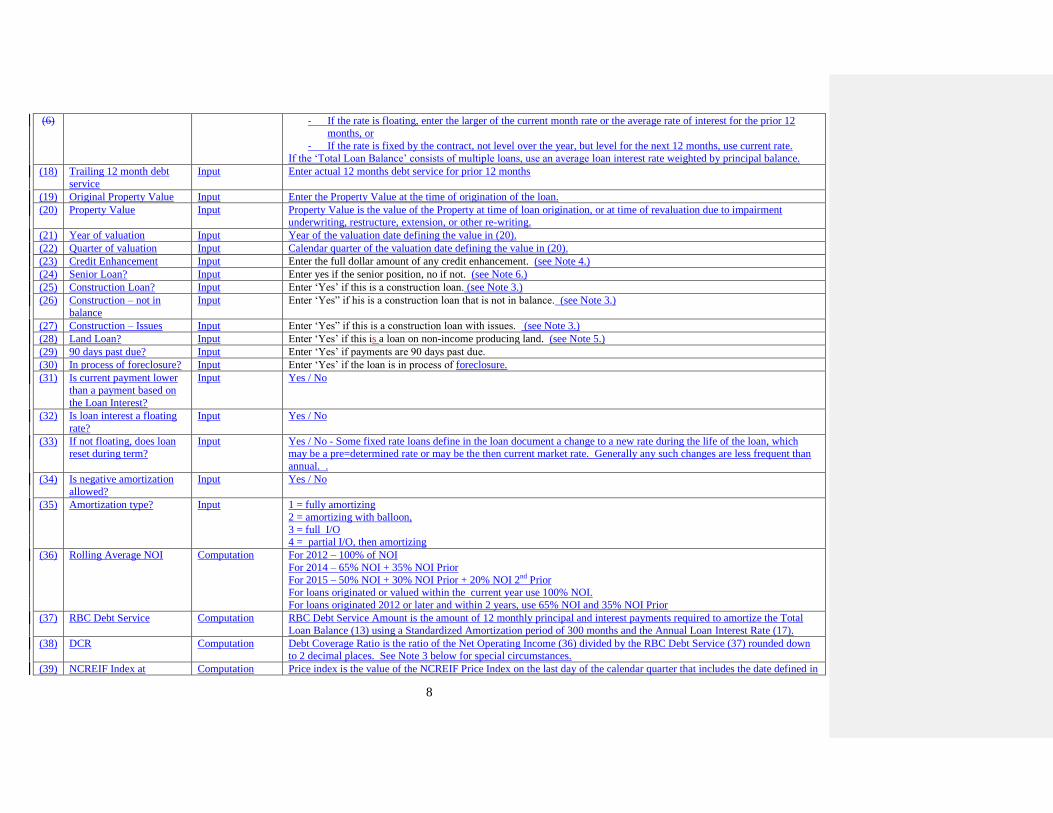
7
Is negative
amortization
allowed?
(34)
Amortization Type
(35)
Rolling Average
NOI
(36)
RBC DCR
(37)
Price Index at
valuation
(39)
Contemporaneous
Property Value
(40)
Loan to Value ratio
(41)
Risk Category
(42)
This worksheet is prepared on a loan-by-loan basis for each commercial mortgage – other or farm loan held in Schedule B. The Column (5), and (6) subtotals for each category are
carried over and entered in Columns (1) and (2) of the Mortgages (LR004) in the risk-based capital formula lines (4) – (8) and (10) – (14). Small mortgages aggregated into one
line on Schedule B can be treated as one mortgage on this worksheet. Amounts in Columns (5), (6), (16) are carried individually to Worksheet A columns (2), (3) and (7a) for
loans that are 90 Days Past Due and In Process of Foreclosure. NOTE: This worksheet will be available in the risk-based capital filing software.
Column Description / explanation of item
# Heading
Price Index current is the value on 9/30 of the current year for the National Council of Real Estate Investor Fiduciaries
Price Index for the United States.
(1) Name / ID Input Name / ID / Line – identify each mortgage included as in good standing
(2) Date of Origination Input Enter the year and month that the loan was originated. If the loan has been restructured, extended, or otherwise re-
written, enter that new date.
(3) Maturity date Input Enter earlier of maturity of the loan, or the date the lender can call the loan.
(24) Property Type Input Property Type – Enter 1 for mortgages with an Office, Industrial, Retail or multifamily property as collateral.
Enter 2 for mortgages with a Hotel and Specialty Commercial as property type. For properties that are multiple use, use
the property type with the greatest square footage in the property.
Enter 3 for Farm Loans.
(5) Farm sub-type Input Sub-category – If Property Type=3 (Farm Loans), then you must enter a Sub Category: 1=Timber, 2=Farm and Ranch,
3=Agribusiness Single Purpose, 4=Agribusiness All Other (See Note 7.)
(6) Zip Code Input Enter zip code of property. If multiple properties or zip codes, enter multiple codes. If not available, N/A
(7) Statement value Input Enter the value that the loan is carried on the company ledger.
(8) Statutory writedowns Input Enter the value of any writedowns taken on this loan due to permanent impairment.
(9)(
4)
Involuntary Reserve Input Enter the amount of any involuntary reserve amount. Involuntary reserves are reserves that are held as an offset to a
particular asset that is clearly a troubled asset and are included on Page 3 Line 25 of the Annual Statement.
(10) Original Loan Balance? Input Enter the loan balance at the time of origination of the loan.
(11) Principal balance to Co. Input Enter the value of the loan balance owed by the borrower. Enter the value that the loan is carried on the company ledger.
(12) Balloon payment at
maturity
Input Enter the amount of any balloon or principle payment due at maturity.
(13)
(5)
Principal balance total Input Enter the total amount of mortgage outstanding that is senior to or pari -passu with the company’s mortgage
(14) NOI second prior Input Enter the NOI from the year prior to the value in (15) See Note 1.
(15) NOI prior Input Enter the NOI from the prior year to the value in (16) See Note 1.
(16) NOI Input Enter the Net Operating Income for the most recent 12 month fiscal period with an end-date between July1 of the year
prior to this report and June 30 of the year of this report. The NOI should be reported following the guidance of the
Commercial Real Estate Finance Council Investor Reporting Profile v.5.0. Section VII. See Notes 1, 2, 3, 4, and 5
below.
(17) Interest rate Input Enter the Annual interest rate at which the loan is accruing.
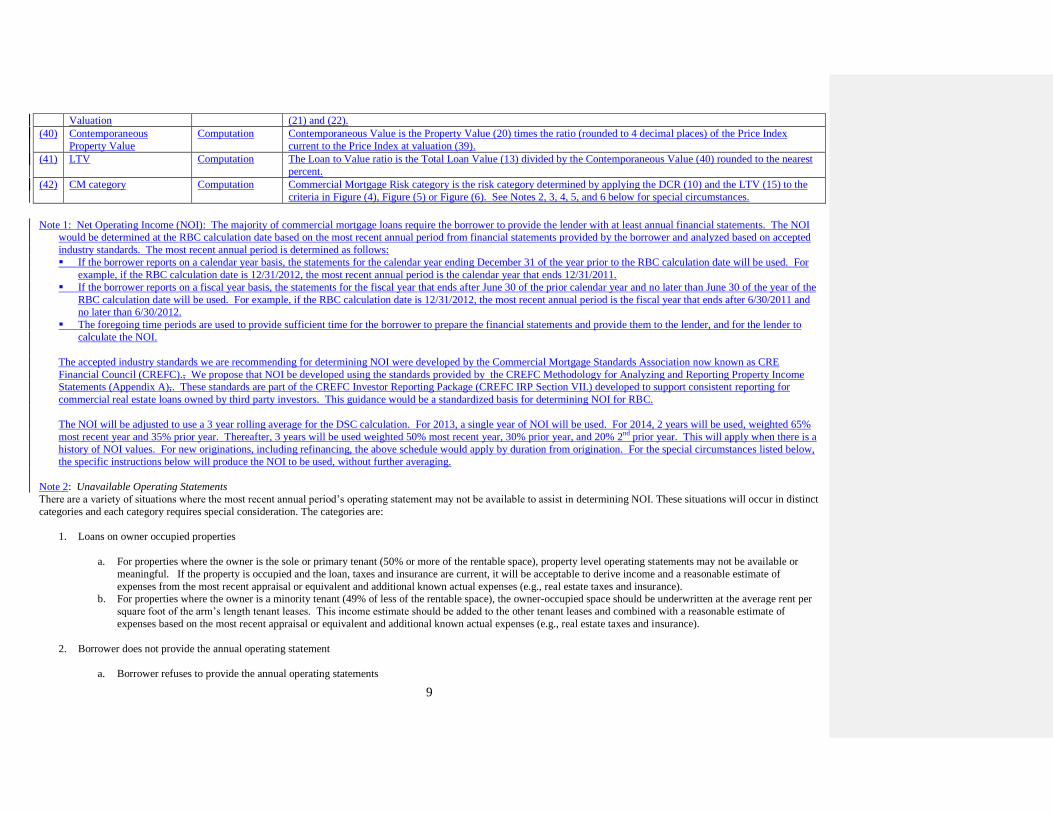
8
(6) - If the rate is floating, enter the larger of the current month rate or the average rate of interest for the prior 12
months, or
- If the rate is fixed by the contract, not level over the year, but level for the next 12 months, use current rate.
If the ‘Total Loan Balance’ consists of multiple loans, use an average loan interest rate weighted by principal balance.
(18) Trailing 12 month debt
service
Input Enter actual 12 months debt service for prior 12 months
(19) Original Property Value Input Enter the Property Value at the time of origination of the loan.
(20) Property Value Input Property Value is the value of the Property at time of loan origination, or at time of revaluation due to impairment
underwriting, restructure, extension, or other re-writing.
(21) Year of valuation Input Year of the valuation date defining the value in (20).
(22) Quarter of valuation Input Calendar quarter of the valuation date defining the value in (20).
(23) Credit Enhancement Input Enter the full dollar amount of any credit enhancement. (see Note 4.)
(24) Senior Loan? Input Enter yes if the senior position, no if not. (see Note 6.)
(25) Construction Loan? Input Enter ‘Yes’ if this is a construction loan. (see Note 3.)
(26) Construction – not in
balance
Input Enter ‘Yes” if his is a construction loan that is not in balance. (see Note 3.)
(27) Construction – Issues Input Enter ‘Yes” if this is a construction loan with issues. (see Note 3.)
(28) Land Loan? Input Enter ‘Yes’ if this is a loan on non-income producing land. (see Note 5.)
(29) 90 days past due? Input Enter ‘Yes’ if payments are 90 days past due.
(30) In process of foreclosure? Input Enter ‘Yes’ if the loan is in process of foreclosure.
(31) Is current payment lower
than a payment based on
the Loan Interest?
Input Yes / No
(32) Is loan interest a floating
rate?
Input Yes / No
(33) If not floating, does loan
reset during term?
Input Yes / No - Some fixed rate loans define in the loan document a change to a new rate during the life of the loan, which
may be a pre=determined rate or may be the then current market rate. Generally any such changes are less frequent than
annual. .
(34) Is negative amortization
allowed?
Input Yes / No
(35) Amortization type? Input 1 = fully amortizing
2 = amortizing with balloon,
3 = full I/O
4 = partial I/O, then amortizing
(36) Rolling Average NOI Computation For 2012 – 100% of NOI
For 2014 – 65% NOI + 35% NOI Prior
For 2015 – 50% NOI + 30% NOI Prior + 20% NOI 2nd
Prior
For loans originated or valued within the current year use 100% NOI.
For loans originated 2012 or later and within 2 years, use 65% NOI and 35% NOI Prior
(37) RBC Debt Service Computation RBC Debt Service Amount is the amount of 12 monthly principal and interest payments required to amortize the Total
Loan Balance (13) using a Standardized Amortization period of 300 months and the Annual Loan Interest Rate (17).
(38) DCR Computation Debt Coverage Ratio is the ratio of the Net Operating Income (36) divided by the RBC Debt Service (37) rounded down
to 2 decimal places. See Note 3 below for special circumstances.
(39) NCREIF Index at Computation Price index is the value of the NCREIF Price Index on the last day of the calendar quarter that includes the date defined in

9
Valuation (21) and (22).
(40) Contemporaneous
Property Value
Computation Contemporaneous Value is the Property Value (20) times the ratio (rounded to 4 decimal places) of the Price Index
current to the Price Index at valuation (39).
(41) LTV Computation The Loan to Value ratio is the Total Loan Value (13) divided by the Contemporaneous Value (40) rounded to the nearest
percent.
(42) CM category Computation Commercial Mortgage Risk category is the risk category determined by applying the DCR (10) and the LTV (15) to the
criteria in Figure (4), Figure (5) or Figure (6). See Notes 2, 3, 4, 5, and 6 below for special circumstances.
Note 1: Net Operating Income (NOI): The majority of commercial mortgage loans require the borrower to provide the lender with at least annual financial statements. The NOI
would be determined at the RBC calculation date based on the most recent annual period from financial statements provided by the borrower and analyzed based on accepted
industry standards. The most recent annual period is determined as follows:
If the borrower reports on a calendar year basis, the statements for the calendar year ending December 31 of the year prior to the RBC calculation date will be used. For
example, if the RBC calculation date is 12/31/2012, the most recent annual period is the calendar year that ends 12/31/2011.
If the borrower reports on a fiscal year basis, the statements for the fiscal year that ends after June 30 of the prior calendar year and no later than June 30 of the year of the
RBC calculation date will be used. For example, if the RBC calculation date is 12/31/2012, the most recent annual period is the fiscal year that ends after 6/30/2011 and
no later than 6/30/2012.
The foregoing time periods are used to provide sufficient time for the borrower to prepare the financial statements and provide them to the lender, and for the lender to
calculate the NOI.
The accepted industry standards we are recommending for determining NOI were developed by the Commercial Mortgage Standards Association now known as CRE
Financial Council (CREFC)., We propose that NOI be developed using the standards provided by the CREFC Methodology for Analyzing and Reporting Property Income
Statements (Appendix A),. These standards are part of the CREFC Investor Reporting Package (CREFC IRP Section VII.) developed to support consistent reporting for
commercial real estate loans owned by third party investors. This guidance would be a standardized basis for determining NOI for RBC.
The NOI will be adjusted to use a 3 year rolling average for the DSC calculation. For 2013, a single year of NOI will be used. For 2014, 2 years will be used, weighted 65%
most recent year and 35% prior year. Thereafter, 3 years will be used weighted 50% most recent year, 30% prior year, and 20% 2nd prior year. This will apply when there is a
history of NOI values. For new originations, including refinancing, the above schedule would apply by duration from origination. For the special circumstances listed below,
the specific instructions below will produce the NOI to be used, without further averaging.
Note 2: Unavailable Operating Statements
There are a variety of situations where the most recent annual period’s operating statement may not be available to assist in determining NOI. These situations will occur in distinct
categories and each category requires special consideration. The categories are:
1. Loans on owner occupied properties
a. For properties where the owner is the sole or primary tenant (50% or more of the rentable space), property level operating statements may not be available or
meaningful. If the property is occupied and the loan, taxes and insurance are current, it will be acceptable to derive income and a reasonable estimate of
expenses from the most recent appraisal or equivalent and additional known actual expenses (e.g., real estate taxes and insurance).
b. For properties where the owner is a minority tenant (49% of less of the rentable space), the owner-occupied space should be underwritten at the average rent per
square foot of the arm’s length tenant leases. This income estimate should be added to the other tenant leases and combined with a reasonable estimate of
expenses based on the most recent appraisal or equivalent and additional known actual expenses (e.g., real estate taxes and insurance).
2. Borrower does not provide the annual operating statement
a. Borrower refuses to provide the annual operating statements

10
i. If the leases are in place and evidenced by estoppels and inspections, NOI would be derived from normalized underwriting in accordance with the
CREFC Methodology for Analyzing and Reporting Property Income Statements.
ii. If there is evidence from inspection that the property is occupied, but there is no evidence of in place leases (e.g., lease documents or estoppels), NOI
would be set equal to the lesser of calculated debt service (DSC=1.0) or the NOI from the normalized underwriting.
iii. If there is no evidence from inspection that the property is occupied and no evidence of in place leases (e.g., lease documents or estoppels), assume NOI
= $0.
b. If the borrower does not have access to a complete previous year operating statement, determine NOI based on the CREFC guidelines for analyzing a partial year
income statement.
3. Note 3: Construction loans
Construction loans would be categorized as follows, based on a determination by the loan servicer whether the loan is in balance and whether construction issues exist:
a. In balance, no construction issues: DSC = 1.0, LTV determined as usual
b. Not in Balance, no construction issues: CM4
c. Construction issues: CM5
A loan is “in balance” if the committed amount of the construction loan plus any lender held reserves and unfunded borrower equity is sufficient to cover the remaining
costs of the development project, including debt service not anticipated to be paid from property operations.
A “construction issue” is a problem that may reasonably jeopardize the completion of the project. Examples of construction issues include the abandonment of
construction and construction defects that are not being addressed.
4. Note 4: Credit enhancements: Where the loan payments are secured by a letter of credit from an investment grade financial institution or an escrow account held at an
investment grade financial institution, NOI less than the debt service may be increased by these amounts until it is equal to but not exceeding the debt service. These situations
are typically short term in nature, and are intended to bridge the lease-up following renovation or loss of a major tenant.
5. Note 5: Non-income-producing land: NOI = $0
Note: 6: Non-senior financing
a. The company should first calculate DSC and LTV for non-senior financing using the standardized debt service and aggregate LTV of all financing pari passu and
senior to the position held by the company.
b. The non-senior piece should than be assigned to the next riskier RBC category. For example, if the DSC and LTV metrics determined in (a) indicate a category
of CM2, the non-senior piece would be assigned to category CM3. However, it would not be required to assign a riskier category than CM5 if the loan is not at
least 90-days delinquent or in foreclosure.
Note 7: Definitions of each type of Farm Mortgage:
Timber: A loan is classified as a timber loan if more than 50% of the collateral market value (land and timber) of the security is attributable to land supporting a timber
crop that is or will be of commercial value.
Formatted: Indent: Left: 0.25", No bullets ornumbering
Formatted: Indent: Left: 0.25", No bullets ornumbering
Formatted: Indent: Left: 0.25", No bullets ornumbering
Formatted: Indent: First line: 0.25"

11
Farm & Ranch: Farm and ranch land utilized in the production of agricultural commodities of all kinds, including grains, cotton, sugar, nuts, fruits, vegetables, forage
crops and livestock of all kinds, including, beef, swine, poultry, fowl and fish. Loans included in this category are those in which agricultural land accounts for more than
50% of total collateral market value.
Agribusiness Single Purpose: Specialized collateral utilized in the production, further processing, adding value or manufacturing of an agricultural commodity or forest
product. In order for a loan to be classified as such, the market value of the single-purpose (special use) collateral would account for more than 50% of total collateral
market value.
This collateral is generally not multi-functional and can only be used for a specific production, manufacturing and/or processing function within a specific sub-sector of
the food or agribusiness industry and whereby such assets are not strategically important in nature to the overall industry capacity. These assets can be shut down or
replicated easily in other locations, or existing plants can be expanded to absorb shuttered capacity. The assets are not generally limited in nature by environmental or
operational permits and/or regulatory requirements. An example would be a poultry processing plant located in the Southeast of the United States where there is excess
capacity inherent to the industry and production capacity is easily replaceable.
Other loans included in this category are those collateralized by single purpose (special use) confinement livestock production facilities in which the special use facilities
account for more than 50% of total collateral market value.
Agribusiness All Other: Multiple-use collateral utilized in the production, further processing, adding value or manufacturing of an agricultural commodity or forest
product. In order for a loan to be classified as such, the market value of any single use portion may not be greater than 50% of total collateral market value.
This collateral is multi-functional in nature, adaptable to other manufacturing, processing, or servicing food or agribusiness industries or sub-industries. Assets could also
be very strategic in nature and not easily replaceable either due to cost, location, environmental permitting and/or government regulations. These assets may be single
purpose in nature, but so vital to the industry capacity needs that they will be generally purchased by another like processing company or strategic or financial buyer. An
example of these types of assets are strategically located and highly automated cold storage facilities whereby they can be used for dry storage, distribution centers or
converted into warehouse or other type uses. Another example may be a cheese processing plant that is strategically located within the heart of the dairy industry, limited
permits, environmental restrictions that would limit added capacity, or high barriers to entry to build a like facility within the industry. For example, one of the largest
cheese plants in the industry is located in California and it is not easily replicated within the cheese processing industry due to its location, capacity, costs, access to fluid
milk supply and related feed and water, as well as highly regulated environmental and government restrictions.
Other loans included in this category are those in which more than 50% of the collateral market value is accounted for by chattel assets or other assets related to the
business and financial operations of agribusinesses, including inventories, accounts, trade receivables, cash and brokerage accounts, machinery, equipment, livestock and
other assets utilized for or generated by agribusiness operations.
(Figure 4)
For Office, Industrial, Retail and Multi-family
Risk category DSC limits LTV limits
CM1 1.50 ≤ DSC >= 1.50 and LTV < 85%
CM2 DSC < 1.50 and LTV < 55%
CM2 0.95 ≤ DSC < 1.50 and 55% ≤ LTV < 75%
CM2 1.15 ≤ DSC < 1.50 and 75% ≤ LTV < 100%

12
CM2 1.50 ≤ DSC >= 1.50 and 85% ≤ LTV < 100%
CM2 1.75 ≤ DSC >= 1.75 and 100% ≤ LTV >= 100%
CM3 DSC < 0.95 and 55% ≤ LTV < 85%
CM3 0.95 ≤ DSC < 1.15 and 75% ≤ LTV < 100%
CM3 1.15 ≤ DSC < 1.75 and 100% ≤ LTV >= 100%
CM4 DSC < 0.95 and 85% ≤ LTV < 105%
CM4 0.95 ≤ DSC < 1.15 and 100% ≤ LTV >= 100%
CM5 DSC < 0.95 and 105% ≤ LTV >= 100%
(Figure 5)
For Hotels and Specialty Commercial (excluding Agriculture)
Risk category DSC limits LTV limits
CM1 1.85 ≤ DSC >= 1.85 and LTV < 60%
CM2 1.45 ≤ DSC < 1.85 and LTV < 70%
CM2 1.85 ≤ DSC >= 1.85 and 60% ≤ LTV < 115%
CM3 0.90 ≤ DSC < 1.45 and ≤ LTV < 80%
CM3 1.45 ≤ DSC < 1.85 and 70% ≤ LTV >= 70%
CM3 1.85 ≤ DSC >= 1.85 and 115% ≤ LTV >= 115%
CM4 DSC < 0. 90 and LTV < 90%
CM4 0.90 ≤ DSC < 1.10 and 80% ≤ LTV < 90%
CM4 1.10 ≤ DSC < 1.45 and 80% ≤ LTV >= 80%
CM5 1.10 ≤ DSC >= 1.10 and 90% ≤ LTV >= 90%
(Figure 76)
Timber Farm & Ranch
Agribusiness
Single Purpose
Agribusiness
All Other
CM1 LTV <= 55% LTV <= 60% LTV <= 60%
CM2 55% < LTV <= 65% 60% < LTV <= 70% LTV <= 60% 60% < LTV <= 70%
CM3 65% < LTV <= 85% 70% < LTV <= 90% 60% < LTV <= 70% 70% < LTV <= 90%
CM4 85% < LTV <= 105% 90% < LTV <= 110% 70% < LTV <= 90% 90% < LTV <= 110%
CM5 105% < LTV 110% < LTV 90% < LTV 110% < LTV

13
SCHEDULE BA MORTGAGES
LR009
Basis of Factors
For Affiliated Mortgages (Line 10999999), the factors used are the same as for Schedule B commercial mortgages and are defined in Figure 9. Risk categories and factors are
determined using Worksheet B (Figure 10) for In Good Standing and Figure 8 & 10 for Past Due or In Process of Foreclosure.
For Unaffiliated Mortgages, (Line 0999999), the factors used are the same as for commercial mortgages and are defined in Figure 9. Risk categories and factors are determined as
follows:
1) For Investments that contain covenants whereby factors of maximum LTV and minimum DSC, or equivalent thresholds must be complied with and it can be
determined that the Investments are in compliance, these investments would use the process for directly held mortgages using the maximum LTV and minimum DSC
using Worksheet B (Figure 10) and transferred to LR009 lines (1) for mortgages with covenants that are in compliance.
2) Investments that are defeased with government securities will be assigned to CM1.
3) Other investments comprised primarily of senior debt will be assigned to CM2.
4) All other investments in this category will be assigned CM3. This would include assets such as a mortgage fund that invests in mezzanine or sub debt, or investments
that cannot be determined to be in compliance with the covenants.
Specific Instructions for Application of the Formula
Column (1)
Line (17) should equal Schedule BA Part 1, Column 14, Line 0999999 plus Line 1099999.
Column (2)
Companies are permitted to reduce the book/adjusted carrying value of mortgage loans reported in Schedule BA by any involuntary reserves. Involuntary reserves are equivalent to
valuation allowances specified in the codification of statutory accounting principles. They are non-AVR reserves reported on Annual Statement Page 3, Line 25. These reserves are
held as an offset for a particular troubled Schedule BA mortgage loan that would be required to be written down if the impairment was permanent.
Column (3)
Column (3) is calculated as the net of Column (1) less Column (2).
Column (4)
For Lines (4) through (7), summary amounts of the individual mortgage calculations are entered in this column for each class of mortgage investments. Refer to the Schedule BA
mortgage calculation worksheet (Figure 4).
Column (5)
See Figure 9 for computation of appropriate factors.
Column (6)

14
For Lines (1) through (3) the RBC subtotal is multiplied by the factor to calculate Column (6).
For Lines (4) through (7), summary amounts are entered for Column (6) based on calculations done on an individual mortgage basis. Refer to the Schedule BA mortgage
calculation worksheet (Figure 10).
(Figure 18)
Schedule BA Mortgage Worksheet A
Affiliated Other Than in Good Standing (1) (2) (3) (4) (5) (6) (7) (7a) (8) (9) (10)
Name / ID
Book/Adjusted
Carrying
Value
Involuntary
Reserve
Adjustment§
RBC
Subtotal£
Cumulative
Writedowns*
Category
Factor
In Good
Standing
Factor
In good
standing
category
Col (6) X
[Col (4)+(5)]
- Col (5)
Col (4) X
Col (7)
RBC
Requirement‡
(1) All Mortgages Without
Cumulative Writedowns
XXX † †
†
All Mortgages With
Cumulative
Writedowns:
(2)
(3)
(4)
(5)
(6)
(7)
(8)
(9)
(10)
(11)
(12)
(13)
(14)
(15)
Total Mortgages
This worksheet is prepared on a loan-by-loan basis for each of the mortgage categories listed in (Figure 29) that are applicable. The Column (2), (3), (5) and (1110) subtotals for
each category are carried over and entered in Columns (1), (2), (4) and (6) of the Mortgages (LR0094) in the risk-based capital formula. Small mortgages aggregated into one line
on Schedule BA can be treated as one mortgage on this worksheet. NOTE: This worksheet will be available in the risk-based capital filing software.
† See (Figure 29) for factors to use in the calculation. The In Good Standing Factor will be based on the CM category developed in Worksheet B and reported in Column 7a.
‡ The RBC Requirement column is calculated as the greater of Column (98) or Column (109), but not less than zero.
§ Involuntary reserves are reserves held as an offset to a particular asset that is clearly a troubled asset and are included on Page 3, Line 25 of the annual statement.
£ Column (4) is calculated as Column (2) less Column (3).
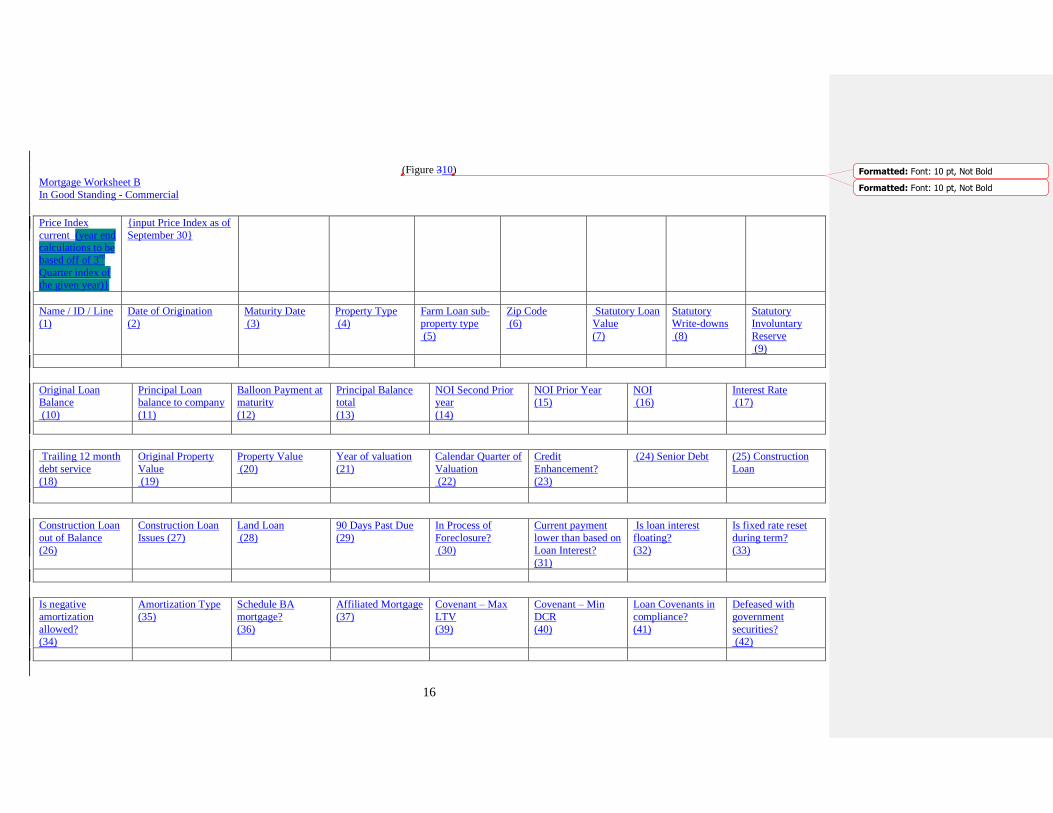
15
* Cumulative writedowns include the total amount of writedowns, amounts non-admitted and involuntary reserves that have been taken or established with respect to a particular
mortgage.
(Figure 29)
The mortgage factors are used in conjunction with the mortgage worksheets (Figures 18 and 10) to calculate the RBC Requirement for each individual mortgage in an affiliated
structure. The factors are used in Columns (6), (7) and (87) of the mortgage worksheet and are dependent on which of the 16 10 mortgage categories below the mortgage falls into.
Residential Mortgages and Commercial Mortgages Insured or Guaranteed are classified as Category CM1. The following factors are used for each category of mortgages:
Schedule BA Mortgage Factors
LR0094
Line
Number
Category
Factor†
In Good
Standing
Factor
(2) Unaffiliated – defeased with government securities N/A‡ 0.0090
(3) Unaffiliated investments comprised primarily of
Senior Debt
N/A‡ 0.0175
(4) Unaffiliated – all other unaffiliated mortgages N/A‡ 0.0300
Various In Good Standing – Category CM1 N/A‡ N/A‡0.0090
Various In Good Standing – Category CM2 N/A‡ 0.0175
Various In Good Standing – Category CM3 N/A‡ 0.0300
Various In Good Standing – Category CM4 N/A‡ 0.0500
Various In Good Standing – Category CM5 N/A‡ 0.0750
90 Days Overdue, not in process of foreclosure
(14116) Farm MortgagesUnaffiliated 0.1800 ‡
(15127) Residential Mortgages-Insured or
GuaranteedAffiliated
0.00270.1800 0.0014‡
(1618) Residential Mortgages-All Other 0.0140 0.0068
(1719) Commercial Mortgages-Insured or Guaranteed 0.0027 0.0014
(1820) Commercial Mortgages-All Other 0.1800 ‡
In Process of Foreclosure
(19214) Farm MortgagesUnaffiliated 0.2300 ‡
(202215) AffiliatedResidential Mortgages-Insured or
Guaranteed
0.00540.2300 0.0014‡
(2123) Residential Mortgages-All Other 0.0270 0.0068
(2224) Commercial Mortgages-Insured or Guaranteed 0.0054 0.0014
(2325) Commercial Mortgages-All Other 0.2300 ‡
† The category factor is a factor used for a particular category of mortgage loans that are not in good standing.
‡ The RBC Requirement for mortgage loans in good standing are not calculated on Figure (18). These requirements are calculated on Schedule BA Mortgage Worksheet B and
transferred to LR0049 Schedule BA Mortgage Loans Lines (12) and (6) – (10). through (138) and (10) through (14).

16
(Figure 310)
Mortgage Worksheet B In Good Standing - Commercial
Price Index
current (year end
calculations to be
based off of 3rd
Quarter index of
the given year)}
{input Price Index as of
September 30}
Name / ID / Line
(1)
Date of Origination
(2)
Maturity Date
(3)
Property Type
(4)
Farm Loan sub-
property type
(5)
Zip Code
(6)
Statutory Loan
Value
(7)
Statutory
Write-downs
(8)
Statutory
Involuntary
Reserve
(9)
Original Loan
Balance
(10)
Principal Loan
balance to company
(11)
Balloon Payment at
maturity
(12)
Principal Balance
total
(13)
NOI Second Prior
year
(14)
NOI Prior Year
(15)
NOI
(16)
Interest Rate
(17)
Trailing 12 month
debt service
(18)
Original Property
Value
(19)
Property Value
(20)
Year of valuation
(21)
Calendar Quarter of
Valuation
(22)
Credit
Enhancement?
(23)
(24) Senior Debt
(25) Construction
Loan
Construction Loan
out of Balance
(26)
Construction Loan
Issues (27)
Land Loan
(28)
90 Days Past Due
(29)
In Process of
Foreclosure?
(30)
Current payment
lower than based on
Loan Interest?
(31)
Is loan interest
floating?
(32)
Is fixed rate reset
during term?
(33)
Is negative
amortization
allowed?
(34)
Amortization Type
(35)
Schedule BA
mortgage?
(36)
Affiliated Mortgage
(37)
Covenant – Max
LTV
(39)
Covenant – Min
DCR
(40)
Loan Covenants in
compliance?
(41)
Defeased with
government
securities?
(42)
Formatted: Font: 10 pt, Not Bold
Formatted: Font: 10 pt, Not Bold
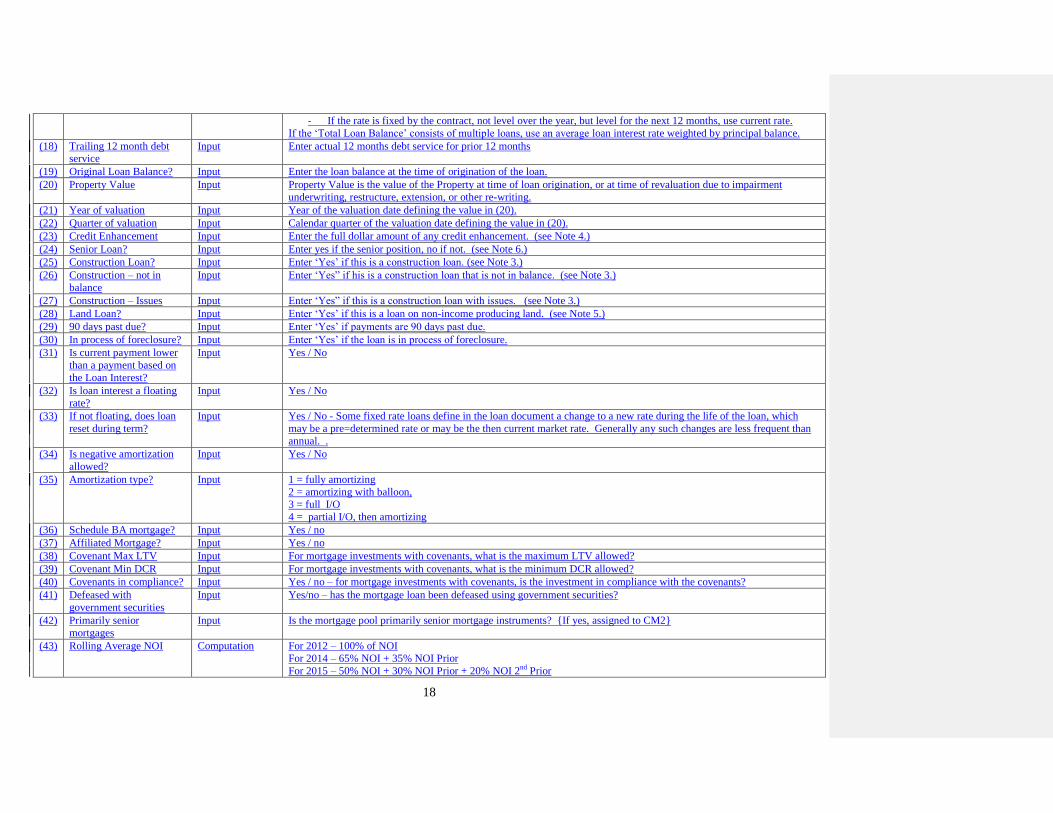
17
Primarily Senior
positions?
(43)
Rolling Average
NOI
(44)
RBC DCR
(45)
Price Index at
valuation
(46)
Contemporaneous
Property Value
(47)
Loan to Value ratio
(48)
Risk Category
(49)
This worksheet is prepared on a loan-by-loan basis for each commercial mortgage – other or farm loan held in Schedule B. The Column (5), and (6) subtotals for each category are
carried over and entered in Columns (1) and (2) of the Mortgages (LR004) in the risk-based capital formula lines (4) – (8) and (10) – (14). Small mortgages aggregated into one
line on Schedule B can be treated as one mortgage on this worksheet. Amounts in Columns (5), (6), (16) are carried individually to Worksheet A columns (2), (3) and (7a) for
loans that are 90 Days Past Due and In Process of Foreclosure. NOTE: This worksheet will be available in the risk-based capital filing software.
Column Description / explanation of item
# Heading
Price Index current is the value on 9/30 of the current year for the National Council of Real Estate Investor Fiduciaries
Price Index for the United States.
(1) Name / ID Input Name / ID / Line – identify each mortgage included as in good standing
(2) Date of Origination Input Enter the year and month that the loan was originated. If the loan has been restructured, extended, or otherwise re-
written, enter that new date.
(3) Maturity date Input Enter earlier of maturity of the loan, or the date the lender can call the loan.
(4) Property Type Input Property Type – Enter 1 for mortgages with an Office, Industrial, Retail or multifamily property as collateral.
Enter 2 for mortgages with a Hotel and Specialty Commercial as property type. For properties that are multiple use, use
the property type with the greatest square footage in the property.
Enter 3 for Farm Loans.
(5) Farm sub-type Input Sub-category – If Property Type=3 (Farm Loans), then you must enter a Sub Category: 1=Timber, 2=Farm and Ranch,
3=Agribusiness Single Purpose, 4=Agribusiness All Other (See Note 7.)
(6) Zip Code Input Enter zip code of property. If multiple properties or zip codes, enter multiple codes. If not available, N/A
(7) Statement value Input Enter the value that the loan is carried on the company ledger.
(8) Statutory writedowns Input Enter the value of any writedowns taken on this loan due to permanent impairment.
(9) Involuntary Reserve Input Enter the amount of any involuntary reserve amount. Involuntary reserves are reserves that are held as an offset to a
particular asset that is clearly a troubled asset and are included on Page 3 Line 25 of the Annual Statement.
(10) Original Loan Balance? Input Enter the loan balance at the time of origination of the loan.
(11) Principal balance to Co. Input Enter the value of the loan balance owed by the borrower.
(12) Balloon payment at
maturity
Input Enter the amount of any balloon or principle payment due at maturity.
(13) Principal balance total Input Enter the total amount of mortgage outstanding that is senior to or pari passu with the company’s mortgage
(14) NOI second prior Input Enter the NOI from the year prior to the value in (15) See Note 1.
(15) NOI prior Input Enter the NOI from the prior year to the value in (16) See Note 1.
(16) NOI Input Enter the Net Operating Income for the most recent 12 month fiscal period with an end-date between July1 of the year
prior to this report and June 30 of the year of this report. The NOI should be reported following the guidance of the
Commercial Real Estate Finance Council Investor Reporting Profile v.5.0. Section VII. See Notes 1, 2, 3, 4, and 5
below.
(17) Interest rate Input Enter the Annual interest rate at which the loan is accruing.
- If the rate is floating, enter the larger of the current month rate or the average rate of interest for the prior 12
months, or

18
- If the rate is fixed by the contract, not level over the year, but level for the next 12 months, use current rate.
If the ‘Total Loan Balance’ consists of multiple loans, use an average loan interest rate weighted by principal balance.
(18) Trailing 12 month debt
service
Input Enter actual 12 months debt service for prior 12 months
(19) Original Loan Balance? Input Enter the loan balance at the time of origination of the loan.
(20) Property Value Input Property Value is the value of the Property at time of loan origination, or at time of revaluation due to impairment
underwriting, restructure, extension, or other re-writing.
(21) Year of valuation Input Year of the valuation date defining the value in (20).
(22) Quarter of valuation Input Calendar quarter of the valuation date defining the value in (20).
(23) Credit Enhancement Input Enter the full dollar amount of any credit enhancement. (see Note 4.)
(24) Senior Loan? Input Enter yes if the senior position, no if not. (see Note 6.)
(25) Construction Loan? Input Enter ‘Yes’ if this is a construction loan. (see Note 3.)
(26) Construction – not in
balance
Input Enter ‘Yes” if his is a construction loan that is not in balance. (see Note 3.)
(27) Construction – Issues Input Enter ‘Yes” if this is a construction loan with issues. (see Note 3.)
(28) Land Loan? Input Enter ‘Yes’ if this is a loan on non-income producing land. (see Note 5.)
(29) 90 days past due? Input Enter ‘Yes’ if payments are 90 days past due.
(30) In process of foreclosure? Input Enter ‘Yes’ if the loan is in process of foreclosure.
(31) Is current payment lower
than a payment based on
the Loan Interest?
Input Yes / No
(32) Is loan interest a floating
rate?
Input Yes / No
(33) If not floating, does loan
reset during term?
Input Yes / No - Some fixed rate loans define in the loan document a change to a new rate during the life of the loan, which
may be a pre=determined rate or may be the then current market rate. Generally any such changes are less frequent than
annual. .
(34) Is negative amortization
allowed?
Input Yes / No
(35) Amortization type? Input 1 = fully amortizing
2 = amortizing with balloon,
3 = full I/O
4 = partial I/O, then amortizing
(36) Schedule BA mortgage? Input Yes / no
(37) Affiliated Mortgage? Input Yes / no
(38) Covenant Max LTV Input For mortgage investments with covenants, what is the maximum LTV allowed?
(39) Covenant Min DCR Input For mortgage investments with covenants, what is the minimum DCR allowed?
(40) Covenants in compliance? Input Yes / no – for mortgage investments with covenants, is the investment in compliance with the covenants?
(41) Defeased with
government securities
Input Yes/no – has the mortgage loan been defeased using government securities?
(42) Primarily senior
mortgages
Input Is the mortgage pool primarily senior mortgage instruments? {If yes, assigned to CM2}
(43) Rolling Average NOI Computation For 2012 – 100% of NOI
For 2014 – 65% NOI + 35% NOI Prior
For 2015 – 50% NOI + 30% NOI Prior + 20% NOI 2nd
Prior

19
For loans originated or valued within the current year use 100% NOI.
For loans originated 2012 or later and within 2 years, use 65% NOI and 35% NOI Prior
(44) RBC Debt Service Computation RBC Debt Service Amount is the amount of 12 monthly principal and interest payments required to amortize the Total
Loan Balance (13) using a Standardized Amortization period of 300 months and the Annual Loan Interest Rate (17).
(45) DCR Computation Debt Coverage Ratio is the ratio of the Net Operating Income (43) divided by the RBC Debt Service (44) rounded down
to 2 decimal places. See Note 3 below for special circumstances. For loan pools with covenants, this will be the minimum
DCR by covenant.
(46) NCREIF Index at
Valuation
Computation Price index is the value of the NCREIF Price Index on the last day of the calendar quarter that includes the date defined in
(21) and (22).
(47) Contemporaneous
Property Value
Computation Contemporaneous Value is the Property Value (11) times the ratio (rounded to 4 decimal places) of the Price Index
current to the Price Index (46).
(48) LTV Computation The Loan to Value ratio is the Loan Value (13) divided by the Contemporaneous Value (47) rounded to the nearest
percent.
For Loan Pools with covenants, this will be the max LTV by covenant.
(40) CM category Computation Commercial Mortgage Risk category is the risk category determined by applying the DCR (10) and the LTV (15) to the
criteria in Figure (4), Figure (5) or Figure (6). See Notes 2, 3, 4, 5, and 6 below for special circumstances.
If (41) = yes, CM1. If (42) = yes, CM2. If no LTV and DCR, and (41) = no and (42) = no, CM3.
Note 1: Net Operating Income (NOI): The majority of commercial mortgage loans require the borrower to provide the lender with at least annual financial statements. The NOI
would be determined at the RBC calculation date based on the most recent annual period from financial statements provided by the borrower and analyzed based on accepted
industry standards. The most recent annual period is determined as follows:
If the borrower reports on a calendar year basis, the statements for the calendar year ending December 31 of the year prior to the RBC calculation date will be used. For
example, if the RBC calculation date is 12/31/2012, the most recent annual period is the calendar year that ends 12/31/2011.
If the borrower reports on a fiscal year basis, the statements for the fiscal year that ends after June 30 of the prior calendar year and no later than June 30 of the year of the
RBC calculation date will be used. For example, if the RBC calculation date is 12/31/2012, the most recent annual period is the fiscal year that ends after 6/30/2011 and
no later than 6/30/2012.
The foregoing time periods are used to provide sufficient time for the borrower to prepare the financial statements and provide them to the lender, and for the lender to
calculate the NOI.
The accepted industry standards we are recommending for determining NOI were developed by the Commercial Mortgage Standards Association now known as CRE
Financial Council (CREFC). We propose that NOI be developed using the standards provided by the CREFC Methodology for Analyzing and Reporting Property Income
Statements (Appendix A). These standards are part of the CREFC Investor Reporting Package (CREFC IRP Section VII.) developed to support consistent reporting for
commercial real estate loans owned by third party investors. This guidance would be a standardized basis for determining NOI for RBC.
The NOI will be adjusted to use a 3 year rolling average for the DSC calculation. For 2013, a single year of NOI will be used. For 2014, 2 years will be used, weighted 65%
most recent year and 35% prior year. Thereafter, 3 years will be used weighted 50% most recent year, 30% prior year, and 20% 2nd
prior year. This will apply when there is a
history of NOI values. For new originations, including refinancing, the above schedule would apply by duration from origination. For the special circumstances listed below,
the specific instructions below will produce the NOI to be used, without further averaging.
Note 2: Unavailable Operating Statements
There are a variety of situations where the most recent annual period’s operating statement may not be available to assist in determining NOI. These situations will occur in distinct
categories and each category requires special consideration. The categories are:
3. Loans on owner occupied properties

20
a. For properties where the owner is the sole or primary tenant (50% or more of the rentable space), property level operating statements may not be available or
meaningful. If the property is occupied and the loan, taxes and insurance are current, it will be acceptable to derive income and a reasonable estimate of
expenses from the most recent appraisal or equivalent and additional known actual expenses (e.g., real estate taxes and insurance).
b. For properties where the owner is a minority tenant (49% of less of the rentable space), the owner-occupied space should be underwritten at the average rent per
square foot of the arm’s length tenant leases. This income estimate should be added to the other tenant leases and combined with a reasonable estimate of
expenses based on the most recent appraisal or equivalent and additional known actual expenses (e.g., real estate taxes and insurance).
4. Borrower does not provide the annual operating statement
a. Borrower refuses to provide the annual operating statements
i. If the leases are in place and evidenced by estoppels and inspections, NOI would be derived from normalized underwriting in accordance with the
CREFC Methodology for Analyzing and Reporting Property Income Statements.
ii. If there is evidence from inspection that the property is occupied, but there is no evidence of in place leases (e.g., lease documents or estoppels), NOI
would be set equal to the lesser of calculated debt service (DSC=1.0) or the NOI from the normalized underwriting.
iii. If there is no evidence from inspection that the property is occupied and no evidence of in place leases (e.g., lease documents or estoppels), assume NOI
= $0.
b. If the borrower does not have access to a complete previous year operating statement, determine NOI based on the CREFC guidelines for analyzing a partial year
income statement.
Note 3: Construction loans
Construction loans would be categorized as follows, based on a determination by the loan servicer whether the loan is in balance and whether construction issues exist:
d. In balance, no construction issues: DSC = 1.0, LTV determined as usual
e. Not in Balance, no construction issues: CM4
f. Construction issues: CM5
A loan is “in balance” if the committed amount of the construction loan plus any lender held reserves and unfunded borrower equity is sufficient to cover the remaining
costs of the development project, including debt service not anticipated to be paid from property operations.
A “construction issue” is a problem that may reasonably jeopardize the completion of the project. Examples of construction issues include the abandonment of
construction and construction defects that are not being addressed.
Note 4: Credit enhancements: Where the loan payments are secured by a letter of credit from an investment grade financial institution or an escrow account held at an
investment grade financial institution, NOI less than the debt service may be increased by these amounts until it is equal to but not exceeding the debt service. These situations
are typically short term in nature, and are intended to bridge the lease-up following renovation or loss of a major tenant.
Note 5: Non-income-producing land: NOI = $0
Note 6: Non-senior financing
c. The company should first calculate DSC and LTV for non-senior financing using the standardized debt service and aggregate LTV of all financing pari passu and
senior to the position held by the company.

21
d. The non-senior piece should than be assigned to the next riskier RBC category. For example, if the DSC and LTV metrics determined in (a) indicate a category
of CM2, the non-senior piece would be assigned to category CM3. However, it would not be required to assign a riskier category than CM5 if the loan is not at
least 90-days delinquent or in foreclosure.
Note 7: Definitions of each type of Farm Mortgage:
Timber: A loan is classified as a timber loan if more than 50% of the collateral market value (land and timber) of the security is attributable to land supporting a timber
crop that is or will be of commercial value.
Farm & Ranch: Farm and ranch land utilized in the production of agricultural commodities of all kinds, including grains, cotton, sugar, nuts, fruits, vegetables, forage
crops and livestock of all kinds, including, beef, swine, poultry, fowl and fish. Loans included in this category are those in which agricultural land accounts for more than
50% of total collateral market value.
Agribusiness Single Purpose: Specialized collateral utilized in the production, further processing, adding value or manufacturing of an agricultural commodity or forest
product. In order for a loan to be classified as such, the market value of the single-purpose (special use) collateral would account for more than 50% of total collateral
market value.
This collateral is generally not multi-functional and can only be used for a specific production, manufacturing and/or processing function within a specific sub-sector of
the food or agribusiness industry and whereby such assets are not strategically important in nature to the overall industry capacity. These assets can be shut down or
replicated easily in other locations, or existing plants can be expanded to absorb shuttered capacity. The assets are not generally limited in nature by environmental or
operational permits and/or regulatory requirements. An example would be a poultry processing plant located in the Southeast of the United States where there is excess
capacity inherent to the industry and production capacity is easily replaceable.
Other loans included in this category are those collateralized by single purpose (special use) confinement livestock production facilities in which the special use facilities
account for more than 50% of total collateral market value.
Agribusiness All Other: Multiple-use collateral utilized in the production, further processing, adding value or manufacturing of an agricultural commodity or forest
product. In order for a loan to be classified as such, the market value of any single use portion may not be greater than 50% of total collateral market value.
This collateral is multi-functional in nature, adaptable to other manufacturing, processing, or servicing food or agribusiness industries or sub-industries. Assets could also
be very strategic in nature and not easily replaceable either due to cost, location, environmental permitting and/or government regulations. These assets may be single
purpose in nature, but so vital to the industry capacity needs that they will be generally purchased by another like processing company or strategic or financial buyer. An
example of these types of assets are strategically located and highly automated cold storage facilities whereby they can be used for dry storage, distribution centers or
converted into warehouse or other type uses. Another example may be a cheese processing plant that is strategically located within the heart of the dairy industry, limited
permits, environmental restrictions that would limit added capacity, or high barriers to entry to build a like facility within the industry. For example, one of the largest
cheese plants in the industry is located in California and it is not easily replicated within the cheese processing industry due to its location, capacity, costs, access to fluid
milk supply and related feed and water, as well as highly regulated environmental and government restrictions.
Other loans included in this category are those in which more than 50% of the collateral market value is accounted for by chattel assets or other assets related to the
business and financial operations of agribusinesses, including inventories, accounts, trade receivables, cash and brokerage accounts, machinery, equipment, livestock and
other assets utilized for or generated by agribusiness operations.

22
(Figure 411)
For Office, Industrial, Retail and Multi-family
Risk category DSC limits LTV limits
CM1 1.50 ≤ DSC and LTV < 85%
CM2 DSC < 1.50 and LTV < 55%
CM2 0.95 ≤ DSC < 1.50 and 55% ≤ LTV < 75%
CM2 1.15 ≤ DSC < 1.50 and 75% ≤ LTV < 100%
CM2 1.50 ≤ DSC and 85% ≤ LTV < 100%
CM2 1.75 ≤ DSC and 100% ≤ LTV
CM3 DSC < 0.95 and 55% ≤ LTV < 85%
CM3 0.95 ≤ DSC < 1.15 and 75% ≤ LTV < 100%
CM3 1.15 ≤ DSC < 1.75 and 100% ≤ LTV
CM4 DSC < 0.95 and 85% ≤ LTV < 105%
CM4 0.95 ≤ DSC < 1.15 and 100% ≤ LTV
CM5 DSC < 0.95 and 105% ≤ LTV
(Figure 512)
For Hotels and Specialty Commercial
Risk category DSC limits LTV limits
CM1 1.85 ≤ DSC and LTV < 60%
CM2 1.45 ≤ DSC < 1.85 and LTV < 70%
CM2 1.85 ≤ DSC and 60% ≤ LTV < 115%
CM3 0.90 ≤ DSC < 1.45 and ≤ LTV < 80%
CM3 1.45 ≤ DSC < 1.85 and 70% ≤ LTV
CM3 1.85 ≤ DSC and 115% ≤ LTV
CM4 DSC < 0. 90 and LTV < 90%
CM4 0.90 ≤ DSC < 1.10 and 80% ≤ LTV < 90%
CM4 1.10 ≤ DSC < 1.45 and 80% ≤ LTV
CM5 1.10 ≤ DSC and 90% ≤ LTV
(Figure 13)
For Farm Loans:
Timber Farm & Ranch
Agribusiness
Single Purpose
Agribusiness
All Other

23
CM1 LTV <= 55% LTV <= 60% LTV <= 60%
CM2 55% < LTV <= 65% 60% < LTV <= 70% LTV <= 60% 60% < LTV <= 70%
CM3 65% < LTV <= 85% 70% < LTV <= 90% 60% < LTV <= 70% 70% < LTV <= 90%
CM4 85% < LTV <= 105% 90% < LTV <= 110% 70% < LTV <= 90% 90% < LTV <= 110%
CM5 105% < LTV 110% < LTV 90% < LTV 110% < LTV

24
ASSET CONCENTRATION FACTOR
LR010
Basis of Factors
The purpose of the concentration factor is to reflect the additional risk of high concentrations in single exposures (represented by an individual issuer of a security or a holder of a
mortgage, etc.) The concentration factor doubles the risk-based capital pre-tax factor (with a maximum of 45 percent pre-tax) of the 10 largest asset exposures excluding various
low risk categories or categories that already have a maximum factor. Since the risk-based capital of the assets included in the concentration factor has already been counted once
in the basic formula, this factor itself only serves to add in the additional risk-based capital required. The calculation is completed on a consolidated basis; however, the
concentration factor is reduced by amounts already included in the concentration factors of subsidiaries to avoid double-counting.
Specific Instructions for Application of the Formula
The 10 largest asset exposures should be developed by consolidating the assets of the parent with the assets of the company’s insurance and investment subsidiaries. The
concentration factor component on any asset already reflected in the subsidiary’s RBC for the concentration factor should be deducted from Column (4). This consolidation
process affects higher tiered companies only. Companies on the lowest tier of the organizational chart will prepare the asset concentration on a “stand alone” basis.
The 10 largest exposures should exclude the following: affiliated and non-affiliated common stock, affiliated preferred stock, home office properties, policy loans, bonds for which
AVR and RBC are zero, Class 1 bonds, Class 1 unaffiliated preferred stock, Class 1 Hybrids, Class CM1 mortgages and any other asset categories with RBC factors less than 0.8
percent post-tax (this includes residential mortgages in good standing, insured or guaranteed mortgages, and cash and short-term investments).
In determining the assets subject to the concentration factor for both C1o and C1cs, the ceding company should exclude any asset whose performance inures primarily (>50
percent) to one reinsurer under modified coinsurance or funds withheld arrangements. The reinsurer should include 100 percent of such asset. Any asset where no one reinsurer
receives more than 50 percent of its performance should remain with the ceding company.
Assets should be aggregated by issuer before determining the 10 largest exposures. Aggregations should be done separately for bonds and preferred stock (the first six digits of the
CUSIP number can be used as a starting point) (please note that the same issuer may have more than one unique series of the first six digits of the CUSIP), mortgages and real
estate. Securities held within Schedule BA partnerships should be aggregated by issuer as if the securities are held directly. Likewise, where joint venture real estate is mortgaged
by the insurer, both the mortgage and the joint venture real estate should be considered as part of a single exposure. Tenant exposure is not included. For bonds and unaffiliated
preferred stock, aggregations should be done first for classes 2 through 6. After the 10 largest issuer exposures are chosen, any Class 1 bonds, Class 1 unaffiliated preferred stock
or Class 1Hybrids from any of these issuers should be included before doubling the risk-based capital. For some companies, following the above steps may generate less than 10
“issuer” exposures. These companies should list all available exposures.
Replicated assets other than synthetically created indices should be included in the asset concentration calculation in the same manner as other assets.
The book/adjusted carrying value of each asset is listed in Column (2).
The RBC factor will correspond to the risk-based capital category of the asset reported previously in the formula before application of the size factor for bonds. The RBC filing
software automatically allows for an overall 45 percent RBC cap.
Lines (23) through (28)
The Asset Concentration RBC Requirement for a particular property plus the Real Estate RBC Requirement for a particular property cannot exceed the book/adjusted carrying
value of the property. Any properties exceeding the book/adjusted carrying value must be adjusted down to the book/adjusted carrying value in Column (6) of the Asset
Concentration.

25
Line (24), Column (4) is calculated as Line (23), Column (2) multiplied by 0.2300 plus Line (24), Column (2) multiplied by 0.2000, but not greater than Line (23), Column (2).
Line (26), Column (4) is calculated as Line (25), Column (2) multiplied by 0.1500 plus Line (26), Column (2) multiplied by 0.1200, but not greater than Line (25), Column (2).
Line (28), Column (4) is calculated as Line (27), Column (2) multiplied by 0.2300 plus Line (28), Column (2) multiplied by 0.2000, but not greater than Line (27), Column (2).
Lines (29) through (48)
The Asset Concentration RBC Requirement for a particular mortgage plus the LR004 Mortgages RBC Requirement or LR009 Schedule BA Mortgages RBC Requirement for a
particular mortgage can not exceed 45 percent of the book/adjusted carrying value of the mortgage. Any mortgages exceeding 45 percent of the book/adjusted carrying value must
be adjusted down in Column (6) of the Asset Concentration.
Line (33), Column (4) is calculated as the greater of 0.1800 multiplied by [(Line (32) plus Line (33)] less Line (33) or Line (32) multiplied by the appropriate factor for the CM
class to which the loan is assigned.
Line (35), Column (4) is calculated as the greater of 0.0140 multiplied by [(Line (34) plus Line (35)] less Line (35) or Line (34) multiplied by 0.0068.
Line (37), Column (4) is calculated as the greater of 0.1800 multiplied by [(Line (36) plus Line (37)] less Line (37) or Line (36) multiplied by the appropriate factor for the CM
class to which the loan is assigned the factor for the appropriate CM category based on the DSC and LTV of the loan.
Line (39), Column (4) is calculated as the greater of 0.2300 multiplied by [(Line (38) plus Line (39)] less Line (39) or Line (38) multiplied by the appropriate factor for the CM
class to which the loan is assigned Line (41), Column (4) is calculated as the greater of 0.0270 multiplied by [(Line (40) plus Line (41)] less Line (41) or Line (40) multiplied by
0.0068.
Line (43), Column (4) is calculated as the greater of 0.2300 multiplied by [(Line (42) plus Line (43)] less Line (43) or Line (42) multiplied by the appropriate factor for the CM
class to which the loan is assigned Line (46), Column (4) is calculated as the greater of 0.1800 multiplied by [(Line (45) plus Line (46)] less Line (46) or Line (45) multiplied by
the appropriate factor for the CM class to which the loan is assigned Line (48), Column (4) is calculated as the greater of 0.2300 multiplied by [(Line (47) plus Line (48)] less Line
(48) or Line (47) multiplied by the appropriate factor for the CM class to which the loan is assigned

26
LR003 – eliminate the current page. The current page is used to compute the company’s experience adjustment factor. Under the
new RBC and AVR methodology, this value will no longer be used and is not needed to be determined.
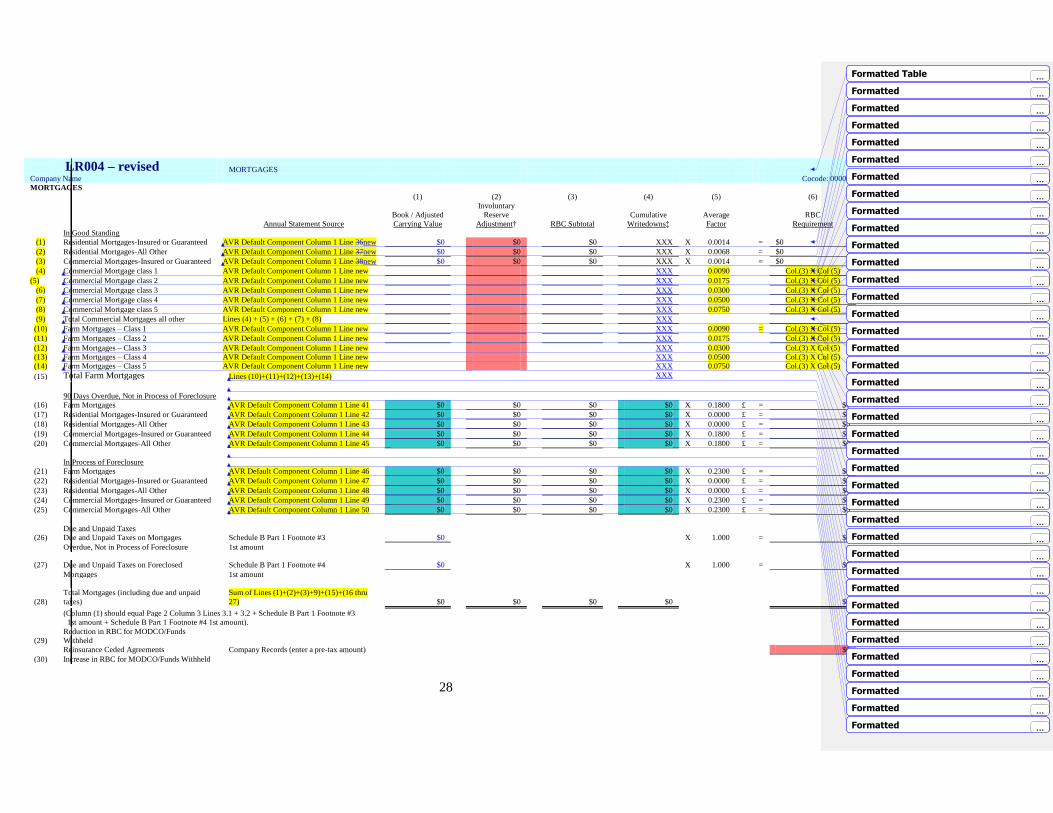
27
LR004 – Replace with next page MORTGAGES
Company Name Cocode: 00000
MORTGAGES
(1) (2) (3) (4) (5) (6)
Involuntary
Book / Adjusted Reserve Cumulative Average RBC
Annual Statement Source Carrying Value Adjustment† RBC Subtotal Writedowns‡ Factor Requirement
In Good Standing
(1) Farm Mortgages AVR Default Component Column 1 Line 35 $0 $0 $0 XXX X 0.0260 § = $0
(2) Residential Mortgages-Insured or Guaranteed AVR Default Component Column 1 Line 36 $0 $0 $0 XXX X 0.0014 = $0
(3) Residential Mortgages-All Other AVR Default Component Column 1 Line 37 $0 $0 $0 XXX X 0.0068 = $0
(4) Commercial Mortgages-Insured or Guaranteed AVR Default Component Column 1 Line 38 $0 $0 $0 XXX X 0.0014 = $0
(5) Commercial Mortgages-All Other AVR Default Component Column 1 Line 39 $0 $0 $0 XXX X 0.0260 § = $0
(6) Restructured Mortgages AVR Default Component Column 1 Line 40 $0 $0 $0 XXX X 0.0900 * = $0
90 Days Overdue, Not in Process of Foreclosure
(7) Farm Mortgages AVR Default Component Column 1 Line 41 $0 $0 $0 $0 X 0.1800 £ = $0
(8) Residential Mortgages-Insured or Guaranteed AVR Default Component Column 1 Line 42 $0 $0 $0 $0 X 0.0000 £ = $0
(9) Residential Mortgages-All Other AVR Default Component Column 1 Line 43 $0 $0 $0 $0 X 0.0000 £ = $0
(10) Commercial Mortgages-Insured or Guaranteed AVR Default Component Column 1 Line 44 $0 $0 $0 $0 X 0.1800 £ = $0
(11) Commercial Mortgages-All Other AVR Default Component Column 1 Line 45 $0 $0 $0 $0 X 0.1800 £ = $0
In Process of Foreclosure
(12) Farm Mortgages AVR Default Component Column 1 Line 46 $0 $0 $0 $0 X 0.2300 £ = $0
(13) Residential Mortgages-Insured or Guaranteed AVR Default Component Column 1 Line 47 $0 $0 $0 $0 X 0.0000 £ = $0
(14) Residential Mortgages-All Other AVR Default Component Column 1 Line 48 $0 $0 $0 $0 X 0.0000 £ = $0
(15) Commercial Mortgages-Insured or Guaranteed AVR Default Component Column 1 Line 49 $0 $0 $0 $0 X 0.2300 £ = $0
(16) Commercial Mortgages-All Other AVR Default Component Column 1 Line 50 $0 $0 $0 $0 X 0.2300 £ = $0
Due and Unpaid Taxes
(17) Due and Unpaid Taxes on Mortgages Schedule B Part 1 Footnote #3 $0 X 1.000 = $0
Overdue, Not in Process of Foreclosure 1st amount
(18) Due and Unpaid Taxes on Foreclosed Schedule B Part 1 Footnote #4 $0 X 1.000 = $0
Mortgages 1st amount
(19) Total Mortgages (including due and unpaid taxes) Sum of Lines (1) through (18) $0 $0 $0 $0 $0
(Column (1) should equal Page 2 Column 3 Lines 3.1 + 3.2 + Schedule B Part 1 Footnote #3
1st amount + Schedule B Part 1 Footnote #4 1st amount).
(20) Reduction in RBC for MODCO/Funds Withheld
Reinsurance Ceded Agreements Company Records (enter a pre-tax amount) $0
(21) Increase in RBC for MODCO/Funds Withheld
Reinsurance Assumed Agreements Company Records (enter a pre-tax amount) $0
(22) Total Mortgages
(including MODCO/Funds Withheld.) Lines (19) - (20) + (21) $0
†
Involuntary reserves are reserves that are held as an offset to a particular asset that is clearly a troubled asset and are included on Page 3 Line 25 of the Annual
Statement.
‡ Cumulative writedowns include the total amount of writedowns, non-admissions, and involuntary reserves that have been taken or established with respect to a particular mortgage.
§ For Lines (1) and (5), Column (5) is equal to 0.0260 multiplied times the experience adjustment factor on LR003 Mortgage Experience Adjustment Factor Line (13).
*
For Line (6), Column (5) is the greater of 0.0900 or 0.0260 multiplied by [the experience adjustment factor calculated on LR003 Mortgage Experience Adjustment Factor Line (13)] plus
0.0200.
£ For Lines (7) through (16), Column (5) is calculated as Column (6) divided by Column (3).

28
LR004 – revised MORTGAGES
Company Name Cocode: 00000
MORTGAGES
(1) (2) (3) (4) (5) (6)
Involuntary
Book / Adjusted Reserve Cumulative Average RBC
Annual Statement Source Carrying Value Adjustment† RBC Subtotal Writedowns‡ Factor Requirement
In Good Standing
(1) Residential Mortgages-Insured or Guaranteed AVR Default Component Column 1 Line 36new $0 $0 $0 XXX X 0.0014 = $0
(2) Residential Mortgages-All Other AVR Default Component Column 1 Line 37new $0 $0 $0 XXX X 0.0068 = $0
(3) Commercial Mortgages-Insured or Guaranteed AVR Default Component Column 1 Line 38new $0 $0 $0 XXX X 0.0014 = $0
(4) Commercial Mortgage class 1 AVR Default Component Column 1 Line new XXX 0.0090 Col.(3) X Col (5)
(5) Commercial Mortgage class 2 AVR Default Component Column 1 Line new XXX 0.0175 Col.(3) X Col (5) (6) Commercial Mortgage class 3 AVR Default Component Column 1 Line new XXX 0.0300 Col.(3) X Col (5) (7) Commercial Mortgage class 4 AVR Default Component Column 1 Line new XXX 0.0500 Col.(3) X Col (5) (8) Commercial Mortgage class 5 AVR Default Component Column 1 Line new XXX 0.0750 Col.(3) X Col (5) (9) Total Commercial Mortgages all other Lines (4) + (5) + (6) + (7) + (8) XXX
(10) Farm Mortgages – Class 1 AVR Default Component Column 1 Line new XXX 0.0090 = Col.(3) X Col (5) (11) Farm Mortgages – Class 2 AVR Default Component Column 1 Line new XXX 0.0175 Col.(3) X Col (5) (12) Farm Mortgages – Class 3 AVR Default Component Column 1 Line new XXX 0.0300 Col.(3) X Col (5) (13) Farm Mortgages – Class 4 AVR Default Component Column 1 Line new XXX 0.0500 Col.(3) X Col (5) (14) Farm Mortgages – Class 5 AVR Default Component Column 1 Line new XXX 0.0750 Col.(3) X Col (5) (15) Total Farm Mortgages Lines (10)+(11)+(12)+(13)+(14) XXX
90 Days Overdue, Not in Process of Foreclosure
(16) Farm Mortgages AVR Default Component Column 1 Line 41 $0 $0 $0 $0 X 0.1800 £ = $0
(17) Residential Mortgages-Insured or Guaranteed AVR Default Component Column 1 Line 42 $0 $0 $0 $0 X 0.0000 £ = $0
(18) Residential Mortgages-All Other AVR Default Component Column 1 Line 43 $0 $0 $0 $0 X 0.0000 £ = $0
(19) Commercial Mortgages-Insured or Guaranteed AVR Default Component Column 1 Line 44 $0 $0 $0 $0 X 0.1800 £ = $0
(20) Commercial Mortgages-All Other AVR Default Component Column 1 Line 45 $0 $0 $0 $0 X 0.1800 £ = $0
In Process of Foreclosure
(21) Farm Mortgages AVR Default Component Column 1 Line 46 $0 $0 $0 $0 X 0.2300 £ = $0
(22) Residential Mortgages-Insured or Guaranteed AVR Default Component Column 1 Line 47 $0 $0 $0 $0 X 0.0000 £ = $0
(23) Residential Mortgages-All Other AVR Default Component Column 1 Line 48 $0 $0 $0 $0 X 0.0000 £ = $0
(24) Commercial Mortgages-Insured or Guaranteed AVR Default Component Column 1 Line 49 $0 $0 $0 $0 X 0.2300 £ = $0
(25) Commercial Mortgages-All Other AVR Default Component Column 1 Line 50 $0 $0 $0 $0 X 0.2300 £ = $0
Due and Unpaid Taxes
(26) Due and Unpaid Taxes on Mortgages Schedule B Part 1 Footnote #3 $0 X 1.000 = $0
Overdue, Not in Process of Foreclosure 1st amount
(27) Due and Unpaid Taxes on Foreclosed Schedule B Part 1 Footnote #4 $0 X 1.000 = $0
Mortgages 1st amount
(28)
Total Mortgages (including due and unpaid
taxes)
Sum of Lines (1)+(2)+(3)+9)+(15)+(16 thru
27) $0 $0 $0 $0 $0
(Column (1) should equal Page 2 Column 3 Lines 3.1 + 3.2 + Schedule B Part 1 Footnote #3
1st amount + Schedule B Part 1 Footnote #4 1st amount).
(29)
Reduction in RBC for MODCO/Funds
Withheld
Reinsurance Ceded Agreements Company Records (enter a pre-tax amount) $0
(30) Increase in RBC for MODCO/Funds Withheld
Formatted Table ...
Formatted ...
Formatted ...
Formatted ...
Formatted ...
Formatted ...
Formatted ...
Formatted ...
Formatted ...
Formatted ...
Formatted ...
Formatted ...
Formatted ...
Formatted ...
Formatted ...
Formatted ...
Formatted ...
Formatted ...
Formatted ...
Formatted ...
Formatted ...
Formatted ...
Formatted ...
Formatted ...
Formatted ...
Formatted ...
Formatted ...
Formatted ...
Formatted ...
Formatted ...
Formatted ...
Formatted ...
Formatted ...
Formatted ...
Formatted ...
Formatted ...
Formatted ...
Formatted ...
Formatted ...

29
Reinsurance Assumed Agreements Company Records (enter a pre-tax amount) $0
(31) Total Mortgages
(including MODCO/Funds Withheld.) Lines (28) - (29) + (30) $0
†
Involuntary reserves are reserves that are held as an offset to a particular asset that is clearly a troubled asset and are included on Page 3 Line 25 of the Annual
Statement.
‡ Cumulative writedowns include the total amount of writedowns, non-admissions, and involuntary reserves that have been taken or established with respect to a particular mortgage.
£ For Lines (7) through (16), Column (5) is calculated as Column (6) divided by Column (3).

30
Replace this page with the following page:
LR009 SCHEDULE BA
MORTGAGES Company Name
Cocode:
00000
SCHEDULE BA MORTGAGES
(1) (2) (3) (4) (5) (6)
Involuntary
Book / Adjusted Reserve Cumulative Average RBC
Annual Statement Value Carrying Value
Adjustment
†
RBC
Subtotal
Writedowns
‡ Factor Requirement
(1) Insured or Guaranteed
Schedule BA Part 1
Column 12 Line 0999999 + $0 $0 $0 XXX X 0.0014 = $0
in Good Standing Line1099999, in part
(2) All Other in Good Standing
Schedule BA Part 1
Column 12 Line 0999999 + $0 $0 $0 XXX X 0.0260 § = $0
Line1099999, in part
(3) Restructured
AVR Equity Component
Column 1 Line 44 $0 $0 $0 XXX X 0.0900 * = $0
(4) Insured or Guaranteed 90
Schedule BA Part 1
Column 12 Line 0999999 +
$0
$0 $0 $0 X 0.0000 £ = $0
Days Overdue Line1099999, in part
(5) All Other 90 Days Overdue
Schedule BA Part 1
Column 12 Line 0999999 +
$0
$0 $0 $0 X 0.0000 £ = $0
Line1099999, in part
(6) Insured or Guaranteed
Schedule BA Part 1
Column 12 Line 0999999 +
$0
$0 $0 $0 X 0.0000 £ = $0
in Process of Foreclosure Line1099999, in part
(7) All Other in Process of
Schedule BA Part 1
Column 12 Line 0999999 +
$0
$0 $0 $0 X 0.0000 £ = $0
Foreclosure Line1099999, in part
(8)
Total Schedule BA
Mortgages
Sum of Lines (1) through
(7) $0 $0 $0 $0 $0
(pre-MODCO/Funds
Withheld)
(9)
Reduction in RBC for
MODCO/Funds Withheld
Reinsurance Ceded Company Records (enter a $0

31
Agreements pre-tax amount)
(10)
Increase in RBC for
MODCO/Funds Withheld
Reinsurance Assumed
Agreements
Company Records (enter a
pre-tax amount) $0
(11)
Total Schedule BA
Mortgages
(including MODCO/Funds
Withheld.) Lines (8) - (9) + (10) $0
† Involuntary reserves are reserves that are held as an offset to a particular asset that is clearly a troubled asset and are included
on Page 3 Line 25 of the Annual Statement.
‡ Cumulative writedowns include the total amount of writedowns, non-admissions, and involuntary reserves that have been
taken or established with respect to a particular mortgage.
§ For Line (2), Column (5) is equal to 0.0260 multiplied times the experience adjustment factor on LR003 Mortgage Experience
Adjustment Factor Line (13).
* For Line (3), Column (5) is the greater of 0.0900 or 0.0260 multiplied by [the experience adjustment factor calculated on
LR003 Mortgage Experience Adjustment Factor Line (13)] plus 0.0200.
£ For Lines (4) through (7), Column (5) is calculated as Column (6) divided by Column (3).

32
LR009 – revised Schedule BA MORTGAGES
Company Name Cocode: 00000
Schedule BA MORTGAGES
(1) (2) (3) (4) (5) (6)
Involuntary
Book / Adjusted Reserve Cumulative Average RBC
Annual Statement Source Carrying Value Adjustment† RBC Subtotal Writedowns‡ Factor Requirement
In Good Standing
(1) Commercial Mortgages-Insured or Guaranteed $0 $0 $0 XXX X 0.0014 = $0
(12) Unaffiliated Mortgages with covenants Schedule BA line 0999999 in part £ From worksheet
(23)
Unaffiliated Mortgages defeased with
government securities
Schedule BA line 0999999 in part .0090
(34) Unaffiliated Mortgages primarily Senior Schedule BA line 0999999 in part .0175
(45) Unaffiliated Mortgages –all other Schedule BA Line 0099999 in part .0300 Col.(3) X Col (5) (56) Affiliated Mortgage class 1 Schedule BA Line 1099999 in part 0.0090 = Col.(3) X Col (5) (67) Affiliated Mortgage class 2 Schedule BA Line 1099999 in part 0.0175 Col.(3) X Col (5) (78) Affiliated Mortgage class 3 Schedule BA Line 1099999 in part 0.0300 Col.(3) X Col (5) (89) Affiliated Mortgage class 4 Schedule BA Line 1099999 in part 0.0500 Col.(3) X Col (5) (910) Affiliated Mortgage class 5 Schedule BA Line 1099999 in part 0.0750 Col.(3) X Col (5) (101) Total in good standing
90 Days Overdue, Not in Process of Foreclosure
(12) Insured or Guaranteed
(113) Unaffiliated Schedule BA line 0999999 in part $0 $0 $0 $0 X £ = $0
(124) Affiliated Schedule BA Line 1099999 in part $0 $0 $0 $0 X £ = $0
(135) Total 90 days overdue
In Process of Foreclosure
(16) Insured or Guaranteed
(147) Unaffiliated Mortgages Schedule BA line 0999999 in part $0 $0 $0 $0 X £ = $0
(158) Affiliated Mortgages Schedule BA Line 1099999 in part $0 $0 $0 $0 X £ = $0
(169) Total in process of foreclosure
(1720) Totals Lines (11) + (15) + (19)
(1821) Reduction in RBC for MODCO/Funds Withheld
Reinsurance Ceded Agreements Company Records (enter a pre-tax amount) $0
(1922) Increase in RBC for MODCO/Funds Withheld
Reinsurance Assumed Agreements Company Records (enter a pre-tax amount) $0
(203) Total Mortgages
(Including MODCO/Funds Withheld.) Lines (19) - (20) + (21) $0
† Involuntary reserves are reserves that are held as an offset to a particular asset that is clearly a troubled asset and are included
on Page 3 Line 25 of the Annual Statement.
‡ Cumulative writedowns include the total amount of writedowns, non-admissions, and involuntary reserves that have been
taken or established with respect to a particular mortgage.
£ For Lines (12), (113), (124), (174) and (185), Column (5) is calculated as Column (6) divided by Column (3).
Formatted: Not Highlight
Formatted: Not Highlight

33
{Note: in the attached, changes were only made for Asset (1), and need to be carried through to the rest of the assets. }
LR010 ASSET CONCENTRATION FACTOR
Company Name Cocode:
00000 ASSET CONCENTRATION FACTOR
(1) (2) (3) (4) (5) (6)
Book /
Adjusted Additional Adjustment/ RBC
Issuer Asset Type
Carrying
Value Factor RBC Subsidiary RBC Requirement
#01 Issuer Name:
#01 (1) Bond Asset Class 2 $0 X 0.0130 = $0 $0 $0
#01 (2) Bond Asset Class 3 $0 X 0.0460 = $0 $0 $0
#01 (3) Bond Asset Class 4 $0 X 0.1000 = $0 $0 $0
#01 (4) Bond Asset Class 5 $0 X 0.2200 = $0 $0 $0
#01 (5) Bond Asset Class 6 $0 X 0.1500 = $0 $0 $0
#01 (6) Bond Asset Class 1 † $0 X 0.0040 = $0 $0 $0
#01 (7) Unaffiliated Preferred Stock Class 2 $0 X 0.0130 = $0 $0 $0
#01 (8) Unaffiliated Preferred Stock Class 3 $0 X 0.0460 = $0 $0 $0
#01 (9) Unaffiliated Preferred Stock Class 4 $0 X 0.1000 = $0 $0 $0
#01 (10) Unaffiliated Preferred Stock Class 5 $0 X 0.2200 = $0 $0 $0
#01 (11) Unaffiliated Preferred Stock Class 6 $0 X 0.1500 = $0 $0 $0
#01 (12) Unaffiliated Preferred Stock Class 1 † $0 X 0.0040 = $0 $0 $0
#01 (13) Hybrid Securities Class 2 $0 X 0.0130 = $0 $0 $0
#01 (14) Hybrid Securities Class 3 $0 X 0.0460 = $0 $0 $0
#01 (15) Hybrid Securities Class 4 $0 X 0.1000 = $0 $0 $0
#01 (16) Hybrid Securities Class 5 $0 X 0.2200 = $0 $0 $0
#01 (17) Hybrid Securities Class 6 $0 X 0.1500 = $0 $0 $0
#01 (18) Hybrid Securities Class 1† $0 X 0.0040 = $0 $0 $0
#01 (19) Collateral Loans $0 X 0.0680 = $0 $0 $0
#01 (20) Receivable for Securities $0 X 0.0680 = $0 $0 $0
#01 (21) Write-ins for Invested Assets $0 X 0.0680 = $0 $0 $0
#01 (22) Premium Notes $0 X 0.0680 = $0 $0 $0
#01 (23) Real Estate - Foreclosed $0
#01 (24) Real Estate - Foreclosed Encumbrances $0 X 0.0000 ‡ = $0 $0 $0
#01 (25) Real Estate - Investments $0
#01 (26) Real Estate - Investment Encumbrances $0 X 0.0000 ‡ = $0 $0 $0
#01 (27) Real Estate - Schedule BA $0
#01 (28) Real Estate - Schedule BA Encumbrances $0 X 0.0000 ‡ = $0 $0 $0
#01 (29) Farm Mortgages Class CM2 $0 X 0.0175 ‡ = $0 $0 $0
#01 (29) Farm Mortgages Class CM3 $0 X 0.0300 ‡ = $0 $0 $0 Formatted: Highlight

34
#01 (29) Farm Mortgages Class CM4 $0 X 0.0500 ‡ = $0 $0 $0
#01 (29) Farm Mortgages Class CM5 $0 X 0.0750 ‡ = $0 $0 $0
#01 (30) Commercial Mortgages Class CM2 $0 X 0.0175 ‡ = $0 $0 $0
#01 (30) Commercial Mortgages Class CM3 $0 X 0.0300 ‡ = $0 $0 $0
#01 (30) Commercial Mortgages Class CM4 $0 X 0.0500 ‡ = $0 $0 $0
#01 (30) Commercial Mortgages Class CM5 $0 X 0.0750 ‡ = $0 $0 $0
#01 (32) Farm Mortgages - 90 Days Overdue $0
#01 (33) Farm Mortgages - 90 Days Overdue - Cumulative Writedowns $0 X 0.0000 ‡ = $0 $0 $0
#01 (34) Residential Mortgages - 90 Days Overdue $0
#01 (35) Residential Mortgages - 90 Days Overdue - Cumulative Writedowns $0 X 0.0000 ‡ = $0 $0 $0
#01 (36) Commercial Mortgages - 90 Days Overdue $0
#01 (37) Commercial Mortgages - 90 Days Overdue - Cumulative Writedowns $0 X 0.0000 ‡ = $0 $0 $0
#01 (38) Farm Mortgages in Foreclosure $0
#01 (39) Farm Mortgages in Foreclosure - Cumulative Writedowns $0 X 0.0000 ‡ = $0 $0 $0
#01 (40) Residential Mortgages in Foreclosure $0
#01 (41) Residential Mortgages in Foreclosure - Cumulative Writedowns $0 X 0.0000 ‡ = $0 $0 $0
#01 (42) Commercial Mortgages in Foreclosure $0
#01 (43) Commercial Mortgages in Foreclosure - Cumulative Writedowns $0 X 0.0000 ‡ = $0 $0 $0
#01 (44) Unaffiliated Mortgages with covenantsSchedule BA Mortgages class CM2 $0 X 0.0175 ‡ = $0 $0 $0
Unaffiliated Mortgages defeased with government securities .0090
Unaffiliated Mortgages primarily Senior .0175
Unaffiliated Mortgages –all other .0300
Affiliated Mortgage class 1 0.0090
Affiliated Mortgage class 2 0.0175
Affiliated Mortgage class 3 0.0300
Affiliated Mortgage class 4Schedule BA Mortgages class CM3 0.05000.0300
Affiliated Mortgage class 5Schedule BA Mortgages class CM4 0.0750.0500
Total in good standingSchedule BA Mortgages class CM5 0.0750
#01 (45) Schedule BA Mortgages 90 Days Overdue $0
#01 (46) Schedule BA Mortgages 90 Days Overdue - Cumulative Writedowns $0 X 0.0000 ‡ = $0 $0 $0
#01 (47) Schedule BA Mortgages in Process of Foreclosure $0
#01 (48) Schedule BA Mortgages Foreclosed - Cumulative Writedowns $0 X 0.0000 ‡ = $0 $0 $0
#01 (49) Non-Guaranteed Low Income Housing Tax Credits $0 X 0.0230 = $0 $0 $0
#01 (50) Other Schedule BA Assets $0 X 0.1500 = $0 $0 $0
#01
#01 (51) Sum of Lines (1) through (50) $0 $0 $0 $0
(51) Sum of Lines (1) through (50) $0 $0 $0 $0
† After the ten largest issuer exposures are chosen, any class 1 bonds or preferred stocks from any of these issuers should be included.
‡
Refer to the instructions for the Asset Concentration Factor for details of this
calculation.
Formatted: Highlight
Formatted: Highlight
Formatted: Highlight
Formatted: Highlight
Formatted: Highlight
Formatted: Highlight
Formatted Table
Formatted Table

35
LR03028 CALCULATION OF TAX EFFECT FOR LIFE RISK-BASED CAPITAL
Company Name Cocode: 00000
CALCULATION OF TAX EFFECT FOR LIFE RISK-BASED CAPITAL
(1) (2)
Source
RBC
Amount Tax Factor RBC Tax Effect
ASSET RISKS
Bonds
(001) Long-term Bonds – Class 1 LR002 Bonds Column (2) Line (2) + LR016 Off-Balance Sheet Collateral $0 X 0.2625 = $0
Column (3) Line (2)
(002) Long-term Bonds – Class 2 LR002 Bonds Column (2) Line (3) + LR016 Off-Balance Sheet Collateral $0 X 0.2625 = $0
Column (3) Line (3)
(003) Long-term Bonds – Class 3 LR002 Bonds Column (2) Line (4) + LR016 Off-Balance Sheet Collateral $0 X 0.2625 = $0
Column (3) Line (4)
(004) Long-term Bonds – Class 4 LR002 Bonds Column (2) Line (5) + LR016 Off-Balance Sheet Collateral $0 X 0.2625 = $0
Column (3) Line (5)
(005) Long-term Bonds – Class 5 LR002 Bonds Column (2) Line (6) + LR016 Off-Balance Sheet Collateral $0 X 0.2625 = $0
Column (3) Line (6)
(006) Long-term Bonds – Class 6 LR002 Bonds Column (2) Line (7) + LR016 Off-Balance Sheet Collateral $0 X 0.3500 = $0
Column (3) Line (7)
(007) Short-term Bonds – Class 1 LR002 Bonds Column (2) Line (10) $0 X 0.2625 = $0
(008) Short-term Bonds – Class 2 LR002 Bonds Column (2) Line (11) $0 X 0.2625 = $0
(009) Short-term Bonds – Class 3 LR002 Bonds Column (2) Line (12) $0 X 0.2625 = $0
(010) Short-term Bonds – Class 4 LR002 Bonds Column (2) Line (13) $0 X 0.2625 = $0
(011) Short-term Bonds – Class 5 LR002 Bonds Column (2) Line (14) $0 X 0.2625 = $0
(012) Short-term Bonds – Class 6 LR002 Bonds Column (2) Line (15) $0 X 0.3500 = $0
(013) Bond Reduction - Reinsurance LR002 Bonds Column (2) Line (18) $0 X 0.3500 = $0
(014) Bond Increase - Reinsurance LR002 Bonds Column (2) Line (19) $0 X 0.3500 = $0
(015)
Non-Exempt Class 1 U.S.
Government Agency LR002 Bonds Column (2) Line (21) $0 X 0.2625 = $0
(016) Bonds Size Factor LR002 Bonds Column (2) Line (25) - LR002 Bonds Column (2) Line (20) $0 X 0.2625 = $0
Mortgages
In Good Standing
(017) Farm Mortgages LR004 Mortgages Column (6) Line (15) $0 X 0.2625 = $0
(018) Residential Mortgages - Insured LR004 Mortgages Column (6) Line (1) $0 X 0.2625 = $0
(019) Residential Mortgages - Other LR004 Mortgages Column (6) Line (2) $0 X 0.2625 = $0
(020) Commercial Mortgages - Insured LR004 Mortgages Column (6) Line (3) $0 X 0.2625 = $0
36
(021) Commercial Mortgages - Other LR004 Mortgages Column (6) Line (9) $0 X 0.2625 = $0
90 Days Overdue
(023) Farm Mortgages LR004 Mortgages Column (6) Line (16) $0 X 0.2625 = $0
(024) Residential Mortgages - Insured LR004 Mortgages Column (6) Line (17) $0 X 0.2625 = $0
(025) Residential Mortgages - Other LR004 Mortgages Column (6) Line (18) $0 X 0.2625 = $0
(026) Commercial Mortgages - Insured LR004 Mortgages Column (6) Line (19) $0 X 0.2625 = $0
(027) Commercial Mortgages - Other LR004 Mortgages Column (6) Line (20) $0 X 0.2625 = $0
In Process of Foreclosure
(028) Farm Mortgages LR004 Mortgages Column (6) Line (21) $0 X 0.2625 = $0
(029) Residential Mortgages - Insured LR004 Mortgages Column (6) Line (22) $0 X 0.2625 = $0
(030) Residential Mortgages - Other LR004 Mortgages Column (6) Line (23) $0 X 0.2625 = $0
(031) Commercial Mortgages - Insured LR004 Mortgages Column (6) Line (24) $0 X 0.2625 = $0
(032) Commercial Mortgages - Other LR004 Mortgages Column (6) Line (25) $0 X 0.2625 = $0
(033) Due & Unpaid Taxes Mortgages LR004 Mortgages Column (6) Line (26) $0 X 0.2625 = $0
(034) Due & Unpaid Taxes-Foreclosures LR004 Mortgages Column (6) Line (27) $0 X 0.2625 = $0
(035) Mortgage Reduction - Reinsurance LR004 Mortgages Column (6) Line (29) $0 X 0.3500 = $0
(036) Mortgage Increase - Reinsurance LR004 Mortgages Column (6) Line (30) $0 X 0.3500 = $0
Preferred Stock and Hybrid Securities
(037)
Unaffiliated Preferred Stock and
Hybrids Class 1 LR005 Unaffiliated Preferred and Common Stock Column (5) Line (1) + Line (8) $0 X 0.2625 = $0
+ LR016 Off-Balance Sheet Collateral Column (3) Line (9)
(038)
Unaffiliated Preferred Stock and
Hybrids Class 2 LR005 Unaffiliated Preferred and Common Stock Column (5) Line (2) + Line (9) $0 X 0.2625 = $0
+ LR016 Off-Balance Sheet Collateral Column (3) Line (10)
(039)
Unaffiliated Preferred Stock and
Hybrids Class 3 LR005 Unaffiliated Preferred and Common Stock Column (5) Line (3) + Line (10) $0 X 0.2625 = $0
+ LR016 Off-Balance Sheet Collateral Column (3) Line (11)
(040)
Unaffiliated Preferred Stock and
Hybrids Class 4 LR005 Unaffiliated Preferred and Common Stock Column (5) Line (4) + Line (11) $0 X 0.2625 = $0
+ LR016 Off-Balance Sheet Collateral Column (3) Line (12)
(041)
Unaffiliated Preferred Stock and
Hybrids Class 5 LR005 Unaffiliated Preferred and Common Stock Column (5) Line (5) + Line (12) $0 X 0.2625 = $0
+ LR016 Off-Balance Sheet Collateral Column (3) Line (13)
(042)
Unaffiliated Preferred Stock and
Hybrids Class 6 LR005 Unaffiliated Preferred and Common Stock Column (5) Line (6) + Line (13) $0 X 0.3500 = $0
+ LR016 Off-Balance Sheet Collateral Column (3) Line (14)
(043)
Preferred Stock Reduction-
Reinsurance LR005 Unaffiliated Preferred and Common Stock Column (5) Line (16) $0 X 0.3500 = $0
(044)
Preferred Stock Increase-
Reinsurance LR005 Unaffiliated Preferred and Common Stock Column (5) Line (17) $0 X 0.3500 = $0
Separate Accounts
(045) Guaranteed Index LR006 Separate Accounts Column (3) Line (1) $0 X 0.2625 = $0

37
(046) Nonindex-Book Reserve LR006 Separate Accounts Column (3) Line (2) $0 X 0.2625 = $0
(047)
Separate Accounts Nonindex-Market
Reserve LR006 Separate Accounts Column (3) Line (3) $0 X 0.2625 = $0
(048)
Separate Accounts Reduction-
Reinsurance LR006 Separate Accounts Column (3) Line (5) $0 X 0.3500 = $0
(049)
Separate Accounts Increase-
Reinsurance LR006 Separate Accounts Column (3) Line (6) $0 X 0.3500 = $0
(050) Synthetic GICs LR006 Separate Accounts Column (3) Line (8) $0 X 0.2625 = $0
(051) Separate Account Surplus LR006 Separate Accounts Column (3) Line (13) $0 X 0.2625 = $0
Real Estate
(052) Company Occupied Real Estate LR007 Real Estate Column (3) Line (3) $0 X 0.3500 = $0
(053) Foreclosed Real Estate LR007 Real Estate Column (3) Line (6) $0 X 0.3500 = $0
(054) Investment Real Estate LR007 Real Estate Column (3) Line (9) $0 X 0.3500 = $0
(055) Real Estate Reduction - Reinsurance LR007 Real Estate Column (3) Line (11) $0 X 0.3500 = $0
(056) Real Estate Increase - Reinsurance LR007 Real Estate Column (3) Line (12) $0 X 0.3500 = $0
Schedule BA
(057)
Sch BA Real Estate Excluding Low
Income LR007 Real Estate Column (3) Line (16) $0 X 0.3500 = $0
Housing Tax Credits
(058)
Guaranteed Low Income Housing
Tax Credits LR007 Real Estate Column (3) Line (17) $0 X 0.0000 = $0
(059)
Non-Guaranteed Low Income
Housing Tax Credits LR007 Real Estate Column (3) Line (18) $0 X 0.0000 = $0
(060)
Sch BA Real Estate Reduction -
Reinsurance LR007 Real Estate Column (3) Line (20) $0 X 0.3500 = $0
(061)
Sch BA Real Estate Increase -
Reinsurance LR007 Real Estate Column (3) Line (21) $0 X 0.3500 = $0
(062) Sch BA Bond Class 1 LR008 Other Long-Term Assets Column (5) Line (2) $0 X 0.2625 = $0
(063) Sch BA Bond Class 2 LR008 Other Long-Term Assets Column (5) Line (3) $0 X 0.2625 = $0
(064) Sch BA Bond Class 3 LR008 Other Long-Term Assets Column (5) Line (4) $0 X 0.2625 = $0
(065) Sch BA Bond Class 4 LR008 Other Long-Term Assets Column (5) Line (5) $0 X 0.2625 = $0
(066) Sch BA Bond Class 5 LR008 Other Long-Term Assets Column (5) Line (6) $0 X 0.2625 = $0
(067) Sch BA Bond Class 6 LR008 Other Long-Term Assets Column (5) Line (7) $0 X 0.3500 = $0
(068) BA Bond Reduction - Reinsurance LR008 Other Long-Term Assets Column (5) Line (9) $0 X 0.3500 = $0
(069) BA Bond Increase - Reinsurance LR008 Other Long-Term Assets Column (5) Line (10) $0 X 0.3500 = $0
(070) BA Preferred Stock Class 1 LR008 Other Long-Term Assets Column (5) Line (12.3) $0 X 0.2625 = $0
(071) BA Preferred Stock Class 2 LR008 Other Long-Term Assets Column (5) Line (13) $0 X 0.2625 = $0
(072) BA Preferred Stock Class 3 LR008 Other Long-Term Assets Column (5) Line (14) $0 X 0.2625 = $0
(073) BA Preferred Stock Class 4 LR008 Other Long-Term Assets Column (5) Line (15) $0 X 0.2625 = $0
(074) BA Preferred Stock Class 5 LR008 Other Long-Term Assets Column (5) Line (16) $0 X 0.2625 = $0
(075) BA Preferred Stock Class 6 LR008 Other Long-Term Assets Column (5) Line (17) $0 X 0.3500 = $0
(076)
BA Preferred Stock Reduction-
Reinsurance LR008 Other Long-Term Assets Column (5) Line (19) $0 X 0.3500 = $0
38
(077)
BA Preferred Stock Increase -
Reinsurance LR008 Other Long-Term Assets Column (5) Line (20) $0 X 0.3500 = $0
(078) Rated Surplus Notes LR008 Other Long-Term Assets Column (5) Line (31) $0 X 0.2625 = $0
(079) Rated Capital Notes LR008 Other Long-Term Assets Column (5) Line (41) $0 X 0.2625 = $0
(080) BA Common Stock Affiliated LR008 Other Long-Term Assets Column (5) Line (48.3) $0 X 0.3500 = $0
(081) BA Collateral Loans LR008 Other Long-Term Assets Column (5) Line (50) $0 X 0.2625 = $0
(082) Other BA Assets LR008 Other Long-Term Assets Column (5) Line (51.3) + LR016 Off-Balance $0 X 0.3500 = $0
Sheet Collateral Column (3) Line (17) + Line (18)
(083)
Other BA Assets Reduction-
Reinsurance LR008 Other Long-Term Assets Column (5) Line (53) $0 X 0.3500 = $0
(084)
Other BA Assets Increase -
Reinsurance LR008 Other Long-Term Assets Column (5) Line (54) $0 X 0.3500 = $0
(085) BA Mortgages - Insured LR009 Schedule BA Mortgages Column (6) Line (1) $0 X 0.2625 = $0
(086) BA Mortgages-All Other LR009 Schedule BA Mortgages Column (6) Line (8) $0 X 0.2625 = $0
(087) BA Mortgages 90 days Overdue LR009 Schedule BA Mortgages Column (6) Lines (9) + (10) + (11) $0 X 0.2625 = $0
(088) BA Mortgages Foreclosed - Insured LR009 Schedule BA Mortgages Column (6) Line (13) $0 X 0.2625 = $0
(89)
BA Mortgages Foreclosed –
Unaffiliated LR009 Schedule BA Mortgages Column (6) Line (14)
(090)
BA Mortgages Foreclosed -
Affiliated LR009 Schedule BA Mortgages Column (6) Line (15) $0 X 0.2625 = $0
(091) Reduction - Reinsurance LR009 Schedule BA Mortgages Column (6) Line (18) $0 X 0.3500 = $0
(092) Increase - Reinsurance LR009 Schedule BA Mortgages Column (6) Line (19) $0 X 0.3500 = $0
Miscellaneous
(093) Asset Concentration Factor LR010 Asset Concentration Factor Column (6) Line (51) Grand Total Page $0 X 0.2625 = $0
(094) Miscellaneous Assets LR012 Miscellaneous Assets Column (2) Line (7) $0 X 0.2625 = $0
(095)
Derivatives - Collateral and
Exchange Traded LR012 Miscellaneous Assets Column (2) Lines (8) + (9) + (10) $0 X 0.2625 = $0
(096) Derivatives Class 1 LR012 Miscellaneous Assets Column (2) Line (11) $0 X 0.2625 = $0
(097) Derivatives Class 2 LR012 Miscellaneous Assets Column (2) Line (12) $0 X 0.2625 = $0
(098) Derivatives Class 3 LR012 Miscellaneous Assets Column (2) Line (13) $0 X 0.2625 = $0
(099) Derivatives Class 4 LR012 Miscellaneous Assets Column (2) Line (14) $0 X 0.2625 = $0
(100) Derivatives Class 5 LR012 Miscellaneous Assets Column (2) Line (15) $0 X 0.2625 = $0
(101) Derivatives Class 6 LR012 Miscellaneous Assets Column (2) Line (16) $0 X 0.3500 = $0
(102)
Miscellaneous Assets Reduction-
Reinsurance LR012 Miscellaneous Assets Column (2) Line (19) $0 X 0.3500 = $0
(103)
Miscellaneous Assets Increase-
Reinsurance LR012 Miscellaneous Assets Column (2) Line (20) $0 X 0.3500 = $0
(104) Replications LR013 Replication (Synthetic Asset) Transactions and Mandatorily $0 X 0.2625 = $0
Convertible Securities Column (7) Line (9999999)
(105) Reinsurance LR014 Reinsurance Column (4) Line (17) $0 X 0.3500 = $0
(106) Investment Affiliates LR037 Summary for Affiliated Investments Column (4) Line (6) $0 X 0.3500 = $0
(107) Investment in Parent LR037 Summary for Affiliated Investments Column (4) Line (10) $0 X 0.3500 = $0

39
(108)
Other Affiliate: Property and
Casualty Insurers LR037 Summary for Affiliated Investments Column (4) Line (11) $0 X 0.3500 = $0
not Subject to Risk-Based Capital
(109)
Other Affiliate: Life Insurers not
Subject to LR037 Summary for Affiliated Investments Column (4) Line (12) $0 X 0.3500 = $0
Risk-Based Capital
(110) Publicly Traded Insurance Affiliates LR037 Summary for Affiliated Investments Column (4) Line (14) $0 X 0.3500 = $0
(111) Subtotal for C-1o Assets Sum of Lines (1) through (110), Recognizing the Deduction of Lines (013), $0 $0
(035), (043), (048), (055), (060), (068), (076), (083), (091) and (102)
C-0 Affiliated Common Stock
(112) Off-Balance Sheet and Other Items LR015 Off-Balance Sheet and Other Items Column (4) Line (24) + (28) $0 X 0.2625 = $0
(113)
Off-Balance Sheet Items Reduction-
Reinsurance LR015 Off-Balance Sheet and Other Items Column (4) Line (25) $0 X 0.3500 = $0
(114)
Off-Balance Sheet Items Increase-
Reinsurance LR015 Off-Balance Sheet and Other Items Column (4) Line (26) $0 X 0.3500 = $0
(115)
Affiliated US Property-Casualty
Insurers LR037 Summary for Affiliated Investments Column (4) Line (1) $0 X 0.3500 = $0
Directly Owned
(116)
Affiliated US Life Insurers Directly
Owned LR037 Summary for Affiliated Investments Column (4) Line (2) $0 X 0.3500 = $0
(117)
Affiliated US Health Insurers
Directly and LR037 Summary for Affiliated Investments Column (4) Line (3) $0 X 0.3500 = $0
Indirectly Owned
(118)
Affiliated US Property-Casualty
Insurers LR037 Summary for Affiliated Investments Column (4) Line (4) $0 X 0.3500 = $0
Indirectly Owned
(119)
Affiliated US Life Insurers
Indirectly Owned LR037 Summary for Affiliated Investments Column (4) Line (5) $0 X 0.3500 = $0
(120)
Affiliated Alien Life Insurers -
Canadian LR037 Summary for Affiliated Investments Column (4) Line (8) $0 X 0.3500 = $0
(121)
Affiliated Alien Life Insurers - All
Others LR037 Summary for Affiliated Investments Column (4) Line (9) $0 X 0.0000 = $0
(122)
Subtotal for C-0 Affiliated Common
Stock Lines (112)-(113)+(114)+(115)+(116)+(117)+(118)+(119)+(120)+(121) $0 $0
Common Stock
(123) Unaffiliated Common Stock LR005 Unaffiliated Preferred and Common Stock Column (5) Line (26) + $0 X 0.3500 = $0
LR016 Off-Balance Sheet Collateral Column (3) Line (16)
(124) Stock Reduction - Reinsurance LR005 Unaffiliated Preferred and Common Stock Column (5) Line (27) $0 X 0.3500 = $0
(125) Stock Increase - Reinsurance LR005 Unaffiliated Preferred and Common Stock Column (5) Line (28) $0 X 0.3500 = $0
(126) BA Common Stock Unaffiliated LR008 Other Long-Term Assets Column (5) Line (47) $0 X 0.3500 = $0
(127)
BA Common Stock Affiliated - C-
1cs LR008 Other Long-Term Assets Column (5) Line (49.2) $0 X 0.3500 = $0

40
(128)
Common Stock Concentration
Factor LR011 Common Stock Concentration Factor Column (6) Line (6) $0 X 0.3500 = $0
(129)
Affiliated Preferred Stock and
Common Stock - LR037 Summary for Affiliated Investments Column (4) Line (7) $0 X 0.3500 = $0
Holding Company in Excess of
Indirect Subs
(130)
Affiliated Preferred Stock and
Common Stock - LR037 Summary for Affiliated Investments Column (4) Line (13) $0 X 0.3500 = $0
All Other
(131) Total for C-1cs Assets Lines (123) - (124) + (125) + (126) + (127) + (128) + (129) + (130) $0 $0
Insurance Risk
(132) Disability Income Premium LR017 Health Premiums Column (2) Lines (19) through (25) $0 X 0.3500 = $0
(133) Long-Term Care Premium LR017 Health Premiums Column (2) Line (26) + LR021 Long-Term Care $0 X 0.3500 = $0
Column (4) Line (7)
(134) Life Insurance C-2 Risk LR023 Life Insurance Column (2) Line (8) $0 X 0.3500 = $0
(135) Group Insurance C-2 Risk LR023 Life Insurance Column (2) Lines (20) and (21) $0 X 0.3500 = $0
(136)
Disability and Long-Term Care
Health LR022 Health Claim Reserves Column (4) Line (9) + Line (15) $0 X 0.3500 = $0
Claim Reserves
(137) Premium Stabilization Credit LR024 Premium Stabilization Reserves Column (2) Line (10) $0 X 0.0000 = $0
(138) Total C-2 Risk Lines (132) + (133) + (134) + (135) + (136) + (137) $0 $0
(139) Interest Rate Risk C-3a LR025 Interest Rate Risk Column (3) Line (36) $0 X 0.3500 = $0
(140) Health Credit Risk LR026 Health Credit Risk Column (2) Line (7) $0 X 0.0000 = $0
(141) Market Risk LR025 Interest Rate Risk Column (3) Line (37) $0 X 0.3500 = $0
(142) Business Risk LR027 Business Risk Column (2) Line (40) $0 X 0.3500 = $0
(143) Health Administrative Expenses LR027 Business Risk Column (2) Line (57) $0 X 0.0000 = $0
(144) Total Tax Effect Lines (111) + (122) + (131) + (138) + (139) + (140) + (141) + (142) + (143) $0 $0
† Denotes lines that are deducted from the total rather than added.
Recommended