Rate Law and Activation Energy Methyl Blue
Determining the Rate Law using the Time Dependent Rate

The Reaction

The Reaction
• Reaction takes about 30 s to a few minutes depending on the initial concentrations
• Can use a continuous monitoring method
• Because there is a color change we can use spectroscopy

The Reaction
• In this experiment, the initial concentration of the hydroxide is at least 1000 times larger than the concentration of the MB
• This means that
• And

Figuring out x
• To figure out the order with respect to the MB+ we will observe [MB+] vs t
• To do this we use Beer’s Law
• Plot At vs t, LN(At) vs t and 1/At vs t to see if the reaction is zeroth order, first order or second order wrt MB+
Absorbance
Constants

The MathZeroth Order First Order
Second Order• The slope of the linear curve will get you k’=k[OH-]o
y to within a constant
• Repeating the experiment at a second [OH-] will get you access to how slope depends on [OH-] and get y
Figuring out x
At LN(At) 1/At
Which one gives a straight line?
If straight x = 0 If straight x = 1 If straight x = 2

Part A: Set Up Spectrometer*• First we need to Calibrate the Spectrometer by placing an empty cuvette in the
cuvette holder (follow instructions on the first page of the spectroVis handout sheet)
• Once Calibrated we need to record the absorption spectrum of Methyl Blue, by placing a cuvette with MB in it in the spectrometer and collecting absorbance vs wavelength
• Find the wavelength λmax of maximal absorption make a note in you notebook and print the graph for each group member
• Set up the spectrometer to record absorbance vs time at λmax (see page 3 on the handout)
* Follow procedures set out in the Vernier
handout

Part B: Determining x the order of reaction with respect to the Methyl Blue
Methyl Blue 0.1 M NaOH
Beaker 1Measure 10 mL
Methyl Blue
Beaker 2Measure 10 mL
NaOH
Transfer contents of beaker 2 into beaker 1
Fill Cuvette and transfer to spectrometerrecord absorbance 3 mins

• Follow instructions in the lab manual to plot A vs t, LN(A) vs t and 1/A vs t
• Fit each graph to a linear fit and determine which gives the best straight line this will tell you if x = 0, x = 1 or x = 2
• Record data in your notebook• Do 5 trials and use the average to determine k’ = k[OH]y
Part B: Determining x the order of reaction with respect to the Methyl Blue
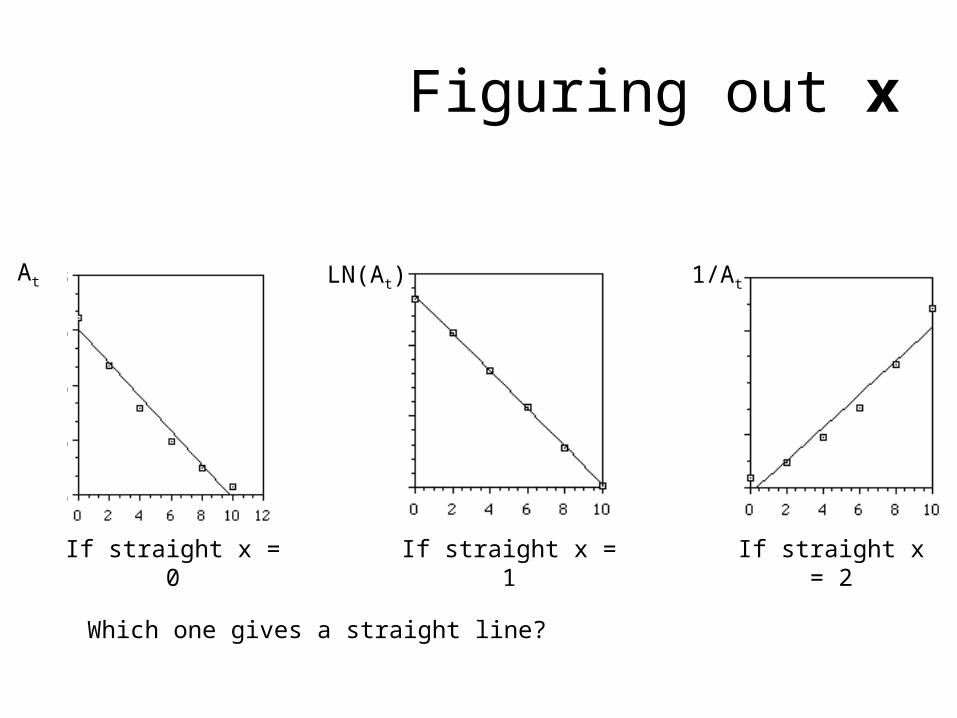
• Repeat part B with 0.5M NaOH• Measure the absorbance vs time and determine k’= k[OH]y
• Repeat 5 times to improve your statistics• Following the method shown in the sample report by taking
the ratio of k[OH]y for the 2 concentrations y can be determined
Part C: Determining y the order of reaction with respect to the hydroxide

We need to determine the rate constant at different temperatures
Each group needs to perform – 2 runs at a temperatures below room temperature– 2 runs at a temperatures above room temperature– 2 runs at room temperature– Post of the board the temperature (oC) and the slope of the LN(A) vs t
graph
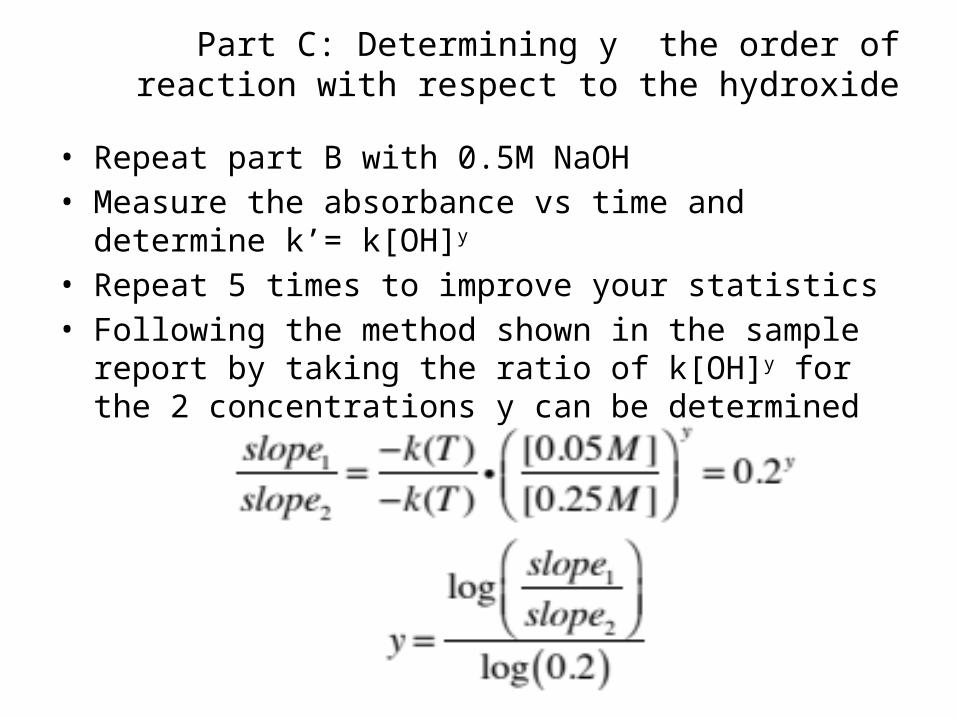
Part D: Determining Ea and A
Part D: Determining Ea and A
ignition tubes
hotplate
methyl blue0.1 M NaOH
thermometer
• place NaOH in one ignition tube and the MB in the other sit them in a beaker of warm water sitting on the hot plate allow them time to reach thermal equilibrium record Tbefore
• Then pour the contents from one tube into the other, leaving it in the water bath, stir with the thermometer and transfer some of the mixture into the cuvette
• Record A vs t for 20 seconds• Measure the temperature of the solution in the cuvette after Tafter

Calculating Ea and A• Using your 6 trials, calculate k, ln(k), T(K) and 1/T• Make an Arrhenius plot ln(k) vs. 1/T
0.00335 0.0034 0.00345 0.0035 0.00355 0.0036
-4.5
-4
-3.5
-3
-2.5
-2
-1.5
-1
-0.5
0
f(x) = − 4707.99519198426 x + 12.8915959476479R² = 0.998760932500059
ln(k) vs 1/T
1/T (1/K)
ln(k
)
Recommended