May 24, 2018
ICICI Securities Ltd | Retail Equity Research
Result Update
Healthy EBITDA/t despite input pressure…
Ramco reported a mixed set of Q4FY18 numbers. Revenues increased
22.3% YoY to | 1,254.8 crore (vs. I-direct estimate of | 1,206.5 crore) led
by 20.2% YoY increase in volumes to 2.7 MT (vs. I-direct estimate of 2.6
MT) due to higher sales in eastern region. Further, realisation increased
1.8% YoY to | 4,586 (vs. I-direct estimate of | 4,710)
EBITDA/t declined 16.4% YoY to | 995/t (vs. I-direct estimate of
| 1,098/t) mainly led by 30.7% YoY increase in power cost/t and 12.6%
YoY increase in freight cost/t
The company has reduced its debt by | 310 crore and recommended a
dividend of | 3/share in FY18. The company plans to add 1.5 MT clinker
capacity at Andhra Pradesh for | 680 crore. This expansion is in addition
to 3 MT capacity expansion announced by the company previously
Operating markets key beneficiary of increased infra spends…
The pick-up in road tendering activity, improved sand availability in the
company’s operating markets and healthy demand from government’s low
cost housing programme are expected to be key drivers of cement demand.
As a result, we expect demand (15 MT) to outpace supply (7 MT) positively
impacting utilisation levels. Consequently, we expect Ramco’s operating
markets to register growth of 7-8% over the next three to four years.
Capacity expansion to further drive growth…
The company has over the years penetrated the West Bengal and Odisha
market. Ramco is planning to further penetrate in the east through capacity
expansion. Of the 4.5 MT capacity expansion planned by the company, 2 MT
will be in the east (1 MT each in West Bengal, Odisha) while 2.5 MT will be
set up in the south (in Andhra Pradesh). The capacity expansion in the east
will enable the company to remove capacity constraint and also increase its
market share. Apart from expansion in the east, the capacity expansion in AP
(south) will enable it to tap the growing opportunity of this market (that is
expected to grow at 14% CAGR in the next two to three years).
Healthy cash flow generation to keep balance sheet light!
During the downturn in the south in FY10-15, efficient management of cash
flows has enabled the company to reduce debt-equity from 1.6x to 1.0x in
FY15 and further to 0.3x in FY18. Going forward, we believe the company’s
robust cash flow generation (~| 2,500 crore in FY18-20E) will not only
enable to fund its capex through internal accruals but also maintain its debt-
equity at 0.3x.
Better sand availability, improving margins key positives; maintain BUY
Better sand availability in Tamil Nadu, one of the key markets of Ramco
Cement (~60% of capacity share), is expected to be a key contributor to
volume growth in coming years. This coupled with higher penetration in the
eastern markets will give a tailwind to overall volume growth. Apart from
higher penetration in the east, we expect the southern region to witness an
upturn mainly led by higher government spending on low cost housing,
irrigation and other infra projects. Considering this, coupled with capacity
expansion we expect revenues to grow at a CAGR of 14.1% in FY18-20E. In
addition, we expect the EBITDA margin to improve from FY18 onwards
mainly led by stabilisation of power costs and improvement in freight costs.
Considering the capacity expansion, better leverage (D/E: 0.3x) and cost
efficiency, Ramco is currently trading at attractive valuations. Hence, we
maintain our BUY rating on the stock with an SOTP based target price of
| 930 (i.e. 15x FY20E EV/EBITDA).
Ramco Cements (RAMCEM) | 795
Rating matrix
Rating : Buy
Target : | 930
Target Period : 9-12 months
Potential Upside : 17%
What’s changed?
Target Price
EPS FY19E
EPS FY20E
Rating
Changed from | 822 to | 930
Changed from | 30.1 to | 29.1
Unchanged
Changed from | 37.3 to | 35.0
Quarterly performance
Q4FY18 Q4FY17 YoY (%) Q3FY18 QoQ (%)
Revenue 1,254.8 1,026.2 22.3 1,056.4 18.8
EBITDA 272.2 270.8 0.5 235.3 15.7
EBITDA (%) 21.7 26.4 -470 bps 22.3 -58 bps
PAT 108.6 134.5 -19.2 122.7 -11.5
Key financials
FY17 FY18 FY19E FY20E
Net Sales 3949.5 4406.4 4983.2 5734.0
EBITDA 1176.4 1099.4 1333.2 1587.2
Net Profit 649.3 555.7 684.5 825.1
EPS (|) 27.3 23.5 29.1 35.0
Valuation summary
(x) FY17 FY18 FY19E FY20E
P/E 29.0 33.7 27.3 22.6
Target P/E 34.1 39.6 32.0 26.5
EV/EBITDA 17.1 18.0 15.2 12.7
EV/Tonne (US$) 203.5 200.3 192.6 159.8
P/BV 5.0 4.6 4.1 3.6
RoNW (%) 17.4 13.7 15.2 16.1
RoCE (%) 12.7 10.4 11.5 12.2
Stock data
Particulars Amount (| crore)
Market Capitalisation 18855.7
Total Debt (FY18) 1113.2
Cash (FY18) 146.8
EV 19822.1
52 week H/L (|) 879/649
Equity Capital 23.6
Face Value (|) 1.0
Price performance
1M 3M 6M 12M
ACC -12.7 -16.7 -22.0 -17.7
UltraTech Cement -3.3 -7.4 -9.6 -11.1
Ramco Cement 1.9 16.3 15.9 20.4
Research Analyst
Rashesh Shah
Devang Bhatt

ICICI Securities Ltd | Retail Equity Research Page 2
Variance analysis
Q4FY18 Q4FY18E Q4FY17 YoY (%) Q3FY18 QoQ (%) Comments
Net Sales 1,254.8 1,206.5 1,026.2 22.3 1,056.4 18.8 20.2% YoY growth in volumes led to a rise in revenues during the quarter
Other income 19.0 5.8 6.5 193.8 5.2 268.4
Raw Material Expenses 168.4 157.3 123.6 36.3 143.3 17.6
Employee Expenses 73.8 73.2 67.3 9.7 75.9 -2.8
Power and fuel 217.6 197.5 138.5 57.1 170.8 27.4
Higher pet coke prices and exhaustion of low cost pet coke inventory led to
increase in power and fuel cost
Freight 354.1 329.6 261.6 35.3 284.0 24.7 The rise in freight cost was mainly due to increase in diesel prices
Others 168.7 167.7 164.4 2.6 147.1 14.7
EBITDA 272.2 281.3 270.8 0.5 235.3 15.7
EBITDA Margin (%) 21.7 23.3 26.4 -470 bps 22.3 -58 bps The fall in EBITDA margins was mainly due to increase in operating expenses
Interest 10.5 29.6 20.1 -48.0 16.0 -34.7
Depreciation 75.4 69.9 85.4 -11.6 73.0 3.4
PBT 205.3 187.6 171.8 19.5 151.5 35.6
Total Tax 96.7 46.9 37.3 159.1 28.7 236.9
Reported PAT 108.6 140.7 134.5 -19.2 122.7 -11.5
Adjusted PAT 108.6 140.7 134.5 -19.2 122.7 -11.5 Higher tax expanses and lower operating margins led to decline in PAT
Key Metrics
Volume (MT) 2.74 2.56 2.28 20.2 2.27 20.3
Higher sales in the east and improving demand in Tamil Nadu led to increase in
volumes in the quarter
Realisation (|) 4,586 4,710 4,507 1.8 4,645 -1.3 Prices remained stable in south
EBITDA per Tonne (|) 995 1,098 1,189 -16.4 1,035 -3.9 The fall in EBITDA/t was mainly led by higher power & fuel cost
Source: Company, ICICI Direct Research
Change in estimates
(| Crore) Old New % Change Old New % Change Comments
Revenue 4,878.4 4,983.2 2.1 5,610.6 5,734.0 2.2
We expect revenues to increase at a CAGR of 14.1% over FY18-
20E mainly led by capacity expansion and increased penetration in
the east
EBITDA 1,326.4 1,333.2 0.5 1,557.9 1,587.2 1.9
EBITDA Margin (%) 27.2 26.8 -44 bps 27.8 27.7 -9 bps We expect EBITDA margin to improve led by cost efficiency
PAT 709.4 684.5 -3.5 878.0 825.1 -6.0
EPS (|) 30.1 29.1 -3.5 37.3 35.0 -6.1
FY19E FY20E
Source: Company, ICICI Direct Research
Assumptions
Comments
FY16 FY17 FY18 FY19E FY20E FY19E FY20E
Volume (MT) 7.2 8.3 9.3 10.3 11.6 10.1 11.3
Better sand availability in Tamil Nadu and higher government
spend to drive volumes over the next three years
Realisation (|) 4,940 4,731 4,732 4,824 4,934 4,847 4,955
EBITDA per Tonne (|) 1,482 1,409 1,181 1,291 1,366 1,318 1,376
We expect company to register EBITDA/t of above | 1300 in
FY20E
EarlierCurrent
Source: Company, ICICI Direct Research
ICICI Securities Ltd | Retail Equity Research Page 3
Company Analysis
Operating markets key beneficiary of increased infra spends…
The pick-up in road tendering activity, improved sand availability in the
company’s operating markets and healthy demand from the government’s
low cost housing programme are expected to be key drivers of cement
demand. In addition, we expect an improvement in pricing to continue in the
company’s key markets led by pick up in demand. Consequently, we expect
Ramco to register revenue growth of 14.1% over FY18-20E.
Cement demand in south to outpace capacity expansion…
New capacity expansion in the southern region in FY14-18 slowed down to
10 MT vs. about 27 MT in the preceding four years. Going forward, we
expect capacity expansion to further slow down to ~7 MT in FY18-20E.
Hence, supply pressure from new players/capacity should remain low.
Further, with an improvement in demand led by infra projects and individual
house builders, we expect demand (15 MT) to outpace supply (7 MT)
positively impacting utilisation levels. We expect utilisation to improve from
57% in FY18 to 63% in FY20E thereby positively impacting margins levels.
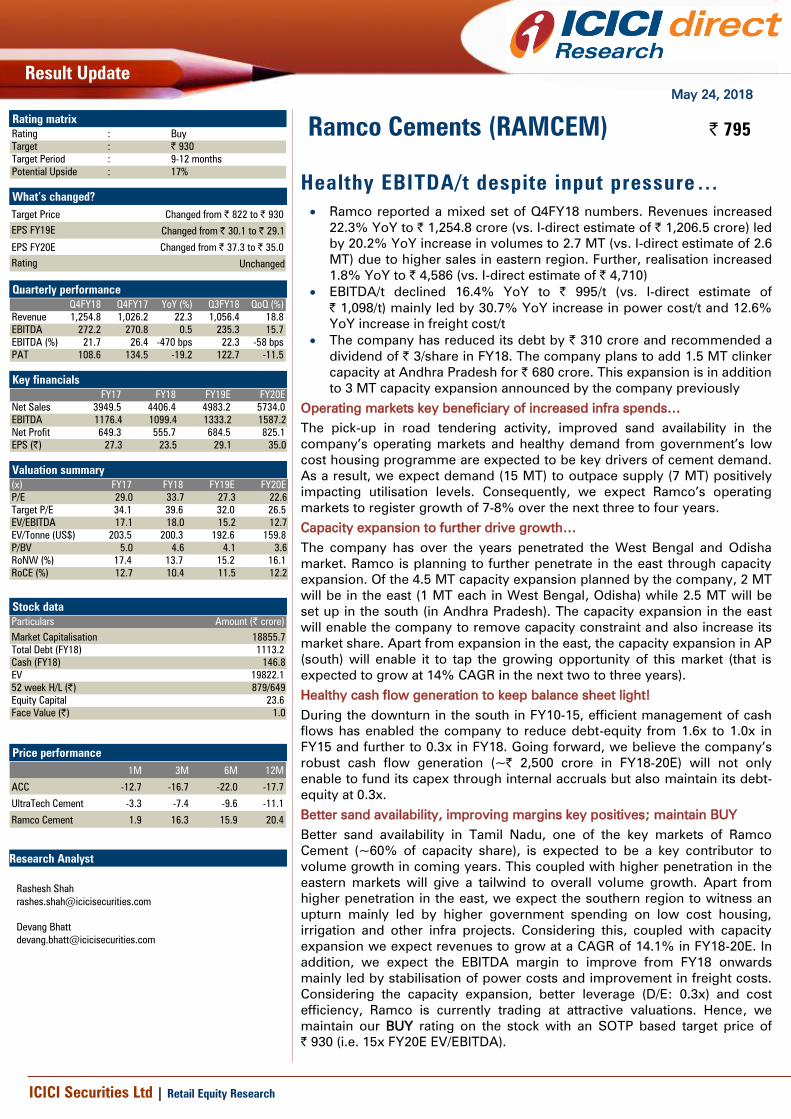
Ramco enjoys premium positioning in southern markets…
Ramco is the second largest cement player in the south in terms of capacity.
Further, it is one of the oldest cement players in southern India and is
considered a Tier-I cement brand. The company enjoys strong brand
recognition among IHB customers due to its reach in the rural interiors of
Tamil Nadu and Kerala compared to other leading brands. While the
company’s brand is a premium one in Tamil Nadu, Kerala and Karnataka, it
falls in the tier-II bracket in Andhra Pradesh.
Exhibit 1: Capacity of major players in south
20.5
15.514.2 14.2
9.4
0
5
10
15
20
25
Ultratech Ramco India Cement Chettinad Cement ACC
Capacity (in mt)
Source: Company, ICICI Direct Research
Operational efficiency enables company to maintain cost discipline
Ramco has been one of the most cost effective players in the industry.
Despite lower capacity utilisation, the company has been able to maintain its
cost at a lower level compared to most of its peers. The company has
gradually shifted from coal usage to pet coke, which avoids uncertainty
about coal availability. The company now uses 100% pet coke. As a result,
fuel consumption has reduced gradually. Ramco has 175 MW of captive
thermal power plants, which makes it self sufficient in terms of power
requirement for its existing capacity. The company’s power requirement per
tonne of cement is as low as ~75 units vis-à-vis industry average of ~80-85
units. Apart from lower power cost compared to industry the company’s
other costs are also lower compared to its peers.
ICICI Securities Ltd | Retail Equity Research Page 4
…Capacity expansion from 16.5 MT to 21.0 MT to further boost growth
The company plans to expand its capacity to 21.0 MT from the current 16.5
MT. Of the 4.5 MT capacity expansion, 2 MT capacity will be in the East (1
MT each in West Bengal and Odisha) and 2.5 MT in the south (in Andhra
Pradesh). These projects are expected to be commissioned within 18
months. The total cost of expansion is expected to be | 1,775 crore.
Commissioning of grinding unit in east to remove capacity constraint and
further rationalise freight cost
Since its West Bengal (WB) capacity is fully utilised, Ramco plans to expand
it further to 2 MT from the current 1 MT. We believe this will help gain further
market share and also consolidate its position in the West Bengal market.
The company will also commission a new grinding unit at Odisha of 1 MT,
which will help rationalise freight cost. Currently, Ramco is supplying cement
to Odisha via the sea route. The commissioning of the new grinding unit will
enable the company to supply clinker to Odisha via the sea route.
Capacity expansion in Andhra Pradesh to help tap growing market
Apart from expansion in the east, the company aims to tap the growing
opportunity in the Andhra Pradesh market (a key growth driver in the
southern market). It will increase its existing grinding unit capacity at Vizag,
Andhra Pradesh from ~1.0 MT to 2.0 MT and clinker capacity from 3.7 MT to
5.2 MT at Jayanthipuram.
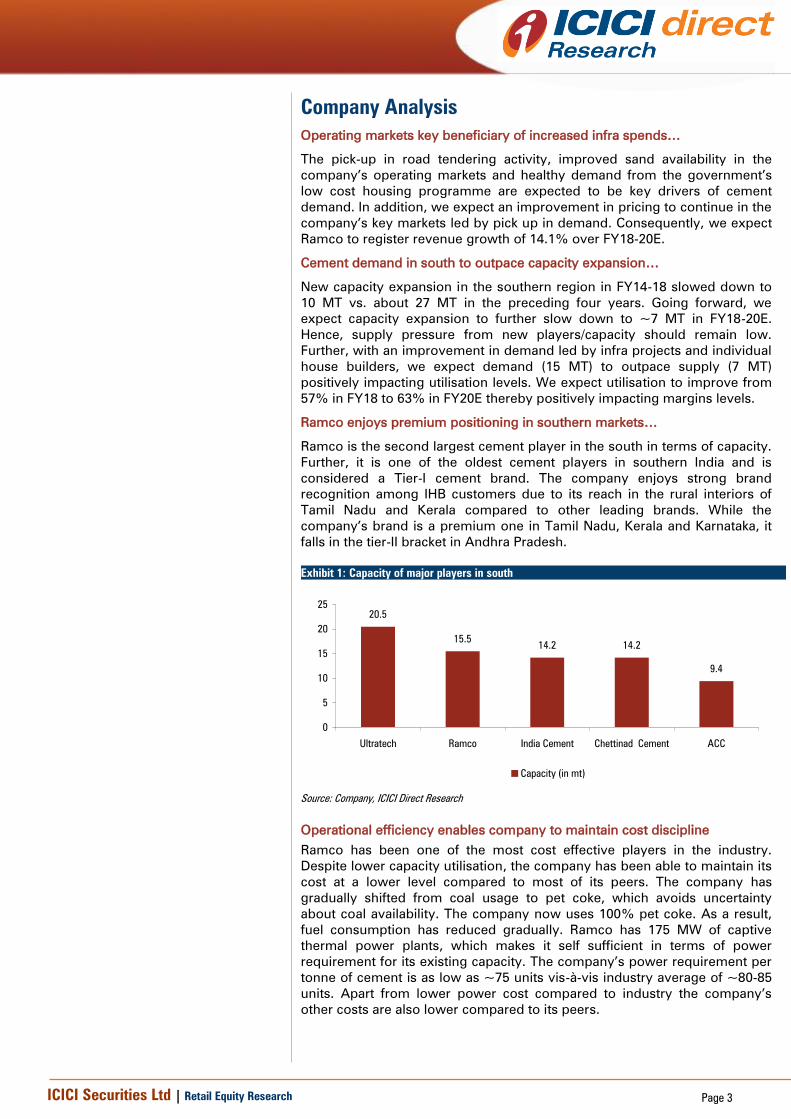
Exhibit 2: Historical capacity addition trend
10.5 10.5 10.5
12.5 12.5 12.5 12.5 12.5 12.5
2.0 2.0 2.03.1 3.1
4.0 4.0 4.0 4.0
12.4 12.4 12.4
15.5 15.516.5 16.5 16.5 16.5
0.0
5.0
10.0
15.0
20.0
FY10 FY11 FY12 FY13 FY14 FY15 FY16 FY17 FY18
Intergrated unit Grinding unit Total
Source: Company, ICICI Direct Research
Exhibit 3: Future capacity additions
Integrated unit FY17 FY18 FY19E FY20E
RR Nagar, Tamil Nadu 2.0 2.0 2.0 2.0
Alathiyur, Tamil Nadu 3.1 3.1 3.1 3.1
Ariyalur, Tamil Nadu 3.5 3.5 3.5 3.5
Chitradurga, Karnataka 0.3 0.3 0.3 0.3
Jayanthipuram, Andhra Pradesh 3.7 3.7 3.7 5.2
Total [A] 12.5 12.5 12.5 14.0
Grinding Unit
Uthiramerur, Tamil Nadu 0.5 0.5 0.5 0.5
Salem, Tamil Nadu 1.6 1.6 1.6 1.6
Kolaghat, West Bengal 1.0 1.0 1.5 2.0
Vizag, Andhra Pradesh 1.0 1.0 1.5 2.0
Odisha Grinding Unit 1.0
Total [B] 4.0 4.0 5.0 7.1
Total Capacity [A+B] 16.5 16.5 17.5 21.0
Source: Company, ICICI Direct Research
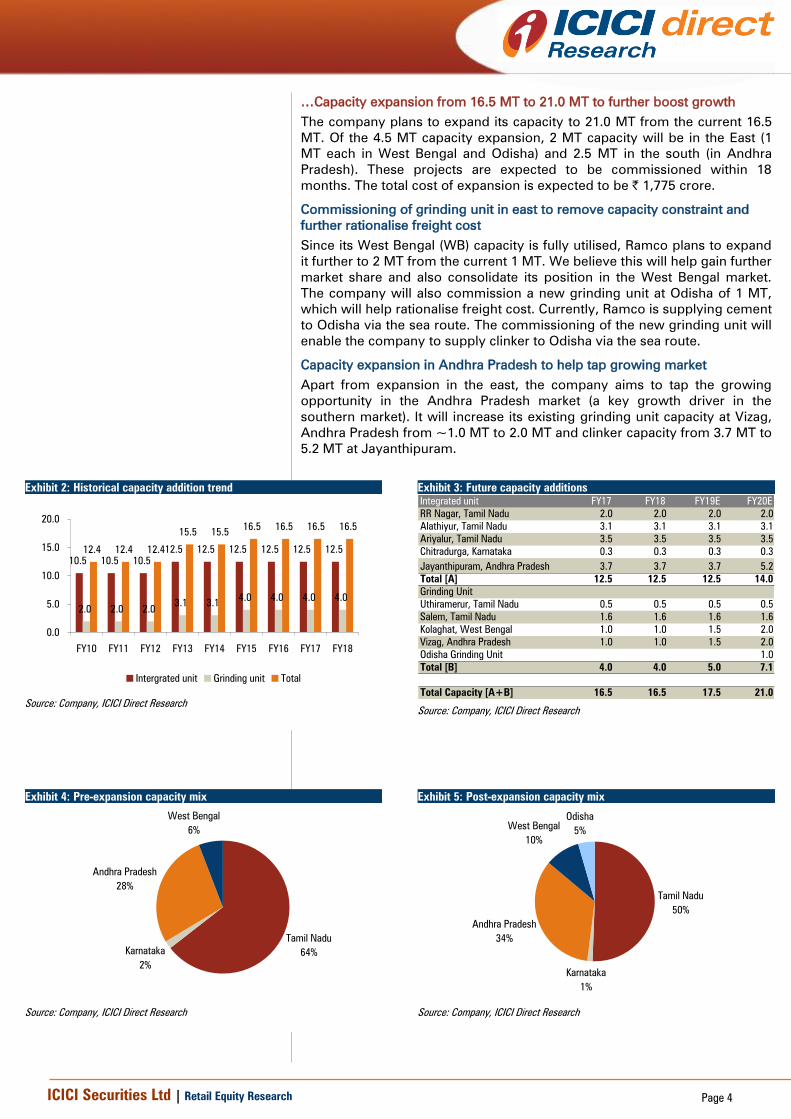
Exhibit 4: Pre-expansion capacity mix
Tamil Nadu
64%Karnataka
2%
Andhra Pradesh
28%
West Bengal
6%
Source: Company, ICICI Direct Research
Exhibit 5: Post-expansion capacity mix
Tamil Nadu
50%
Karnataka
1%
Andhra Pradesh
34%
West Bengal
10%
Odisha
5%
Source: Company, ICICI Direct Research

ICICI Securities Ltd | Retail Equity Research Page 5
Expect revenue CAGR of 14.1% during FY18-20E
Ramco’s revenues have grown at a modest pace of CAGR 2.4% in FY14-17
mainly due to weak market condition in the south and lower utilisation in the
east. However, in FY17, the revenues increased 10.5% YoY due to a pick-up
in cement demand and increased market share in the eastern region. Going
forward, we expect revenues to increase at a CAGR of 14.1% in FY18-20E
mainly led by capacity expansion, revival in the rural economy and increased
government spending.
Exhibit 6: Revenues to increase at 14.1% CAGR over FY18-20E
3949.5
4406.4
4983.2
5734.0
500.0
1500.0
2500.0
3500.0
4500.0
5500.0
6500.0
FY17 FY18 FY19E FY20E
Source: Company, ICICI Direct Research
Exhibit 7: Capacity details
Particulars Year Cement Capacity
Opening FY18 16.5
Addition Q3FY19 1.0
Addition Q1FY20 2.0
Addition FY20 1.5
Total 21.0
Source: Company, ICICI Direct Research
Exhibit 8: Volume to increase at CAGR of 11.7% over FY18-20E
11.6
10.3
9.3
8.3
0.0
2.0
4.0
6.0
8.0
10.0
12.0
14.0
FY17 FY18 FY19E FY20E
Source: Company, ICICI Direct Research
Exhibit 9: Realisation to increase at CAGR of 2.1% over FY18-20E
4934
4824
47324731
4600
4650
4700
4750
4800
4850
4900
4950
FY17 FY18 FY19E FY20E
Source: Company, ICICI Direct Research
Exhibit 10: Volumes in Q4FY18 increase 20% YoY
2.7
2.32.22.22.32.02.02.1
0.0
0.5
1.0
1.5
2.0
2.5
3.0
Q1FY17
Q2FY17
Q3FY17
Q4FY17
Q1FY18
Q2FY18
Q3FY18
Q4FY18
Source: Company, ICICI Direct Research
Exhibit 11: Realisation in Q4FY18 declines 1.8% YoY
4586
4645
4956
4785
4507
4760
5006
4668
4200
4300
4400
4500
4600
4700
4800
4900
5000
5100
Q1FY17
Q2FY17
Q3FY17
Q4FY17
Q1FY18
Q2FY18
Q3FY18
Q4FY18
Source: Company, ICICI Direct Research
ICICI Securities Ltd | Retail Equity Research Page 6
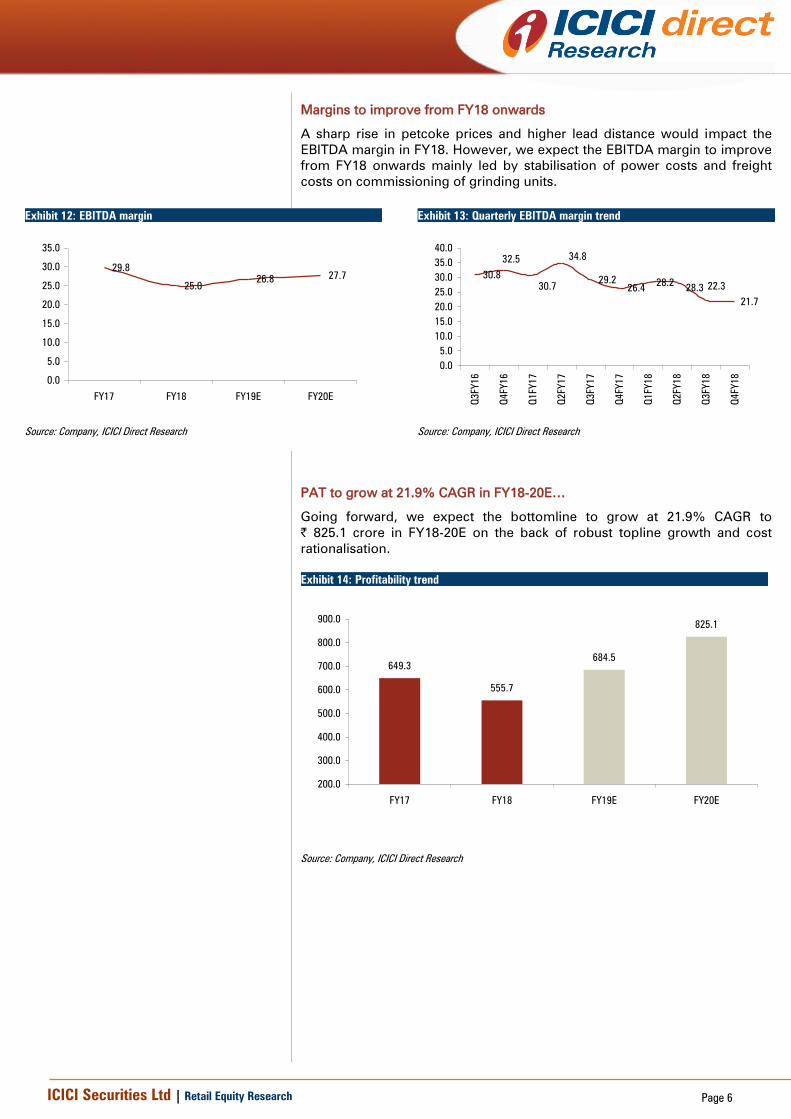
Margins to improve from FY18 onwards
A sharp rise in petcoke prices and higher lead distance would impact the
EBITDA margin in FY18. However, we expect the EBITDA margin to improve
from FY18 onwards mainly led by stabilisation of power costs and freight
costs on commissioning of grinding units.
Exhibit 12: EBITDA margin
29.8
25.026.8
27.7
0.0
5.0
10.0
15.0
20.0
25.0
30.0
35.0
FY17 FY18 FY19E FY20E
Source: Company, ICICI Direct Research
Exhibit 13: Quarterly EBITDA margin trend
30.829.2
26.428.2
21.7
28.3 22.3
34.8
30.7
32.5
0.0
5.0
10.0
15.0
20.0
25.0
30.0
35.0
40.0
Q3FY16
Q4FY16
Q1FY17
Q2FY17
Q3FY17
Q4FY17
Q1FY18
Q2FY18
Q3FY18
Q4FY18
Source: Company, ICICI Direct Research
PAT to grow at 21.9% CAGR in FY18-20E…
Going forward, we expect the bottomline to grow at 21.9% CAGR to
| 825.1 crore in FY18-20E on the back of robust topline growth and cost
rationalisation.
Exhibit 14: Profitability trend
649.3
555.7
684.5
825.1
200.0
300.0
400.0
500.0
600.0
700.0
800.0
900.0
FY17 FY18 FY19E FY20E
Source: Company, ICICI Direct Research

ICICI Securities Ltd | Retail Equity Research Page 7
Outlook and valuation
Better sand availability in Tamil Nadu, one of the key markets of Ramco
Cement (~60% of capacity share), is expected to be a key contributor to
volume growth in the coming years. This coupled with higher penetration in
the eastern markets will give a tailwind to overall volume growth. Apart from
higher penetration in the east, we expect the southern region to witness an
upturn mainly led by higher government spending on low cost housing,
irrigation and other infra projects. Considering this, coupled with capacity
expansion we expect revenues to grow at a CAGR of 14.1% in FY18-20E. In
addition, we expect the EBITDA margin to improve from FY18 onwards
mainly led by stabilisation of power costs and improvement in freight costs.
Considering the capacity expansion, better leverage (D/E: 0.3x) and cost
efficiency, Ramco is currently trading at attractive valuations. Hence, we
maintain our BUY rating on the stock with an SOTP based target price of
| 930 (i.e. 15x FY20E EV/EBITDA).
Exhibit 15: One year forward EV/tonne
0
1000
2000
3000
4000
5000
May-12
Aug-12
Nov-12
Feb-13
May-13
Aug-13
Nov-13
Feb-14
May-14
Aug-14
Nov-14
Feb-15
May-15
Aug-15
Nov-15
Feb-16
May-16
Aug-16
Nov-16
Feb-17
May-17
Aug-17
Nov-17
Feb-18
May-18
Million $
EV $240 $200 $175 $125 $80
Source: Company, ICICI Direct Research
Exhibit 16: One year forward EV/EBITDA
1000.0
11000.0
21000.0
31000.0
41000.0
May-12
Sep-12
Jan-13
May-13
Sep-13
Jan-14
May-14
Sep-14
Jan-15
May-15
Sep-15
Jan-16
May-16
Sep-16
Jan-17
May-17
Sep-17
Jan-18
May-18
EV 18.0x 15.0x 12.0x 10.0x 8.0x 6.0x
Source: Company, ICICI Direct Research
Exhibit 17: Valuation
Sales Growth EPS Growth EV/Tonne EV/EBITDA RoNW RoCE
(| cr) (%) (|) (%) (US$) (x) (%) (%)
FY16 3,573.26 -2.0 22.8 127.7 210.9 19.5 17.5 12.2
FY17 3,949.54 10.5 27.3 19.8 203.5 17.1 17.4 12.7
FY18 4,406.36 11.6 23.5 -13.9 200.3 18.0 13.7 10.4
FY19E 4,983.21 13.1 29.1 23.7 192.6 15.2 15.2 11.5
FY20E 5,733.99 15.1 35.0 20.6 159.8 12.7 16.1 12.2
Source: Company, ICICI Direct Research

ICICI Securities Ltd | Retail Equity Research Page 8
Recommendation history vs. consensus estimate
0
200
400
600
800
1,000
May-
18
Mar-
18
Feb-
18
Dec-
17
Nov-
17
Sep-
17
Jul-
17
Jun-
17
Apr-
17
Mar-
17
Jan-
17
Dec-
16
Oct-
16
Sep-
16
Jul-
16
Jun-
16
Apr-
16
Feb-
16
Jan-
16
Nov-
15
Oct-
15
Aug-
15
Jul-
15
May-
15
(|
)
0.0
20.0
40.0
60.0
80.0
100.0
(%
)
Price Idirect target Consensus Target Mean % Consensus with BUY
Source: Bloomberg, Company, ICICI Direct Research, * Initiated coverage on October 23, 2017
Key events
Date Event
May-09 Ramco sets up 1 MT grinding unit in in Kanchipuram district, Tamil Nadu
May-09 The company sets up 1.6 MT grinding unit in Salem, Tamil Nadu
Feb-10 The company commisions 1 MT grinding unit in Kolaghat, West Bengal
Mar-12 Increased the capacity at Ariyalur, Tamil Nadu by 1.5 MT taking the total capacity of the plant to 3.5 MT
Mar-15 1 MT grinding unit started in Vizag, Andhra Pradesh
Source: Company, ICICI Direct Research
Top 10 Shareholders Shareholding Pattern
Rank Name Latest Filing Date % O/S Position (m) Change (m)
1 Ramco Group 31-Mar-18 34.9 82.2 0.0
2 L&T Investment Management Limited 31-Mar-18 4.4 10.4 1.5
3 Tamil Nadu, State of 31-Mar-18 3.4 8.0 0.0
4 Kotak Mahindra Asset Management Company Ltd. 31-Mar-18 3.2 7.6 0.1
5 SBI Funds Management Pvt. Ltd. 30-Apr-18 2.7 6.4 -0.2
6 Sundaram Asset Management Company Limited 31-Mar-18 2.5 5.8 0.3
7 Aberdeen Asset Management (Asia) Ltd. 31-Mar-18 2.4 5.7 0.0
8 Sri Vishnu Shankar Mill Ltd 31-Mar-18 1.6 3.9 0.0
9 Ramaraju Surgical Cotton Mills, Ltd. 31-Mar-18 1.5 3.6 0.0
10 HDFC Standard Life Insurance Company Limited 31-Mar-18 1.4 3.3 0.1
(in %) Mar-17 Jun-17 Sep-17 Dec-17 Mar-18
Promoter 42.30 42.67 42.75 42.75 42.75
FII 14.52 14.53 14.83 13.89 13.12
DII 18.88 18.48 18.01 19.05 20.35
Others 24.30 24.32 24.41 24.31 23.78
Source: Reuters, ICICI Direct Research
Recent Activity
Investor name Value Shares Investor name Value Shares
L&T Investment Management Limited 16.56 1.49 Axis Asset Management Company Limited -3.92 -0.34
Sundaram Asset Management Company Limited 3.34 0.30 Invesco Hong Kong Limited -3.33 -0.30
Norges Bank Investment Management (NBIM) 3.67 0.30 The New India Assurance Co. Ltd. -2.96 -0.27
HDFC Standard Life Insurance Company Limited 1.64 0.15 Shamyak Investment Pvt. Ltd. -2.78 -0.25
Canara Robeco Asset Management Company Ltd. 1.39 0.13 SBI Funds Management Pvt. Ltd. -2.63 -0.21
Buys Sells
Source: Reuters, ICICI Direct Research
ICICI Securities Ltd | Retail Equity Research Page 9
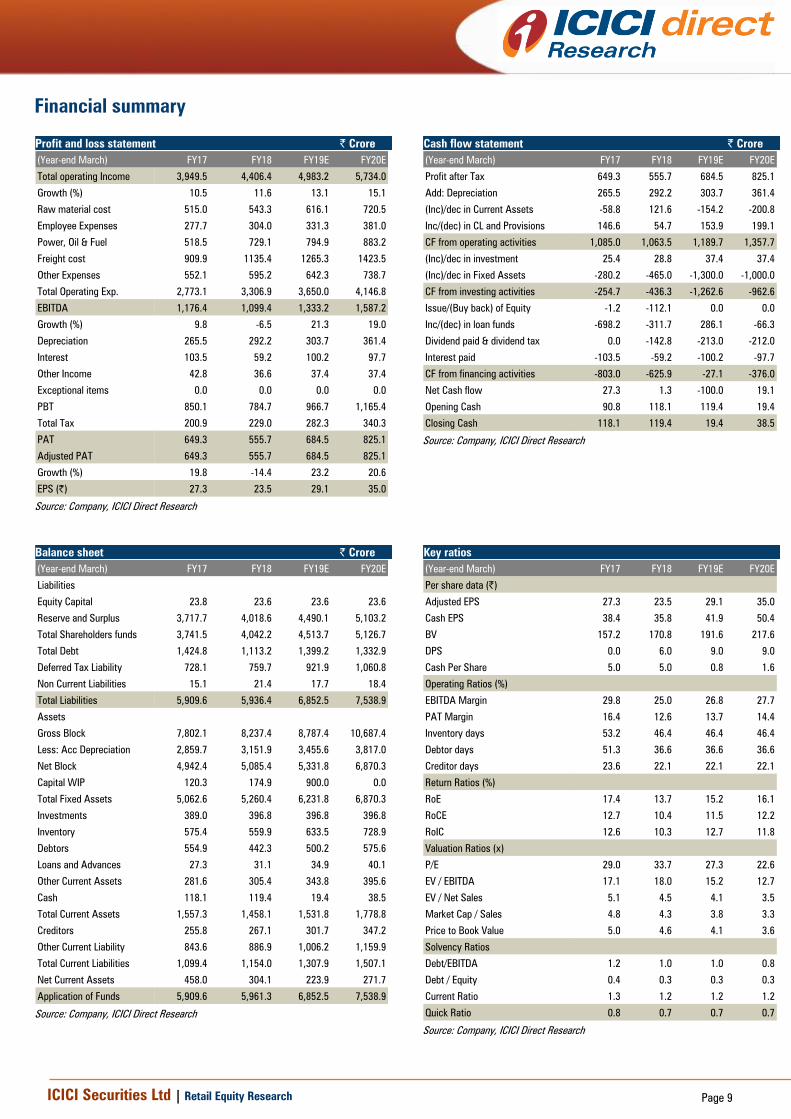
Financial summary
Profit and loss statement | Crore
(Year-end March) FY17 FY18 FY19E FY20E
Total operating Income 3,949.5 4,406.4 4,983.2 5,734.0
Growth (%) 10.5 11.6 13.1 15.1
Raw material cost 515.0 543.3 616.1 720.5
Employee Expenses 277.7 304.0 331.3 381.0
Power, Oil & Fuel 518.5 729.1 794.9 883.2
Freight cost 909.9 1135.4 1265.3 1423.5
Other Expenses 552.1 595.2 642.3 738.7
Total Operating Exp. 2,773.1 3,306.9 3,650.0 4,146.8
EBITDA 1,176.4 1,099.4 1,333.2 1,587.2
Growth (%) 9.8 -6.5 21.3 19.0
Depreciation 265.5 292.2 303.7 361.4
Interest 103.5 59.2 100.2 97.7
Other Income 42.8 36.6 37.4 37.4
Exceptional items 0.0 0.0 0.0 0.0
PBT 850.1 784.7 966.7 1,165.4
Total Tax 200.9 229.0 282.3 340.3
PAT 649.3 555.7 684.5 825.1
Adjusted PAT 649.3 555.7 684.5 825.1
Growth (%) 19.8 -14.4 23.2 20.6
EPS (|) 27.3 23.5 29.1 35.0
Source: Company, ICICI Direct Research
Cash flow statement | Crore
(Year-end March) FY17 FY18 FY19E FY20E
Profit after Tax 649.3 555.7 684.5 825.1
Add: Depreciation 265.5 292.2 303.7 361.4
(Inc)/dec in Current Assets -58.8 121.6 -154.2 -200.8
Inc/(dec) in CL and Provisions 146.6 54.7 153.9 199.1
CF from operating activities 1,085.0 1,063.5 1,189.7 1,357.7
(Inc)/dec in investment 25.4 28.8 37.4 37.4
(Inc)/dec in Fixed Assets -280.2 -465.0 -1,300.0 -1,000.0
CF from investing activities -254.7 -436.3 -1,262.6 -962.6
Issue/(Buy back) of Equity -1.2 -112.1 0.0 0.0
Inc/(dec) in loan funds -698.2 -311.7 286.1 -66.3
Dividend paid & dividend tax 0.0 -142.8 -213.0 -212.0
Interest paid -103.5 -59.2 -100.2 -97.7
CF from financing activities -803.0 -625.9 -27.1 -376.0
Net Cash flow 27.3 1.3 -100.0 19.1
Opening Cash 90.8 118.1 119.4 19.4
Closing Cash 118.1 119.4 19.4 38.5
Source: Company, ICICI Direct Research
Balance sheet | Crore
(Year-end March) FY17 FY18 FY19E FY20E
Liabilities
Equity Capital 23.8 23.6 23.6 23.6
Reserve and Surplus 3,717.7 4,018.6 4,490.1 5,103.2
Total Shareholders funds 3,741.5 4,042.2 4,513.7 5,126.7
Total Debt 1,424.8 1,113.2 1,399.2 1,332.9
Deferred Tax Liability 728.1 759.7 921.9 1,060.8
Non Current Liabilities 15.1 21.4 17.7 18.4
Total Liabilities 5,909.6 5,936.4 6,852.5 7,538.9
Assets
Gross Block 7,802.1 8,237.4 8,787.4 10,687.4
Less: Acc Depreciation 2,859.7 3,151.9 3,455.6 3,817.0
Net Block 4,942.4 5,085.4 5,331.8 6,870.3
Capital WIP 120.3 174.9 900.0 0.0
Total Fixed Assets 5,062.6 5,260.4 6,231.8 6,870.3
Investments 389.0 396.8 396.8 396.8
Inventory 575.4 559.9 633.5 728.9
Debtors 554.9 442.3 500.2 575.6
Loans and Advances 27.3 31.1 34.9 40.1
Other Current Assets 281.6 305.4 343.8 395.6
Cash 118.1 119.4 19.4 38.5
Total Current Assets 1,557.3 1,458.1 1,531.8 1,778.8
Creditors 255.8 267.1 301.7 347.2
Other Current Liability 843.6 886.9 1,006.2 1,159.9
Total Current Liabilities 1,099.4 1,154.0 1,307.9 1,507.1
Net Current Assets 458.0 304.1 223.9 271.7
Application of Funds 5,909.6 5,961.3 6,852.5 7,538.9
Source: Company, ICICI Direct Research
Key ratios
(Year-end March) FY17 FY18 FY19E FY20E
Per share data (|)
Adjusted EPS 27.3 23.5 29.1 35.0
Cash EPS 38.4 35.8 41.9 50.4
BV 157.2 170.8 191.6 217.6
DPS 0.0 6.0 9.0 9.0
Cash Per Share 5.0 5.0 0.8 1.6
Operating Ratios (%)
EBITDA Margin 29.8 25.0 26.8 27.7
PAT Margin 16.4 12.6 13.7 14.4
Inventory days 53.2 46.4 46.4 46.4
Debtor days 51.3 36.6 36.6 36.6
Creditor days 23.6 22.1 22.1 22.1
Return Ratios (%)
RoE 17.4 13.7 15.2 16.1
RoCE 12.7 10.4 11.5 12.2
RoIC 12.6 10.3 12.7 11.8
Valuation Ratios (x)
P/E 29.0 33.7 27.3 22.6
EV / EBITDA 17.1 18.0 15.2 12.7
EV / Net Sales 5.1 4.5 4.1 3.5
Market Cap / Sales 4.8 4.3 3.8 3.3
Price to Book Value 5.0 4.6 4.1 3.6
Solvency Ratios
Debt/EBITDA 1.2 1.0 1.0 0.8
Debt / Equity 0.4 0.3 0.3 0.3
Current Ratio 1.3 1.2 1.2 1.2
Quick Ratio 0.8 0.7 0.7 0.7
Source: Company, ICICI Direct Research
ICICI Securities Ltd | Retail Equity Research Page 10
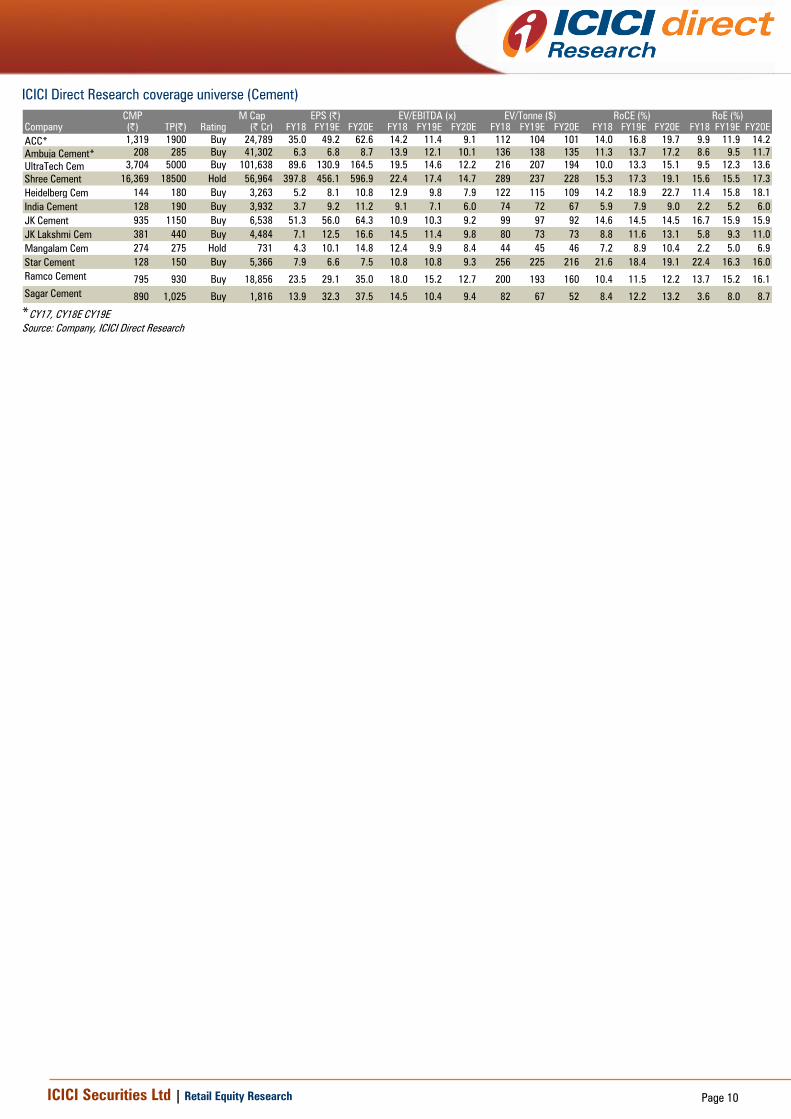
ICICI Direct Research coverage universe (Cement)
CMP M Cap
(|) TP(|) Rating (| Cr) FY18 FY19E FY20E FY18 FY19E FY20E FY18 FY19E FY20E FY18 FY19E FY20E FY18 FY19E FY20E
ACC* 1,319 1900 Buy 24,789 35.0 49.2 62.6 14.2 11.4 9.1 112 104 101 14.0 16.8 19.7 9.9 11.9 14.2
Ambuja Cement* 208 285 Buy 41,302 6.3 6.8 8.7 13.9 12.1 10.1 136 138 135 11.3 13.7 17.2 8.6 9.5 11.7
UltraTech Cem 3,704 5000 Buy 101,638 89.6 130.9 164.5 19.5 14.6 12.2 216 207 194 10.0 13.3 15.1 9.5 12.3 13.6
Shree Cement 16,369 18500 Hold 56,964 397.8 456.1 596.9 22.4 17.4 14.7 289 237 228 15.3 17.3 19.1 15.6 15.5 17.3
Heidelberg Cem 144 180 Buy 3,263 5.2 8.1 10.8 12.9 9.8 7.9 122 115 109 14.2 18.9 22.7 11.4 15.8 18.1
India Cement 128 190 Buy 3,932 3.7 9.2 11.2 9.1 7.1 6.0 74 72 67 5.9 7.9 9.0 2.2 5.2 6.0
JK Cement 935 1150 Buy 6,538 51.3 56.0 64.3 10.9 10.3 9.2 99 97 92 14.6 14.5 14.5 16.7 15.9 15.9
JK Lakshmi Cem 381 440 Buy 4,484 7.1 12.5 16.6 14.5 11.4 9.8 80 73 73 8.8 11.6 13.1 5.8 9.3 11.0
Mangalam Cem 274 275 Hold 731 4.3 10.1 14.8 12.4 9.9 8.4 44 45 46 7.2 8.9 10.4 2.2 5.0 6.9
Star Cement 128 150 Buy 5,366 7.9 6.6 7.5 10.8 10.8 9.3 256 225 216 21.6 18.4 19.1 22.4 16.3 16.0
Ramco Cement795 930 Buy 18,856 23.5 29.1 35.0 18.0 15.2 12.7 200 193 160 10.4 11.5 12.2 13.7 15.2 16.1
Sagar Cement890 1,025 Buy 1,816 13.9 32.3 37.5 14.5 10.4 9.4 82 67 52 8.4 12.2 13.2 3.6 8.0 8.7
RoCE (%) RoE (%)
Company
EV/Tonne ($)EV/EBITDA (x)EPS (|)
*CY17, CY18E CY19E
Source: Company, ICICI Direct Research

ICICI Securities Ltd | Retail Equity Research Page 11
RATING RATIONALE
ICICI Direct Research endeavours to provide objective opinions and recommendations. ICICI Direct Research
assigns ratings to its stocks according to their notional target price vs. current market price and then
categorises them as Strong Buy, Buy, Hold and Sell. The performance horizon is two years unless specified and
the notional target price is defined as the analysts' valuation for a stock.
Strong Buy: >15%/20% for large caps/midcaps, respectively, with high conviction;
Buy: >10%/15% for large caps/midcaps, respectively;
Hold: Up to +/-10%;
Sell: -10% or more;
Pankaj Pandey Head – Research [email protected]
ICICI Direct Research Desk,
ICICI Securities Limited,
1st
Floor, Akruti Trade Centre,
Road No. 7, MIDC,
Andheri (East)
Mumbai – 400 093
ANALYST CERTIFICATION
We /I, Rashesh Shah CA, Darpan Thakkar MBA research analysts, authors and the names subscribed to this report, hereby certify that all of the views expressed in this research report accurately reflect our
personal views about any and all of the subject issuer(s) or securities. We also certify that no part of our compensation was, is, or will be directly or indirectly related to the specific recommendation(s) or
view(s) in this report. Analysts aren't registered as research analysts by FINRA and might not be an associated person of the ICICI Securities Inc.
Disclosures:
ICICI Securities Limited (ICICI Securities) and its affiliates are a full-service, integrated investment banking, investment management and brokerage and financing group. We along with affi liates are leading
underwriter of securities and participate in virtually all securities trading markets in India. We and our affiliates have investment banking and other business relationship with a significant percentage of
companies covered by our Investment Research Department. Our research professionals provide important input into our investment banking and other business selection processes. ICICI Securities
generally prohibits its analysts, persons reporting to analysts and their dependent family members from maintaining a financial interest in the securities or derivatives of any companies that the analysts
cover.
The information and opinions in this report have been prepared by ICICI Securities and are subject to change without any notice. The report and information contained herein is strictly confidential and
meant solely for the selected recipient and may not be altered in any way, transmitted to, copied or distributed, in part or in whole, to any other person or to the media or reproduced in any form, without
prior written consent of ICICI Securities. While we would endeavour to update the information herein on reasonable basis, ICICI Securities, its subsidiaries and associated companies, their directors and
employees (“ICICI Securities and affiliates”) are under no obligation to update or keep the information current. Also, there may be regulatory, compliance or other reasons that may prevent ICICI Securities
from doing so. Non-rated securities indicate that rating on a particular security has been suspended temporarily and such suspension is in compliance with applicable regulations and/or ICICI Securities
policies, in circumstances where ICICI Securities is acting in an advisory capacity to this company, or in certain other circumstances.
This report is based on information obtained from public sources and sources believed to be reliable, but no independent verification has been made nor is its accuracy or completeness guaranteed. This
report and information herein is solely for informational purpose and may not be used or considered as an offer document or solicitation of offer to buy or sell or subscribe for securities or other financial
instruments. Though disseminated to all the customers simultaneously, not all customers may receive this report at the same time. ICICI Securities will not treat recipients as customers by virtue of their
receiving this report. Nothing in this report constitutes investment, legal, accounting and tax advice or a representation that any investment or strategy is suitable or appropriate to your specific
circumstances. The securities discussed and opinions expressed in this report may not be suitable for all investors, who must make their own investment decisions, based on their own investment
objectives, financial positions and needs of specific recipient. This may not be taken in substitution for the exercise of independent judgment by any recipient. The recipient should independently evaluate
the investment risks. The value and return of investment may vary because of changes in interest rates, foreign exchange rates or any other reason. ICICI Securities and affiliates accept no liabilities for any
loss or damage of any kind arising out of the use of this report. Past performance is not necessarily a guide to future performance. Investors are advised to see Risk Disclosure Document to understand the
risks associated before investing in the securities markets. Actual results may differ materially from those set forth in projections. Forward-looking statements are not predictions and may be subject to
change without notice.
ICICI Securities and its affiliates might have managed or co-managed a public offering for the subject company in the preceding twelve months. ICICI Securities and affiliates might have received
compensation from the companies mentioned in the report during the period preceding twelve months from the date of this report for services in respect of public offerings, corporate finance, investment
banking or other advisory services in a merger or specific transaction. It is confirmed that Rashesh Shah CA, Darpan Thakkar MBA research analysts and the authors of this report have not received any
compensation from the companies mentioned in the report in the preceding twelve months. Our research professionals are paid in part based on the profitability of ICICI Securities, which include earnings
from Investment Banking and other business.
ICICI Securities or its subsidiaries collectively do not own 1% or more of the equity securities of the Company mentioned in the report as of the last day of the month preceding the publication of the
research report.
It is confirmed that Rashesh Shah CA, Darpan Thakkar MBA research analysts and the authors of this report or any of their family members does not serve as an officer, director or advisory board member
of the companies mentioned in the report.
ICICI Securities may have issued other reports that are inconsistent with and reach different conclusion from the information presented in this report. ICICI Securities and affiliates may act upon or make use
of information contained in the report prior to the publication thereof.
This report is not directed or intended for distribution to, or use by, any person or entity who is a citizen or resident of or located in any locality, state, country or other jurisdiction, where such distribution,
publication, availability or use would be contrary to law, regulation or which would subject ICICI Securities and affiliates to any registration or licensing requirement within such jurisdiction. The securities
described herein may or may not be eligible for sale in all jurisdictions or to certain category of investors. Persons in whose possession this document may come are required to inform themselves of and
to observe such restriction.

ICICI Securities Ltd | Retail Equity Research Page 12
ANALYST CERTIFICATION
We /I, Rashesh Shah, CA, and Devang Bhatt, PGDBM Research Analysts, authors and the names subscribed to this report, hereby certify that all of the views expressed in this research report accurately
reflect our views about the subject issuer(s) or securities. We also certify that no part of our compensation was, is, or will be directly or indirectly related to the specific recommendation(s) or view(s) in this
report.
Terms & conditions and other disclosures:
ICICI Securities Limited (ICICI Securities) is a full-service, integrated investment banking and is, inter alia, engaged in the business of stock brokering and distribution of financial products. ICICI Securities
Limited is a SEBI registered Research Analyst with SEBI Registration Number – INH000000990. ICICI Securities is a wholly-owned subsidiary of ICICI Bank which is India’s largest private sector bank and has
its various subsidiaries engaged in businesses of housing finance, asset management, life insurance, general insurance, venture capital fund management, etc. (“associates”), the details in respect of which
are available on www.icicibank.com.
ICICI Securities is one of the leading merchant bankers/ underwriters of securities and participate in virtually all securities trading markets in India. We and our associates might have investment banking
and other business relationship with a significant percentage of companies covered by our Investment Research Department. ICICI Securities generally prohibits its analysts, persons reporting to analysts
and their relatives from maintaining a financial interest in the securities or derivatives of any companies that the analysts cover.
The information and opinions in this report have been prepared by ICICI Securities and are subject to change without any notice. The report and information contained herein is strictly confidential and
meant solely for the selected recipient and may not be altered in any way, transmitted to, copied or distributed, in part or in whole, to any other person or to the media or reproduced in any form, without
prior written consent of ICICI Securities. While we would endeavour to update the information herein on a reasonable basis, ICICI Securities is under no obligation to update or keep the information current.
Also, there may be regulatory, compliance or other reasons that may prevent ICICI Securities from doing so. Non-rated securities indicate that rating on a particular security has been suspended
temporarily and such suspension is in compliance with applicable regulations and/or ICICI Securities policies, in circumstances where ICICI Securities might be acting in an advisory capacity to this
company, or in certain other circumstances.
This report is based on information obtained from public sources and sources believed to be reliable, but no independent verification has been made nor is its accuracy or completeness guaranteed. This
report and information herein is solely for informational purpose and shall not be used or considered as an offer document or solicitation of offer to buy or sell or subscribe for securities or other financial
instruments. Though disseminated to all the customers simultaneously, not all customers may receive this report at the same time. ICICI Securities will not treat recipients as customers by virtue of their
receiving this report. Nothing in this report constitutes investment, legal, accounting and tax advice or a representation that any investment or strategy is suitable or appropriate to your specific
circumstances. The securities discussed and opinions expressed in this report may not be suitable for all investors, who must make their own investment decisions, based on their own investment
objectives, financial positions and needs of specific recipient. This may not be taken in substitution for the exercise of independent judgment by any recipient. The recipient should independently evaluate
the investment risks. The value and return on investment may vary because of changes in interest rates, foreign exchange rates or any other reason. ICICI Securities accepts no liabilities whatsoever for any
loss or damage of any kind arising out of the use of this report. Past performance is not necessarily a guide to future performance. Investors are advised to see Risk Disclosure Document to understand the
risks associated before investing in the securities markets. Actual results may differ materially from those set forth in projections. Forward-looking statements are not predictions and may be subject to
change without notice.
ICICI Securities or its associates might have managed or co-managed public offering of securities for the subject company or might have been mandated by the subject company for any other assignment
in the past twelve months.
ICICI Securities or its associates might have received any compensation from the companies mentioned in the report during the period preceding twelve months from the date of this report for services in
respect of managing or co-managing public offerings, corporate finance, investment banking or merchant banking, brokerage services or other advisory service in a merger or specific transaction.
ICICI Securities or its associates might have received any compensation for products or services other than investment banking or merchant banking or brokerage services from the companies mentioned
in the report in the past twelve months.
ICICI Securities encourages independence in research report preparation and strives to minimize conflict in preparation of research report. ICICI Securities or its associates or its analysts did not receive any
compensation or other benefits from the companies mentioned in the report or third party in connection with preparation of the research report. Accordingly, neither ICICI Securities nor Research Analysts
and their relatives have any material conflict of interest at the time of publication of this report.
It is confirmed that Rashesh Shah, CA, and Devang Bhatt, PGDBM Research Analysts of this report have not received any compensation from the companies mentioned in the report in the preceding
twelve months.
Compensation of our Research Analysts is not based on any specific merchant banking, investment banking or brokerage service transactions.
ICICI Securities or its subsidiaries collectively or Research Analysts or their relatives do not own 1% or more of the equity securities of the Company mentioned in the report as of the last day of the month
preceding the publication of the research report.
Since associates of ICICI Securities are engaged in various financial service businesses, they might have financial interests or beneficial ownership in various companies including the subject
company/companies mentioned in this report.
It is confirmed that Rashesh Shah, CA, and Devang Bhatt, PGDBM Research Analysts do not serve as an officer, director or employee of the companies mentioned in the report.
ICICI Securities may have issued other reports that are inconsistent with and reach different conclusion from the information presented in this report.
Neither the Research Analysts nor ICICI Securities have been engaged in market making activity for the companies mentioned in the report.
We submit that no material disciplinary action has been taken on ICICI Securities by any Regulatory Authority impacting Equity Research Analysis activities.
This report is not directed or intended for distribution to, or use by, any person or entity who is a citizen or resident of or located in any locality, state, country or other jurisdiction, where such distribution,
publication, availability or use would be contrary to law, regulation or which would subject ICICI Securities and affiliates to any registration or licensing requirement within such jurisdiction. The securities
described herein may or may not be eligible for sale in all jurisdictions or to certain category of investors. Persons in whose possession this document may come are required to inform themselves of and
to observe such restriction.
Recommended