Atento Fiscal 2015 Fourth Quarter and FY Results
March 8, 2016Lynn Antipas TysonVice President Investor [email protected]

2
This presentation has been prepared by Atento. The information contained in this presentation is for informational purposes only. The informationcontained in this presentation is not investment or financial product advice and is not intended to be used as the basis for making an investmentdecision. This presentation has been prepared without taking into account the investment objectives, financial situation or particular needs of anyparticular person.
This presentation contains forward-looking statements within the meaning of the U.S. federal securities laws, that are subject to risks and uncertainties.All statements other than statements of historical fact included in this presentation are forward-looking statements. Forward-looking statements giveour current expectations and projections relating to our financial condition, results of operations, plans, objectives, future performance and business.Forward-looking statements can be identified by the use of words such as "may," "should," "expects," "plans," "anticipates," "believes," "estimates,""predicts," "intends," "continue“, the negative thereof and other words and terms of similar meaning in connection with any discussion of the timing ornature of future operating or financial performance or other events. These forward-looking statements are based on assumptions that we have madein light of our industry experience and on our perceptions of historical trends, current conditions, expected future developments and other factors webelieve are appropriate under the circumstances. As you consider this presentation, you should understand that these statements are not guarantees ofperformance or results. They involve risks, uncertainties (some of which are beyond our control) and assumptions. Although we believe that theseforward-looking statements are based on reasonable assumptions, you should be aware that many factors could affect our actual financial results andcause them to differ materially from those anticipated in the forward-looking statements. Other factors that could cause our results to differ from theinformation set forth herein are included in the reports that we file with the U.S. Securities and Exchange Commission. We refer you to those reports foradditional detail, including the section entitled “Risk Factors” in our Annual Report on Form 20-F.
Because of these factors, we caution that you should not place undue reliance on any of our forward-looking statements. Further, any forward-lookingstatement speaks only as of the date on which it is made. New risks and uncertainties arise from time to time, and it is impossible for us to predictthose events or how they may affect us. We have no duty to, and do not intend to, update or revise the forward-looking statements in this presentationafter the date of this presentation.
The historical and projected financial information in this presentation includes financial information that is not presented in accordance withInternational Financial Reporting Standards (“IFRS”). We refer to these measures as “non-GAAP financial measurers.” The non-GAAP financialmeasures may not be comparable to other similarly titled measures of other companies and have limitations as analytical tools and should not beconsidered in isolation or as a substitute for analysis of our operating results as reported under IFRS.
Additional information about Atento can be found at www.atento.com.
Disclaimer

Presenters: Alejandro Reynal, CEOMauricio Montilha, CFO

Strategic Overview and Fourth Quarter Highlights
5
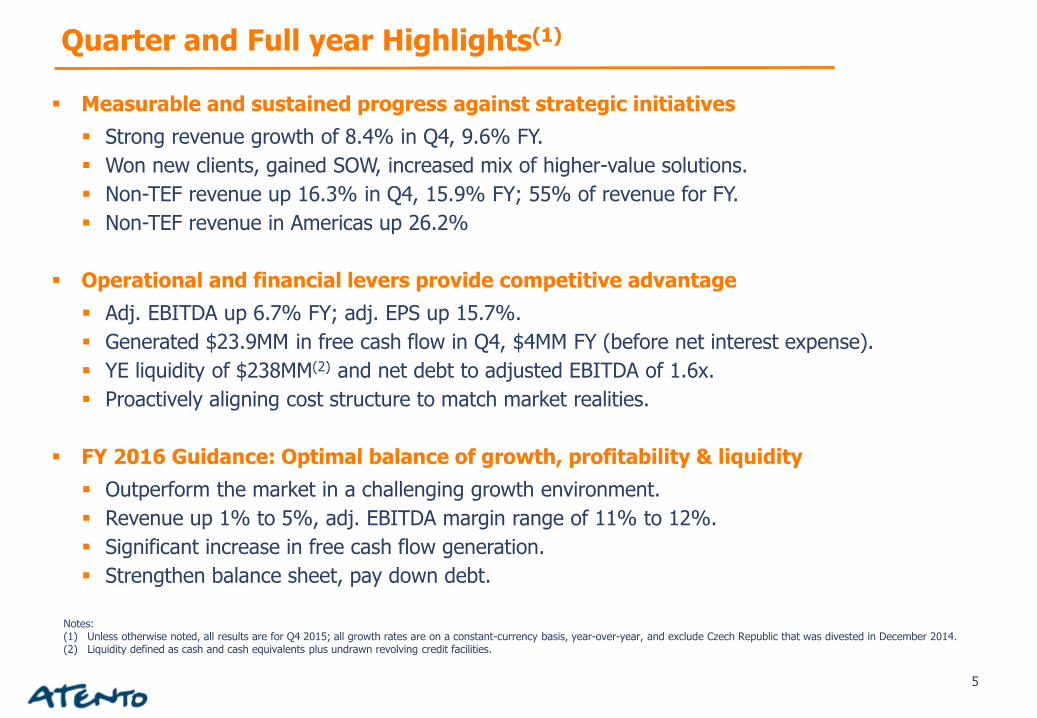
Measurable and sustained progress against strategic initiatives
Strong revenue growth of 8.4% in Q4, 9.6% FY.
Won new clients, gained SOW, increased mix of higher-value solutions.
Non-TEF revenue up 16.3% in Q4, 15.9% FY; 55% of revenue for FY.
Non-TEF revenue in Americas up 26.2%
Operational and financial levers provide competitive advantage
Adj. EBITDA up 6.7% FY; adj. EPS up 15.7%.
Generated $23.9MM in free cash flow in Q4, $4MM FY (before net interest expense).
YE liquidity of $238MM(2) and net debt to adjusted EBITDA of 1.6x.
Proactively aligning cost structure to match market realities.
FY 2016 Guidance: Optimal balance of growth, profitability & liquidity
Outperform the market in a challenging growth environment.
Revenue up 1% to 5%, adj. EBITDA margin range of 11% to 12%.
Significant increase in free cash flow generation.
Strengthen balance sheet, pay down debt.
Notes: (1) Unless otherwise noted, all results are for Q4 2015; all growth rates are on a constant-currency basis, year-over-year, and exclude Czech Republic that was divested in December 2014.(2) Liquidity defined as cash and cash equivalents plus undrawn revolving credit facilities.
Quarter and Full year Highlights(1)
6
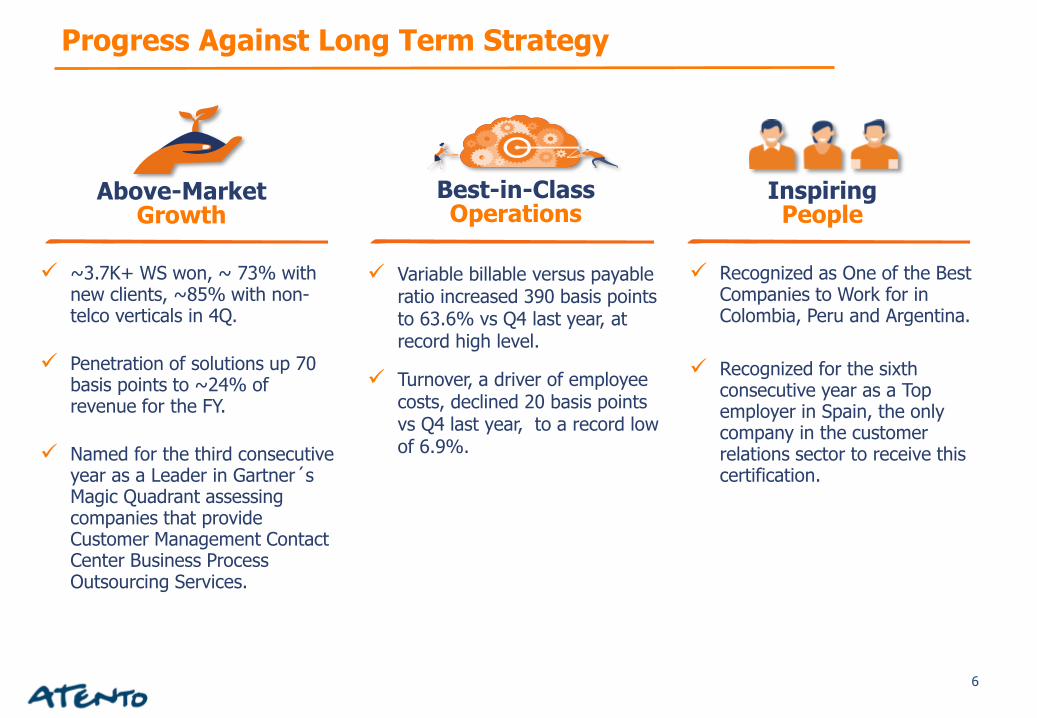
~3.7K+ WS won, ~ 73% with new clients, ~85% with non-telco verticals in 4Q.
Penetration of solutions up 70 basis points to ~24% of revenue for the FY.
Named for the third consecutive year as a Leader in Gartner´s Magic Quadrant assessing companies that provide Customer Management Contact Center Business Process Outsourcing Services.
Above-Market Growth
Best-in-Class Operations
Inspiring People
Variable billable versus payable ratio increased 390 basis points to 63.6% vs Q4 last year, at record high level.
Turnover, a driver of employee costs, declined 20 basis points vs Q4 last year, to a record low of 6.9%.
Recognized as One of the Best Companies to Work for in Colombia, Peru and Argentina.
Recognized for the sixth consecutive year as a Top employer in Spain, the only company in the customer relations sector to receive this certification.
Progress Against Long Term Strategy

7
2015 results demonstrate Atento is uniquely positioned to: Win new business Grow share of wallet with existing clients Increase penetration of higher-value added solutions
2016 Clear Priorities: Optimal balance of growth, profitability & liquidity Targeted investments to deliver higher value to clients, with best-in-class customer experience Further strengthen balance sheet by reducing debt levels
Long term sector attractive, despite near-term macro-economic pressures Largest CRM/BPO provider in $10.4Bn Latin America market Well positioned to extend leadership as market grows to $15bn by 2020 Continue to be the reference partner for the CRM/BPO needs of our clients
Long Term Strategy on Track
Fourth Quarter and Full Year Financial Performance
9
Q4 Q4 FY FY
USDm 2014 2015 2014 2015
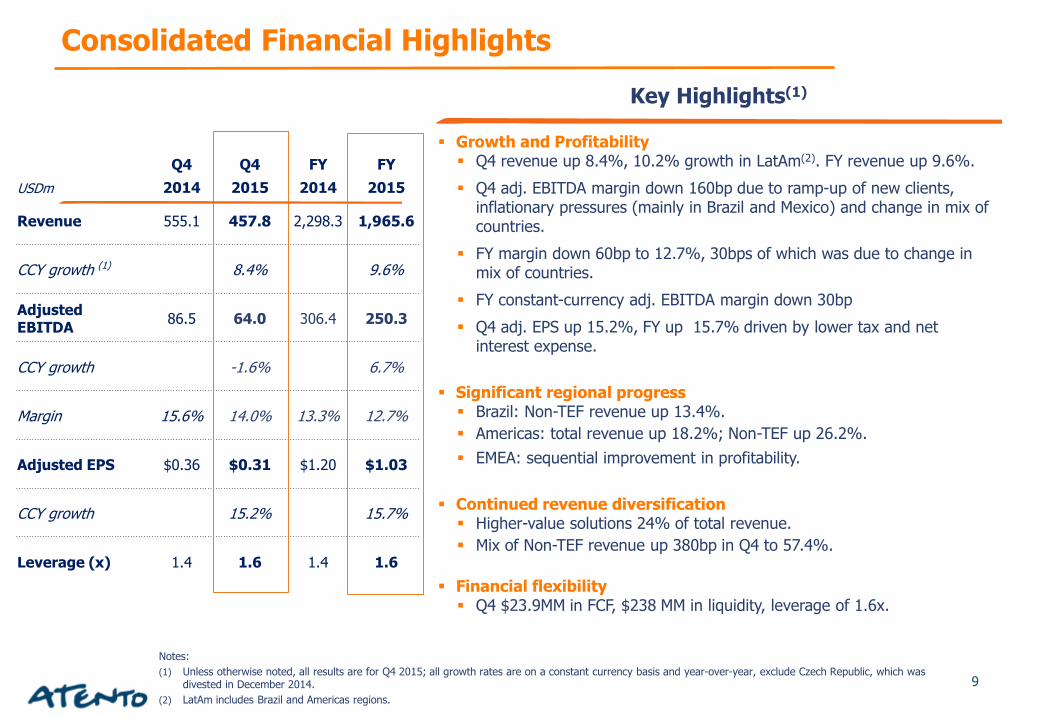
Revenue 555.1 457.8 2,298.3 1,965.6
CCY growth (1) 8.4% 9.6%
Adjusted EBITDA
86.5 64.0 306.4 250.3
CCY growth -1.6% 6.7%
Margin 15.6% 14.0% 13.3% 12.7%
Adjusted EPS $0.36 $0.31 $1.20 $1.03
CCY growth 15.2% 15.7%
Leverage (x) 1.4 1.6 1.4 1.6
Key Highlights(1)
Growth and Profitability Q4 revenue up 8.4%, 10.2% growth in LatAm(2). FY revenue up 9.6%.
Q4 adj. EBITDA margin down 160bp due to ramp-up of new clients, inflationary pressures (mainly in Brazil and Mexico) and change in mix of countries.
FY margin down 60bp to 12.7%, 30bps of which was due to change in mix of countries.
FY constant-currency adj. EBITDA margin down 30bp
Q4 adj. EPS up 15.2%, FY up 15.7% driven by lower tax and net interest expense.
Significant regional progress Brazil: Non-TEF revenue up 13.4%.
Americas: total revenue up 18.2%; Non-TEF up 26.2%.
EMEA: sequential improvement in profitability.
Continued revenue diversification Higher-value solutions 24% of total revenue.
Mix of Non-TEF revenue up 380bp in Q4 to 57.4%.
Financial flexibility Q4 $23.9MM in FCF, $238 MM in liquidity, leverage of 1.6x.
Notes:
(1) Unless otherwise noted, all results are for Q4 2015; all growth rates are on a constant currency basis and year-over-year, exclude Czech Republic, which was divested in December 2014.
(2) LatAm includes Brazil and Americas regions.
Consolidated Financial Highlights

10
Revenue
Q4 up 4.5% despite protracted challenging macros. FY up 10%.
Significant commercial wins:
Approximately 2,700 workstations won in Q4 with new and
existing clients.
Q4 Non-TEF up 13.4%, 140bp increase in mix of higher value-
added solutions.
Q4 TEF down 8.5% due to macro-driven declines in volume.
Adjusted EBITDA
Q4 adj. EBITDA down 8.9% driven by the decline in revenue.
Profitability negatively impacted by ramp of new clients and
increasing adverse macro-economic conditions.
Only partially offset by cost and efficiency initiatives.
Excluding the allocation of corporate costs, adj. EBITDA
margins declined 90bp to 16.4%.
Notes: (1) Unless otherwise noted, all results are for Q4 2015; all growth rates are on a constant currency
basis and year-over-year.
Key Highlights(1)
Q4 Q4 FY FY
USDm 2014 2015 2014 2015
Revenue 278.6 192.6 1,184.8 930.2
CCY growth 4.5% 10.0%
Q4 Q4 FY FY
USDm 2014 2015 2014 2015
Adjusted EBITDA 48.4 29.4 172.1 129.4
CCY growth -8.9% 7.2%
Margin 17.4% 15.3% 14.5% 13.9%
Margin ex-corp costs allocation
17.3% 16.4% 15.1% 14.8%
Brazil Summary
11
Q4 Q4 FY FY
USDm 2014 2015 2014 2015
Adjusted EBITDA 32.5 29.1 117.7 109.1
CCY growth 6.8% 9.1%
Margin 16.0% 14.3% 15.1% 13.8%
Margin ex-corp costs allocation
18.3% 15.6% 16.1% 15.2%
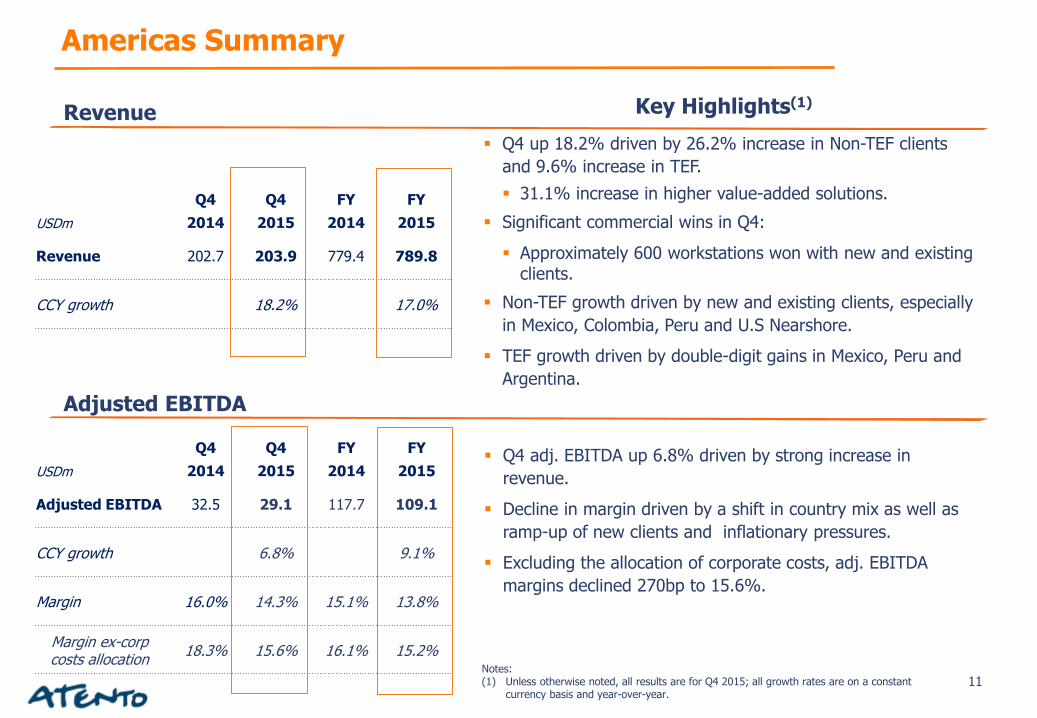
Q4 adj. EBITDA up 6.8% driven by strong increase in
revenue.
Decline in margin driven by a shift in country mix as well as
ramp-up of new clients and inflationary pressures.
Excluding the allocation of corporate costs, adj. EBITDA
margins declined 270bp to 15.6%.
Revenue
Q4 up 18.2% driven by 26.2% increase in Non-TEF clients
and 9.6% increase in TEF.
31.1% increase in higher value-added solutions.
Significant commercial wins in Q4:
Approximately 600 workstations won with new and existing clients.
Non-TEF growth driven by new and existing clients, especially
in Mexico, Colombia, Peru and U.S Nearshore.
TEF growth driven by double-digit gains in Mexico, Peru and
Argentina.
Adjusted EBITDA
Key Highlights(1)
Notes: (1) Unless otherwise noted, all results are for Q4 2015; all growth rates are on a constant
currency basis and year-over-year.
Q4 Q4 FY FY
USDm 2014 2015 2014 2015
Revenue 202.7 203.9 779.4 789.8
CCY growth 18.2% 17.0%
Americas Summary
12
Revenue
Adjusted EBITDA
Notes: (1) Unless otherwise noted, all results are for Q4 2015; all growth rates are on a constant currency
basis and year-over-year.(2) Revenue growth rates excludes the impact of Czech Republic, which was divested in December,
2014.
Key Highlights(1)
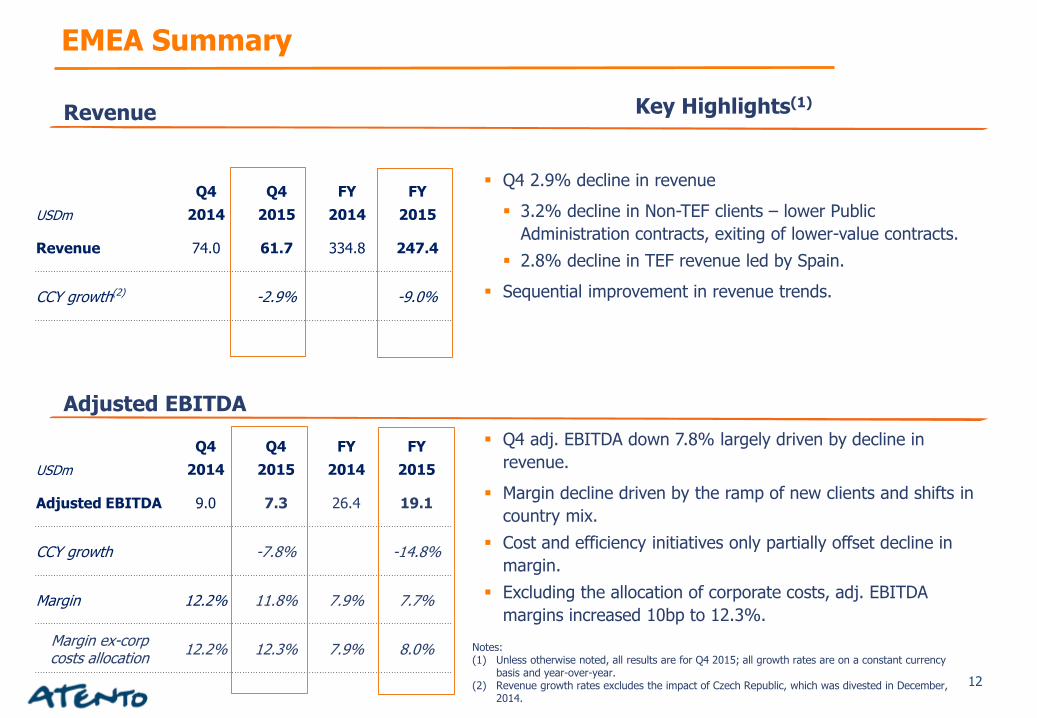
Q4 2.9% decline in revenue
3.2% decline in Non-TEF clients – lower Public
Administration contracts, exiting of lower-value contracts.
2.8% decline in TEF revenue led by Spain.
Sequential improvement in revenue trends.
Q4 adj. EBITDA down 7.8% largely driven by decline in
revenue.
Margin decline driven by the ramp of new clients and shifts in
country mix.
Cost and efficiency initiatives only partially offset decline in
margin.
Excluding the allocation of corporate costs, adj. EBITDA
margins increased 10bp to 12.3%.
Q4 Q4 FY FY
USDm 2014 2015 2014 2015
Adjusted EBITDA 9.0 7.3 26.4 19.1
CCY growth -7.8% -14.8%
Margin 12.2% 11.8% 7.9% 7.7%
Margin ex-corp costs allocation
12.2% 12.3% 7.9% 8.0%
Q4 Q4 FY FY
USDm 2014 2015 2014 2015
Revenue 74.0 61.7 334.8 247.4
CCY growth(2) -2.9% -9.0%
EMEA Summary

13
Full-year free cash flow before net interest of $4.0 million, $23.9 million in Q4
Full-year free cash flow of $27.6 million before net interest and cash impact of non-
recuring items
Debt ratings reaffirmed by rating agencies
Amidst downgrades of Latin America Corporate and Sovereign issuers
Limited transcational currency exposure
98% of costs denominated in same local currency as revenue
Most debt denominated in local currency or hedged against currency fluctuation
YE 2014 YE 2015
Cash, cash equivalents and shortterm financial Investments 238.3 184.0
Total Debt 653.3 575.6
Net Debt with third parties 415.0 391.6
Net Debt / Adj. EBITDA 1.4 x 1.6 x
Financial Strength and Flexibility
14
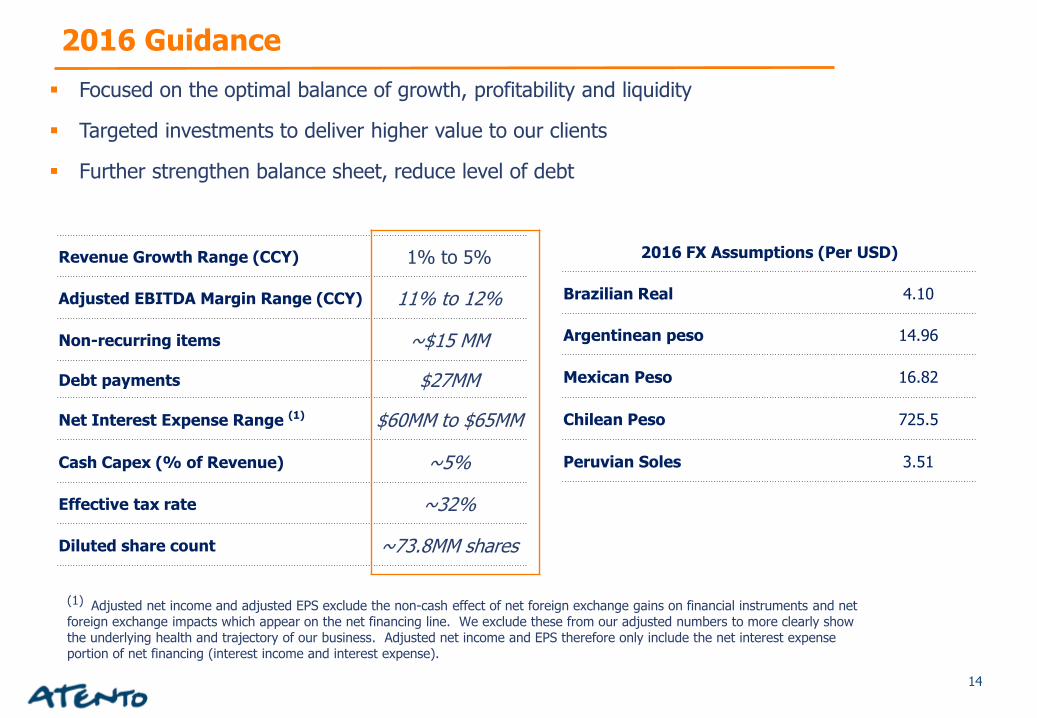
Revenue Growth Range (CCY) 1% to 5%
Adjusted EBITDA Margin Range (CCY) 11% to 12%
Non-recurring items ~$15 MM
Debt payments $27MM
Net Interest Expense Range (1) $60MM to $65MM
Cash Capex (% of Revenue) ~5%
Effective tax rate ~32%
Diluted share count ~73.8MM shares
Focused on the optimal balance of growth, profitability and liquidity
Targeted investments to deliver higher value to our clients
Further strengthen balance sheet, reduce level of debt
2016 FX Assumptions (Per USD)
Brazilian Real 4.10
Argentinean peso 14.96
Mexican Peso 16.82
Chilean Peso 725.5
Peruvian Soles 3.51
(1) Adjusted net income and adjusted EPS exclude the non-cash effect of net foreign exchange gains on financial instruments and net foreign exchange impacts which appear on the net financing line. We exclude these from our adjusted numbers to more clearly show the underlying health and trajectory of our business. Adjusted net income and EPS therefore only include the net interest expense portion of net financing (interest income and interest expense).
2016 Guidance
15
1. Measurable and sustained progress against our strategic initiatives.
2. Inherent competitive advantages and operational levers allowed us to outperform the market in 2015, despite macro-economic headwinds.
3. Priorities in 2016: optimal balance of growth, profitability and liquidity, targeted investments to improve returns, strengthen balance sheet and pay down debt.
Key Takeaways
AppendixAbout AtentoFinancial ReconciliationsDebt InformationGlossary of Terms
About Atento
18
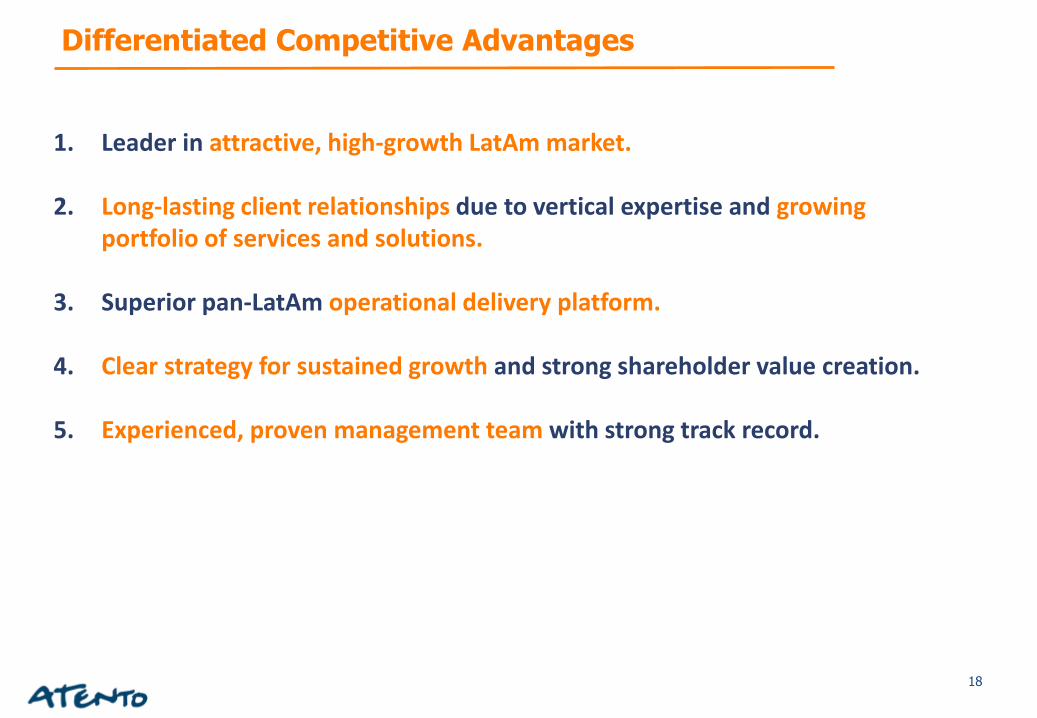
1. Leader in attractive, high-growth LatAm market.
2. Long-lasting client relationships due to vertical expertise and growing portfolio of services and solutions.
3. Superior pan-LatAm operational delivery platform.
4. Clear strategy for sustained growth and strong shareholder value creation.
5. Experienced, proven management team with strong track record.
Differentiated Competitive Advantages
19
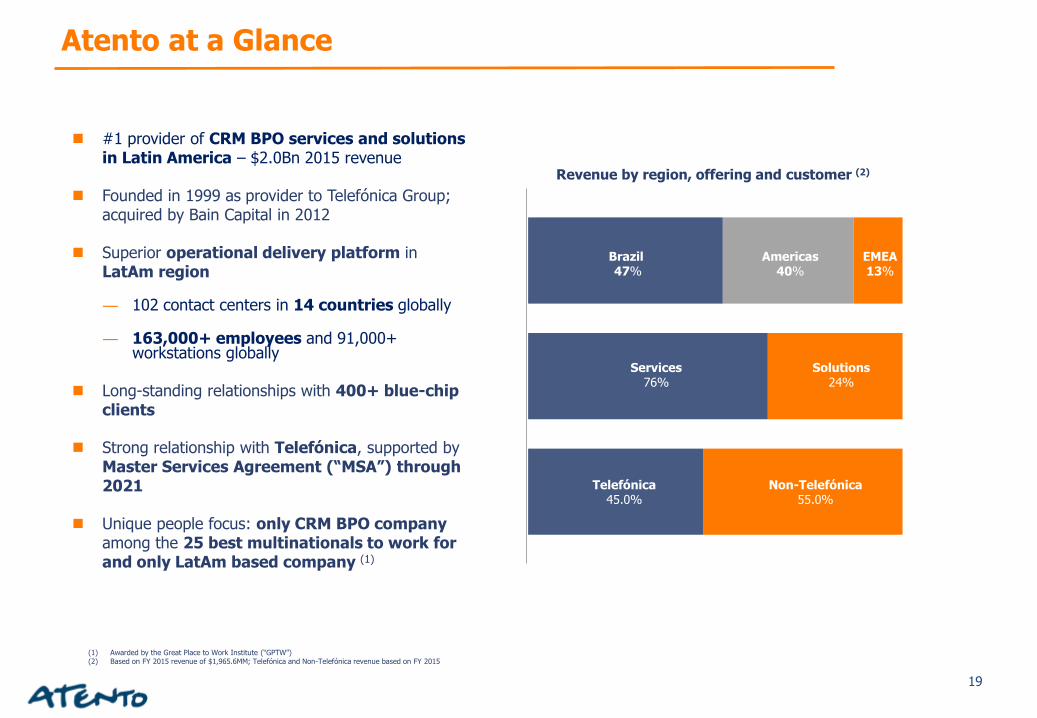
(1) Awarded by the Great Place to Work Institute (“GPTW”)(2) Based on FY 2015 revenue of $1,965.6MM; Telefónica and Non-Telefónica revenue based on FY 2015
#1 provider of CRM BPO services and solutions in Latin America – $2.0Bn 2015 revenue
Founded in 1999 as provider to Telefónica Group; acquired by Bain Capital in 2012
Superior operational delivery platform in LatAm region
― 102 contact centers in 14 countries globally
― 163,000+ employees and 91,000+ workstations globally
Long-standing relationships with 400+ blue-chip clients
Strong relationship with Telefónica, supported by Master Services Agreement (“MSA”) through 2021
Unique people focus: only CRM BPO company among the 25 best multinationals to work for and only LatAm based company (1)
Revenue by region, offering and customer (2)
Brazil 47%
Americas40%
EMEA13%
Services76%
Solutions24%
Non-Telefónica55.0%
Telefónica45.0%
Atento at a Glance
20
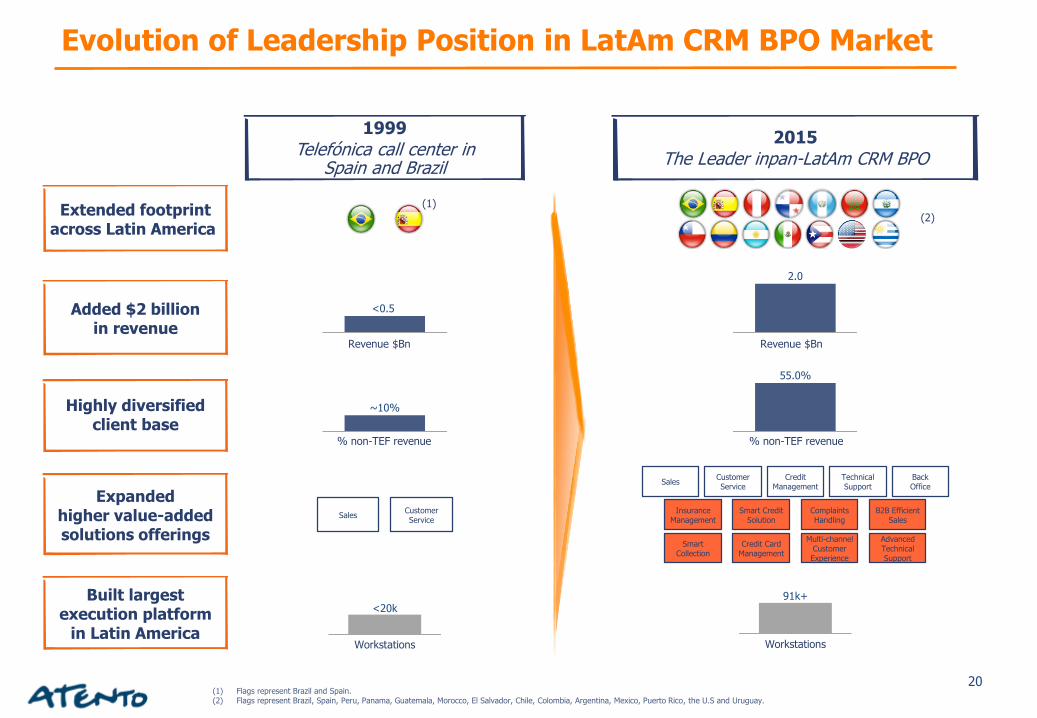
1999
Telefónica call center in Spain and Brazil
(1) Flags represent Brazil and Spain.(2) Flags represent Brazil, Spain, Peru, Panama, Guatemala, Morocco, El Salvador, Chile, Colombia, Argentina, Mexico, Puerto Rico, the U.S and Uruguay.
(1)
2015
The Leader inpan-LatAm CRM BPO
(2)
<0.5
2.0
Workstations
<20k
Workstations
91k+
~10%
55.0%
CustomerService
Sales
Extended footprintacross Latin America
Expandedhigher value-added solutions offerings
Added $2 billion in revenue
Built largest execution platform
in Latin America
Highly diversified client base
Revenue $Bn Revenue $Bn
% non-TEF revenue % non-TEF revenue
CustomerService
SalesBack Office
Technical Support
Credit Management
Smart CreditSolution
ComplaintsHandling
Multi-channel Customer Experience
Smart Collection
Credit Card Management
B2B Efficient Sales
Insurance Management
Advanced Technical Support
Evolution of Leadership Position in LatAm CRM BPO Market
21
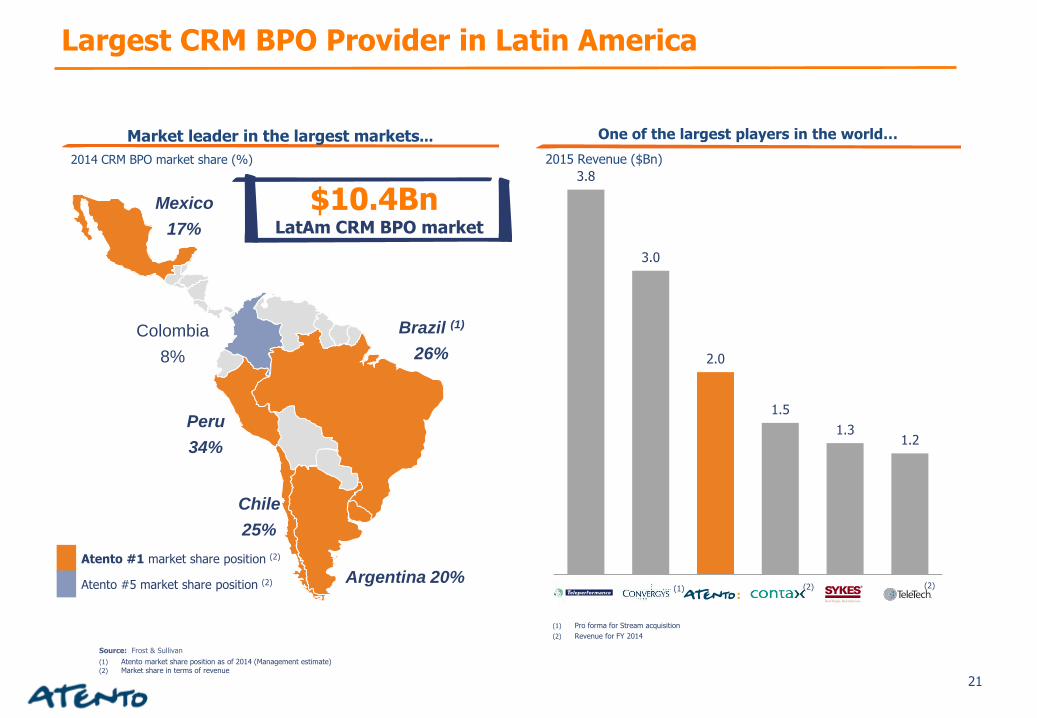
Source: Frost & Sullivan
(1) Atento market share position as of 2014 (Management estimate)(2) Market share in terms of revenue
2014 CRM BPO market share (%)
Mexico
17%
Brazil (1)
26%
Argentina 20%
Chile
25%
Peru
34%
Colombia
8%
Atento #1 market share position (2)
Atento #5 market share position (2)
Market leader in the largest markets...
$10.4Bn LatAm CRM BPO market
One of the largest players in the world…
3.8
3.0
2.0
1.5
1.31.2
2015 Revenue ($Bn)
(1) Pro forma for Stream acquisition
(2) Revenue for FY 2014
(1) (2) (2)
Largest CRM BPO Provider in Latin America
22
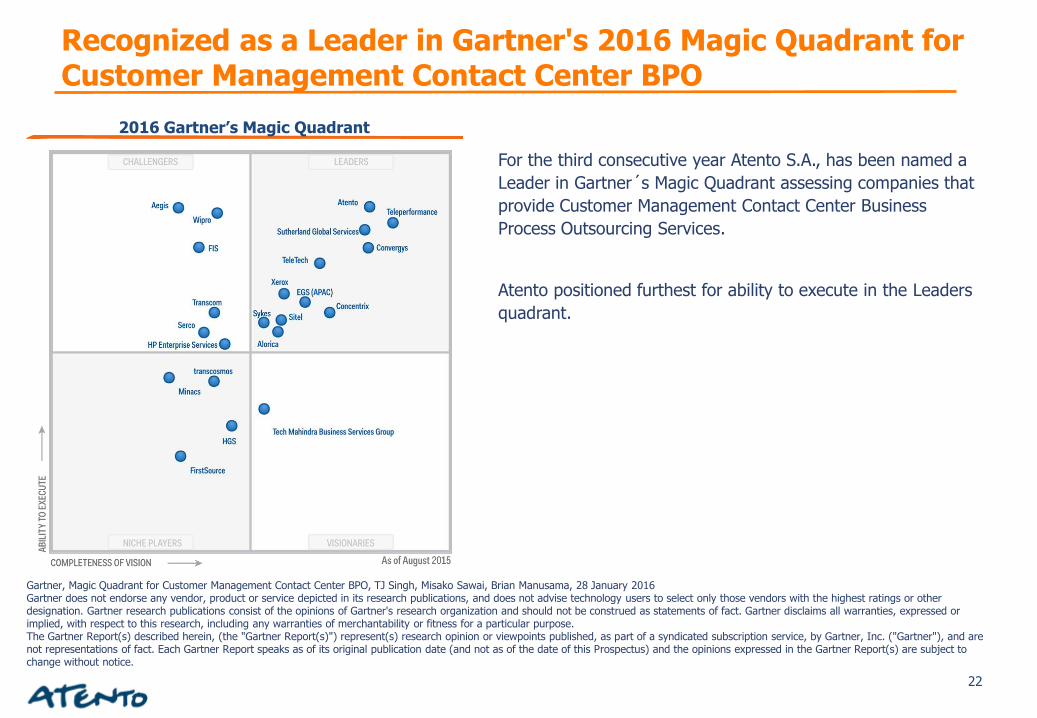
2016 Gartner’s Magic Quadrant
For the third consecutive year Atento S.A., has been named a
Leader in Gartner´s Magic Quadrant assessing companies that
provide Customer Management Contact Center Business
Process Outsourcing Services.
Atento positioned furthest for ability to execute in the Leaders
quadrant.
Recognized as a Leader in Gartner's 2016 Magic Quadrant for Customer Management Contact Center BPO
Gartner, Magic Quadrant for Customer Management Contact Center BPO, TJ Singh, Misako Sawai, Brian Manusama, 28 January 2016 Gartner does not endorse any vendor, product or service depicted in its research publications, and does not advise technology users to select only those vendors with the highest ratings or other designation. Gartner research publications consist of the opinions of Gartner's research organization and should not be construed as statements of fact. Gartner disclaims all warranties, expressed or implied, with respect to this research, including any warranties of merchantability or fitness for a particular purpose.The Gartner Report(s) described herein, (the "Gartner Report(s)") represent(s) research opinion or viewpoints published, as part of a syndicated subscription service, by Gartner, Inc. ("Gartner"), and are not representations of fact. Each Gartner Report speaks as of its original publication date (and not as of the date of this Prospectus) and the opinions expressed in the Gartner Report(s) are subject to change without notice.
23
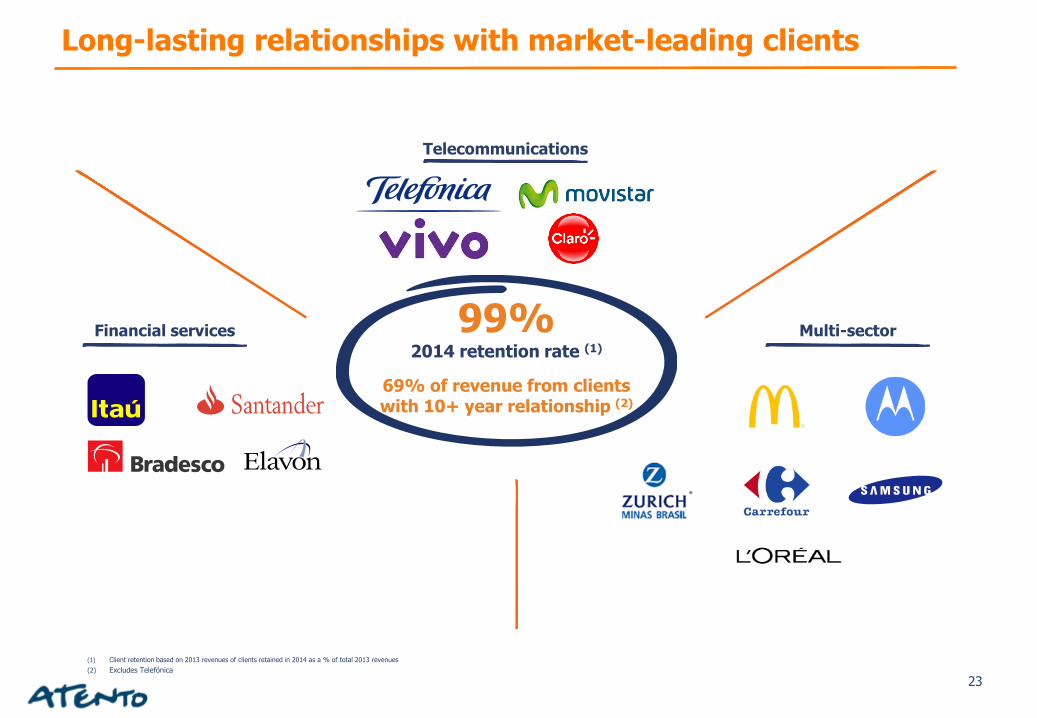
(1) Client retention based on 2013 revenues of clients retained in 2014 as a % of total 2013 revenues
(2) Excludes Telefónica
99%2014 retention rate (1)
69% of revenue from clients with 10+ year relationship (2)
Multi-sectorFinancial services
Telecommunications
Long-lasting relationships with market-leading clients
24
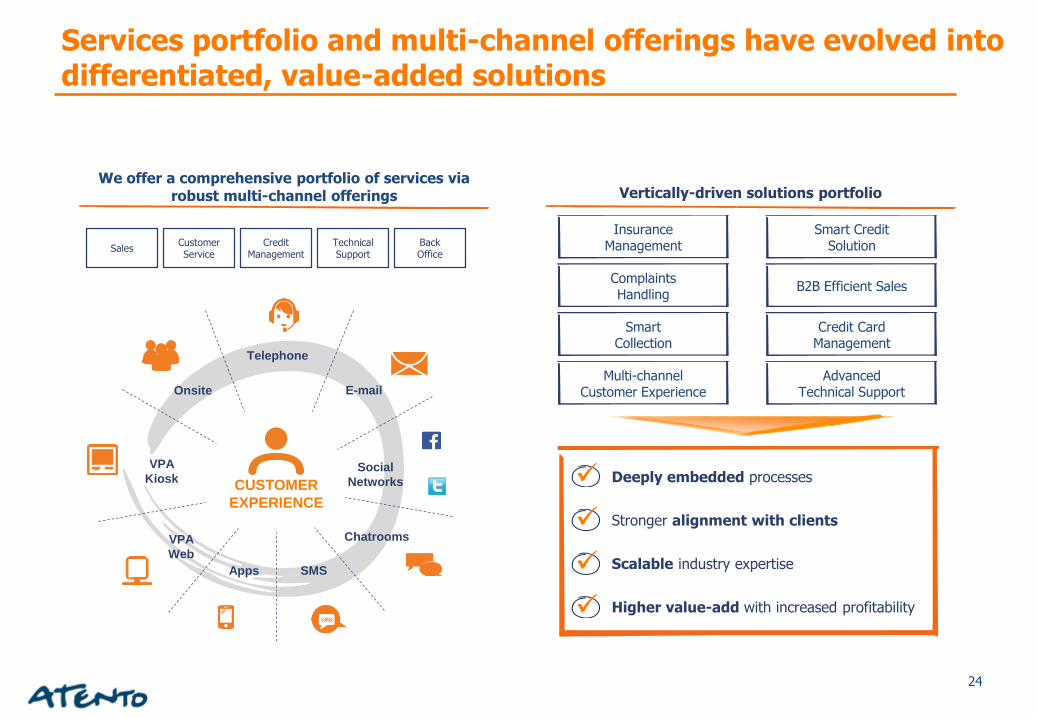
Vertically-driven solutions portfolio
Deeply embedded processes
Stronger alignment with clients
Scalable industry expertise
Higher value-add with increased profitability
We offer a comprehensive portfolio of services via robust multi-channel offerings
Telephone
Social
Networks
Chatrooms
SMSApps
VPA
Kiosk
Onsite
CUSTOMER
EXPERIENCE
VPA
Web
CustomerService
SalesBack Office
Technical Support
Credit Management
Insurance Management
Smart Credit Solution
Complaints Handling
B2B Efficient Sales
Smart Collection
Credit CardManagement
Multi-channelCustomer Experience
Advanced Technical Support
Services portfolio and multi-channel offerings have evolved into differentiated, value-added solutions
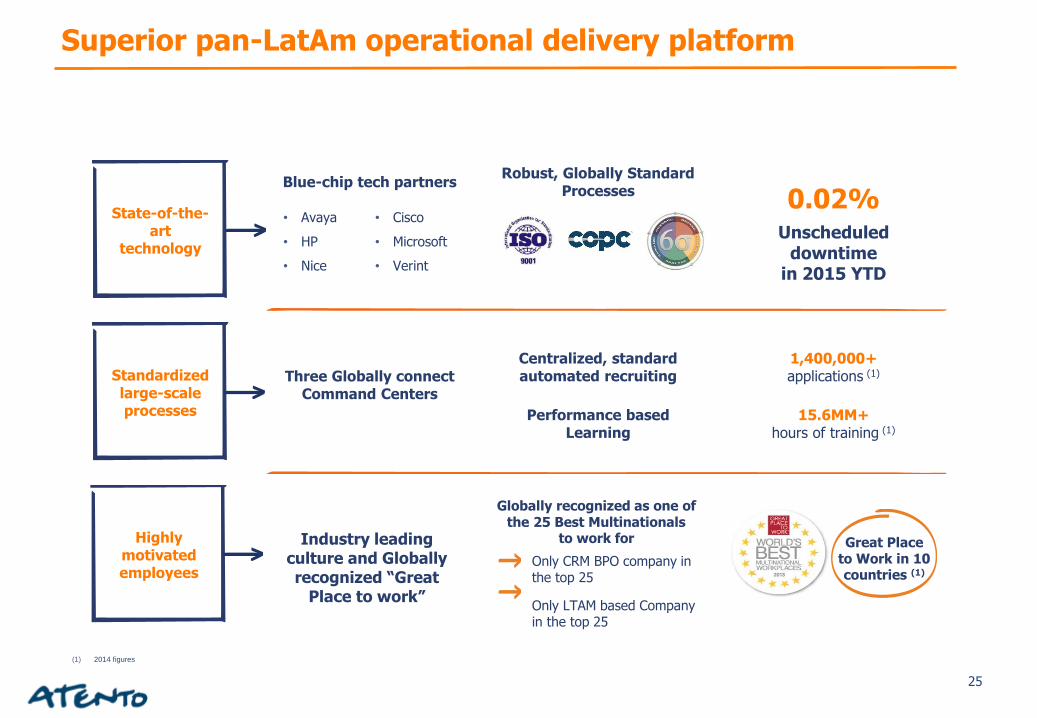
25
State-of-the-art
technology
0.02%Unscheduled
downtime in 2015 YTD
Standardized large-scale processes
Three Globally connect Command Centers
Highly motivated employees
Industry leading culture and Globally recognized “Great
Place to work”
Great Place to Work in 10 countries (1)
(1) 2014 figures
Blue-chip tech partners
• Avaya
• HP
• Nice
• Cisco
• Microsoft
• Verint
Globally recognized as one of the 25 Best Multinationals
to work for
Only CRM BPO company in the top 25
Only LTAM based Company in the top 25
Robust, Globally Standard Processes
Centralized, standard automated recruiting
Performance based Learning
1,400,000+applications (1)
15.6MM+hours of training (1)
Superior pan-LatAm operational delivery platform
26
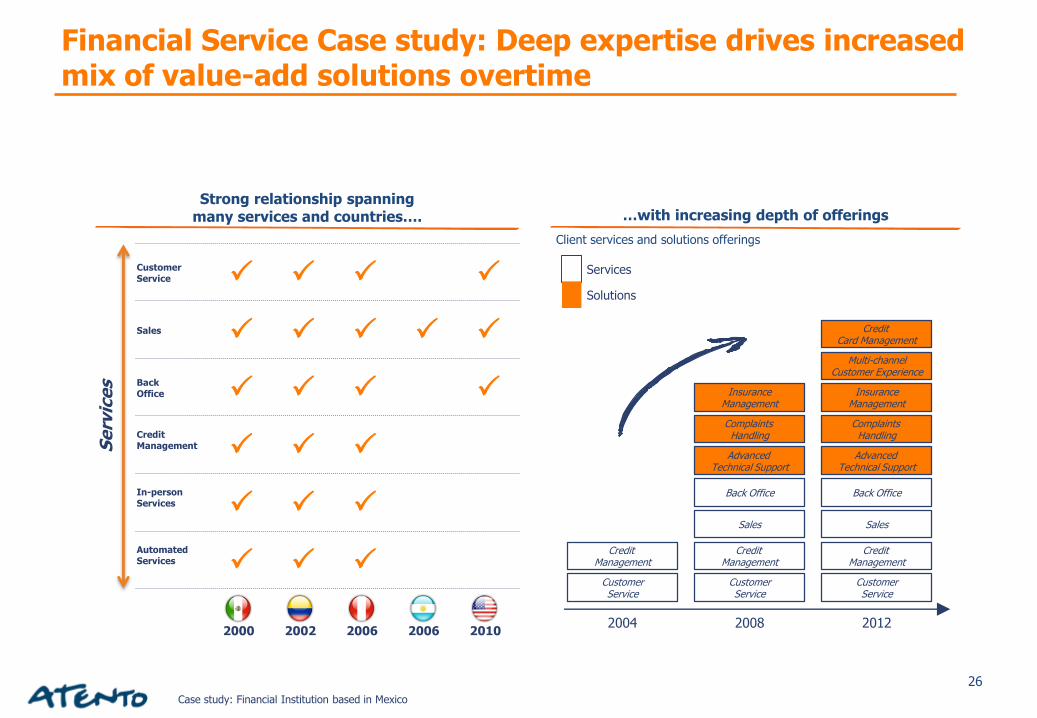
Client services and solutions offerings
Services
Solutions
2004
CustomerService
Credit Management
2008
Back Office
Sales
CustomerService
Credit Management
Complaints Handling
InsuranceManagement
Advanced Technical Support
Customer Service
Sales
Back Office
Credit Management
In-person Services
AutomatedServices
Strong relationship spanning many services and countries…. …with increasing depth of offerings
2000 2002 2006 2006 2010
Case study: Financial Institution based in Mexico
2012
Back Office
Sales
CustomerService
Credit Management
Complaints Handling
InsuranceManagement
Advanced Technical Support
Multi-channelCustomer Experience
Credit Card Management
Se
rvic
es
Financial Service Case study: Deep expertise drives increased mix of value-add solutions overtime

27
ST
RA
TE
GIC
P
ILLA
RS
GLO
BA
L
ST
RA
TE
GIC
IN
TIT
IAT
IVE
S
Deliver CRM BPO solutions
Aggressively grow client base
Penetrate U.S. Near-Shore
Above-Market Growth
Addressing untapped client growth opportunities and increasing SoW
to deliver accelerated growth
Enhance operations productivity
Increase HR effectiveness
Deploy one procurement
Drive consistent and efficient IT platform
Optimize site footprint
Best-in-Class Operations
Leveraging economies of scale and driving consistency in
operations
Distinct culture and values
Strengthen talent
High performance organization
Inspiring People
Delivering our medium-term vision through our unique
culture and people
MID
-TE
RM
V
ISIO
N Be the #1 customer experience solutions provider in the markets we serve. A truly multiclient business.
Strategy to achieve Sustained Growth and SHV Creation
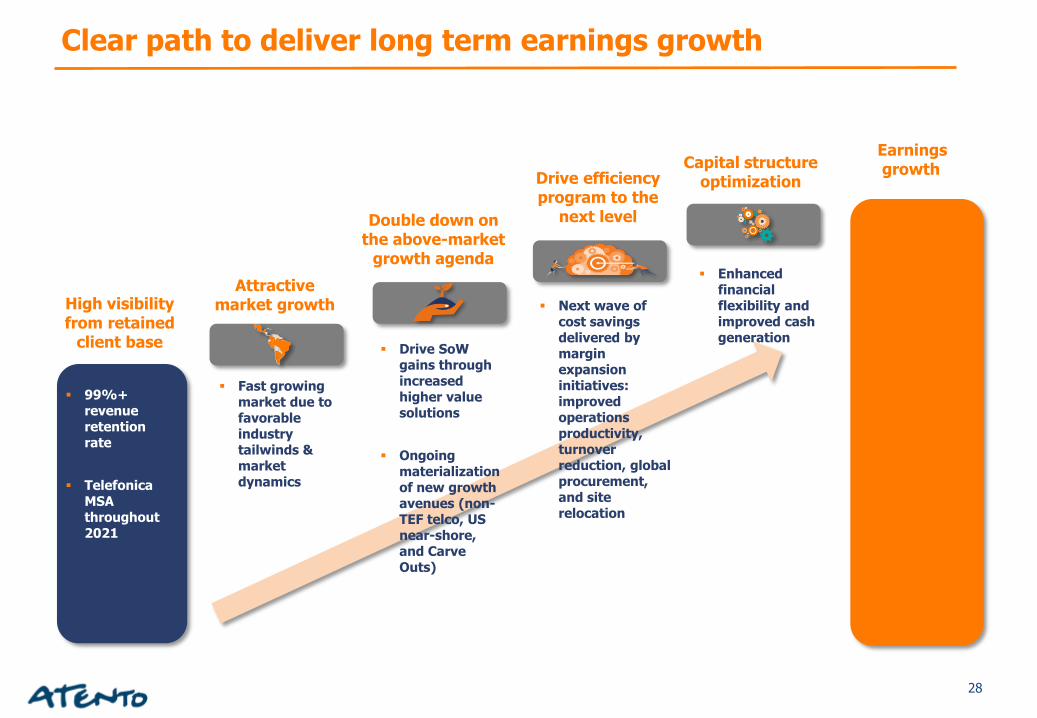
28
Earningsgrowth
High visibility from retained
client base
99%+ revenue retention rate
Telefonica MSA throughout 2021
Double down on the above-market
growth agenda
Drive SoW gains through increased higher value solutions
Ongoing materialization of new growth avenues (non-TEF telco, US near-shore, and Carve Outs)
Drive efficiency program to the
next level
Next wave of cost savings delivered by margin expansion initiatives: improved operations productivity, turnover reduction, global procurement, and site relocation
Capital structure optimization
Enhanced financial flexibility and improved cash generation
Attractive market growth
Fast growing market due to favorable industry tailwinds & market dynamics
Clear path to deliver long term earnings growth
29
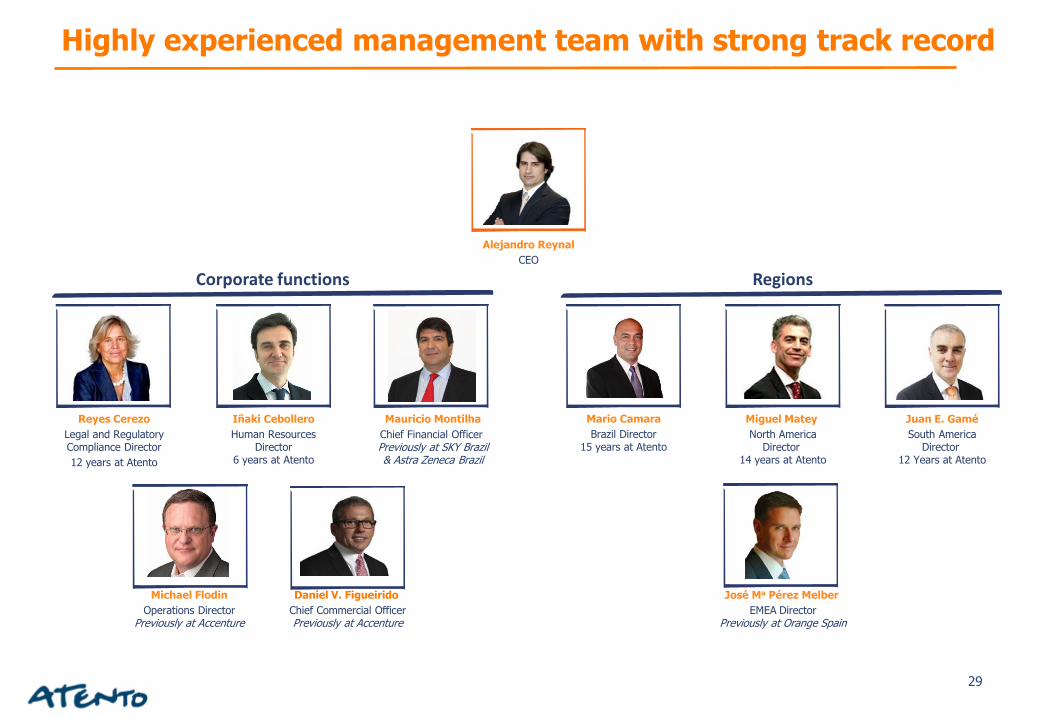
Reyes Cerezo
Legal and RegulatoryCompliance Director
12 years at Atento
Iñaki Cebollero
Human Resources Director
6 years at Atento
Mauricio Montilha
Chief Financial Officer Previously at SKY Brazil& Astra Zeneca Brazil
Michael Flodin
Operations DirectorPreviously at Accenture
Daniel V. Figueirido
Chief Commercial OfficerPreviously at Accenture
Alejandro Reynal
CEO
Mario Camara
Brazil Director15 years at Atento
Miguel Matey
North AmericaDirector
14 years at Atento
Juan E. Gamé
South AmericaDirector
12 Years at Atento
José Ma Pérez Melber
EMEA DirectorPreviously at Orange Spain
Corporate functions Regions
Highly experienced management team with strong track record
30
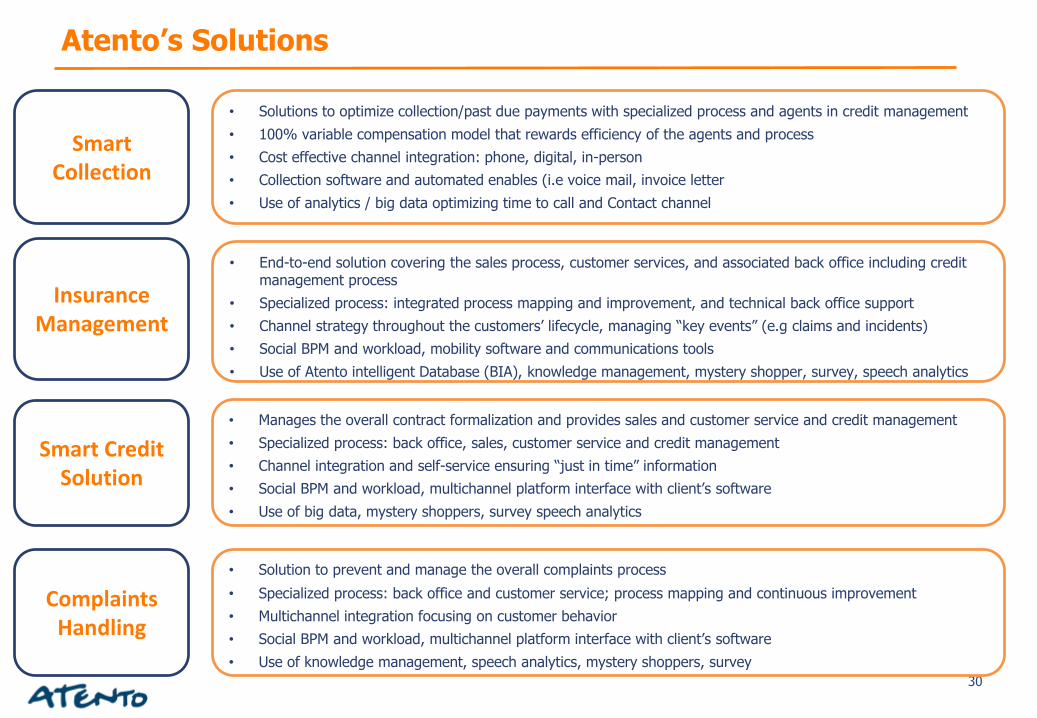
SmartCollection
• Solutions to optimize collection/past due payments with specialized process and agents in credit management
• 100% variable compensation model that rewards efficiency of the agents and process
• Cost effective channel integration: phone, digital, in-person
• Collection software and automated enables (i.e voice mail, invoice letter
• Use of analytics / big data optimizing time to call and Contact channel
InsuranceManagement
• End-to-end solution covering the sales process, customer services, and associated back office including credit management process
• Specialized process: integrated process mapping and improvement, and technical back office support
• Channel strategy throughout the customers’ lifecycle, managing “key events” (e.g claims and incidents)
• Social BPM and workload, mobility software and communications tools
• Use of Atento intelligent Database (BIA), knowledge management, mystery shopper, survey, speech analytics
Smart CreditSolution
ComplaintsHandling
• Manages the overall contract formalization and provides sales and customer service and credit management
• Specialized process: back office, sales, customer service and credit management
• Channel integration and self-service ensuring “just in time” information
• Social BPM and workload, multichannel platform interface with client’s software
• Use of big data, mystery shoppers, survey speech analytics
• Solution to prevent and manage the overall complaints process
• Specialized process: back office and customer service; process mapping and continuous improvement
• Multichannel integration focusing on customer behavior
• Social BPM and workload, multichannel platform interface with client’s software
• Use of knowledge management, speech analytics, mystery shoppers, survey
Atento’s Solutions
31
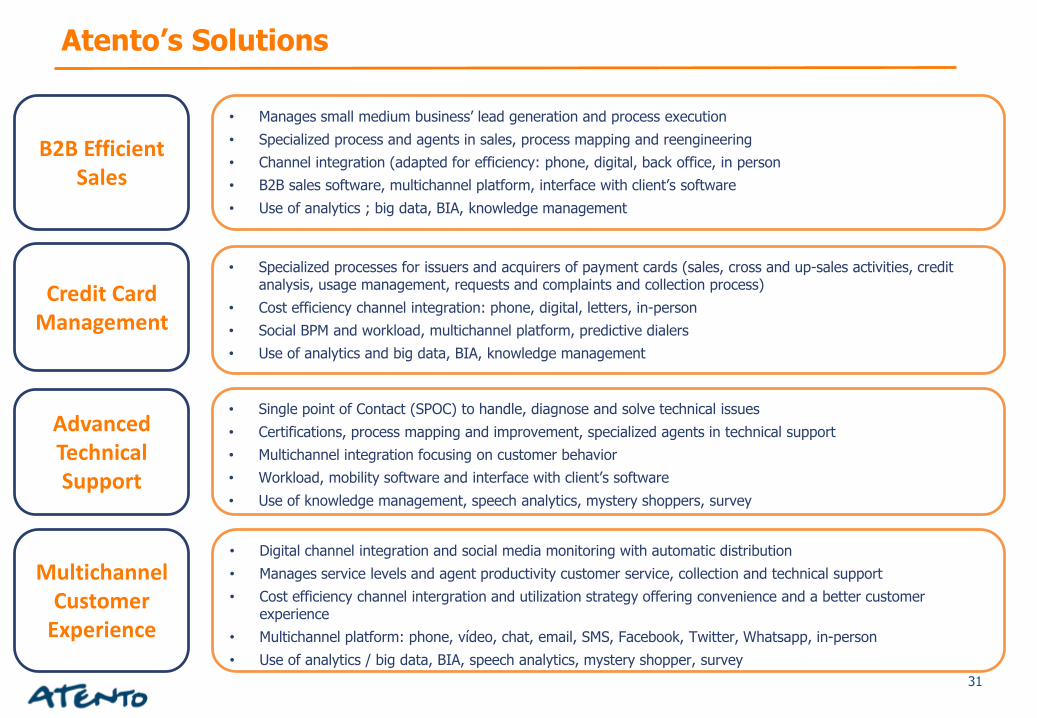
B2B EfficientSales
• Manages small medium business’ lead generation and process execution
• Specialized process and agents in sales, process mapping and reengineering
• Channel integration (adapted for efficiency: phone, digital, back office, in person
• B2B sales software, multichannel platform, interface with client’s software
• Use of analytics ; big data, BIA, knowledge management
Credit CardManagement
• Specialized processes for issuers and acquirers of payment cards (sales, cross and up-sales activities, creditanalysis, usage management, requests and complaints and collection process)
• Cost efficiency channel integration: phone, digital, letters, in-person
• Social BPM and workload, multichannel platform, predictive dialers
• Use of analytics and big data, BIA, knowledge management
AdvancedTechnicalSupport
MultichannelCustomer
Experience
• Single point of Contact (SPOC) to handle, diagnose and solve technical issues
• Certifications, process mapping and improvement, specialized agents in technical support
• Multichannel integration focusing on customer behavior
• Workload, mobility software and interface with client’s software
• Use of knowledge management, speech analytics, mystery shoppers, survey
• Digital channel integration and social media monitoring with automatic distribution
• Manages service levels and agent productivity customer service, collection and technical support
• Cost efficiency channel intergration and utilization strategy offering convenience and a better customerexperience
• Multichannel platform: phone, vídeo, chat, email, SMS, Facebook, Twitter, Whatsapp, in-person
• Use of analytics / big data, BIA, speech analytics, mystery shopper, survey
Atento’s Solutions
Financial Reconciliations
33
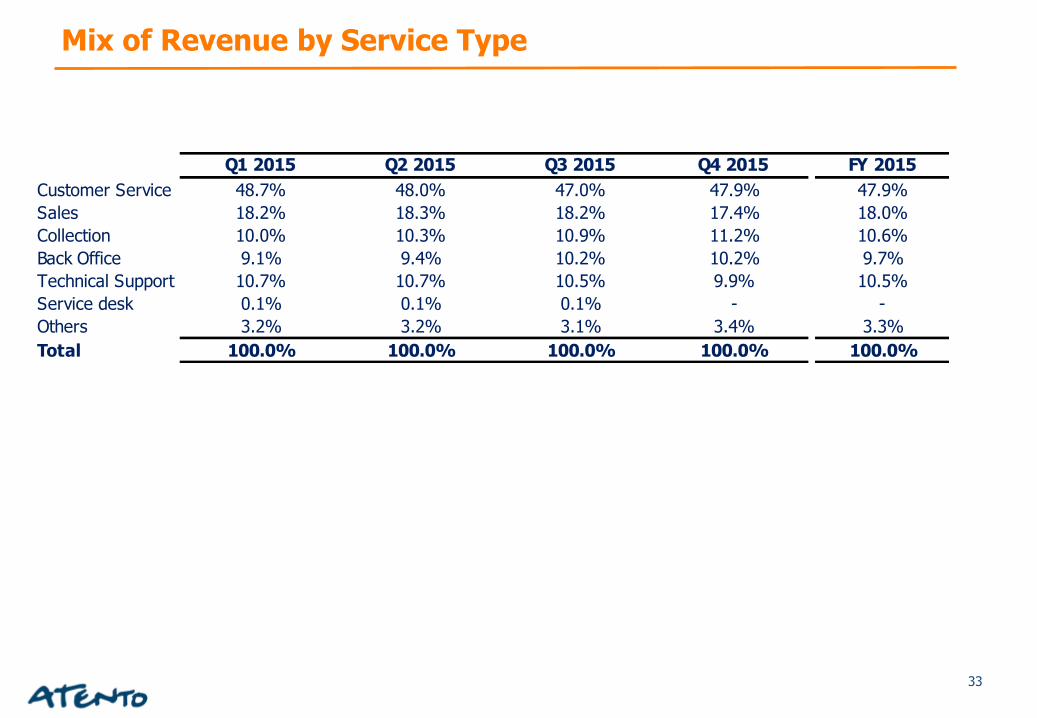
Q1 2015 Q2 2015 Q3 2015 Q4 2015 FY 2015
Customer Service 48.7% 48.0% 47.0% 47.9% 47.9%
Sales 18.2% 18.3% 18.2% 17.4% 18.0%
Collection 10.0% 10.3% 10.9% 11.2% 10.6%
Back Office 9.1% 9.4% 10.2% 10.2% 9.7%
Technical Support 10.7% 10.7% 10.5% 9.9% 10.5%
Service desk 0.1% 0.1% 0.1% - -
Others 3.2% 3.2% 3.1% 3.4% 3.3%
Total 100.0% 100.0% 100.0% 100.0% 100.0%
Mix of Revenue by Service Type
34Notes: (1) Additional detailed information can be found on the 4Q15 6K form of the Company on the topics related to Reconciliation of EBITDA and Adjusted EBITDA
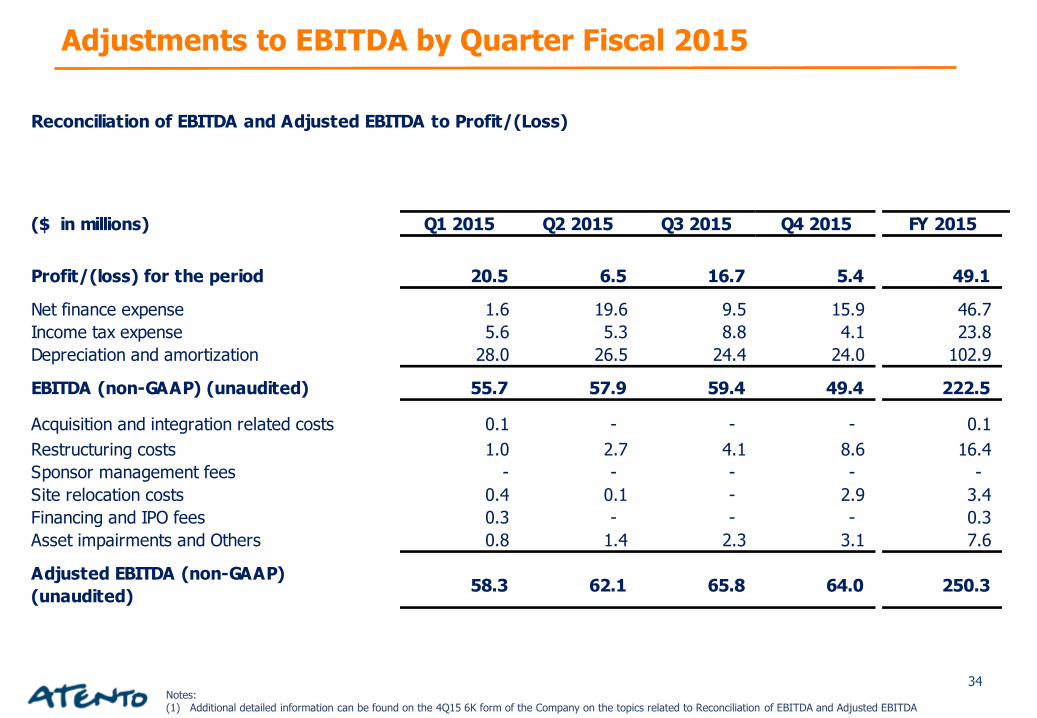
Adjustments to EBITDA by Quarter Fiscal 2015
Reconciliation of EBITDA and Adjusted EBITDA to Profit/(Loss)
($ in millions) Q1 2015 Q2 2015 Q3 2015 Q4 2015 FY 2015
Profit/(loss) for the period 20.5 6.5 16.7 5.4 49.1
Net finance expense 1.6 19.6 9.5 15.9 46.7
Income tax expense 5.6 5.3 8.8 4.1 23.8
Depreciation and amortization 28.0 26.5 24.4 24.0 102.9
EBITDA (non-GAAP) (unaudited) 55.7 57.9 59.4 49.4 222.5
Acquisition and integration related costs 0.1 - - - 0.1
Restructuring costs 1.0 2.7 4.1 8.6 16.4
Sponsor management fees - - - - -
Site relocation costs 0.4 0.1 - 2.9 3.4
Financing and IPO fees 0.3 - - - 0.3
Asset impairments and Others 0.8 1.4 2.3 3.1 7.6
Adjusted EBITDA (non-GAAP)
(unaudited)58.3 62.1 65.8 64.0 250.3
35Notes: (1) Additional detailed information can be found on the 4Q15 6K form of the Company on the topics related to Reconciliation of Adjusted EPS to Profit/(Loss)
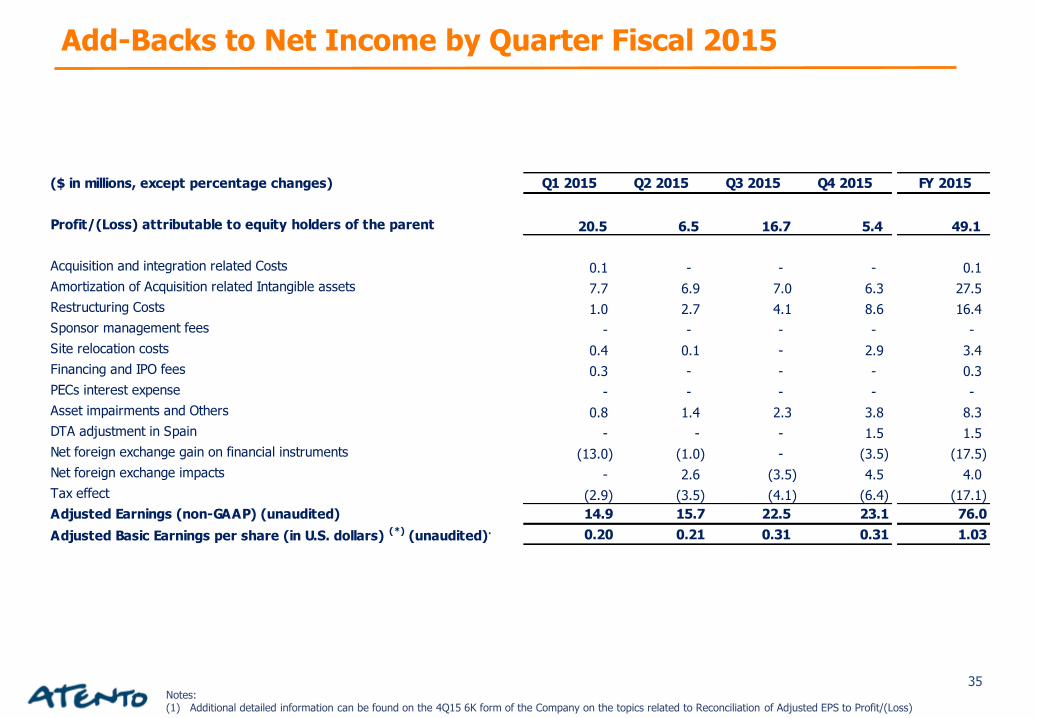
Add-Backs to Net Income by Quarter Fiscal 2015
($ in millions, except percentage changes) Q1 2015 Q2 2015 Q3 2015 Q4 2015 FY 2015
Profit/(Loss) attributable to equity holders of the parent 20.5 6.5 16.7 5.4 49.1
Acquisition and integration related Costs 0.1 - - - 0.1
Amortization of Acquisition related Intangible assets 7.7 6.9 7.0 6.3 27.5
Restructuring Costs 1.0 2.7 4.1 8.6 16.4
Sponsor management fees - - - - -
Site relocation costs 0.4 0.1 - 2.9 3.4
Financing and IPO fees 0.3 - - - 0.3
PECs interest expense - - - - -
Asset impairments and Others 0.8 1.4 2.3 3.8 8.3
DTA adjustment in Spain - - - 1.5 1.5
Net foreign exchange gain on financial instruments (13.0) (1.0) - (3.5) (17.5)
Net foreign exchange impacts - 2.6 (3.5) 4.5 4.0
Tax effect (2.9) (3.5) (4.1) (6.4) (17.1)
Adjusted Earnings (non-GAAP) (unaudited) 14.9 15.7 22.5 23.1 76.0
Adjusted Basic Earnings per share (in U.S. dollars) (*) (unaudited). 0.20 0.21 0.31 0.31 1.03
36
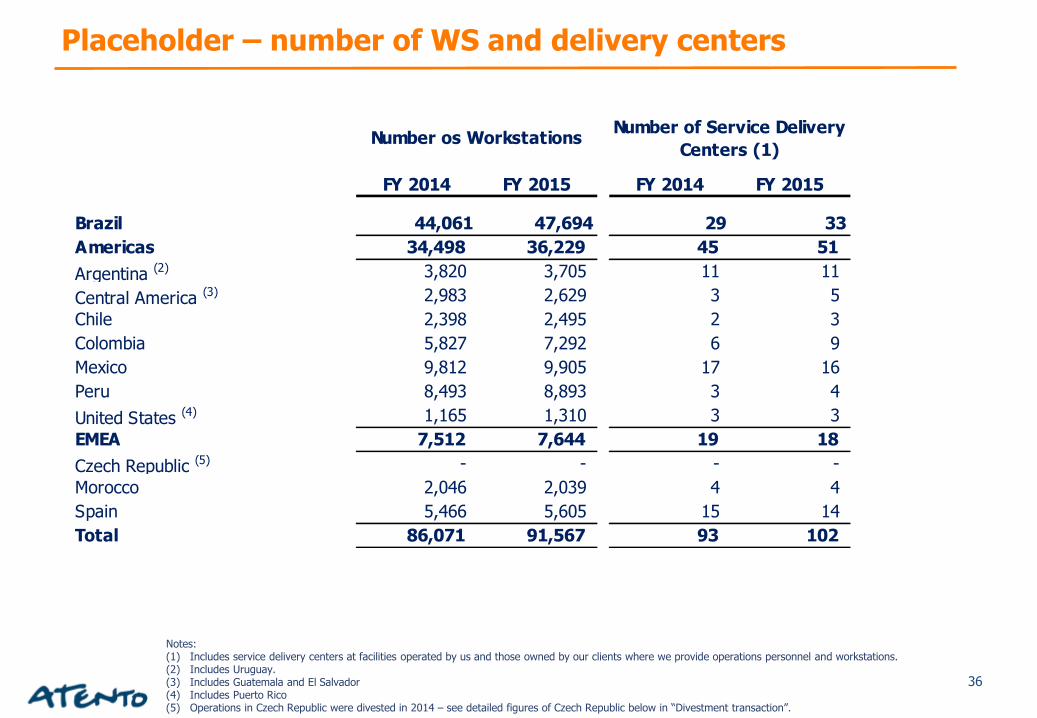
Notes: (1) Includes service delivery centers at facilities operated by us and those owned by our clients where we provide operations personnel and workstations.(2) Includes Uruguay.(3) Includes Guatemala and El Salvador(4) Includes Puerto Rico(5) Operations in Czech Republic were divested in 2014 – see detailed figures of Czech Republic below in “Divestment transaction”.
FY 2014 FY 2015 FY 2014 FY 2015
Brazil 44,061 47,694 29 33
Americas 34,498 36,229 45 51
Argentina (2) 3,820 3,705 11 11
Central America (3) 2,983 2,629 3 5
Chile 2,398 2,495 2 3
Colombia 5,827 7,292 6 9
Mexico 9,812 9,905 17 16
Peru 8,493 8,893 3 4
United States (4) 1,165 1,310 3 3
EMEA 7,512 7,644 19 18
Czech Republic (5) - - - -
Morocco 2,046 2,039 4 4
Spain 5,466 5,605 15 14
Total 86,071 91,567 93 102
Number os WorkstationsNumber of Service Delivery
Centers (1)
Placeholder – number of WS and delivery centers

37
Q4 2014 Q4 2015 FY14 FY15
Profit for the period(25.9) 5.4 (42.1) 49.1
Acquisition and integration costs 2.2 - 9.9 0.1
Amort. of Acquisition of Intangibles 8.1 6.3 36.6 27.5
Restructuring Costs 3.0 8.6 26.7 16.4
Sponsor management fees - - 7.3 -
Site relocation costs 0.3 2.9 1.7 3.4
Financing and IPO fees 40.8 - 51.9 0.3
PECs interest expense (0.4) - 25.4 -
Asset impairments and Other 4.6 3.8 1.9 8.3
DTA Adjustment in Spain 9.8 1.5 9.8 1.5
Net foreign exchange gain of financial instruments (20.0) (3.5) (27.3) (17.5)
Net foreign exchange impacts (restated) 14.9 4.5 33.3 4.0
Tax effect (11.0) (6.4) (46.4) (17.1)
Total of Add backs 52.3 17.7 130.8 26.9
Adjusted Earnings 26.4 23.1 88.7 76.0
Adjusted Basic EPS $0.36 $0.31 $1.20 1.03
Q4 2014 Q4 2015 FY14 FY15
EBITDA (non-GAAP)35.6 49.4 207.0 222.5
Acquisition and integration related costs 2.2 - 9.9 0.1
Restructuring costs3.0 8.6 26.7 16.4
Sponsor management fees- - 7.3 -
Site relocation costs0.3 2.9 1.7 3.4
Financing and IPO fees40.8 - 51.9 0.3
Asset impairments and Other 4.6 3.1 1.9 7.6
Total non-recurring items 50.9 14.6 99.4 27.8
Adjusted EBITDA (non-GAAP)86.5 64.0 306.4 250.3
Reconciliation of EBITDA and Adjusted EBITDA(1)
$MM
Reconciliation of Adjusted EPS to Profit/(Loss) (1)
$MM, except per share
Notes: (1) Additional detailed information can be found on the 4Q15 6K form of the Company on the topics related to Reconciliation of EBITDA and Adjusted EBITDA and
Reconciliation of Adjusted EPS to Profit/(Loss)
Reconciliations

Debt Information
3/8/2016 39
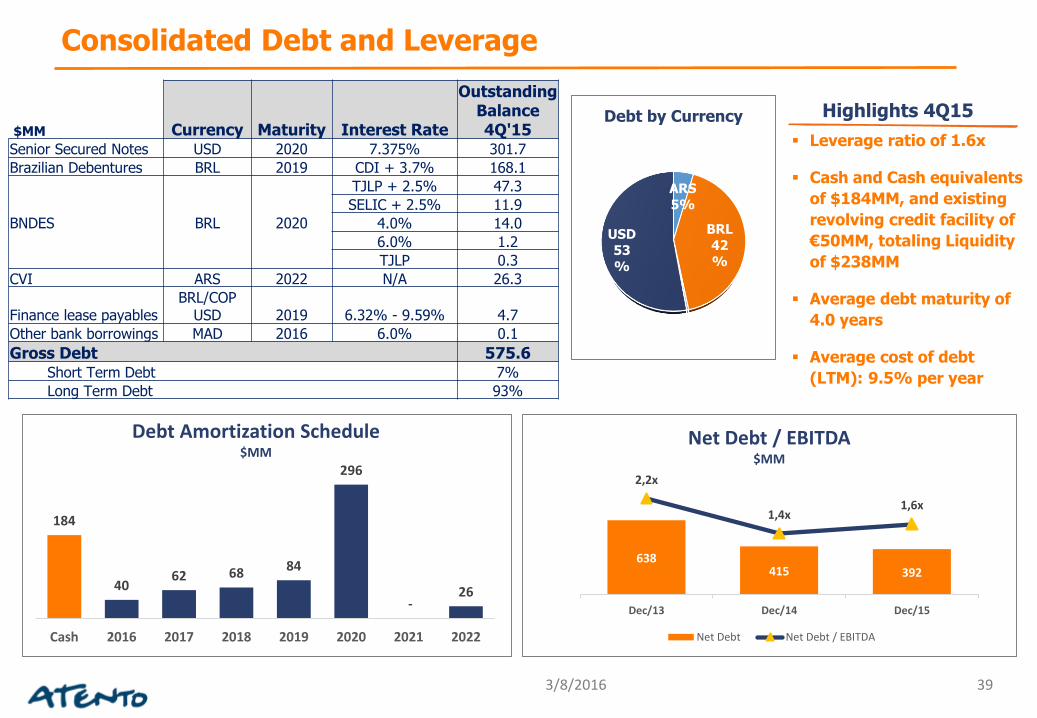
$MM Currency Maturity Interest Rate
OutstandingBalance4Q'15
Senior Secured Notes USD 2020 7.375% 301.7
Brazilian Debentures BRL 2019 CDI + 3.7% 168.1
BNDES BRL 2020
TJLP + 2.5% 47.3
SELIC + 2.5% 11.9
4.0% 14.0
6.0% 1.2
TJLP 0.3
CVI ARS 2022 N/A 26.3
Finance lease payablesBRL/COP
USD 2019 6.32% - 9.59% 4.7
Other bank borrowings MAD 2016 6.0% 0.1
Gross Debt 575.6Short Term Debt 7%
Long Term Debt 93%
Leverage ratio of 1.6x
Cash and Cash equivalents
of $184MM, and existing
revolving credit facility of
€50MM, totaling Liquidity
of $238MM
Average debt maturity of
4.0 years
Average cost of debt
(LTM): 9.5% per year
Highlights 4Q15
ARS
5%
BRL
42
%
USD
53
%
Debt by Currency
638415 392
2,2x
1,4x1,6x
,00 x
,500 x
1,00 x
1,500 x
2,00 x
2,500 x
Dec/13 Dec/14 Dec/15
0
200
400
600
800
Net Debt / EBITDA$MM
Net Debt Net Debt / EBITDA
184
4062 68 84
296
-26
Cash 2016 2017 2018 2019 2020 2021 2022
Debt Amortization Schedule$MM
Consolidated Debt and Leverage
3/8/2016 40
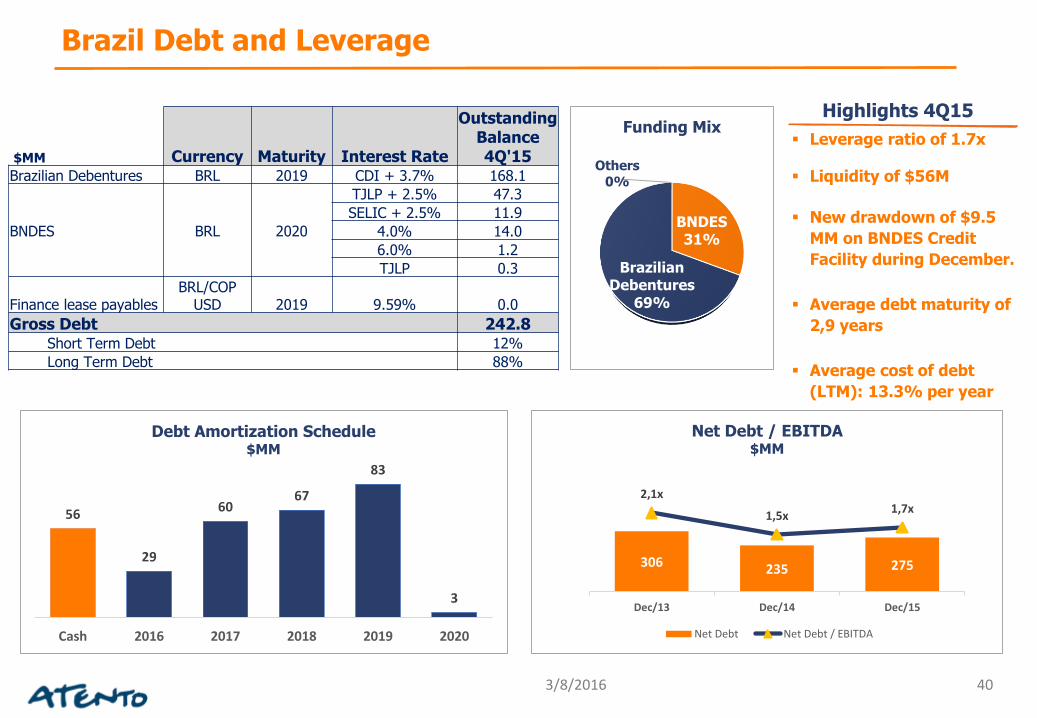
$MM Currency Maturity Interest Rate
OutstandingBalance4Q'15
Brazilian Debentures BRL 2019 CDI + 3.7% 168.1
BNDES BRL 2020
TJLP + 2.5% 47.3
SELIC + 2.5% 11.9
4.0% 14.0
6.0% 1.2
TJLP 0.3
Finance lease payablesBRL/COP
USD 2019 9.59% 0.0
Gross Debt 242.8Short Term Debt 12%
Long Term Debt 88%
Leverage ratio of 1.7x
Liquidity of $56M
New drawdown of $9.5
MM on BNDES Credit
Facility during December.
Average debt maturity of
2,9 years
Average cost of debt
(LTM): 13.3% per year
Highlights 4Q15
Others
0%
BNDES31%
Brazilian Debentures
69%
Funding Mix
56
29
6067
83
3
Cash 2016 2017 2018 2019 2020
Debt Amortization Schedule$MM
306 235 275
2,1x
1,5x1,7x
,00 x
,500 x
1,00 x
1,500 x
2,00 x
2,500 x
3,00 x
Dec/13 Dec/14 Dec/15
0
100
200
300
400
500
600
Net Debt / EBITDA$MM
Net Debt Net Debt / EBITDA
Brazil Debt and Leverage
41
Adjusted EBITDA – EBITDA adjusted to exclude the acquisition and integration related costs, restructuring costs, sponsor management fees, asset impairments, site relocation costs, financing and IPO fees and other items which are not related to our core results of operations.
Adjusted net income(loss) – net loss which excludes corporate transaction costs, asset dispositions, asset impairments, the revaluation of our derivatives and foreign exchange gain (loss), and net income or loss attributable to non-controlling interests and debt extinguishment.
Adjusted EBITDA margin – Adjusted EBITDA excluding special items/operating revenue.
Free cash flow –net cash flows from operating activities less cash payments for acquisition of property, plant and equipment, and intangible assets.
Liquidity – cash and cash equivalents and undrawn revolving credit facilities.
Glossary of Terms
Recommended