
Q4 FY’17
Industry Update &
Key Performance Highlights
23rd May, 2017

DISCLAIMERThis presentation may contain certain forward looking statements concerning JSPL’sfuture business prospects and business profitability, which are subject to a number ofrisks and uncertainties and the actual results could materially differ from those in suchforward looking statements.
The risks and uncertainties relating to these statements include, but are not limitedto, risks and uncertainties regarding fluctuations in earnings, our ability to managegrowth, competition (both domestic and international), economic growth in India andthe target countries for exports, ability to attract and retain highly skilledprofessionals, time and cost over runs on contracts, our ability to manage ourinternational operations, government policies and actions with respect toinvestments, fiscal deficits, regulations, etc., interest and other fiscal costs generallyprevailing in the economy. Past performance may not be indicative of futureperformance. We do not undertake to update our forward-looking statements.
This presentation is not intended, and does not, constitute or form part of anyoffer, invitation or the solicitation of an offer to purchase, otherwise acquire, subscribefor, sell or otherwise dispose of, any securities in JSPL or any of it’s subsidiaryundertakings or any other invitation or inducement to engage in investmentactivities, neither shall this presentation nor the fact of it’s distribution form the basisof, or be relied on in connection with, any contract or investment decision. Few numbersin this presentation are purely indicative & provisional and could change later.

OUTLOOK
Q4 FY’17
INDUSTRYDEVELOPMENTS
BRIEF BACKGROUND FINANCIAL PERFORMANCE
OPERATIONALPERFORMANCE
PRESENTATION OUTLINE
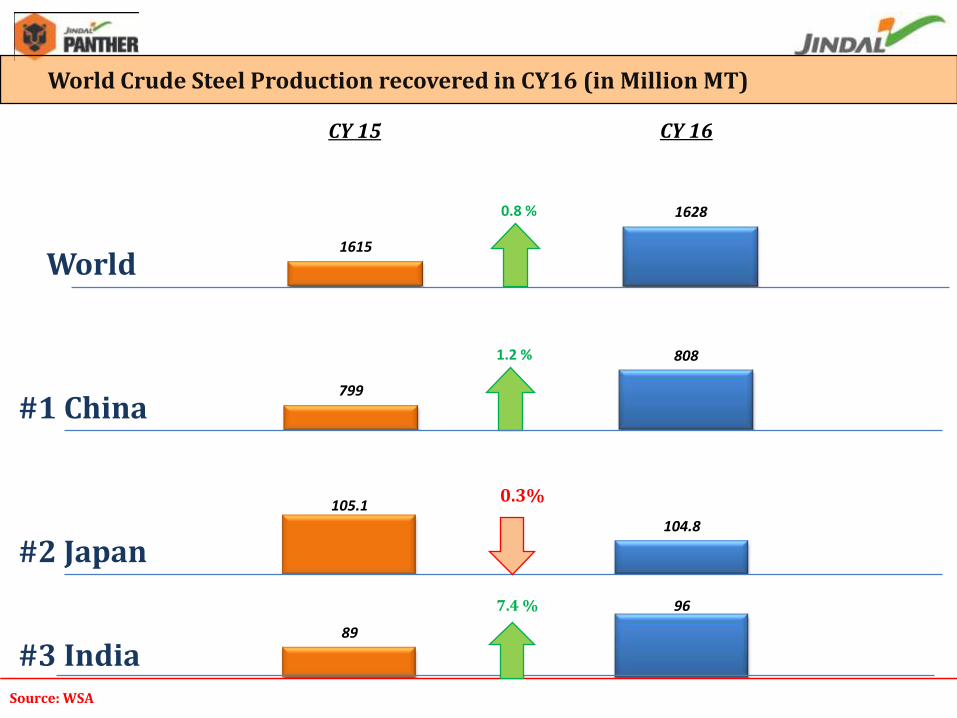
799
8081.2 %
105.1
104.8
89
96
World Crude Steel Production recovered in CY16 (in Million MT)
#1 China
#2 Japan
#3 IndiaSource: WSA
CY 15 CY 16
0.3%
7.4 %
World 1615
16280.8 %

Source: JPC
India becomes the Net Exporter of steel during FY ’17, after a long gap of 3 years
Indian Steel Scenario : (FY ‘17)
(Qty : Mt) FY ‘16 FY ‘17
Qtychange (y-o-y) Qty
change (y-o-y)
Crude Steel Production 89.8 0.9% 97.43 8.5 %
Import 11.7 25.7% 7.227 (38)%
Export 4.08 (27)% 8.245 102 %
Real Consumption (Demand) 80.5 4.6% 83.652 2.6 %

Source: WSA
World Finished Steel Demand Outlook (CY 17 & CY 18):
Country Wise
#1 China: : China Grow by 0% in 2017, -2% in 2018
#2 Japan : Grow by 1.2% in 2017, 0.6% in 2018
#3 India : Grow by 6.1% in 2017, 7.1% in 2018
#4 US : Grow by 3% in 2017, 2.9% in 2018
#5 South Korea : Grow by -2.7% in 2017, -1.8% in 2018
World• 2017: Global steel demand will increase by 1.3% to 1,535 Mt
• 2018: Global steel demand will grow by 0.9% to 1,548 Mt

OUTLOOK
Q4 FY’17
INDUSTRYDEVELOPMENTS
BRIEF BACKGROUND FINANCIAL PERFORMANCE
OPERATIONALPERFORMANCE
PRESENTATION OUTLINE

INDUSTRY UPDATESTEEL SECTOR

Source: Steel Mint
Domestic Finished steel price trend
35000
37500
45000
4150040500
41500
39500 39500
35000
37800
44000
4100040000
41250 41500 41500
April '16 Oct '16 Jan '17 Feb '17 March '17 April '17 last week latest
Flat Steel Price Trend (Delhi)
HRC
Plate
26500
24000
27900 27900
3060031500
28600 28600
29100
26900
29700 29500
31800 32000
2950028900
April '16 Oct '16 Jan '17 Feb '17 March '17 April '17 last week latest
Long Steel Price Trend (Delhi)
TMT Wire Rod

Source: Platts
International Iron Ore & Pellet Prices soften in March-April’17(CFR China - $/MT)
International Pellet Prices: After peaking in Feb, have been on a
decline
International Iron Ore Fines (Fe 62%) After peaking in Feb, have been on a
decline
636161
676669
7981
9188
93.6593
8383798181
7778
7371
595755
8784
80
8583
88
101102
114110
114117
110110
104107
111109
1009897
9188
83
19
th M
ay '1
7
15
th M
ay '1
7
5th
May
'17
28
th A
pri
l '1
7
21
th A
pri
l '1
7
13
th A
pri
l '1
7
4th
Ap
ril '
17
29
th M
ar '1
7
20
th M
ar '1
7
7th
Mar
'17
28
th F
eb
'17
14
th F
eb
'17
1 F
eb
'17
26
Jan
'17
10
Jan
'17
29
De
c '1
6
19
De
c' 1
6
02
-De
c-1
6
28
No
v'1
6
18
No
v'1
6
5 N
ov'
16
31
Oct
'16
17
Oct
'16
4 O
ct'1
6
Iron Ore CNF China
Pellets (65%) CFR China
Peak price

Source: Platts, Argus
International Coal : Price Trend
International Coal Prices trend
(From April 2016 till date:)
- Prime Hard Coking Coal: Up by $64/MT (FOB Australia)
- Semi Hard Coking Coal : Up by $64/MT (FOB Australia)
- Steam Coal RB1 Coal : Up by $20/MT (FOB S. Africa
93
232
302
262
186164 158
260
157
Apr-16 Oct-16 Nov-16 Dec-16 Jan-17 Feb-17 Mar-17 Apr-17 19th May '17
Prime Hard Coking Coal ($/MT FOB Australia)
82
210
269
234
168150 150
222
146
Apr-16 Oct-16 Nov-16 Dec-16 Jan-17 Feb-17 Mar-17 Apr-1719th May '17
Semi Hard Coking Coal ($/MT FOB Australia)
52
83
91
8386
8379
7672
Apr-16 Oct-16 Nov-16 Dec-16 Jan-17 Feb-17 Mar-17 Apr-17 19th May '17
Steam Coal RB1 ($/MT FOB S Africa)

INDUSTRY UPDATEPOWER SECTOR
Source: CEA
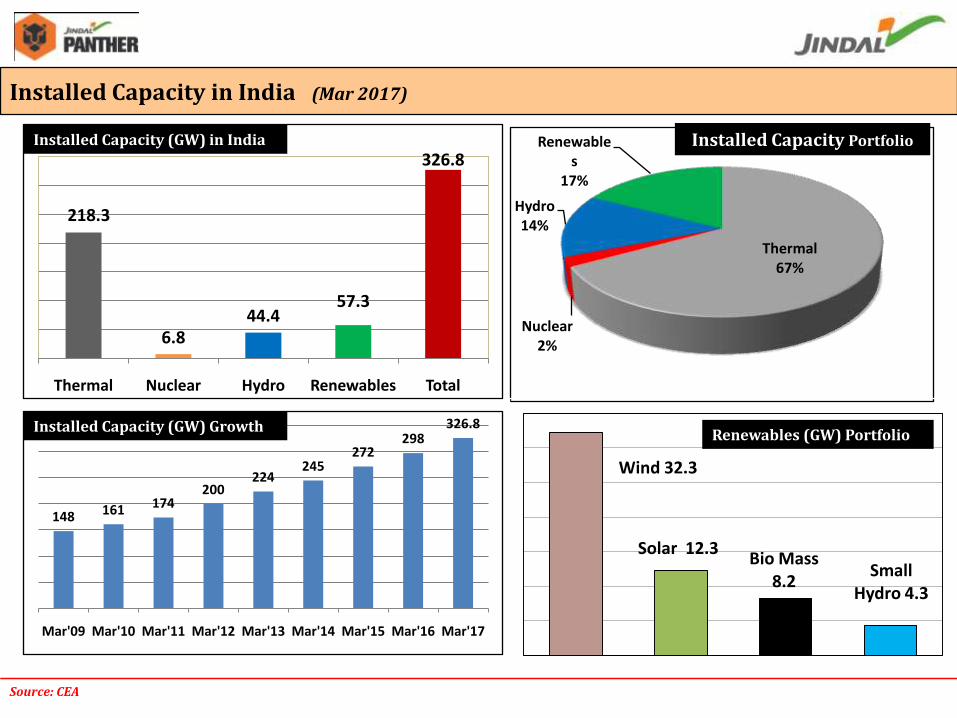
218.3
6.844.4
57.3
326.8
Thermal Nuclear Hydro Renewables Total
Installed Capacity (GW) in India
Thermal67%
Nuclear2%
Hydro14%
Renewables
17%
Wind 32.3
Solar 12.3Bio Mass
8.2Small
Hydro 4.3
Renewables (GW) Portfolio
Installed Capacity Portfolio
Installed Capacity in India (Mar 2017)
148 161 174200
224245
272298
326.8
Mar'09 Mar'10 Mar'11 Mar'12 Mar'13 Mar'14 Mar'15 Mar'16 Mar'17
Installed Capacity (GW) Growth
OUTLOOK
Q4’FY17
INDUSTRYDEVELOPMENTS
BRIEF BACKGROUND FINANCIAL PERFORMANCE
PRESENTATION OUTLINE
OPERATIONALPERFORMANCE

Steel Power Mines & Minerals
Global Ventures
Current Capacities – Domestic & Global
Business Segments
*Domestic**1000 MW Divestment announced
Construction Material &
Solution
5.1 MTPA Steel* 3.11 MTPA*IPP – 3400MW**CPP – 1634 MW
2 MTPA Steel& Mines
CementRoad solutions
LGS
Capacity in deail
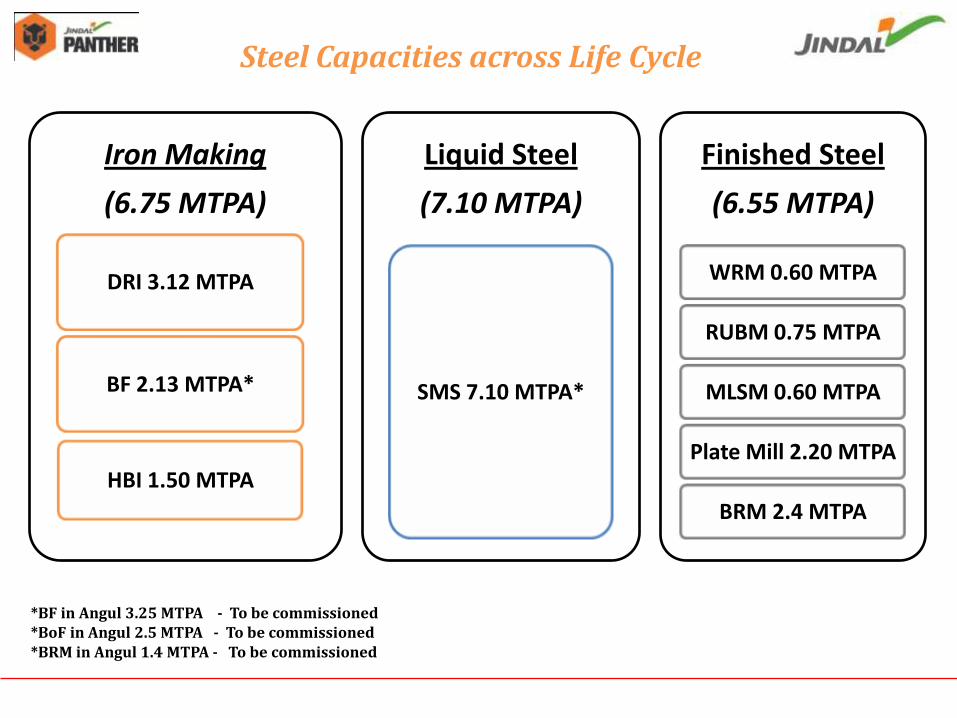
Iron Making
(6.75 MTPA)
BF 2.13 MTPA*
DRI 3.12 MTPA
HBI 1.50 MTPA
Liquid Steel
(7.10 MTPA)
SMS 7.10 MTPA*
Finished Steel
(6.55 MTPA)
WRM 0.60 MTPA
RUBM 0.75 MTPA
MLSM 0.60 MTPA
Plate Mill 2.20 MTPA
BRM 2.4 MTPA
Steel Capacities across Life Cycle
*BF in Angul 3.25 MTPA - To be commissioned *BoF in Angul 2.5 MTPA - To be commissioned*BRM in Angul 1.4 MTPA - To be commissioned

Capacity in deail
Raigarh
(Chhattisgarh)
SMS 3.6MTPA
BF 2.125 MTPA
DRI 1.32 MTPA
Plate Mill 1.00 MTPA
RUBM 0.75 MTPA
MLSM 0.60 MTPA
CPP 839 MW
Angul
(Odisha)
SMS 1.5 MTPA
*SMS 2.5 MTPA
DRI 1.8 MTPA
*BF 3.2 MTPA
CGP 225,000 Nm3/Hr
Plate Mill 1.2 MTPA
*BRM 1.4 MTPA
CPP 810 MW
Barbil
(Odisha)
Pellet Plant
9 MTPA
Patratu
(Jharkhand)
WRM 0.60
MTPA
BRM 1.0 MTPA
Oman
SMS 2.0 MTPA
HBI 1.5 MTPA
BRM 1.4 MTPA
JPL
Tamnar 3400 MW
Mining
Iron Ore 3.11
MTPA
Coal Overseas
6.20 MTPA
Detailed plant wise capacities
Power Hot Metal Liquid Steel Finished Steel
*To be commissioned

SteelInsights into few products…

• 0.75 MTPA Rail & Universal Beam mill
• Dual Hot Saws • Variable pitch for controlled
residual stress removal
India’s first manufacturer of Parallel Flange Beams

• 1.2 MTPA 5m wide Plate Mill in Angul
• India’s widest Plate Mill• Can roll up to 5m wide Plates• 1.4 KM long shop
Plates – Making Steel Stronger

Prefabricated Steel – India’s biggest & most versatile prefab facility
• 2 lakh MT per annum capacity
Power plant
High rise Buildings
Bridges
Stadiums / Airports
Industrial Buildings
Segments Served

PLATES(PLATE MILL)
ROLLED SECTIONS(RUBM/MLSM)
TMT(BAR MILL)
LGS/ MGO(All Tech )
CEMENT PLANT
STRUCTURAL STEEL
WELDMESH/ CUT BEND
DRY WALLS JGRS
CONSTRUCTION SOLUTIONS BUSINESS
HIGH RISE STEEL BUILDINGS
MULTI LEVEL CAR PARKS
ROADBRIDGES
STADIUMS AIRPORTSROADS &
PAVEMENTS
RAW MATERIALS
FINISHED PRODUCTS
APPLICATIONS
COIL
SPEEDFLOOR
Construction Solutions Business Offerings
EPS PLANT
EPS
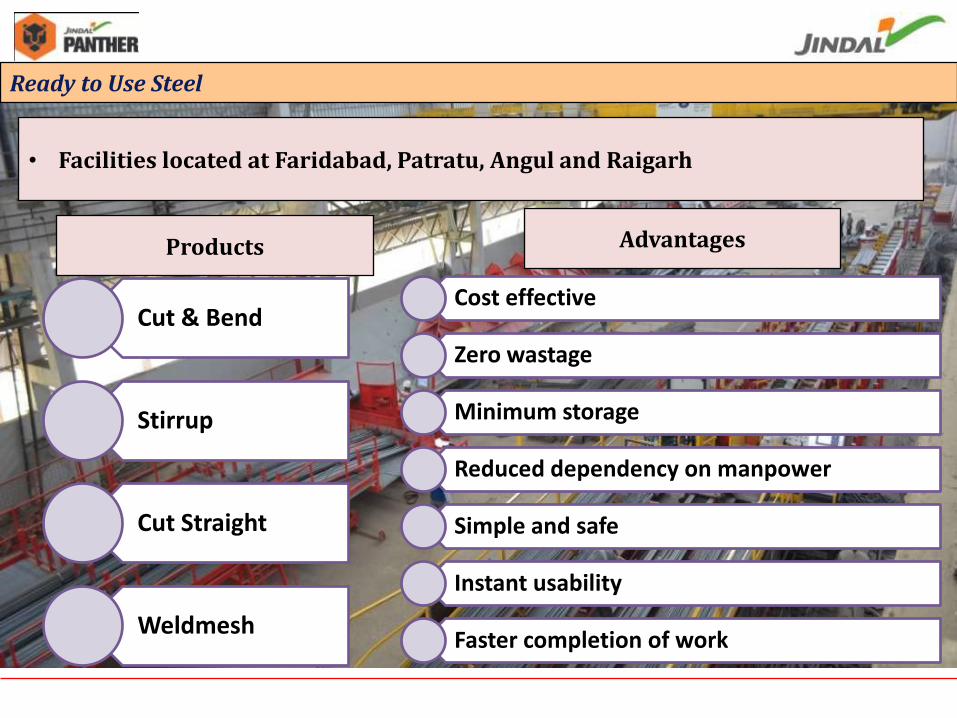
Ready to Use Steel
• Facilities located at Faridabad, Patratu, Angul and Raigarh
Cost effective
Zero wastage
Minimum storage
Reduced dependency on manpower
Simple and safe
Instant usability
Faster completion of work
Advantages
Cut & Bend
Stirrup
Cut Straight
Weldmesh
Products

Angul
Tamnar
RaigarhCaptive power projects (within JSPL)
ProjectCapacity
(MW)Fuel Configuration Status
DCPP, Raigarh 540 Coal 4x135 MW Operational
JSPL, Raigarh 284Coal & waste heat
2x25 MW & 40 MW(Waste heat)
2x55 MW 3x25 MW
24 MW
Operational
Angul, Odisha 810 Coal 6 x135 MW Operational
Independent Power Projects (IPP)
ProjectCapacity
(MW)Fuel
Configuration
Status
Tamnar 1* 1,000 Coal 4x250 MW Operational
Tamnar 2 2,400 Coal 4x600 MW Operational
IPP CPP
One of the largest thermal portfolios in India
JSPL - Power Capacities
*Divestment announced

96.43% subsidiary of JSPL
JINDAL POWER LIMITED
EUP -I1000MW (4 X 250)
EUP -II1200MW (2 X 600)
EUP -III1200MW (2 X 600)

Project Buyer Type
Period Quantum (MW)From To
Tamnar II
(Phase 1)Tamil Nadu
Long Term Feb-14 Sep-28 400
Tamnar I Medium Term Sep-12 Aug-17 200
Tamnar II
(Phase 1)KSEB
Long Term Jun-16 May-41 200
Tamnar II
(Phase 1)Long Term Oct-17 Sep-42 150
Tamnar II
(Phase 1)Chhattisgarh
Long Term After commercial operation of Unit and for
complete life of plant
60
Tamnar II
(Phase 2)Long Term 60
PPA Arrangements
Over 30% of total capacity tied up *
* Out of 3400 MW (IPP)

Tamnar-I, 1,000 MW (EUP I)
In the interim, coal sourced through – market purchase and e-auction
Bilateral/short term/merchant
258km transmission line from plant to national grid
Tamnar-II - 1,200 MW (EUP II)
Long term linkage from Mahanadi Coal Limited (MCL) and South Eastern Coalfields Limited (SECL)
TNEB – 400MW
CSEB – 60MW
KSEB – 200MW
KSEB – 150MW
Full Open access for 400MW TNEB PPA commenced from Oct 2015
Tamnar-II - 1,200 MW (EUP III)
Market purchase and e-auction
CSEB – 60MW
Open access to be finalised against PPAs
FSA
PPA
Evacuation
Raw materials, transmission & PPAs in place for achieving higher PLF
Key Contractual Arrangements for JPL

Developing a 3 MTPA coal
mine in Mozambique’s coal-
rich Moatize region
Coal resources estimated at
1.3 bn tonnes including
coking coal
Mozambique, Africa
JSPL’s Kiepersol Colliery produces Anthracite
coal, sold domestically and internationally Plans
to ramp up capacity
South Africa, Africa Acquired 82.04% controlling
stake in Wollongong Coal
Australia
1.5 MT HBI , 2 MT SMS Plant &
1.4MTPA Rebar Mill – an
Integrated Steel Plant
Shadeed, Oman
Summary of International Operations

Oman
Holding structure for global operations
Jindal Steel & Power Ltd
Listed Operating Entity in India
Australia
Coking Coal
South Africa
Anthracite Coal
Mozambique
Thermal/ Coking Coal
Jindal Steel & Power (Mauritius) Ltd
Holding company for overseas business
2 MTPA Steel plant

OUTLOOK
Q4 FY’17
INDUSTRYDEVELOPMENTS
BRIEF BACKGROUND FINANCIAL PERFORMANCE
PRESENTATION OUTLINE
OPERATIONALPERFORMANCE

Performance highlights
Sinter plant and two batteries of coke oven commissioned at Angul.
JSPL’s Consolidated Steel Production for Q4FY17 was 1.30 Million Tonne down 1% YoY (1.32 Million Tonne in Q4FY16)
India’s largest Blast Furnace, all set to commission at JSPL Angul
JSPL’s Consolidated EBITDA increased by 73% Y-o-Y and 22% Q-o-Q for Q4FY17
Barbil records over 3.4 times growth in Market sale of pellets.
JPL increased its EBITDA by 27% Q-o-Q and 263% Y-o-Y in Q4FY17
Australia and Mozambique mines ramping up steadily

0
0.2
0.4
0.6
0.8
1
1.2
1.4
1.6
Q4FY16 Q1FY17 Q2FY17 Q3FY17 Q4FY17
0.970.84 0.88 0.84 0.91
0.350.35 0.28 0.31
0.39
Jindal Shadeed JSPL
1.301.321.19 1.16 1.15
Consolidated Steel Production
(Figures in Million Tonnes)

0
0.2
0.4
0.6
0.8
1
1.2
1.4
1.6
Q4FY16 Q1FY17 Q2FY17 Q3FY17 Q4FY17
10.78 0.81 0.84 0.92
0.4
0.33 0.27 0.320.39
Jindal Shadeed JSPL
Consolidated Steel Sales Volumes
1.311.4
1.11 1.08 1.16
(Figures in Million Tonnes)

Key Customers & Adding…

OUTLOOK
Q4 FY’17
INDUSTRYDEVELOPMENTS
BRIEF BACKGROUND FINANCIAL PERFORMANCE
PRESENTATION OUTLINE
OPERATIONALPERFORMANCE
Analyst Presentation

36- -
Standalone Q4 FY 17 –Snapshot of Key Financials (Figures in Rs. Crores)
Particulars Q4FY17 Q4FY16 Q3FY17 %YoY %QoQ
Total Revenue 4,545 4,033 3,898 +13% +17%
EBITDA 914 681 779 +34% +17%
EBITDA % 20% 17% 20%
Depreciation 489 531 542 -8% -10%
Finance Cost 515 641 535 -20% -4%
Profit/(Loss) Before Tax (81) (491) (298) +83% +73%
Profit/(Loss) After Tax (116) (218) (187) +47% +38%
Cash Profit 408 41 244 +895% +67%
Standalone FY 17 –Snapshot of Key Financials
Particulars FY17 FY16 %YoY
Total Revenue 15,494 14,693 +5%
EBITDA 2,858 2,441 +17%
EBITDA % 18% 17%
Depreciation 2,044 2,148 -5%
Finance Cost 2,280 2,646 -14%
Profit/(Loss) Before Tax (1,457) (2,330) +37%
Profit/(Loss) After Tax (986) (1,419) +30%
Cash Profit 587 (182) +423%
(Figures in Rs. Crores)
37- -
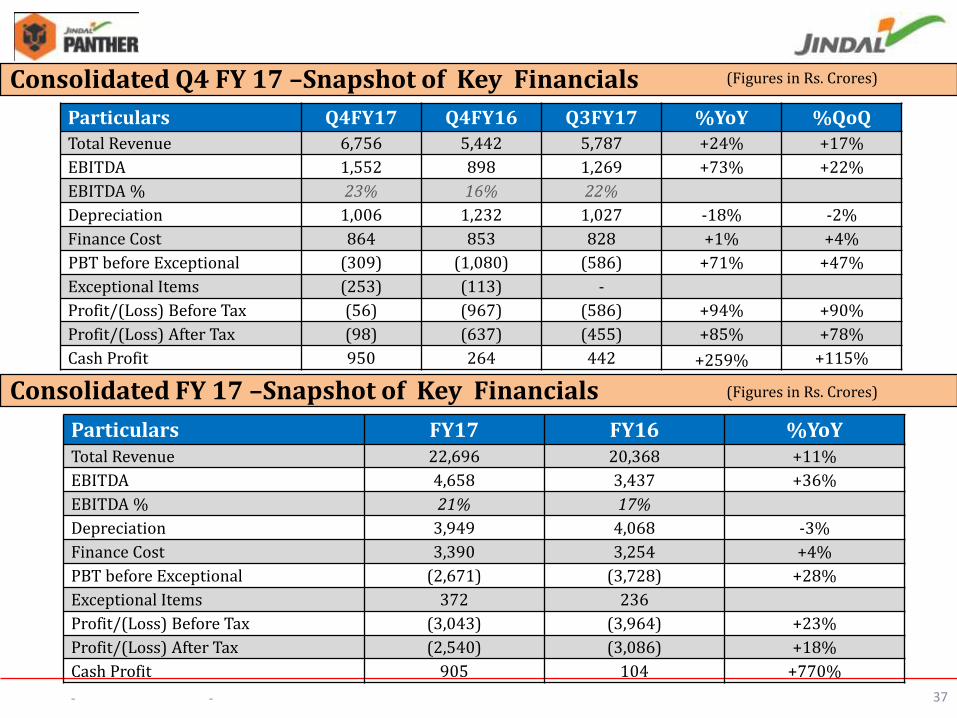
Consolidated Q4 FY 17 –Snapshot of Key Financials
Consolidated FY 17 –Snapshot of Key Financials
Particulars Q4FY17 Q4FY16 Q3FY17 %YoY %QoQTotal Revenue 6,756 5,442 5,787 +24% +17%
EBITDA 1,552 898 1,269 +73% +22%
EBITDA % 23% 16% 22%
Depreciation 1,006 1,232 1,027 -18% -2%
Finance Cost 864 853 828 +1% +4%
PBT before Exceptional (309) (1,080) (586) +71% +47%
Exceptional Items (253) (113) -
Profit/(Loss) Before Tax (56) (967) (586) +94% +90%
Profit/(Loss) After Tax (98) (637) (455) +85% +78%
Cash Profit 950 264 442 +259% +115%
(Figures in Rs. Crores)
Particulars FY17 FY16 %YoYTotal Revenue 22,696 20,368 +11%
EBITDA 4,658 3,437 +36%
EBITDA % 21% 17%
Depreciation 3,949 4,068 -3%
Finance Cost 3,390 3,254 +4%
PBT before Exceptional (2,671) (3,728) +28%
Exceptional Items 372 236
Profit/(Loss) Before Tax (3,043) (3,964) +23%
Profit/(Loss) After Tax (2,540) (3,086) +18%
Cash Profit 905 104 +770%
(Figures in Rs. Crores)

38- -
JPL Q4 FY17 – Snapshot of Key Financials (Figures in Rs. Crores)
Particulars Q4FY17 Q4FY16 Q3FY17 %YoY %QoQ
Net Sales 863 674 854 +28% +1%
EBITDA 382 105 302 +263% +27%
EBITDA % 44% 16% 35%
Depreciation + Amortization 376 647 385 -42% -2%
Interest 235 133 200 +77% +18%
Profit/(Loss) Before Tax (134) (471) (182) +71% +26%
Profit/(Loss) After Tax (84) (406) (162) +79% +48%
Cash Profit 241 210 203 +15% +19%
Generation (MU) 2,336 2,357 2,356 -1% -1%
Particulars FY17 FY16 %YoY
Net Sales 3,119 2,997 +4%
EBITDA 1,048 635 +65%
EBITDA % 34% 21%
Depreciation + Amortization 1,436 1514 -5%
Interest 789 451 +75%
Profit/(Loss) Before Tax (780) (820) +5%
Profit/(Loss) After Tax (668) (766) +13%
Cash Profit 656 706 -7%
Generation (MU) 9,176 9,542 -4%
JPL FY17 – Snapshot of Key Financials (Figures in Rs. Crores)

Future focus
Improvement of NSR and EBITDA .
Sweat the Assets – Achieve 100% Capacity utilization
Reduce Debt
Secure PPA for entire JPL Capacity
Foray in Building ; Rail infra segment & Defence segment
Continued focus on reduction of working capital
Focus on “Value Added Products”
To reduce cost of Quality – Improve first pass yield

India’s largest Blast Furnace all set to Commission

Sinter Plant – Angul Phase 1B

Coke Oven – Angul Phase 1B

For any information please contact: -
Mr. Nishant Baranwal – Head, Investor RelationsTel : +91 11-41462198Mobile:+91 8800690255Email: - [email protected]
Ms. Shweta Bagaria – Assistant Manager, Investor RelationsTel: +91-124-6612073Mobile: +91 95995 53717Email: [email protected]

THANK YOU
Recommended


