Q3 2017 resultsFrankfurt am Main, 14th November 2017
Borislav Kostadinov, Member of the Management BoardJana Donath, Manager Finance and Controlling

ProCredit – A unique approach to banking
2
► A profitable, development-oriented commercial banking group for SMEs with a focus on South Eastern Europe and Eastern Europe
► Headquartered in Frankfurt and supervised by the German Federal Financial Supervisory Authority (BaFin) and Deutsche Bundesbank
► Mission of promoting sustainable development with an ethical corporate culture and long-term business relationships
► Track record of high quality loan portfolio
► Profitable every year since creation as a banking group in 2003
► Listed on the Frankfurt Stock Exchange since Dec-16
► Approved member of the Social Stock Exchange since May-17
Notes: As of 31 December 2016 and as of 30 September 2017; (1) Continuing operations only; (2) Customer deposits divided by customer loan portfolio; (3) Annualised; (4) Full Rating Report as of 08.12.2016; (5) The South America segment also includes theinstitution “Administración y Recuperación de Cartera Michoacán S. A” (ARDEC) in Mexico, 0.2% of Group assets.
Key figures 9M 2017 and FY 2016
Geographical distribution
Summary
Germany(ca. 2% of gross loan portfolio)
South Eastern Europe and Eastern Europe (ca. 91% of gross loan portfolio)
South America(5)
(ca. 6% of gross loan portfolio)
Total assets
EUR 5,504m
EUR 5,668m
Customer loan portfolio(1)
EUR 3,832m
EUR 3,629m
Deposits/loans(2)
91%
96%
Number of employees(1)
3,522
4,078
Profit of the period
EUR 36m
EUR 61m
RoAE
7.1%(3)
9.6%
CET1 ratio (fully loaded)
13.3%
12.4%
Rating (Fitch)
BBB (stable)(4)
ProCredit Group | Q3 2017 results | Frankfurt am Main, 14th November 2017
Reputable development-oriented shareholder base
Note: Shareholder structure according to the voting right notifications as published on our website www.procredit-holding.com

“Hausbank” for SMEs serving their typical banking needs
3ProCredit Group | Q3 2017 results | Frankfurt am Main, 14th November 2017
Ukraine
► SMEs with formalised structures and sustainable business models
► Focus on agriculture and manufacturing
Access to full range of relevantbanking services
Valuable in countries with highlevel of informality and lack oftransparency
Trustful long-term relationships
► Vegetable cultivation(300 ha, 31 FTEs)
► Long-term relationship
► Regular financing of workingcapital and fixed assets
Loan volume PCBTotal financing since
2011 Outstanding loan
amountEUR 864k EUR 549k
Utilisation of PCB services• Current account (EUR, RSD)• Domestic and International payments• e-Banking
Revenue Account turnoverEUR 70k (monthly) EUR 103k (monthly)
Credit limitshort-term long-term total limitEUR 150k EUR 600k EUR 750k
Products
► Full range of business loans(loan size range typicallyEUR 30k to EUR 3m)
► Deposits
► e-Banking
► Card services
► Liquidity management
► Documentary business
► Personal banking services
Understanding of clients’ financialneeds and risks
Additional stable revenues
Customer depositsMost recent project: Solar panels to power irrigation of agricultural land
Comprehensive service as “Hausbank”
Customers Value-added
Target customers with high potential: SMEs Significant benefits for clients…
Typical SME client (Serbia)
Simple loan and deposit products
…and for ProCreditSupplementary financial services

Agenda
4
B
A
C
Highlights
Financial development
Asset quality
D Balance sheet, capital and funding
Q&A
Appendix
ProCredit Group | Q3 2017 results | Frankfurt am Main, 14th November 2017

Where do we come from?Significant progress since 2013
5
Focused growth in SME loan categories (1)
Regional focus on South Eastern Europe and Eastern Europe
Decrease in overall branch network
Decrease in number of cash desk transactions
Decrease in number of total group staff
Increase in loan portfolio per total group staff
Note: All related figures and ratios for Dec-13 relate to the subsidiaries as shown in the consolidated financial statement as of 2013; (1) Loan portfolio > EUR 30k initial loan size in % of customer loan portfolio by outstanding principal
ProCredit Group | Q3 2017 results | Frankfurt am Main, 14th November 2017
58%81% 87%
Dec-13 Dec-16 Sep-17Loan portfolio > EUR 30k in % total loan portfolio
71%89% 91%
Dec-13 Dec-16 Sep-17SEE and EE as % of gross loan portfolio
317 67 54
328
224 102
Dec-13 Dec-16 Sep-17Number of branches Number of service points
645
156291
28%
5% 2%
Dec-13 Dec-16 Sep-17YTD Cash desk transactions in % total transactions
11,514
4,078 3,522
Dec-13 Dec-16 Sep-17Number of total group staff
363
8901,088
Dec-13 Dec-16 Sep-17
Gross loan portfolio per total group staff
(in E
UR
k)

Recent key achievements
6
Execution of business client strategy► Very strong growth with target SME clients in Eastern Europe► On track for sharp business profile as modern SME bank for Eastern Europe: Successful sale of Banco ProCredit Nicaragua and Banco ProCredit El Salvador 91% of loan portfolio with SMEs and SEE/EE segments Further decreased branch and service point network Increased automation using state-of-the-art IT infrastructure
Continued external recognition and certification ► SMEs in Romania and Ukraine benefit as the EIB, ProCredit Bank Romania and ProCredit Bank Ukraine sign first
loan agreements in local currency► First guarantee agreements with EIB signed under the EU4Business initiative for Georgia, Moldova and Ukraine► ISO 14001 certification completed for all ProCredit institutions
Execution of private client strategy► Implementation of a simple, unified offer for target private clients accessible via relevant electronic channels Unified service offer to private clients for standard fee in all ProCredit Banks Launch of one dedicated private client website Release of new version of mobile banking app
Successful roll-out of IR activities► PCH at analyst and investor conferences 2017 YTD: Oddo Seydler 11th German Conference, Impact Summit Europe 2017, DVFA Spring Conference, ESN 33rd
European Conference, Berenberg Pan-European Discovery Conference, DVFA Autumn Conference, Berenberg andGoldman Sachs 6th German Corporate Conference
2017 to come: Deutsche Börse German Equity ForumPicture provided by Impact Summit Europe 2017
ProCredit Group | Q3 2017 results | Frankfurt am Main, 14th November 2017

Strong volume growth in core loan categories
7Note: Loan volume growth split by initial loan size in all segments
ProCredit Group | Q3 2017 results | Frankfurt am Main, 14th November 2017
Sep 2017 YTD
-25% (EUR -169m) 13% (EUR +377m) +6%
Initial loan size
(in EUR)
EUR 133m EUR 369m
FY 2016
-28% (EUR -256m) 13% (EUR +336m) +2%
Initial loan size
(in EUR)
EUR 185m EUR 486m

► Return on average equity (RoAE)
8
We deliver on our guidance
► Growth of the total gross loan portfolio
► CET1 ratio (fully loaded)
► Dividend payout ratio
In the mid-term, and taking into consideration a stabilising political, economic and operating environment, we see potential for approx. 10% p.a. growth of the gross loan portfolio, a cost-income ratio (CIR) < 60%, and a return on average equity (RoAE) of approx. 10%.
► Growth of the gross loan portfolio in the target loan categories (>EUR 30,000)
Outlook for ProCredit Group 2017
+13%
+6%
7.1% (annualised)
13.3%
Actuals9M 2017
n.a.
Commentary
Continued strong growth in the SME segment
Decrease of non-core loan categories largely completed by end of 2017
Profitable third quarter with ROE of 7.4%
Positive impact from disposal of El Salvador expected in Q4
Confirmation of dividend policy
Guidance 2017
ProCredit Group | Q3 2017 results | Frankfurt am Main, 14th November 2017
> 10%
> 8%
7 – 9%
> 13%
1/3 of profits

Update on implementation of digital private client offer
9
Ongoing implementation Examples
► Implementation of unified service offer to private clients for standard fee in all ProCredit banks
► Launch of one dedicated website:www.procreditbank-direct.com
► Release of new version of mobile banking app(live: Ukraine)
► Global launch of new version of mobile banking app inall ProCredit banks (Group-wide rollout: Q1-18)
► Providing a state-of-the-art online channel for banking transactions toall our private clients
► Continuous investments in innovation, customer experience andsecurity standards
► Further increase of group efficiency and automation
► Strengthening of fee income
► Entrepreneurs and middle income-clients as a reliable source offunding
Strategic objectives
ProCredit Group | Q3 2017 results | Frankfurt am Main, 14th November 2017

Agenda
10
B
A
C
Highlights
Financial development
Asset quality
D Balance sheet, capital and funding
Q&A
Appendix
ProCredit Group | Q3 2017 results | Frankfurt am Main, 14th November 2017

In EUR m Q2-2017 Q3-2017 9M-2016 9M-2017 y-o-y
Net interest income 51.3 50.4 175.6 153.0 -13%Provision expenses 0.5 1.1 16.8 4.5 -73%Net fee and commission income 10.9 11.7 32.1 33.3 4%Net result of other operating income 0.5 2.8 1.5 5.3 n.m.Operating income 62.2 63.8 192.3 187.1 -3%Operating expenses 47.9 44.9 144.5 140.1 -3%Operating results 14.3 18.9 47.9 47.0 -2%Tax expenses 3.0 3.2 11.2 10.5 -6%Profit from continuing operations 11.3 15.7 36.6 36.4 -1%Profit from discontinued operations 0.4 -3.4 -1.1 -0.7 -41%Profit of the period 11.7 12.2 35.5 35.8 1%
Change in loan portfolio > EUR 30,000 4.7% 2.7% 7.7% 12.9% 5.1ppReturn on average equity(1) 6.9% 7.4% 7.6% 7.1% -0.5ppCET1 ratio (fully loaded) 13.0% 13.3% 10.6% 13.3% 2.7pp
Net interest margin(1) 4.0% 3.9% 4.8% 3.9% -0.9ppNet write-off ratio(1)(2) 0.1% 0.2% 0.6% 0.3% -0.3ppLoans in PAR30 3.7% 3.5% 4.7% 3.5% -1.2ppImpaired loans 5.8% 5.4% 7.7% 5.4% -2.3ppCost-income ratio 76.4% 69.3% 69.1% 73.1% 4.1ppBook value per share 12.01 12.14 11.86 12.14 2%
Incomestatement
Key performanceindicators
Additionalindicators
Q3 2017 results at a glance
11
Note: P&L related figures and ratios, unless indicated otherwise, are based on continuing operations; i.e. excluding Banco PyME Los Andes ProCredit Bolivia, ProConfianza Mexico, Banco ProCredit El Salvador and BancoProCredit Nicaragua for 2017 and 2016; Return on average equity, CET1 ratio, and dividend payout ratio include as well discontinued operations; (1) Annualised; (2) Net write-off ratio presented always YTD
ProCredit Group | Q3 2017 results | Frankfurt am Main, 14th November 2017
Net interest income
12ProCredit Group | Q3 2017 results | Frankfurt am Main, 14th November 2017
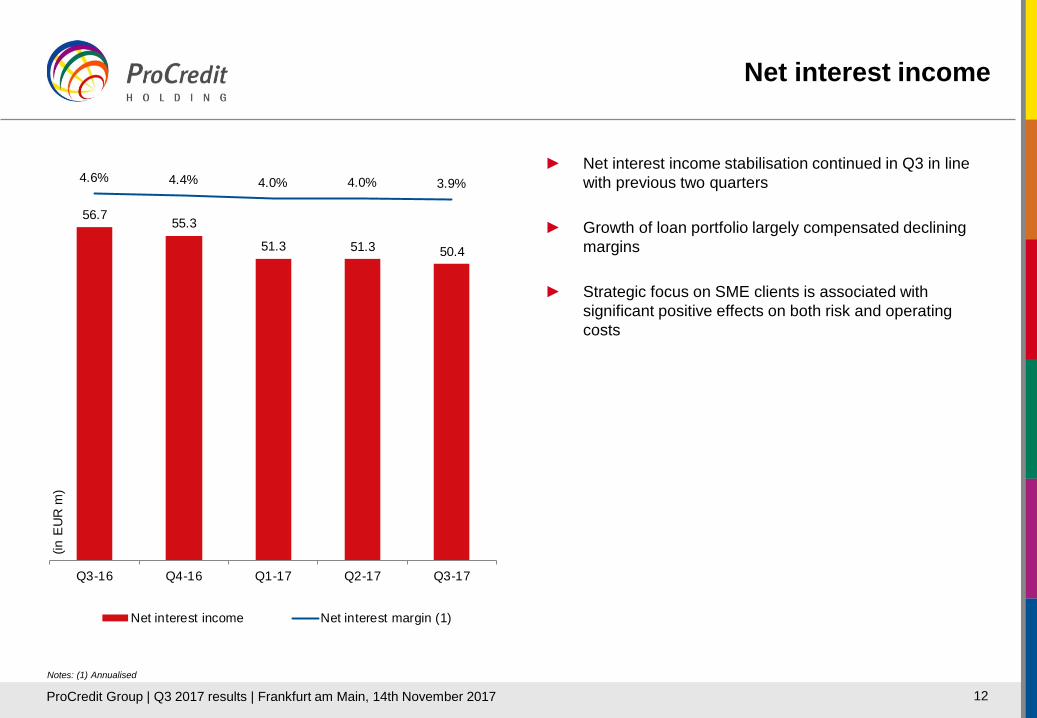
► Net interest income stabilisation continued in Q3 in line with previous two quarters
► Growth of loan portfolio largely compensated declining margins
► Strategic focus on SME clients is associated with significant positive effects on both risk and operating costs
56.7 55.3
51.3 51.3 50.4
4.6% 4.4% 4.0% 4.0% 3.9%
Q3-16 Q4-16 Q1-17 Q2-17 Q3-17
Net interest income Net interest margin (1)
(in E
UR
m)
Notes: (1) Annualised

Provisioning expenses
13
► Expenses for allowances for losses on loans andadvances to customers (LLP) on low level withcomfortable coverage ratio (103%)
► Decrease in LLP/cost of risk in 2017 driven by improvedloan portfolio quality and recovery of written-off loanportfolio
Notes: (1) Cost of risk defined as allowances for losses on loans and advances to customers, divided by average customer loan portfolio; Annualised
ProCredit Group | Q3 2017 results | Frankfurt am Main, 14th November 2017
2.9
1.8
3.0
0.5
1.1
33 bps
20 bps
32 bps
5 bps
11 bps
Q3-16 Q4-16 Q1-17 Q2-17 Q3-17
Allowance for losses on loans and advances to customers
Cost of risk (1)
(in E
UR
m)

Net fee and commission income
14ProCredit Group | Q3 2017 results | Frankfurt am Main, 14th November 2017
► Q3-17 net fee and commission income with substantialincrease compared to all previous quarters
► Increase predominantly driven by adjustment to fees foraccount maintenance services, which have beengradually implemented in most banks
► Increase in income from account maintenance and cardtransaction services more than compensated for thedeclining fee income from the reduced number of cashtransactions
10.410.9 10.7 10.9
11.7
Q3-16 Q4-16 Q1-17 Q2-17 Q3-17
Net fee and commission income
(in E
UR
m)
Operating expenses
15ProCredit Group | Q3 2017 results | Frankfurt am Main, 14th November 2017
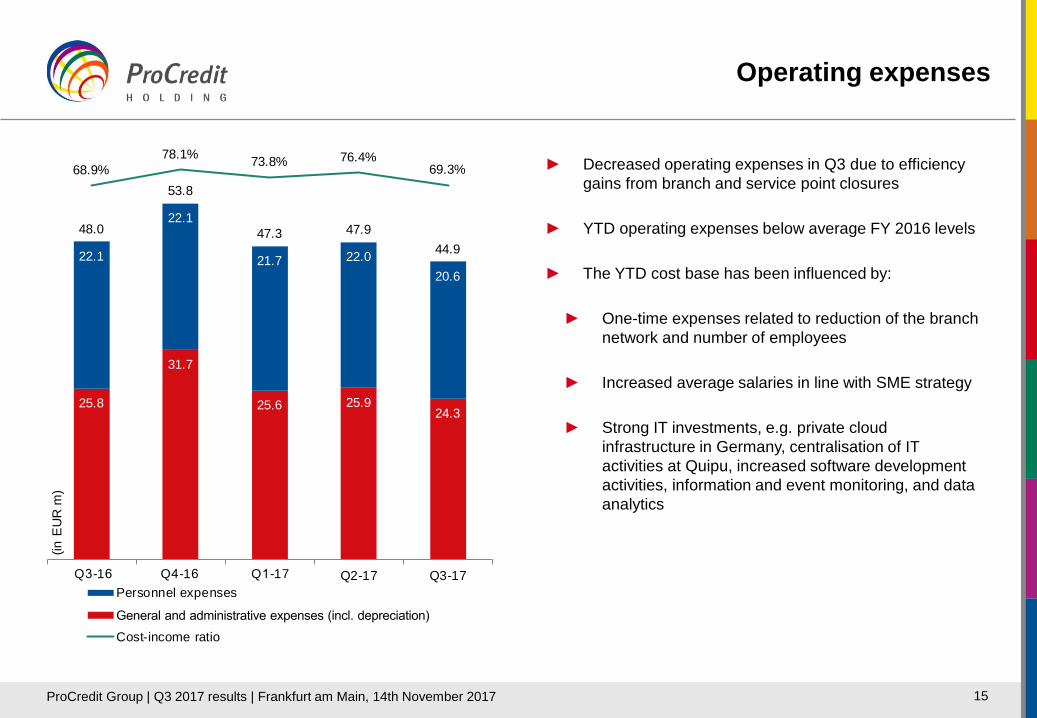
► Decreased operating expenses in Q3 due to efficiencygains from branch and service point closures
► YTD operating expenses below average FY 2016 levels
► The YTD cost base has been influenced by:
► One-time expenses related to reduction of the branchnetwork and number of employees
► Increased average salaries in line with SME strategy
► Strong IT investments, e.g. private cloudinfrastructure in Germany, centralisation of ITactivities at Quipu, increased software developmentactivities, information and event monitoring, and dataanalytics
25.8
31.7
25.6 25.924.3
22.1
22.1
21.7 22.020.6
48.0
53.8
47.3 47.944.9
68.9%78.1% 73.8% 76.4%
69.3%
Q2-17 Q3-17
(in E
UR
m)
Q4-16Personnel expenses
General and administrative expenses (incl. depreciation)Cost-income ratio
Q3-16 Q1-17

Contribution of segments to group net income 9M 2017
16
Customer loan portfolio (EUR m) 2,699 802 244 3,832
2017 YTD loan growth > EUR 30k +12.9% +17.0% -3.3% +12.9%
Loans in arrears (PAR 30) 3.4% 2.8% 8.7% 3.5%
Cost-income ratio (YTD) 64.7% 46.6% 126.4% 73.1%
ROAE (YTD)(1) 10.9% 16.9% -6.9% 7.1%
ProCredit Group | Q3 2017 results | Frankfurt am Main, 14th November 2017
Note: (1) Annualised
Group functions, e.g. risk management, reporting, capital management, liquidity management, training and development
Includes ProCredit Holding, Quipu, ProCredit Academy Fürth, ProCredit Bank Germany (EUR 89m customer loan portfolio; EUR 205m customer deposits)
Profit contribution (after tax of EUR -0.7m) from entities in El Salvador and Nicaragua. YTD result influenced by sale of PCB Nicaragua with a loss of EUR 3.3m due to reclassification of translation reserve, sale of El Salvador not yet recognised, a positive impact of approximately EUR 4m is expected for Q4
(in E
UR m
)

Agenda
17
B
A
C
Highlights
Financial development
Asset quality
D Balance sheet, capital and funding
Q&A
Appendix
ProCredit Group | Q3 2017 results | Frankfurt am Main, 14th November 2017

Structure of the loan portfolio
18
Loan portfolio by geographical segments
Notes: Loan portfolio by geographical segments and by sector in % of total customer loan portfolio (EUR 3,832m as per 30-Sep-17)
Loan portfolio by sector
ProCredit Group | Q3 2017 results | Frankfurt am Main, 14th November 2017
19%
17%
13%7%
6%
5%
4%
10%
8%
3%5% 1% 2%
Bulgaria Serbia Kosovo Macedonia RomaniaAlbania Bosnia Ukraine Georgia MoldovaEcuador Colombia Mexico Germany
Germany:2%
South Eastern Europe:
70%
Eastern Europe:21%
South America:6%
72%
19%
7%2%
Business loans Agricultural loans
Housing loans Other private client loans
Private loans:9%
Business loans:91%

Structure of the loan portfolio (continued)
19
Loan portfolio by initial loan size
Notes: Loan portfolio by initial loan size in % of total outstanding principal (EUR 3,812m as per 30-Sep-17); loan portfolio by currency in % of net loan portfolio (EUR 3,704m as per 30-Sep-17)
Loan portfolio by currency
ProCredit Group | Q3 2017 results | Frankfurt am Main, 14th November 2017
51%
14%
35%
EUR USD Other currencies
10%
25%
13%27%
12%
10%3%
EUR 30-50k EUR 50-150k EUR 150-250k EUR 250-1m
> EUR 1m EUR 10-30k < EUR 10k
Segment loan size < EUR 30k:
13%
Segment loan size > EUR 30k:
87%

Loan portfolio quality
20
► Net write-off development remains at a low level
► Further improvement in portfolio at risk (PAR)
► Prudent risk management underlined by high coverageratios
► Continuous monitoring of loan portfolio, with PAR 90,PAR 30, and impaired loans as key reporting triggers
► Very conservative definition of impaired loans, includingPAR 30
Notes: (1) Net write-offs to customer loan portfolio ratio, annualised; (2) Allowances for losses on loans and advances to customers divided by impaired loan portfolio; (3) Allowances for losses on loans and advances to customersdivided by PAR 30 loan portfolio
ProCredit Group | Q3 2017 results | Frankfurt am Main, 14th November 2017
2.1%
1.9%
0.7% 0.6%
3.0%2.9%
Jun-17 Sep-17
Other signs of impairment PAR 30-90 days PAR 90+ days
103%
5.4%
3.5%
2.9%PAR 90
PAR 30
0.3%
67%
Net write-offs(1)
Coverage ratio impaired(2)
Coverage ratio PAR30(3)
0.2%
66%
104%
5.8%
3.7%
3.0%

Structure of collateral
21
► Majority of collateral consisting of mortgages
► Clear and strict requirements regarding types of acceptable collateral, legal aspects of collateral and insurance of collateral items
► Standardised collateral valuation methodology
► Regular monitoring of the value of all collateral and a clear process of collateral revaluation, also by external, independent experts
► Verification of external appraisals and regular monitoring activities carried out by specialist staff members
Collateral by type
ProCredit Group | Q3 2017 results | Frankfurt am Main, 14th November 2017
69%
1%
7%
23%
Mortgages Cash collateral Financial guarantees Other
Total: EUR 2.9 bn
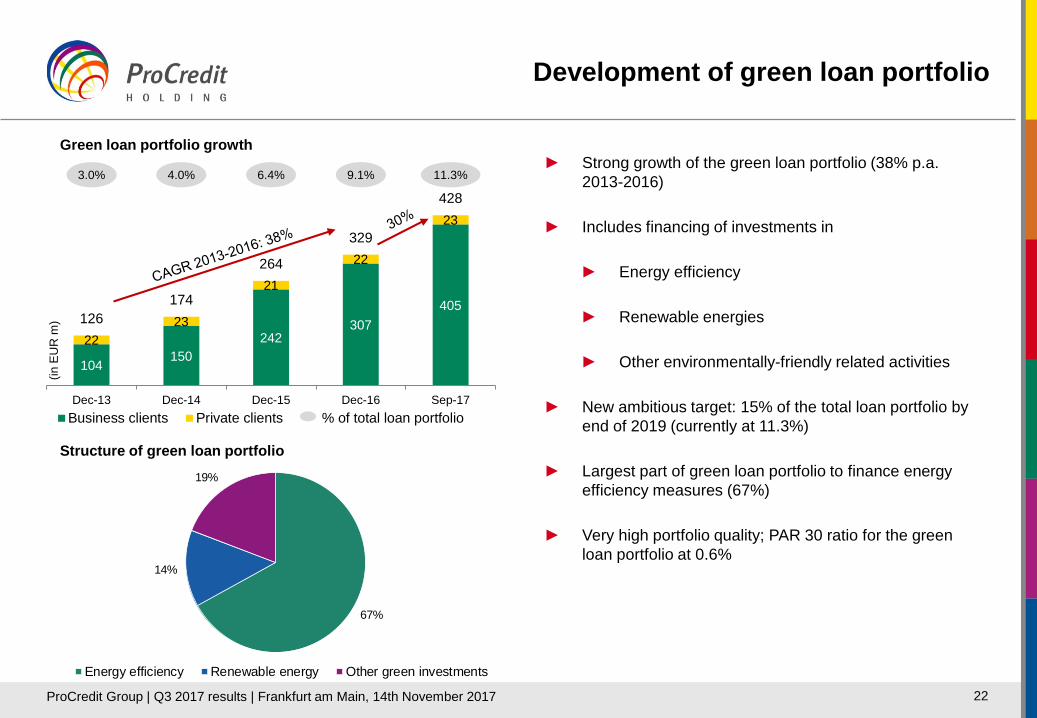
► Strong growth of the green loan portfolio (38% p.a.2013-2016)
► Includes financing of investments in
► Energy efficiency
► Renewable energies
► Other environmentally-friendly related activities
► New ambitious target: 15% of the total loan portfolio byend of 2019 (currently at 11.3%)
► Largest part of green loan portfolio to finance energyefficiency measures (67%)
► Very high portfolio quality; PAR 30 ratio for the greenloan portfolio at 0.6%
Development of green loan portfolio
22
Green loan portfolio growth
Structure of green loan portfolio
67%
14%
19%
Energy efficiency Renewable energy Other green investments
ProCredit Group | Q3 2017 results | Frankfurt am Main, 14th November 2017
104150
242307
405
2223
21
22
23
126174
264
329
4283.0% 4.0% 6.4% 9.1% 11.3%
Dec-13 Dec-14 Dec-15 Dec-16 Sep-17Business clients Private clients % of total loan portfolio
(in E
UR
m)

Agenda
23
B
A
C
Highlights
Financial development
Asset quality
D Balance sheet, capital and funding
Q&A
Appendix
ProCredit Group | Q3 2017 results | Frankfurt am Main, 14th November 2017

(in E
UR m
)
67%
16%
5%
11%Other assetsAssets heldfor saleCash and cash equivalents
Net loans to customers
Asset reconciliation
24ProCredit Group | Q3 2017 results | Frankfurt am Main, 14th November 2017
Increase of liquidity due to strong deposit growth
Strong growth in core loan segment + EUR 377m; further decline in loans < EUR 30k
Deconsolidation of PCB Nicaragua (sold in Aug-17)

Liabilities and equity reconciliation
25ProCredit Group | Q3 2017 results | Frankfurt am Main, 14th November 2017
Decrease in liabilities to private clients, largely due to the closure of service points; more than compensated by increased liabilities to private entities
Repayment of maturing liabilities
Emission of new bond
Deconsolidation of PCB Nicaragua (sold in Aug -7)
Repayment of grandfathered subordinated loan
Liabilities related to assets held for saleEquity12%
4%3% 1%3%9%
63%
6% Liabilities to banks
Liabilities to IFIs
Liabilities to customers
Debt securitiesSubordinated
debtOther liabilities
(in E
UR m
)

Liquidity update
26
► Adequate group liquidity situation
► All ratios remained comfortably above limits
► Increase of liquidity in Q3 as a result of depositgrowth
Liquidity coverage ratio
Highly liquid assets (HLA) and HLA ratio
ProCredit Group | Q3 2017 results | Frankfurt am Main, 14th November 2017
112%
143%
80% 80%
Jun-17 Sep-17
LCR ratio Regulatory minimum
0.7
0.8
Jun-17 Sep-17
Highly liquid assets (< 1 month) HLA ratio
20% 23%
(in E
UR
bn)

Regulatory capital and risk-weighted assets
27
► Increase of CET1, Total Capital andLeverage ratios
► CET1 capital includes Q1/Q2 2017 profitsless expected dividend-payout
► RWA decrease resulting from sale of PCBNicaragua
ProCredit Group | Q3 2017 results | Frankfurt am Main, 14th November 2017
Overview of capitalisation
In EUR m Jun-17 Sep-17
CET1 capital (net of deductions) 593 594
Additional Tier 1 capital (net of deductions) 0 0
Tier 1 capital 593 594
Tier 2 capital 133 131
Total capital 726 725
RWA total 4,546 4,451
o/w Credit risk 3,528 3,443
o/w Market risk (currency risk) 467 458
o/w Operational risk 549 549
o/w CVA risk 1 1
CET1 capital ratio 13.0% 13.3%
Total capital ratio 16.0% 16.3%
Leverage ratio 10.4% 10.5%
CET1 capital ratio (fully loaded) 13.0% 13.3%
Total capital ratio (fully loaded) 15.9% 16.2%
Leverage ratio (fully loaded) 10.3% 10.5%

Development of CET1 capital ratio (fully loaded)
28ProCredit Group | Q3 2017 results | Frankfurt am Main, 14th November 2017
Leverage ratio (fully loaded)
10.5%

Agenda
29
B
A
C
Highlights
Financial development
Asset quality
D Balance sheet, capital and funding
Q&A
Appendix
ProCredit Group | Q3 2017 results | Frankfurt am Main, 14th November 2017

Q&A
30ProCredit Group | Q3 2017 results | Frankfurt am Main, 14th November 2017
ProCredit Bank Bulgaria, Thessaloniki Branch

Agenda
31
B
A
C
Highlights
Financial development
Asset quality
D Balance sheet, capital and funding
Q&A
Appendix
ProCredit Group | Q3 2017 results | Frankfurt am Main, 14th November 2017
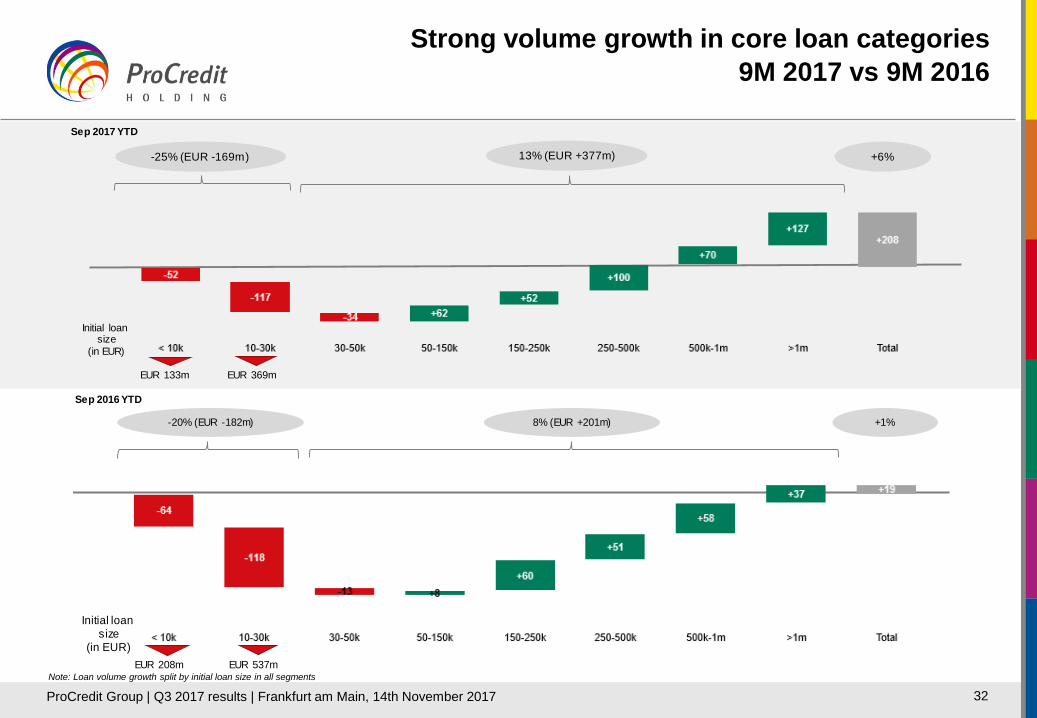
Strong volume growth in core loan categories9M 2017 vs 9M 2016
32Note: Loan volume growth split by initial loan size in all segments
ProCredit Group | Q3 2017 results | Frankfurt am Main, 14th November 2017
Sep 2017 YTD
-25% (EUR -169m) 13% (EUR +377m) +6%
Initial loan size
(in EUR)
EUR 133m EUR 369m
Sep 2016 YTD
-20% (EUR -182m) 8% (EUR +201m) +1%
Initial loan size
(in EUR)EUR 208m EUR 537m

Overview of quarterly financial development
33
Note: P&L related figures and ratios, unless indicated otherwise, are based on continuing operations; i.e. excluding Banco PyME Los Andes ProCredit Bolivia, ProConfianza Mexico, Banco ProCredit El Salvador and BancoProCredit Nicaragua for 2017 and 2016; Return on average equity and CET1 ratio include as well discontinued operations; (1) Annualised; (2) Net write-off ratio presented always YTD
ProCredit Group | Q3 2017 results | Frankfurt am Main, 14th November 2017
In EUR m Q3-2016 Q4-2016 Q1-2017 Q2-2017 Q3-2017
Net interest income 56.7 55.3 51.3 51.3 50.4Provision expenses 2.9 1.8 3.0 0.5 1.1Net fee and commission income 10.4 10.9 10.7 10.9 11.7Net result of other operating income 2.4 2.6 2.0 0.5 2.8Operating income 66.7 67.0 61.1 62.2 63.8Operating expenses 48.0 53.8 47.3 47.9 44.9Operating result 18.7 13.2 13.8 14.3 18.9Tax expenses 3.9 2.9 4.3 3.0 3.2Profit from continuing operations 14.9 10.4 9.5 11.3 15.7Profit from discontinued operations -8.6 15.1 2.3 0.4 -3.4Profit of the period 6.2 25.5 11.9 11.7 12.2
Change in loan portfolio > EUR 30,000 1.8% 4.8% 4.9% 4.7% 2.7%Return on average equity(1) 3.9% 16.1% 7.0% 6.9% 7.4%CET1 ratio (fully loaded) 10.6% 12.4% 12.3% 13.0% 13.3%
Net interest margin(1) 4.6% 4.4% 4.0% 4.0% 3.9%Net write-off ratio(1)(2) 0.6% 0.7% -0.1% 0.2% 0.3%Loans in PAR30 4.7% 3.9% 4.1% 3.7% 3.5%Impaired loans 7.7% 6.3% 6.3% 5.8% 5.4%Cost-income ratio 68.9% 78.1% 73.8% 76.4% 69.3%
Incomestatement
Key performanceindicators
Additionalindicators

Segment South Eastern Europe
34
Regional loan portfolio split
Loan portfolio growth(1)
Notes: (1) By initial loan amount; (2) Customer deposits divided by customer loan portfolio; (3) Annualised.
ProCredit Group | Q3 2017 results | Frankfurt am Main, 14th November 2017
Total: EUR 2,699m (70% of gross loan portfolio)
22% 16%
78% 84%
2,4772,684
Sep-16 Sep-17Loan portfolio < EUR 30k Loan portfolio > EUR 30k
(inEU
R m
)
(in EUR m) Sep-16 YTD Sep-17 YTD
Net interest income 115.0 99.2
Provision expenses 7.8 0.1
Net fee and commission income 21.7 22.7
Net result of other operating income 1.2 -0.3
Operating income 130.1 121.5
Operating expenses 81.4 78.6
Operating result 48.7 42.9
Tax expenses 5.3 5.1
Profit of the period 43.5 37.7
Change in loan portfolio > EUR 30,000 7.7% 12.9%
Deposits to loans ratio(2) 97.1% 91.3%
Net interest margin(3) 4.5% 3.7%
Cost-income ratio 59.0% 64.7%
Loans in PAR30 4.4% 3.4%
Coverage ratio PAR30 96.2% 103.3%
Return on average equity(3) 13.2% 10.9%
Bulgaria27%
Serbia24%Kosovo
19%
Macedonia10%
Romania8%
Albania6%
Bosnia6%
Key financial data

Segment Eastern Europe
35
Regional loan portfolio split
Notes: (1) By initial loan amount; (2) Customer deposits divided by customer loan portfolio; (3) Annualised
ProCredit Group | Q3 2017 results | Frankfurt am Main, 14th November 2017
Loan portfolio growth(1)
Total: EUR 802m (21% of gross loan portfolio)
12% 5%
88% 95%
698 799
Sep-16 Sep-17Loan portfolio < EUR 30k Loan portfolio > EUR 30k
(inE
UR
m)
Ukraine47%
Georgia40%
Moldova13% (in EUR m) Sep-16 YTD Sep-17 YTD
Net interest income 45.1 41.7
Provision expenses 9.7 6.1
Net fee and commission income 6.4 6.6
Net result of other operating income 2.1 2.7
Operating income 43.9 44.9
Operating expenses 25.3 23.7
Operating result 18.6 21.1
Tax expenses 3.3 3.0
Profit of the period 15.2 18.1
Change in loan portfolio > EUR 30,000 11.2% 17.0%
Deposits to loans ratio(2) 88.7% 81.1%
Net interest margin(3) 6.2% 5.1%
Cost-income ratio 47.3% 46.6%
Loans in PAR30 4.6% 2.8%
Coverage ratio PAR30 106.5% 142.5%
Return on average equity(3) 16.8% 16.9%
Key financial data

Segment South America
36
Regional loan portfolio split
Notes: (1) By initial loan amount; (2) Customer deposits divided by customer loan portfolio; (3) Annualised
ProCredit Group | Q3 2017 results | Frankfurt am Main, 14th November 2017
Key financial data
Loan portfolio growth(1)
Total: EUR 244m (6% of gross loan portfolio)
37% 20%
63%80%
292241
Sep-16 Sep-17Loan portfolio < EUR 30k Loan portfolio > EUR 30k
(inEU
R m
)
(in EUR m) Sep-16 YTD Sep-17 YTD
Net interest income 17.9 15.1
Provision expenses -0.5 -1.7
Net fee and commission income -0.1 -0.1
Net result of other operating income 1.7 0.7
Operating income 20.0 17.4
Operating expenses 21.1 19.8
Operating result -1.1 -2.4
Tax expenses 0.8 0.9
Profit of the period -1.9 -3.3
Change in loan portfolio > EUR 30,000 4.8% -3.3%
Deposits to loans ratio(2) 56.9% 65.9%
Net interest margin(3) 5.3% 4.7%
Cost-income ratio 108.3% 126.4%
Loans in PAR30 8.9% 8.7%
Coverage ratio PAR30 63.0% 56.5%
Return on average equity(3) -4.0% -6.9%
Ecuador82%
Colombia14%
Mexico4%

Funding and rating update
37
Funding sources overview
Deposit-to-loan ratio development
► Highly diversified funding structure and counterparties
► Customer deposits main funding source, accounting for 75% as of Sep-17
► Supplemented by long-term funding from IFIs and institutional investors
► High and stable deposit-to-loan ratio of 91%
Rating:
► ProCredit Holding and ProCredit Bank in Germany: BBB (stable) by Fitch
► ProCredit Banks: At or close to sovereign IDR; Local banks in Macedonia and Georgia are even rated above the sovereign IDR
Notes: (1) Total liabilities excluding liabilities related to assets held for sale (EUR 227m as of 30-Sep-17)
ProCredit Group | Q3 2017 results | Frankfurt am Main, 14th November 2017
Total liabilities(1) : EUR 4.6bn
75%
10%
7%4% 3%1%
Customer deposits
Liabilities to IFIs
Liabilities to banks
Debt securities
Subordinated debt
Other liabilities
96% 91%
Dec-16 Sep-17

Continued focus on transparent reporting ► Advanced disclosure, including e.g.:
► Annual Environmental Performance Report 2016 ► Environmental Statement for the ProCredit institutions located in Germany► Group Environmental Management Policy ► Further documents on the group’s approach to managing environmental and social risks in lending► Preparation for reporting under GRI Standards as of reporting year 2017
Significantly reduced ecological footprint(3)
► Yearly absolute energy consumption down by 11% yoy► Yearly absolute greenhouse gas emissions down by 13% yoy► Energy consumption per floor area kWh/m2 down by 2% yoy► Paper use down by 30% yoy; paper use per employee kg/pp down by 15% yoy
External certification► ISO 14001 certification completed for the ProCredit banks ► EU Eco-Management and Audit Scheme (EMAS) certification for ProCredit’s
Germany-based institutions in addition to ISO 14001► Corporate Responsibility Prime rating by oekom research
Sustainability overview
38
Continued focus on employee training(3)
► ~49,900 person-days of training(1)
► 527 graduates and participants from the Management Academy and Banker Academy► ~3,540 person-days of environment-related training(2)
Note: (1) Entry Programme, Group Workshops, Management Academy, Banker Academy, English course (2) Local trainings at 12 banks, academy environmental blocks, workshops, Entry Programme environmental block (3)Data is shown as end of Dec 16
ProCredit Group | Q3 2017 results | Frankfurt am Main, 14th November 2017
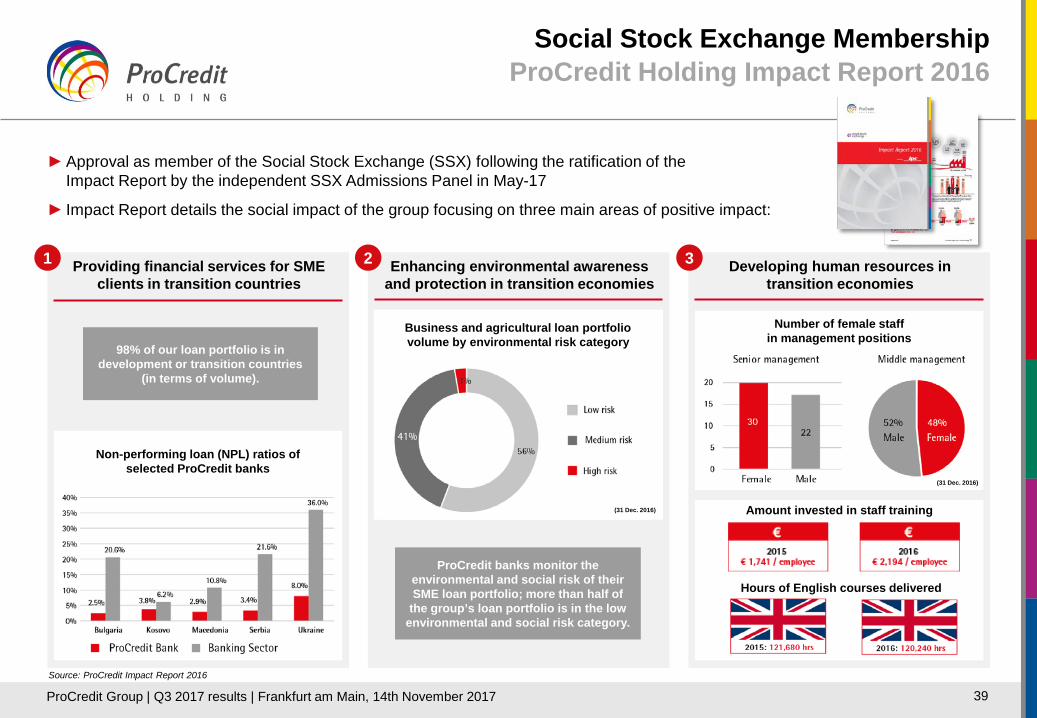
Developing human resources in transition economies
Enhancing environmental awareness and protection in transition economies
Business and agricultural loan portfolio volume by environmental risk category
Providing financial services for SME clients in transition countries
Social Stock Exchange MembershipProCredit Holding Impact Report 2016
39
1 2 3
►Approval as member of the Social Stock Exchange (SSX) following the ratification of theImpact Report by the independent SSX Admissions Panel in May-17
► Impact Report details the social impact of the group focusing on three main areas of positive impact:
Source: ProCredit Impact Report 2016
98% of our loan portfolio is in development or transition countries
(in terms of volume).
Non-performing loan (NPL) ratios of selected ProCredit banks
ProCredit banks monitor the environmental and social risk of their SME loan portfolio; more than half of
the group’s loan portfolio is in the low environmental and social risk category.
Number of female staff in management positions
(31 Dec. 2016)
(31 Dec. 2016) Amount invested in staff training
Hours of English courses delivered
ProCredit Group | Q3 2017 results | Frankfurt am Main, 14th November 2017

Balance sheet
40ProCredit Group | Q3 2017 results | Frankfurt am Main, 14th November 2017
In EUR m Dec-16 Sep-17Assets
Cash and cash equivalents 937 900Loans and advances to banks 287 208Financial assets at fair value through profit or loss 0 0Available-for-sale financial assets 250 184Loans and advances to customers 3,629 3,832Allowance for losses on loans and advances to customers -151 -139Property, plant and equipment 157 143Other assets 97 94Assets held for sale 461 281Total assets 5,668 5,504
LiabilitiesLiabilities to banks 318 307Financial liabilities at fair value through profit or loss 1 1Liabilities to customers 3,475 3,479Liabilities to International Financial Institutions 499 477Debt securities 144 180Other liabilities 38 35Subordinated debt 171 141Liabilities related to assets held for sale 368 227Total liabilities 5,014 4,846
EquitySubscribed capital 268 268Capital reserve 115 115Legal reserve 0 0Retained earnings 325 340Translation reserve -62 -73Revaluation reserve 0 0Equity attributable to ProCredit shareholders 646 650Non-controlling interests 8 7Total equity 654 657Total equity and liabilities 5,668 5,504

Income statement by segment
41Note: Banco ProCredit El Salvador shown as discontinued operations
ProCredit Group | Q3 2017 results | Frankfurt am Main, 14th November 2017
01.01. - 30.09.2017(in EUR m) Germany Eastern
EuropeSouth Eastern
Europe South America Consolidation Group
Interest and similar income 13.9 74.5 115.1 25.1 -12.7 215.9of which inter-segment 12.3 0.2 0.1 0.0
Interest and similar expenses 15.9 32.8 16.0 10.0 -11.8 62.9of which inter-segment 0.4 3.9 5.3 2.2
Net interest income -2.0 41.7 99.2 15.1 -0.9 153.0
Allowance for losses on loans and advances to customers 0.1 6.1 0.1 -1.7 0.0 4.5Net interest income after allowances -2.0 35.6 99.1 16.8 -0.9 148.5
Fee and commission income 7.1 9.5 34.0 1.1 -6.9 44.9of which inter-segment 5.8 0.0 1.1 0.0
Fee and commission expenses 1.4 3.0 11.2 1.2 -5.3 11.6of which inter-segment 0.0 1.1 3.7 0.4
Net fee and commission income 5.7 6.6 22.7 -0.1 -1.6 33.3
Result from foreign exchange transactions -0.9 3.9 5.3 0.1 -0.1 8.3Net result from financial instruments at fair value through profit or loss -0.8 -0.4 0.6 0.0 0.0 -0.6Net result from available-for-sale financial assets -7.5 0.0 0.1 0.0 7.6 0.1
of which inter-segment -7.6 0.0 0.0 0.0 0.0 0.0Net other operating income 78.2 -0.9 -6.3 0.7 -74.2 -2.5
of which inter-segment 72.6 0.0 1.2 0.5 0.0 0.0Operating income 72.6 44.9 121.5 17.4 -69.2 187.1
Personnel expenses 17.4 8.3 30.8 8.0 0.0 64.4Administrative expenses 21.5 15.5 47.9 11.9 -20.9 75.8
of which inter-segment 4.8 3.7 10.3 2.1 0.0 0.0Operating expenses 38.9 23.7 78.6 19.8 -20.9 140.1
Profit before tax 33.7 21.1 42.9 -2.4 -48.3 47.0
Income tax expenses 1.5 3.0 5.1 0.9 0.0 10.5Profit of the period from continuing operations 32.2 18.1 37.7 -3.3 -48.3 36.4Profit of the period from discontinued operations -0.7Profit of the period 32.2 18.1 37.7 -3.3 -48.3 35.8
Profit attributable to ProCredit shareholders 34.6Profit attributable to non-controlling interests 1.2

Information regarding financial figuresin this presentation
42Note: Unless indicated otherwise
Q3 2017:
− Financial data for nine-month period ended September 30, 2017, as shown in the unaudited quarterly financial report ended September 30, 2017
− Entities classified as discontinued operations include Banco ProCredit El Salvador in the balance sheet-related information and in the profit and loss-related information. Previous period financial data for nine-month period ended September 30, 2016 also include ProConfianza Mexico and Banco Pyme Los Andes ProCredit Bolivia.
Q2 2017:
− Financial data for six-month period ended June 30, 2017, as shown in the unaudited quarterly financial report ended June 30, 2017
− Entities classified as discontinued operations include Banco ProCredit El Salvador and Banco ProCredit Nicaragua in the balance sheet-related information and in the profit and loss-related information. Previous period financial data for six-month period ended June 30, 2016 also include ProConfianza Mexico and Banco Pyme Los Andes ProCredit Bolivia.
Q1 2017:
− Financial data for three-month period ended March 31, 2017, as shown in the unaudited quarterly financial report ended March 31, 2017
− Entities classified as discontinued operations include Banco ProCredit El Salvador and Banco ProCredit Nicaragua in the balance sheet-related information and in the profit and loss-related information. Previous period financial data for three-month period ended March 31, 2016 also include ProConfianza Mexico and Banco Pyme Los Andes ProCredit Bolivia.
FY 2016:
− Financial data for the fiscal year ended December 31, 2016, as shown in the consolidated financial statements as of and for the fiscal year ended December 31, 2016
− Entities classified as discontinued operations: Banco ProCredit El Salvador and Banco ProCredit Nicaragua in the balance sheet-related information, and ProConfianza Mexico, Banco ProCredit El Salvador, Banco ProCredit Nicaragua, and Banco Pyme Los Andes ProCredit Bolivia in the profit and loss-related information.
ProCredit Group | Q3 2017 results | Frankfurt am Main, 14th November 2017

Contact Investor Relations
43
Investor Relations
ProCredit Holding AG & Co. KGaANadine Frerot
tel.: +49 69 951 437 285e-mail: [email protected]
Contact details
Media Relations
ProCredit Holding AG & Co. KGaAAndrea Kaufmann
tel.: +49 69 951 437 138e-mail: [email protected]
ProCredit Group | Q3 2017 results | Frankfurt am Main, 14th November 2017

Disclaimer
The material in this presentation and further supporting documents have been prepared by ProCredit Holding AG & Co. KGaA, Frankfurt am Main,Federal Republic of Germany (“ProCredit Holding”) and are general background information about the ProCredit group’s activities current as at the dateof this presentation. This information is given in summary form and does not purport to be complete. Information in this presentation and furthersupporting documents, including forecast financial information, should not be considered as advice or a recommendation to investors or potentialinvestors in relation to holding, purchasing or selling securities or other financial products or instruments and does not take into account your particularinvestment objectives, financial situation or needs. Before acting on any information you should consider the appropriateness of the information havingregard to these matters, any relevant offer document and in particular, you should seek independent financial advice. All securities and financial productor instrument transactions involve risks, which include (among others) the risk of adverse or unanticipated market, financial or political developmentsand, in international transactions, currency risk.
This presentation and further supporting documents may contain forward-looking statements including statements regarding our intent, belief or currentexpectations with respect to the ProCredit group’s businesses and operations, market conditions, results of operation and financial condition, capitaladequacy, specific provisions and risk management practices. Readers are cautioned not to place undue reliance on these forward-looking statements.ProCredit Holding does not undertake any obligation to publicly release the result of any revisions to these forward-looking statements to reflect eventsor circumstances after the date hereof to reflect the occurrence of unanticipated events. While due care has been used in the preparation of forecastinformation, actual results may vary in a materially positive or negative manner. Forecasts and hypothetical examples are subject to uncertainty andcontingencies outside ProCredit Holding’s control. Past performance is not a reliable indication of future performance.
44ProCredit Group | Q3 2017 results | Frankfurt am Main, 14th November 2017
Recommended