January 29, 2015
OMRON Corporation
Q3 2014 Earnings
Financial Results for the Third Quarter Ended December 31, 2014

1
Contents
2. Q1-Q3 Results
P. 2
4. Corporate Value Improvement Award
P. 20
P. 4
3. Full-Year Forecast P. 13
P. 24
1. Summary
References
Summary
2

Summary Q1-Q3 Results Full-Year Forecast Corp. Value Award
3
Summary
• Q1-Q3
• Large increase in sales and profits following H1.
• IAB brisk following H1.
• Consolidated OP up due to (1) the weak yen and (2) expenses carryover.
• Q4 & Full-Year
• No changes to the initial full-year forecast.
• Expects IAB to stay solid in Q4, while Environmental Solutions and Backlight to see one-time demand drop.
• Even with highly volatile businesses, negative impacts on OP will be limited thanks to the weak yen.
• Omron will carry out growth investment as planned.
Q1-Q3 Results
4

Summary Q1-Q3 Results Full-Year Forecast Corp. Value Award
5
FY2013 FY2014
Q1-Q3 Q1-Q3
Net Sales 552.4 614.3 +11.2%
Gross Profit 213.8 243.9 +14.1%
(%) (38.7%) (39.7%) (+1.0%pt)
Operating Income 48.3 63.0 +30.3%
(%) (8.8%) (10.3%) (+1.5%pt)
NIBT 46.4 65.5 +41.2%
Net Income
attributable to shareholders33.9 49.3 +45.2%
1USD(JPY) 99.3 107.2 +7.9
1EUR(JPY) 132.1 140.5 +8.4
Y/Y
(Billions of yen)
Q1-Q3 9-Month Results
Large sales & profits increase to post >10% OP.

Summary Q1-Q3 Results Full-Year Forecast Corp. Value Award
6
+5.7 48.3
-4.5
+24.3 -1.5
-9.3 63.0
Q1-Q3 9-Month Operating Income Analysis, Y/Y
(Billions of yen)
Gross profit up 19.8 (excl. forex & raw material impacts)
Operating income up 14.7
FY2013 Q1-Q3 Actual
FY2014 Q1-Q3 Actual
Forex, Raw material costs
Sales up Added value
(%) up
Fixed manufacturing
costs up
SG&A up
R&D up
Sales up, added value (%) up, to boost operating income.

Summary Q1-Q3 Results Full-Year Forecast Corp. Value Award
7
FY2013 FY2014
Q1-Q3 Q1-Q3
IAB
Industrial Automation
EMC
Electronic & Mechanical Components
AEC
Automotive Electronic Components
SSB
Social Systems, Solutions & Service
HCB
Healthcare
Other 58.1 67.8 +16.8%
Eliminations & Corporate 4.6 3.9 -16.2%
Total 552.4 614.3 +11.2%
Y/Y
212.2
72.9
92.3
45.7
+15.3%
+3.7%
+9.3%
+5.1%
+10.3%66.6
244.6
75.6
100.9
48.0
73.5
Q1-Q3 9-Month Sales by Segment
IAB and "Other" were major drivers. (Billions of yen)
Summary Q1-Q3 Results Full-Year Forecast Corp. Value Award
8
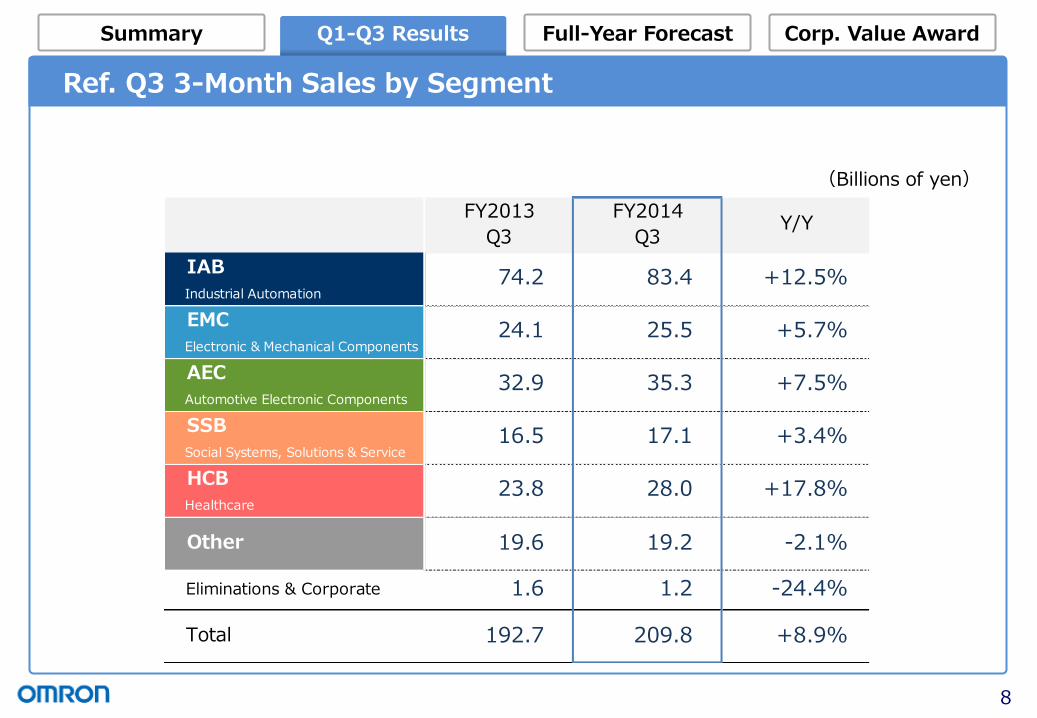
Ref. Q3 3-Month Sales by Segment
FY2013 FY2014
Q3 Q3
IAB
Industrial Automation
EMC
Electronic & Mechanical Components
AEC
Automotive Electronic Components
SSB
Social Systems, Solutions & Service
HCB
Healthcare
Other 19.6 19.2 -2.1%
Eliminations & Corporate 1.6 1.2 -24.4%
Total 192.7 209.8 +8.9%
Y/Y
74.2
24.1
32.9
16.5
+12.5%
+5.7%
+7.5%
+3.4%
+17.8%23.8
83.4
25.5
35.3
17.1
28.0
(Billions of yen)

Summary Q1-Q3 Results Full-Year Forecast Corp. Value Award
9
Ref. Q1-Q3 9-Month Operating Income by Segment
(Billions of yen)
FY2013 FY2014
Q1-Q3 Q1-Q3
IAB 28.3 40.3 +12.0
Industrial Automation (13.3%) (16.5%) (+3.1%pt)
EMC 6.8 7.0 +0.2
Electronic & Mechanical Components (9.3%) (9.3%) (±0.0%pt)
AEC 7.0 7.1 +0.1
Automotive Electronic Components (7.6%) (7.0%) (-0.6%pt)
SSB -1.9 -1.0 +0.9
Social Systems, Solutions & Service (-) (-) (-)
HCB 6.4 5.8 -0.6
Healthcare (9.7%) (8.0%) (-1.7%pt)
7.1 8.4 +1.3
(12.2%) (12.3%) (+0.1%pt)
Eliminations & Corporate -5.4 -4.6 +0.8
48.3 63.0 +14.7
(8.8%) (10.3%) (+1.5%pt)
Y/Y
Other
Total
IAB contributed to the large OP growth.

Summary Q1-Q3 Results Full-Year Forecast Corp. Value Award
10
Ref. Q3 3-Month Operating Income by Segment
(Billions of yen)
FY2013 FY2014
Q3 Q3
IAB 10.4 13.6 +3.1
Industrial Automation (14.1%) (16.3%) (+2.2%pt)
EMC 2.9 3.0 +0.2
Electronic & Mechanical Components (11.8%) (11.9%) (+0.1%pt)
AEC 2.7 2.9 +0.3
Automotive Electronic Components (8.1%) (8.3%) (+0.2%pt)
SSB -0.1 0.0 +0.2
Social Systems, Solutions & Service (-) (-) (-)
HCB 2.1 1.9 -0.2
Healthcare (8.6%) (6.8%) (-1.9%pt)
1.3 0.5 -0.8
(6.7%) (2.5%) (-4.2%pt)
Eliminations & Corporate -1.7 -2.0 -0.3
17.6 20.0 +2.4
(9.1%) (9.5%) (+0.4%pt)
Y/Y
Other
Total

Summary Q1-Q3 Results Full-Year Forecast Corp. Value Award
11
(1) Mar. 31, 2014 (2) Dec. 31, 2014 (2) - (1)
Current assets 396.5 428.1 +31.6
Property, plant & equipment 135.6 149.8 +14.3
Investments and other assets 122.6 125.9 +3.3
Total Assets 654.7 703.8 +49.1
Current liabilities 162.7 165.8 +3.1
Long-term liabilities 59.2 46.3 -13.0
Total Liabilities 221.9 212.1 -9.8
Shareholders' equity 430.5 489.2 +58.7
Noncontrolling interests 2.3 2.5 +0.2
Total Net Assets 432.8 491.7 +58.9
Total Liabilities and Shareholders' Equity 654.7 703.8 +49.1
Shareholders' equity to total assets 65.8% 69.5% +3.8%pt
(Billions of yen)
Consolidated B/S
Summary Q1-Q3 Results Full-Year Forecast Corp. Value Award
12
(Billions of yen)
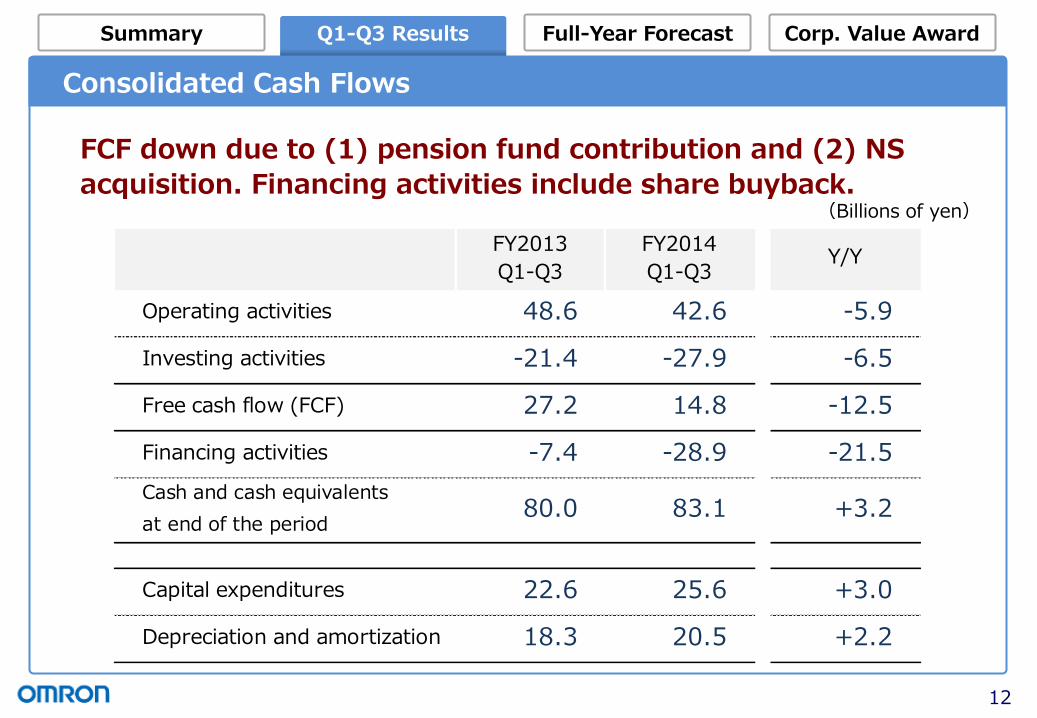
Consolidated Cash Flows
FCF down due to (1) pension fund contribution and (2) NS
acquisition. Financing activities include share buyback.
FY2013 FY2014
Q1-Q3 Q1-Q3
Operating activities 48.6 42.6 -5.9
Investing activities -21.4 -27.9 -6.5
Free cash flow (FCF) 27.2 14.8 -12.5
Financing activities -7.4 -28.9 -21.5
Cash and cash equivalents
at end of the period80.0 83.1 +3.2
Capital expenditures 22.6 25.6 +3.0
Depreciation and amortization 18.3 20.5 +2.2
Y/Y

13
Full-Year Forecast

Corp. Value Award Summary Q1-Q3 Results Full-Year Forecast
14
Q4 Business Environment by Area (vs. Oct. 28 Forecast)
Unchanged overall, with some industries and areas slowing
down.
Japan Capital investment solid especially among large businesses. PV will temporarily go stagnant due to market changes.
Overseas
• Americas: US solid overall thanks to increasing consumer spending and capital investment. Brazil slow amid the looming economy.
• Europe: Flat overall. Russia weak due to the economy.
• China: Slowdown signs in some industries/areas with property-related investment cooling down.
• Asia: Thailand and Indonesia unchanged. Business sentiment better in India. Slowdown in South Korea.

Corp. Value Award Summary Q1-Q3 Results Full-Year Forecast
15
Q4 Business Environment by Segment (vs. Oct. 28 Forecast)
IAB
Industrial Automation
Japan: Modest upturn overall, with automotive remaining solid and semiconductors
back on a recovery track.
Overseas: Slowdown signs in China. Americas favorable especially N. America.
Europe flat. In Asia, S. Korea will trend down with the other areas flat.
EMC
Electronic & Mechanical
Components
Home electronics: In Japan, consumer spending will remain low after the consumption
tax hike. Europe and China will remain solid.
Automotive components: No major changes overall.
AEC
Automotive Electronic
Components
Japan: Mini-vehicles will remain healthy. 'Ordinary' cars will keep going down Y/Y.
Overseas: N. America will be solid. Asia and China will trend down. No major changes
in the other areas.
SSB
Social Systems,
Solutions & Service
Demand for train system will go solid overall.
Environmental Solutions will temporarily go sluggish due to changes in the PV market.
HCB
Healthcare
Japan: Home-use solid. Professional-use will go stagnant due to medical institutions'
revenue drop and cost reduction efforts.
Overseas: Russia will be weak hit by the ruble crash. The other areas will remain the
same.
OtherEnvironmental Solutions will temporarily go sluggish due to changes in the PV market.
Backlight will see one-time demand drop due to some customers' model changes.

Corp. Value Award Summary Q1-Q3 Results Full-Year Forecast
16
Full-Year Forecast
No changes to FY14 full-year forecast.
FY2013 FY2014
Actual Forecast
Net Sales 773.0 835.0 +8.0%
Gross Profit 297.2 331.0 +11.4%
(%) (38.5%) (39.6%) (+1.2%pt)
Operating Income 68.1 84.0 +23.4%
(%) (8.8%) (10.1%) (+1.3%pt)
NIBT 62.0 84.5 +36.3%
Net Income
attributable to shareholders46.2 62.5 +35.3%
1USD(JPY) 100.1 105.5 +5.4
1EUR(JPY) 134.0 139.2 +5.2
Y/Y
(Billions of yen)

Corp. Value Award Summary Q1-Q3 Results Full-Year Forecast
17
FY2013 FY2014
Actual Forecast
IAB
Industrial Automation
EMC
Electronic & Mechanical Components
AEC
Automotive Electronic Components
SSB
Social Systems, Solutions & Service
HCB
Healthcare
Other 78.9 91.5 +15.9%
Eliminations & Corporate 6.1 5.0 -16.5%
Total 773.0 835.0 +8.0%
+12.0%89.3
321.0
101.5
131.5
84.5
100.0
Y/Y
291.7
97.7
126.6
82.7
+10.0%
+3.9%
+3.9%
+2.2%
Ref. Full-Year Sales Forecast by Segment
(Billions of yen)

Corp. Value Award Summary Q1-Q3 Results Full-Year Forecast
18
Ref. Full-Year Operating Income Forecast by Segment
FY2013 FY2014
Actual Forecast
IAB 38.8 50.0 +11.2
Industrial Automation (13.3%) (15.6%) (+2.3%pt)
EMC 8.7 9.2 +0.5
Electronic & Mechanical Components (8.9%) (9.1%) (+0.2%pt)
AEC 9.1 8.9 -0.2
Automotive Electronic Components (7.2%) (6.8%) (-0.4%pt)
SSB 5.6 6.2 +0.6
Social Systems, Solutions & Service (6.7%) (7.3%) (+0.6%pt)
HCB 7.5 7.2 -0.3
Healthcare (8.5%) (7.2%) (-1.3%pt)
8.7 10.5 +1.8
(11.0%) (11.5%) (+0.5%pt)
Eliminations & Corporate -10.3 -8.0 +2.3
68.1 84.0 +15.9
(8.8%) (10.1%) (+1.3%pt)
Y/Y
Other
Total
(Billions of yen)

Corp. Value Award Summary Q1-Q3 Results Full-Year Forecast
19
FY2013 FY2014
Actual Forecast
ROE 11.6% -
39.6%
10.1%
>13%
>13%
+1.2%pt
up \75.6EPS \209.8 \285.4
38.5%
8.8%
11.3%
GP Margin
OP Margin
ROIC
Y/Y
+1.3%pt
-
Ref. Management Targets

20
Corporate Value Improvement Award

Summary Q1-Q3 Results Full-Year Forecast Corp. Value Award
21
Omron won the "TSE 2014 Corporate Value Improvement
Award" Grand Prix.
Corporate Value Improvement Award
Summary Q1-Q3 Results Full-Year Forecast Corp. Value Award
22
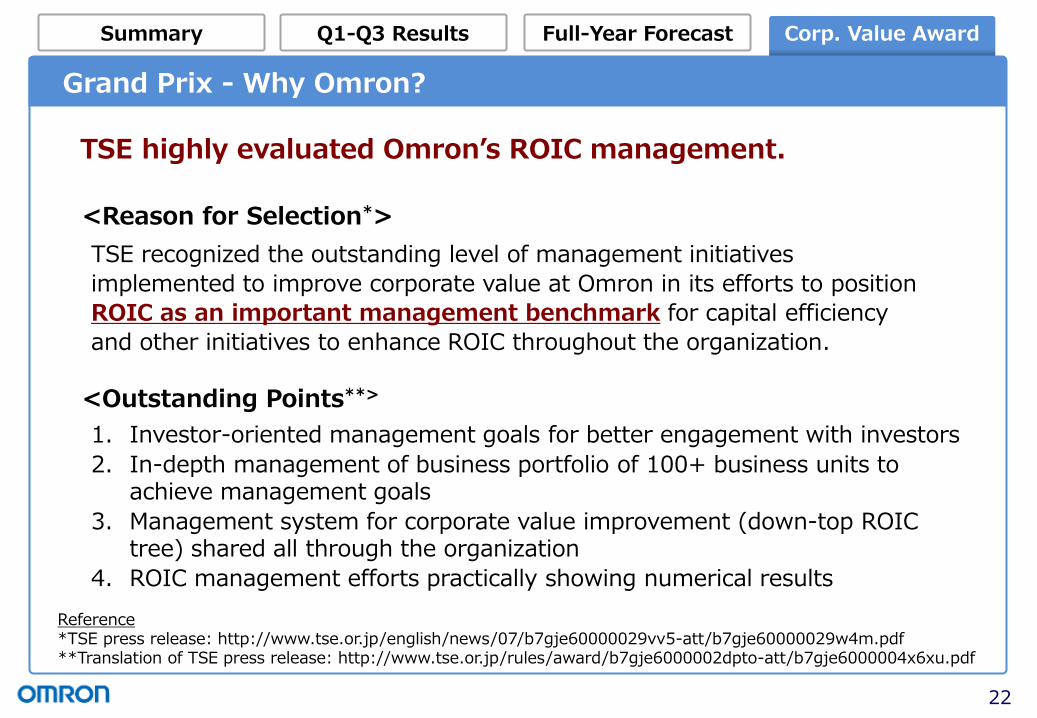
Reference *TSE press release: http://www.tse.or.jp/english/news/07/b7gje60000029vv5-att/b7gje60000029w4m.pdf **Translation of TSE press release: http://www.tse.or.jp/rules/award/b7gje6000002dpto-att/b7gje6000004x6xu.pdf
Grand Prix - Why Omron?
TSE highly evaluated Omron’s ROIC management.
<Reason for Selection*>
TSE recognized the outstanding level of management initiatives
implemented to improve corporate value at Omron in its efforts to position
ROIC as an important management benchmark for capital efficiency
and other initiatives to enhance ROIC throughout the organization.
<Outstanding Points**>
1. Investor-oriented management goals for better engagement with investors
2. In-depth management of business portfolio of 100+ business units to achieve management goals
3. Management system for corporate value improvement (down-top ROIC tree) shared all through the organization
4. ROIC management efforts practically showing numerical results

23

24
References

25
No changes to the initially set conditions.
Raw material costs
• Silver = ¥72,000/kg
• Copper = ¥760/kg
Price change impact (full-year, approx.)
Exchange rates
• 1 USD = ¥100
• 1 EUR = ¥135
¥1 fluctuation impact (full-year, approx.)
Sales OP
USD ¥3.1bn ¥0.4bn
EUR ¥0.8bn ¥0.4bn
Price change OP
Silver ¥1,000/kg ¥0.1bn
Copper ¥10/kg ¥0.1bn
Q4 Conditions
Conditions: Exchange Rates & Raw Material Costs

26
ROIC Definition
ROIC =
Net income attributable to shareholders
Invested capital
<Consol. B/S>
Invested capital*
= Net assets + Interest-bearing debt
*FY13 year-end & FY14 Q1-Q4 (quarterly results & forecast) average.
Capital cost forecast at 6%
for EARTH-1 STAGE (FY14-16)

27
ROIC Management: Down-Top ROIC Tree
On-site
To-Dos
Cycle
Fixed assets turnover
GP Margin
SG&A % R&D %
• Sales in focus industries/areas
• Sales of new/focus products
• Selling price control
• Variable costs reduction, value/%
• Defect costs %
Fixed manuf. costs %
Drivers KPI
• Per-head production #
• Automation % (headcount reduction)
• Inventory turnover months
• Slow-moving inv. months
• Credits & debts months
• Facilities turnover (1/N automation ratio)
ROIC
Added -value %
• Labor costs–sales %
Working capital turnover
ROS
Invested Capital
Turnover

28
Contact:
Investor Relations Department Investor Relations Headquarters
Omron Corporation
Phone: +81-(0)3-6718-3421
Email: [email protected] Website: www.omron.com
*To subscribe to Omron IR email newsletters:
Send us an email titled "subscribe".
Notes
1. The consolidated statements of Omron Corporation (the Company) are prepared in accordance with U.S. GAAP.
2. Projected results and future developments are based on information available to the Company at the current time,
as well as certain assumptions judged by the Company to be reasonable. Various factors could cause actual results
to differ materially from these projections. Major factors influencing Omron's actual results include, but are not
limited to,
(i) economic conditions affecting the Company's businesses in Japan and overseas
(ii) demand trends for the Company's products and services
(iii) the ability of the Company to develop new technologies and products
(iv) major changes in the fundraising environment
(v) tie-ups or cooperative relationships with other companies
(vi) movements in currency exchange rates and stock markets, and
(vii) accidents and natural disasters.
3. The presentation slides are based on “Summary of Consolidated Financial Results for the Third Quarter of the Fiscal
Year Ending March 31, 2015”. Figures rounded to the nearest JPY million and percentage to one decimal place.
Recommended