Property of interest Core data Log data
Porosity Crushed dry rock He porosimetry
Density (mostly)
TOC LECO or RockEval GR, density, resistivity
Water saturation As-received retort or Dean-Stark
Resistivity + kerogen corrected porosity
Mineralogy XRD, FTIR, XRF Density, neutron, Pe, ECS-type logs
Permeability Pulse decay on crushed rock
This is tough…………
Geomechanics Static moduli DTC, DTS, RHOB, & synthetic substitutes
Geochemistry Ro, S1-S2-S3, etc. Resistivity (sort of…)
Porosity first › How much storage volume is there for free
gas (or oil)? Saturation next
› Can we estimate Sw in shales? Then Permeability
› Is there sufficient permeability to flow gas, or better yet oil?
GIP & oil-in-place last

Simplified Rock
Clastic Rock
Clastic Components
Porosity Effective porosity, Phie
Total porosity, Phit
Bulk volume water
solid matrix
porosity
non-
mov
eabl
e fl
uids
non-
mov
. fl
uids
moveable fluids
grains
porosity
wate
r
resi
dual
H
C hydrocarbons mud
, silt
dry
clay
OH-
wate
r
water
matrix quartz, feldspar, etc. cl
ay-
boun
d
resi
dual
H
C hydrocarbons clay& OH-
capi
llary
-bou
nd
free water
Bulk volume hydrocarbon
Solidity, 1 - Phit
Grain volume
Organic Shale Components
Organic Shale mineral matrix
kero
gen
wate
r
dry
clay
OH-
clay
- bo
und clay &
OH-
gas, oil
wate
r
gas, oil
porosity
Free
wat
er
quartz, carbonate, pyrite, etc.
kero
gen
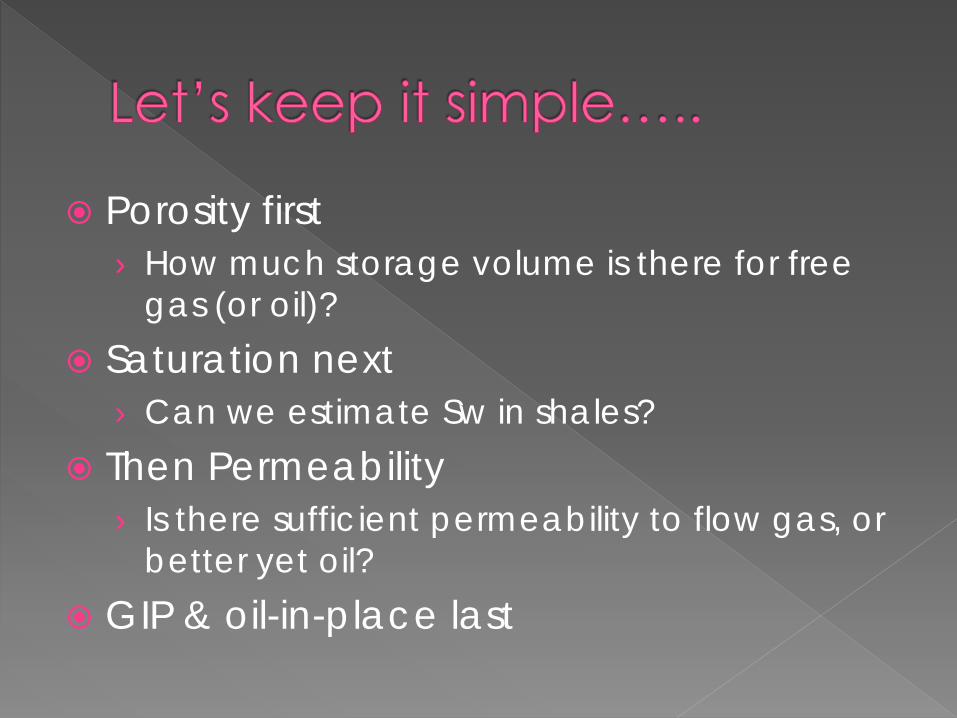
In organic shales, TOC “looks like” porosity to a density log
Density of organic matter is close to that of water or oil › Ranges from 0.9 to 1.4 g/c3 in our
experience › Common “default” value is 1.3 or 1.35 g/c3
Consequence: density porosity is too high and needs to be corrected down

Estimate from GR or density log Estimate from deltaLogR (sonic-resistivity
overlay method) Run a specialty log to get a kerogen-free
grain density, and compare to total grain density from density-neutron log
Get it from cores


TOC (v/v) = (ρgray sh – ρb) / 1.378 (1979 eqn) TOC (v/v) = (GRgray sh – GR)/(1.378 * A) (1981 eqn) TOC (v/v) = WTOC * RHOb/RHOTOC

0
2
4
6
8
10
12
14
16
18
2.0 2.1 2.2 2.3 2.4 2.5 2.6 2.7 2.8 2.9
Bulk density (g/cm3)
tota
l org
anic
car
bon
(wt %
)
New Albany Shale, Illinois basin EGSP cores (1976-1979), all big blue logs
Published Schmoker relation


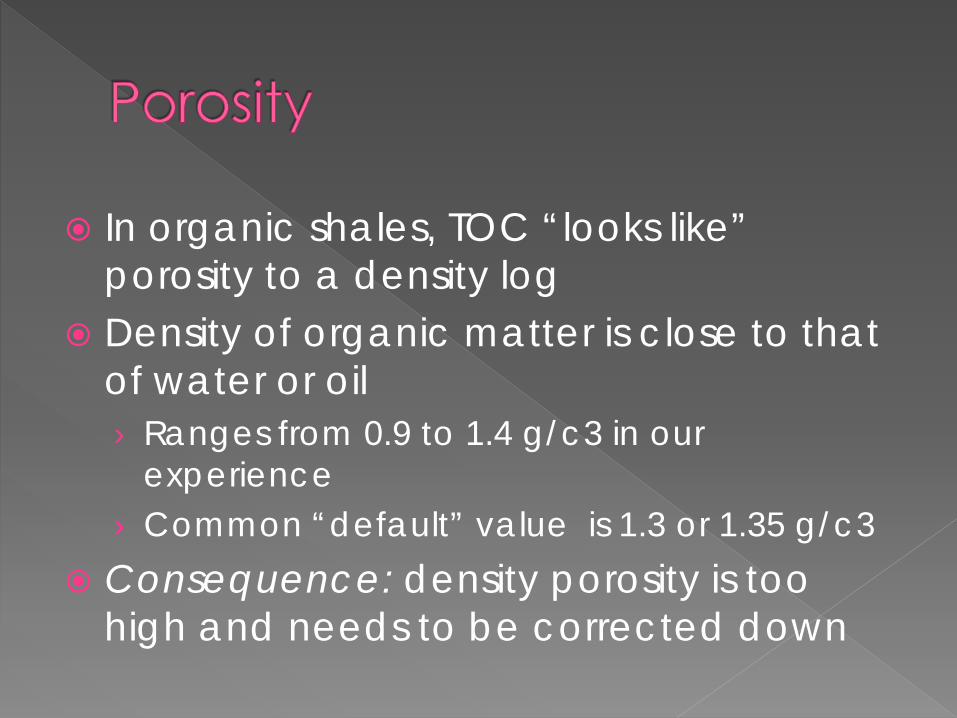
Basically a sonic F overlay Two universal eqn’s published by Passey
et al. (1990, AAPG Bull) › ∆logR = log10 (R/Rbl) + 0.02 (∆T-∆Tbl) This defines deltaLogR
› TOC = ∆logR * 10^(2.297 – 0.1688 LOM) This relates deltaLogR to TOC (wt%)
Most of us are concerned about the LOM parameter, but the second two constants were empirically determined
Passey et al, 2010, SPE 131350

TOC (wt %) = ∆logR * 10^(2.297 – 0.1688*LOM) Passey et al, 1990, AAPG 74 (12) 1777-1794

Deterministic suite of regression eqn’s to compute mineral volumes and kerogen-free grain density
RhoMecs = a + b Si + c (Ca,Na) + d (Fe,Al )+ e S

Not as simple as standard density porosity determination
We need TWO grain densities, › Density of the inorganic mineral matrix › Density of the organic fraction (a.k.a.
kerogen density or TOC density) And, we need to estimate the fluid
density in the flushed zone (where the density log makes its measurement)

(1 * / )ma b TOC TOC ma TOCT
ma fl
W Wρ ρ ρ ρφρ ρ
− − +=
−
Sondergeld et al, 2010, SPE 131768
(1 ) (1 )b hc T wT w T wT ma T TOC TOC TOCS S V Vρ ρ φ ρ φ ρ φ ρ= − + + − − +
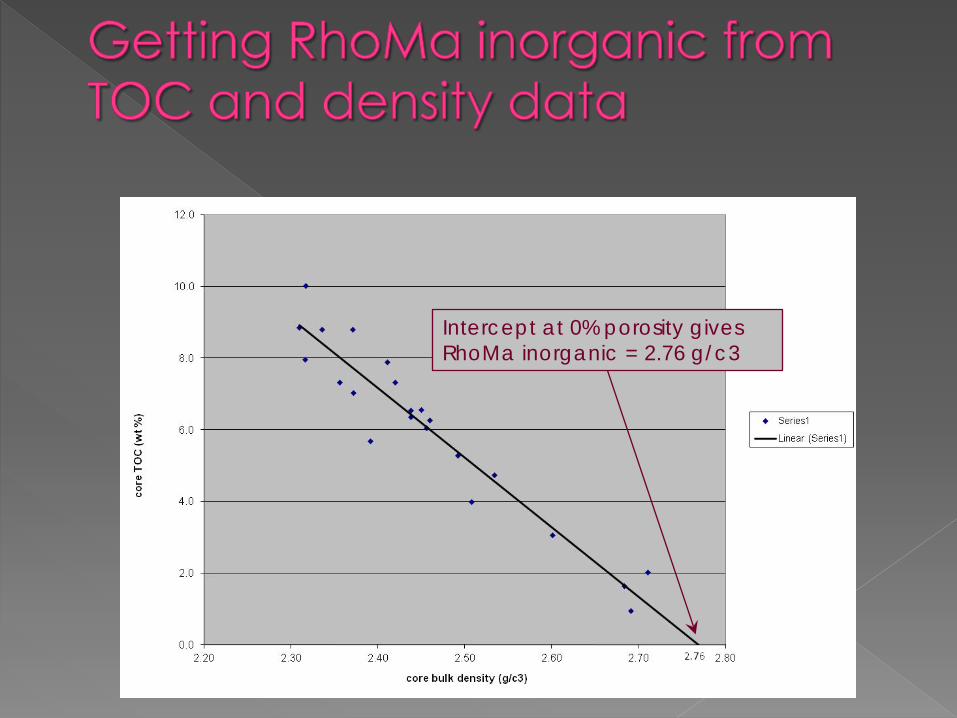
Intercept at 0% porosity gives RhoMa inorganic = 2.76 g/c3

New Albany example
Use core measured porosity, RhoB, and Wtoc to solve for RhoTOC › RhoFl requires assumption about gas
saturation and gas density at in-situ conditions
(12.722.72
*2.72 / )TOC TOC TOCbT
fl
W Wρφρ
ρ−=
+−
−


Full solution for porosity
(1 * / )m b TOC TOC m TOCT
m fl
W Wρ ρ ρ ρφρ ρ
− − +=
−
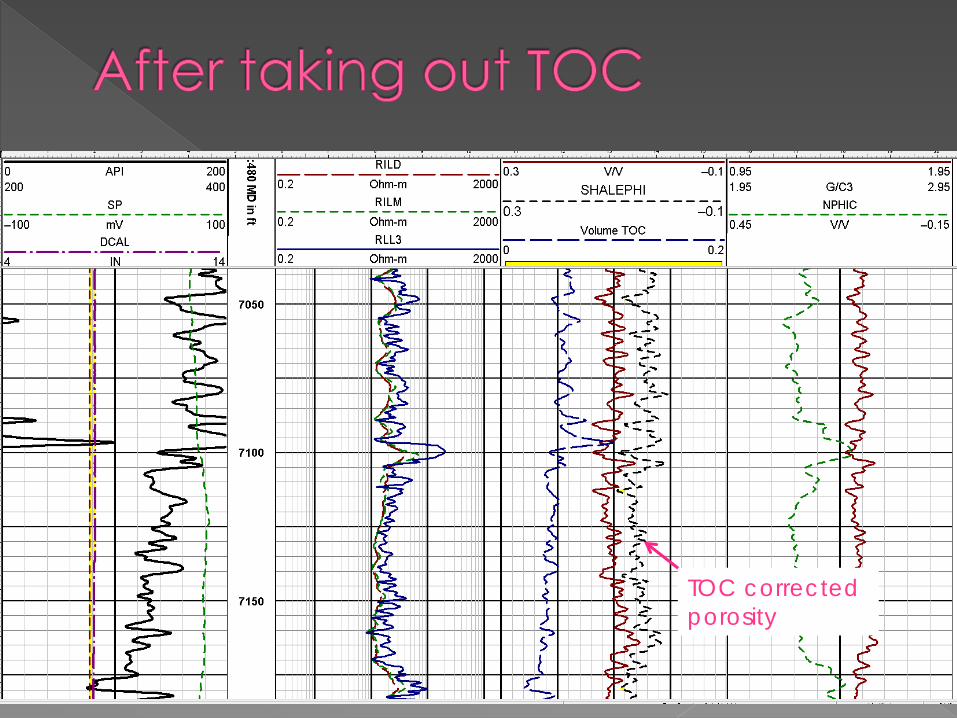
TOC corrected porosity

Convert Wtoc to volume of TOC using an assumed RhoTOC
Subtract Vtoc from density porosity to get a rough kerogen-corrected shale porosity
/ *toc toc toc bV W ρ ρ κ=


Most of us compute saturation from the conventional “Archie” approach › Requires total porosity, resistivity, Rw, m, n › We will probably NEVER be able to measure
m and n › We have no assurance these rocks act like
“Archie” or shaly sand systems

Calibrate a log model to as-received core saturations › Best data we have for in-situ Sw › Rw in shale is a guess › Usually assume an m and n, often 2 or
sometimes less Remarkably, we can usually fit the core
data without doing anything too stupid…….
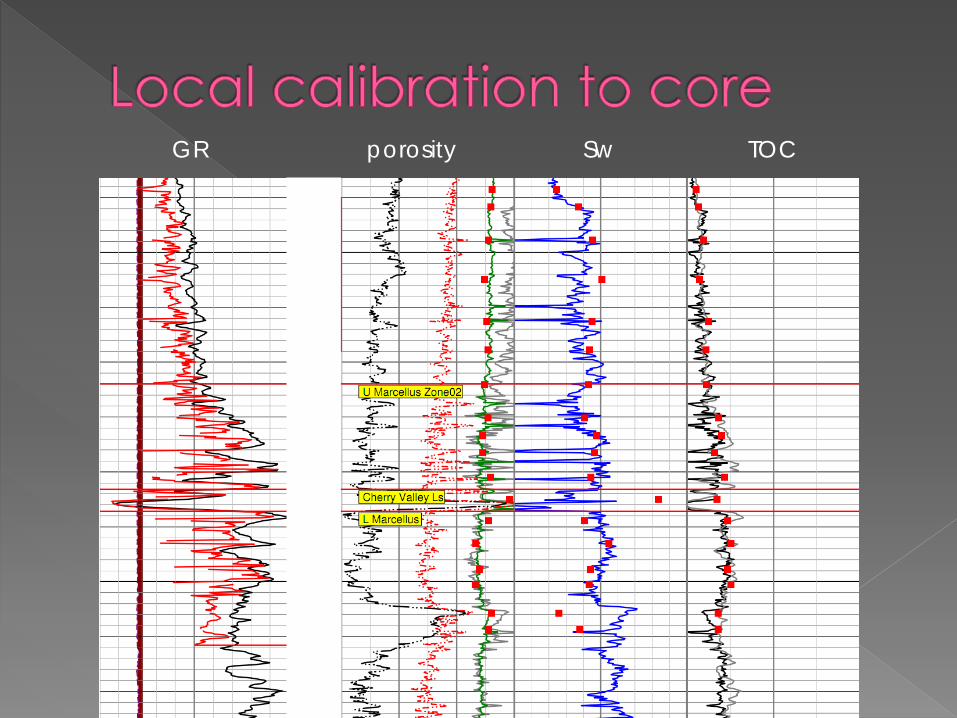
GR porosity Sw TOC

Perm is a can of worms We are not very confident we can
measure shale perms in core, but it’s the best we have for now
Log models for perm are weak at best › Most use phi-K correlation based on core

D&A – clean dry hole No gas or oil flowed back after frac, 45% of load recovered, well dead (0 psi TP). Swabbed small blows of gas over 12 days.


Two components › Free gas or compression gas › Adsorbed gas
There is also some absorbed gas dissolved in kerogen or bitumen, but the way we calibrate the adsorption model this is inside the other number

Need to know porosity, saturation, & h: where C is a units constant, A is area, f is porosity, h is
thickness, Sw is water saturation, & Bg is the formation volume factor
High pressure, high porosity, high Sg, and large A greater GIP
* *(1 ) /w gGIP C A h S Bφ= −

Adsorption is a surface phenomena Characterized by adsorption isotherms:
Where Gc is the adsorbed gas content (scf/ton) VL is the Langmuir volume (scf/ton) PL is the Langmuir pressure (psia) Where Gab is the adsorbed gas-in-place (scf), A is area in acres,
h is thickness in ft, ρb is bulk density, and Gc is the average adsorbed gas content in scf/ton
* / ( )L LGc V P P P= +
1359.7* bGab Ah Gcρ=

Barnett Shale example
0
20
40
60
80
100
120
140
160
0 200 400 600 800 1000 1200 1400 1600 1800Pressure (psi)
0
50
100
150
200
250
0 2 4 6 8 10 12 14 16 18
Total organic carbon (%)
TOC 15.50 13.70 12.64 10.44 8.80 8.21 7.25 3.55
Gas
con
tent
(scf
/ton
)
Lang
mui
r vol
ume
(scf
/ton
)

Kerogen is highly adsorptive Wet clays are minimally adsorptive Quartz, calcite, dolomite: adsorption is nil

Compute free gas Compute adsorbed gas Correct for volume of free gas occupied
by adsorbed gas (SPE 131772) Add ‘em up NGL’s and condensate are calculated
from the GOR

Assume a vertical well tests 10 ft of a low porosity zone at 2 BOPD.
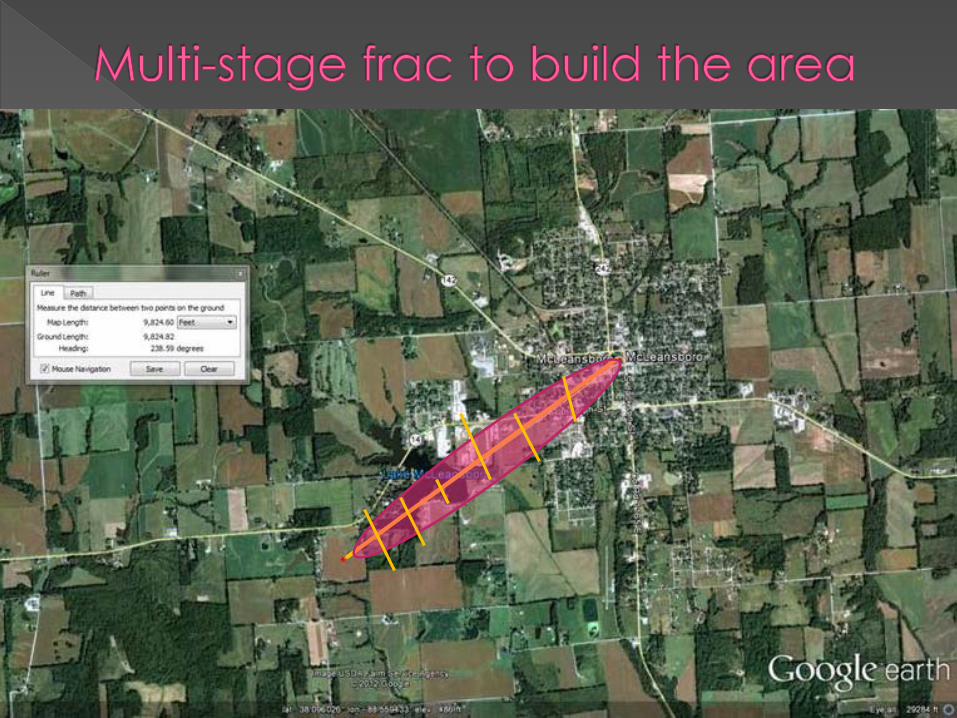
We’ll go horizontal in that zone and drill 5,000 to 10,000 ft laterally
Kh scales with contacted interval, so we expect 500 – 1000X the flow capacity
Real world = not that good. Not all of the lateral contributes equally.


You can calculate porosity and saturations in shales; they make sense and match core data
The apparent density porosity is too high in the presence of TOC
Don’t try to just “eyeball” it, there are too many moving parts › Log analysis on the hood of a Chevy does
not work well in shales

Questions??
Recommended