Metal Casting Industry Sector Notebook Project
EPA/310-R-97-004
EPA Office of Compliance Sector Notebook Project:
Profile of the Metal Casting Industry
February 1998
Office of ComplianceOffice of Enforcement and Compliance Assurance
U.S. Environmental Protection Agency401 M St., SW (MC 2221-A)
Washington, DC 20460

Metal Casting Industry Sector Notebook Project
Sector Notebook Project September 1997ii
This report is one in a series of volumes published by the U.S. Environmental Protection Agency(EPA) to provide information of general interest regarding environmental issues associated withspecific industrial sectors. The documents were developed under contract by Abt Associates(Cambridge, MA), Science Applications International Corporation (McLean, VA), and Booz-Allen & Hamilton, Inc. (McLean, VA). This publication may be purchased from theSuperintendent of Documents, U.S. Government Printing Office. A listing of available SectorNotebooks and document numbers is included at the end of this document.
All telephone orders should be directed to:
Superintendent of DocumentsU.S. Government Printing OfficeWashington, DC 20402(202) 512-1800FAX (202) 512-22508:00 a.m. to 4:30 p.m., EST, M-F
Using the form provided at the end of this document, all mail orders should be directed to:
U.S. Government Printing OfficeP.O. Box 371954Pittsburgh, PA 15250-7954
Complimentary volumes are available to certain groups or subscribers, such as public andacademic libraries, Federal, State, and local governments, and the media from EPA’s NationalCenter for Environmental Publications and Information at (800) 490-9198. For furtherinformation, and for answers to questions pertaining to these documents, please refer to thecontact names and numbers provided within this volume.
Electronic versions of all Sector Notebooks are available via Internet on the Enviro$en$e WorldWide Web. Downloading procedures are described in Appendix A of this document.
Cover photograph courtesy of American Foundrymen’s Society, Inc., Des Plaines, Illinois.

Metal Casting Industry Sector Notebook Project
Sector Notebook Project September 1997iii
Sector Notebook Contacts
The Sector Notebooks were developed by the EPA’s Office of Compliance. Questions relating tothe Sector Notebook Project can be directed to:
Seth Heminway, Coordinator, Sector Notebook ProjectUS EPA Office of Compliance401 M St., SW (2223-A)Washington, DC 20460(202) 564-7017
Questions and comments regarding the individual documents can be directed to the appropriatespecialists listed below.
Document Number Industry Contact Phone (202)
EPA/310-R-95-001. Dry Cleaning Industry Joyce Chandler 564-7073EPA/310-R-95-002. Electronics and Computer Industry Steve Hoover 564-7007EPA/310-R-95-003. Wood Furniture and Fixtures Industry Bob Marshall 564-7021EPA/310-R-95-004. Inorganic Chemical Industry Walter DeRieux 564-7067EPA/310-R-95-005. Iron and Steel Industry Maria Malave 564-7027EPA/310-R-95-006. Lumber and Wood Products Industry Seth Heminway 564-7017EPA/310-R-95-007. Fabricated Metal Products Industry Scott Throwe 564-7013EPA/310-R-95-008. Metal Mining Industry Jane Engert 564-5021EPA/310-R-95-009. Motor Vehicle Assembly Industry Anthony Raia 564-6045EPA/310-R-95-010. Nonferrous Metals Industry Jane Engert 564-5021EPA/310-R-95-011. Non-Fuel, Non-Metal Mining Industry Robert Lischinsky 564-2628EPA/310-R-95-012. Organic Chemical Industry Walter DeRieux 564-7067EPA/310-R-95-013. Petroleum Refining Industry Tom Ripp 564-7003EPA/310-R-95-014. Printing Industry Ginger Gotliffe 564-7072EPA/310-R-95-015. Pulp and Paper Industry Maria Eisemann 564-7016EPA/310-R-95-016. Rubber and Plastic Industry Maria Malave 564-7027EPA/310-R-95-017. Stone, Clay, Glass, and Concrete Industry Scott Throwe 564-7013EPA/310-R-95-018. Transportation Equipment Cleaning Ind. Virginia Lathrop 564-7057
EPA/310-R-97-001. Air Transportation Industry Virginia Lathrop 564-7057EPA/310-R-97-002. Ground Transportation Industry Virginia Lathrop 564-7057EPA/310-R-97-003. Water Transportation Industry Virginia Lathrop 564-7057EPA/310-R-97-004. Metal Casting Industry Jane Engert 564-5021EPA/310-R-97-005. Pharmaceuticals Industry Emily Chow 564-7071EPA/310-R-97-006. Plastic Resin and Manmade Fiber Ind. Sally Sasnett 564-7074EPA/310-R-97-007. Fossil Fuel Electric Power Generation Ind. Rafael Sanchez 564-7028EPA/310-R-97-008. Shipbuilding and Repair Industry Anthony Raia 564-6045EPA/310-R-97-009. Textile Industry Belinda Breidenbach 564-7022EPA/310-R-97-010. Sector Notebook Data Refresh, 1997 Seth Heminway 564-7017

Page iv intentionally left blank.

Metal Casting Industry Sector Notebook Project
Sector Notebook Project September 1997v
TABLE OF CONTENTS
LIST OF FIGURES . . . . . . . . . . . . . . . . . . . . . . . . . . . . . . . . . . . . . . . . . . . . . . . . . . . . . . . . . vii
LIST OF TABLES . . . . . . . . . . . . . . . . . . . . . . . . . . . . . . . . . . . . . . . . . . . . . . . . . . . . . . . . . vii
LIST OF ACRONYMS . . . . . . . . . . . . . . . . . . . . . . . . . . . . . . . . . . . . . . . . . . . . . . . . . . . . . viii
I. INTRODUCTION TO THE SECTOR NOTEBOOK PROJECT . . . . . . . . . . . . . . . . . . . . . 1A. Summary of the Sector Notebook Project . . . . . . . . . . . . . . . . . . . . . . . . . . . . . . . . 1B. Additional Information . . . . . . . . . . . . . . . . . . . . . . . . . . . . . . . . . . . . . . . . . . . . . . . 2
II. INTRODUCTION TO THE METAL CASTING INDUSTRY . . . . . . . . . . . . . . . . . . . . . . 3A. Introduction, Background, and Scope of the Notebook . . . . . . . . . . . . . . . . . . . . . . 3B. Characterization of the Metal Casting Industry . . . . . . . . . . . . . . . . . . . . . . . . . . . . . 3
1. Product Characterization . . . . . . . . . . . . . . . . . . . . . . . . . . . . . . . . . . . . . . . . 42. Industry Size and Geographic Distribution . . . . . . . . . . . . . . . . . . . . . . . . . . . 73. Economic Trends . . . . . . . . . . . . . . . . . . . . . . . . . . . . . . . . . . . . . . . . . . . . . 10
III. INDUSTRIAL PROCESS DESCRIPTION . . . . . . . . . . . . . . . . . . . . . . . . . . . . . . . . . . . 13A. Industrial Processes in the Metal Casting Industry . . . . . . . . . . . . . . . . . . . . . . . . . 13
1. Pattern Making . . . . . . . . . . . . . . . . . . . . . . . . . . . . . . . . . . . . . . . . . . . . . . 142. Mold and Core Preparation and Pouring . . . . . . . . . . . . . . . . . . . . . . . . . . . 153. Furnace Charge Preparation and Metal Melting . . . . . . . . . . . . . . . . . . . . . . 294. Shakeout, Cooling and Sand Handling . . . . . . . . . . . . . . . . . . . . . . . . . . . . . 335. Quenching, Finishing, Cleaning and Coating . . . . . . . . . . . . . . . . . . . . . . . . 346. Die Casting . . . . . . . . . . . . . . . . . . . . . . . . . . . . . . . . . . . . . . . . . . . . . . . . . 35
B. Raw Materials Inputs and Pollution Outputs . . . . . . . . . . . . . . . . . . . . . . . . . . . . . . 391. Foundries . . . . . . . . . . . . . . . . . . . . . . . . . . . . . . . . . . . . . . . . . . . . . . . . . . 392. Die Casters . . . . . . . . . . . . . . . . . . . . . . . . . . . . . . . . . . . . . . . . . . . . . . . . . 43
C. Management of Chemicals in Wastestream . . . . . . . . . . . . . . . . . . . . . . . . . . . . . . . 47
IV. CHEMICAL RELEASE AND TRANSFER PROFILE . . . . . . . . . . . . . . . . . . . . . . . . . . 51A. EPA Toxic Release Inventory for the Metal Casting Industry . . . . . . . . . . . . . . . . . 55
1. Toxic Release Inventory for Ferrous and Nonferrous Foundries . . . . . . . . . . 552. Toxic Release Inventory for Die Casting Facilities . . . . . . . . . . . . . . . . . . . . 61
B. Summary of Selected Chemicals Released . . . . . . . . . . . . . . . . . . . . . . . . . . . . . . . . 66C. Other Data Sources . . . . . . . . . . . . . . . . . . . . . . . . . . . . . . . . . . . . . . . . . . . . . . . . 72D. Comparison of Toxic Release Inventory Between Selected Industries . . . . . . . . . . . 74

Metal Casting Industry Sector Notebook Project
Sector Notebook Project September 1997vi
V. POLLUTION PREVENTION OPPORTUNITIES . . . . . . . . . . . . . . . . . . . . . . . . . . . . . . 77A. Waste Sand and Chemical Binder Reduction and Reuse . . . . . . . . . . . . . . . . . . . . . 77
1. Casting Techniques Reducing Waste Foundry Sand Generation . . . . . . . . . . 782. Reclamation and Reuse of Waste Foundry Sand and Metal . . . . . . . . . . . . . 79
B. Metal Melting Furnaces . . . . . . . . . . . . . . . . . . . . . . . . . . . . . . . . . . . . . . . . . . . . . 84C. Furnace Dust Management . . . . . . . . . . . . . . . . . . . . . . . . . . . . . . . . . . . . . . . . . . . 87D. Slag and Dross Management . . . . . . . . . . . . . . . . . . . . . . . . . . . . . . . . . . . . . . . . . 89E. Wastewater . . . . . . . . . . . . . . . . . . . . . . . . . . . . . . . . . . . . . . . . . . . . . . . . . . . . . . 91F. Die Casting Lubrication . . . . . . . . . . . . . . . . . . . . . . . . . . . . . . . . . . . . . . . . . . . . . 92G. Miscellaneous Residual Wastes . . . . . . . . . . . . . . . . . . . . . . . . . . . . . . . . . . . . . . . . 92
VI. SUMMARY OF FEDERAL STATUTES AND REGULATIONS . . . . . . . . . . . . . . . . . . 95A. General Description of Major Statutes . . . . . . . . . . . . . . . . . . . . . . . . . . . . . . . . . . 95B. Industry Specific Requirements . . . . . . . . . . . . . . . . . . . . . . . . . . . . . . . . . . . . . . . 107C. Pending and Proposed Regulatory Requirements . . . . . . . . . . . . . . . . . . . . . . . . . 111
VII. COMPLIANCE AND ENFORCEMENT HISTORY . . . . . . . . . . . . . . . . . . . . . . . . . . 113A. Metal Casting Industry Compliance History . . . . . . . . . . . . . . . . . . . . . . . . . . . . . 117B. Comparison of Enforcement Activity Between Selected Industries . . . . . . . . . . . . 119C. Review of Major Legal Actions . . . . . . . . . . . . . . . . . . . . . . . . . . . . . . . . . . . . . . 124
1. Review of Major Cases . . . . . . . . . . . . . . . . . . . . . . . . . . . . . . . . . . . . . . . . 1242. Supplementary Environmental Projects (SEPs) . . . . . . . . . . . . . . . . . . . . . . 126
VIII. COMPLIANCE ASSURANCE ACTIVITIES AND INITIATIVES . . . . . . . . . . . . . . 127A. Sector-related Environmental Programs and Activities . . . . . . . . . . . . . . . . . . . . . . 127
1. Federal Activities . . . . . . . . . . . . . . . . . . . . . . . . . . . . . . . . . . . . . . . . . . . . 1272. State Activities . . . . . . . . . . . . . . . . . . . . . . . . . . . . . . . . . . . . . . . . . . . . . 129
B. EPA Voluntary Programs . . . . . . . . . . . . . . . . . . . . . . . . . . . . . . . . . . . . . . . . . . . 131C. Trade Association/Industry Sponsored Activity . . . . . . . . . . . . . . . . . . . . . . . . . . 138
1. Industry Research Programs . . . . . . . . . . . . . . . . . . . . . . . . . . . . . . . . . . . 1382. Trade Associations . . . . . . . . . . . . . . . . . . . . . . . . . . . . . . . . . . . . . . . . . . 140
IX. CONTACTS/ACKNOWLEDGMENTS/RESOURCE MATERIALS . . . . . . . . . . . . . . . 143
Appendix A: Instructions for downloading this notebook . . . . . . . . . . . . . . . . . . . . . . . . . . . . A-1
Metal Casting Industry Sector Notebook Project
Sector Notebook Project September 1997vii
LIST OF FIGURES
Figure 1: Uses of Cast Metal Products . . . . . . . . . . . . . . . . . . . . . . . . . . . . . . . . . . . . . . . . . . . . 4Figure 2: Types of Metals Cast . . . . . . . . . . . . . . . . . . . . . . . . . . . . . . . . . . . . . . . . . . . . . . . . . 5Figure 3: Geographic Distribution of Metal Casting Establishments . . . . . . . . . . . . . . . . . . . . . . 9Figure 4: Sand Mold and Core Cross Section . . . . . . . . . . . . . . . . . . . . . . . . . . . . . . . . . . . . . . 17Figure 5: Process Flow and Potential Pollutant Outputs for Typical Green Sand Foundry . . . . . 19Figure 6: Investment Flask and Shell Casting . . . . . . . . . . . . . . . . . . . . . . . . . . . . . . . . . . . . . . 26Figure 7: Lost Foam Casting Cross Sections . . . . . . . . . . . . . . . . . . . . . . . . . . . . . . . . . . . . . . 28Figure 8: Sectional Views of Melting Furnaces . . . . . . . . . . . . . . . . . . . . . . . . . . . . . . . . . . . . 32Figure 9: Cold (a), and Hot Chamber (b), Die Casting Machines . . . . . . . . . . . . . . . . . . . . . . . 36Figure 10: Summary of TRI Releases and Transfers by Industry . . . . . . . . . . . . . . . . . . . . . . . . 75
LIST OF TABLES
Table 1: Facility Size Distribution for the Metal Casting Industry . . . . . . . . . . . . . . . . . . . . . . . . 8Table 2: Top U.S. Metal Casting Companies . . . . . . . . . . . . . . . . . . . . . . . . . . . . . . . . . . . . . . 10Table 3: Comparison of Several Casting Methods . . . . . . . . . . . . . . . . . . . . . . . . . . . . . . . . . . 15Table 4: Summary of Material Inputs and Potential Pollutant Outputs for the Metal Casting
Industry . . . . . . . . . . . . . . . . . . . . . . . . . . . . . . . . . . . . . . . . . . . . . . . . . . . . . . . . . . . . 45Table 5: Source Reduction and Recycling Activity for Foundries . . . . . . . . . . . . . . . . . . . . . . . 48Table 6: Source Reduction and Recycling Activity for Die Casting Facilities . . . . . . . . . . . . . . 49Table 7: 1995 TRI Releases for Foundries, by Number of Facilities Reporting . . . . . . . . . . . . . 57Table 8: 1995 TRI Transfers for Foundries, by Number and Facilities Reporting . . . . . . . . . . . 59Table 9: 1995 TRI Releases for Die Casting Facilities, by Number of Facilities Reporting . . . . 62Table 10: 1995 TRI Transfers for Die Casting Facilities, by Number and Facilities Reporting . . 63Table 11: Top 10 TRI Releasing Metal Casting Facilities . . . . . . . . . . . . . . . . . . . . . . . . . . . . . 64Table 12: Top 10 TRI Releasing Facilities Reporting Metal Casting SIC Codes . . . . . . . . . . . . 65Table 13: Air Pollutant Releases by Industry Sector (tons/year) . . . . . . . . . . . . . . . . . . . . . . . . 73Table 14: Toxics Release Inventory Data for Selected Industries . . . . . . . . . . . . . . . . . . . . . . . 76Table 15: Five-Year Enforcement and Compliance Summary for the Metal Casting Industry . 117Table 16: Five-Year Enforcement and Compliance Summary for Selected Industries . . . . . . . 120Table 17: One-Year Enforcement and Compliance Summary for Selected Industries . . . . . . . 121Table 18: Five-Year Inspection and Enforcement Summary by Statute for Selected Industries 122Table 19: One-Year Inspection and Enforcement Summary by Statute for Selected Industries 123Table 20: Metal Casting Industry Participation in the 33/50 Program . . . . . . . . . . . . . . . . . . . 132
Metal Casting Industry Sector Notebook Project
Sector Notebook Project September 1997viii
LIST OF ACRONYMS
AFS - AIRS Facility Subsystem (CAA database)AFS- American Foundrymen’s SocietyAIRS - Aerometric Information Retrieval System (CAA database)BIFs - Boilers and Industrial Furnaces (RCRA)BOD - Biochemical Oxygen Demand CAA - Clean Air ActCAAA - Clean Air Act Amendments of 1990CERCLA - Comprehensive Environmental Response, Compensation and Liability ActCERCLIS - CERCLA Information SystemCFCs - ChlorofluorocarbonsCO - Carbon Monoxide COD - Chemical Oxygen Demand CSI - Common Sense Initiative CWA - Clean Water ActD&B - Dun and Bradstreet Marketing IndexELP - Environmental Leadership Program EPA - United States Environmental Protection AgencyEPCRA - Emergency Planning and Community Right-to-Know Act FIFRA - Federal Insecticide, Fungicide, and Rodenticide ActFINDS - Facility Indexing SystemHAPs - Hazardous Air Pollutants (CAA)HSDB - Hazardous Substances Data Bank IDEA - Integrated Data for Enforcement AnalysisLDR - Land Disposal Restrictions (RCRA)LEPCs - Local Emergency Planning Committees MACT - Maximum Achievable Control Technology (CAA)MCLGs - Maximum Contaminant Level Goals MCLs - Maximum Contaminant Levels MEK - Methyl Ethyl KetoneMSDSs - Material Safety Data Sheets NAAQS - National Ambient Air Quality Standards (CAA)NAFTA - North American Free Trade Agreement NCDB - National Compliance Database (for TSCA, FIFRA, EPCRA)NCP - National Oil and Hazardous Substances Pollution Contingency Plan NEIC - National Enforcement Investigation Center NESHAP - National Emission Standards for Hazardous Air PollutantsNO - Nitrogen Dioxide2
NOV - Notice of Violation NO - Nitrogen Oxide X
NPDES - National Pollution Discharge Elimination System (CWA)NPL - National Priorities List NRC - National Response Center NSPS - New Source Performance Standards (CAA)
Metal Casting Industry Sector Notebook Project
Sector Notebook Project September 1997ix
OAR - Office of Air and RadiationOECA - Office of Enforcement and Compliance AssuranceOPA - Oil Pollution ActOPPTS - Office of Prevention, Pesticides, and Toxic SubstancesOSHA - Occupational Safety and Health Administration OSW - Office of Solid WasteOSWER - Office of Solid Waste and Emergency ResponseOW - Office of WaterP2 - Pollution PreventionPCS - Permit Compliance System (CWA Database)POTW - Publicly Owned Treatments Works RCRA - Resource Conservation and Recovery ActRCRIS - RCRA Information SystemSARA - Superfund Amendments and Reauthorization Act SDWA - Safe Drinking Water ActSEPs - Supplementary Environmental Projects SERCs - State Emergency Response Commissions SIC - Standard Industrial Classification SO - Sulfur Dioxide 2
SO - Sulfur OxidesX
TOC - Total Organic Carbon TRI - Toxic Release InventoryTRIS - Toxic Release Inventory System TCRIS - Toxic Chemical Release Inventory SystemTSCA - Toxic Substances Control ActTSS - Total Suspended Solids UIC - Underground Injection Control (SDWA)UST - Underground Storage Tanks (RCRA)VOCs - Volatile Organic Compounds

Metal Casting Industry Sector Notebook Project
Sector Notebook Project September 19971
METAL CASTING INDUSTRY(SIC 332 AND 336)
I. INTRODUCTION TO THE SECTOR NOTEBOOK PROJECT
I.A. Summary of the Sector Notebook Project
Integrated environmental policies based upon comprehensive analysis of air,water and land pollution are a logical supplement to traditional single-mediaapproaches to environmental protection. Environmental regulatory agenciesare beginning to embrace comprehensive, multi-statute solutions to facilitypermitting, enforcement and compliance assurance, education/ outreach,research, and regulatory development issues. The central concepts driving thenew policy direction are that pollutant releases to each environmental medium(air, water and land) affect each other, and that environmental strategies mustactively identify and address these inter-relationships by designing policies forthe "whole" facility. One way to achieve a whole facility focus is to designenvironmental policies for similar industrial facilities. By doing so,environmental concerns that are common to the manufacturing of similarproducts can be addressed in a comprehensive manner. Recognition of theneed to develop the industrial “sector-based” approach within the EPA Officeof Compliance led to the creation of this document.
The Sector Notebook Project was originally initiated by the Office ofCompliance within the Office of Enforcement and Compliance Assurance(OECA) to provide its staff and managers with summary information foreighteen specific industrial sectors. As other EPA offices, states, the regulatedcommunity, environmental groups, and the public became interested in thisproject, the scope of the original project was expanded to its current form.The ability to design comprehensive, common sense environmental protectionmeasures for specific industries is dependent on knowledge of several inter-related topics. For the purposes of this project, the key elements chosen forinclusion are: general industry information (economic and geographic); adescription of industrial processes; pollution outputs; pollution preventionopportunities; Federal statutory and regulatory framework; compliancehistory; and a description of partnerships that have been formed betweenregulatory agencies, the regulated community and the public.
For any given industry, each topic listed above could alone be the subject ofa lengthy volume. However, in order to produce a manageable document, thisproject focuses on providing summary information for each topic. Thisformat provides the reader with a synopsis of each issue, and references wheremore in-depth information is available. Text within each profile wasresearched from a variety of sources, and was usually condensed from moredetailed sources pertaining to specific topics. This approach allows for a widecoverage of activities that can be further explored based upon the citations

Metal Casting Industry Sector Notebook Project
Sector Notebook Project September 19972
and references listed at the end of this profile. As a check on the informationincluded, each notebook went through an external review process. The Officeof Compliance appreciates the efforts of all those that participated in thisprocess and enabled us to develop more complete, accurate and up-to-datesummaries. Many of those who reviewed this notebook are listed as contactsin Section IX and may be sources of additional information. The individualsand groups on this list do not necessarily concur with all statements within thisnotebook.
I.B. Additional Information
Providing Comments
OECA’s Office of Compliance plans to periodically review and update thenotebooks and will make these updates available both in hard copy andelectronically. If you have any comments on the existing notebook, or if youwould like to provide additional information, please send a hard copy andcomputer disk to the EPA Office of Compliance, Sector Notebook Project,401 M St., SW (2223-A), Washington, DC 20460. Comments can also beuploaded to the Enviro$en$e World Wide Web for general access to all usersof the system. Follow instructions in Appendix A for accessing this system.Once you have logged in, procedures for uploading text are available from theon-line Enviro$en$e Help System.
Adapting Notebooks to Particular Needs
The scope of the industry sector described in this notebook approximates thenational occurrence of facility types within the sector. In many instances,industries within specific geographic regions or states may have uniquecharacteristics that are not fully captured in these profiles. The Office ofCompliance encourages state and local environmental agencies and othergroups to supplement or re-package the information included in this notebookto include more specific industrial and regulatory information that may beavailable. Additionally, interested states may want to supplement the"Summary of Applicable Federal Statutes and Regulations" section with stateand local requirements. Compliance or technical assistance providers mayalso want to develop the "Pollution Prevention" section in more detail. Pleasecontact the appropriate specialist listed on the opening page of this notebookif your office is interested in assisting us in the further development of theinformation or policies addressed within this volume. If you are interested inassisting in the development of new notebooks for sectors not alreadycovered, please contact the Office of Compliance at 202-564-2395.
Metal Casting Industry Introduction
Sector Notebook Project September 19973
II. INTRODUCTION TO THE METAL CASTING INDUSTRY
This section provides background information on the size, geographicdistribution, employment, production, sales, and economic condition of themetal casting industry. Facilities described within this document aredescribed in terms of their Standard Industrial Classification (SIC) codes.
II.A. Introduction, Background, and Scope of the Notebook
The metal casting industry makes parts from molten metal according to anend-user’s specifications. Facilities are typically categorized as casting eitherferrous or nonferrous products. The metal casting industry described in thisnotebook is categorized by the Office of Management and Budget (OMB)under Standard Industrial Classification (SIC) codes 332 Iron and SteelFoundries and 336 Nonferrous Foundries (Castings). The die casting industryis contained within the SIC 336 category since die casting establishmentsprimarily cast nonferrous metals. OMB is in the process of changing the SICcode system to a system based on similar production processes called theNorth American Industrial Classification System (NAICS). (In the NAICsystem, iron and steel foundries, nonferrous foundries, and die casters are allclassified as NAIC 3315.)
Although both foundries and die casters are included in this notebook, thereare significant differences in the industrial processes, products, facility size andenvironmental impacts between die casters and foundries. Die castingoperations, therefore, are often considered separately throughout thisnotebook.
In addition to metal casting, some foundries and die casters carry out furtheroperations on their cast parts that are not the primary focus of this notebook.Examples include heat treating (e.g. annealing), case hardening, quenching,descaling, cleaning, painting, masking, and plating. Such operations cancontribute significantly to a facility’s total waste generation. Typical wastesgenerated during such operations include spent cyanide baths, salt baths,quenchents, abrasive media, solvents and plating wastes. For moreinformation on these processes, refer to the Fabricated Metal ProductsIndustry Sector Notebook.
II.B. Characterization of the Metal Casting Industry
Foundries and die casters that produce ferrous and nonferrous castingsgenerally operate on a job or order basis, manufacturing castings for sale toothers companies. Some foundries, termed captive foundries, produce castingsas a subdivision of a corporation that uses the castings to produce largerproducts such as machinery, motor vehicles, appliances or plumbing fixtures.
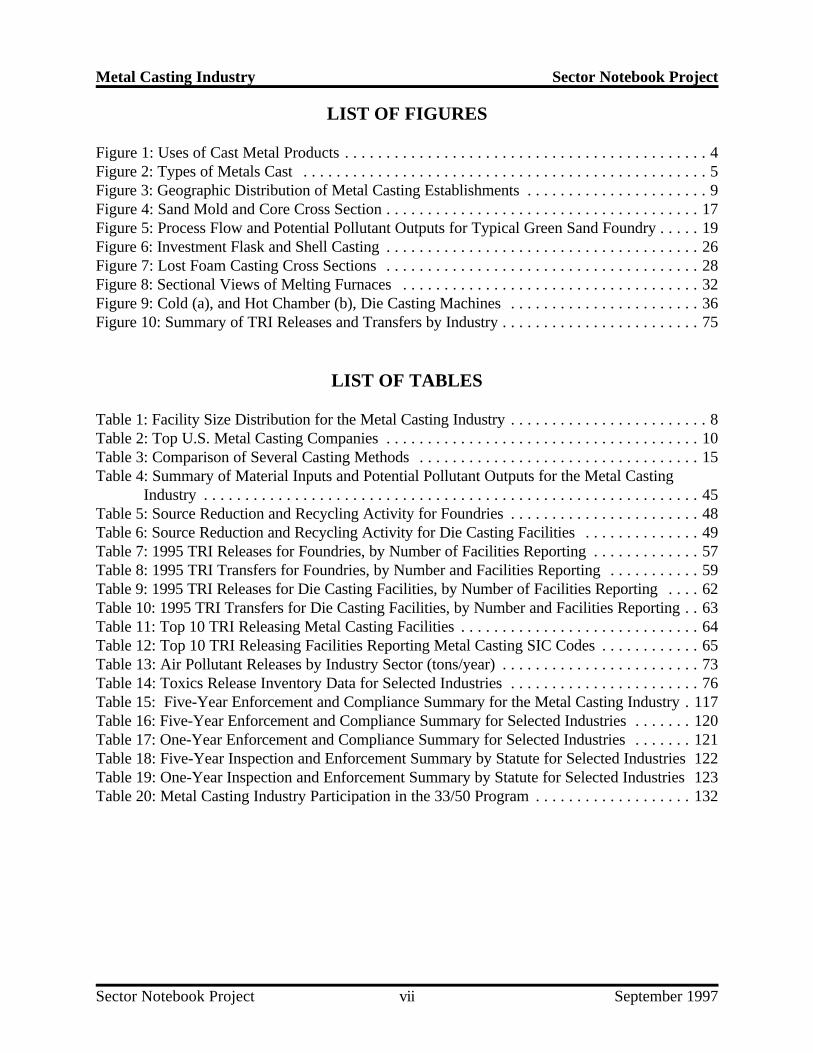
Motor Vehicles31%
Rail Road4%
Other Transportation2%
Industrial Machines14%
Farm Equipment7%
Electric Power4%
Pipes17%
Construction
4%
Ingot Molds17%
Metal Casting Industry Introduction
Sector Notebook Project September 19974
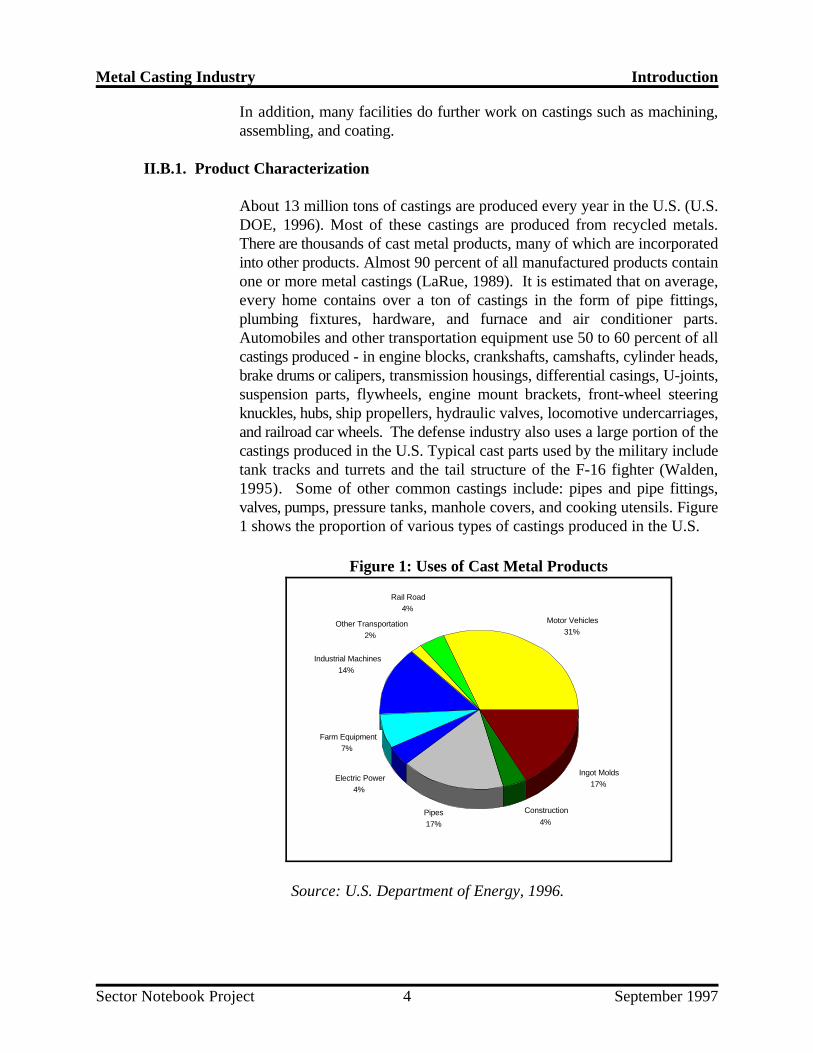
Figure 1: Uses of Cast Metal Products
Source: U.S. Department of Energy, 1996.
In addition, many facilities do further work on castings such as machining,assembling, and coating.
II.B.1. Product Characterization
About 13 million tons of castings are produced every year in the U.S. (U.S.DOE, 1996). Most of these castings are produced from recycled metals.There are thousands of cast metal products, many of which are incorporatedinto other products. Almost 90 percent of all manufactured products containone or more metal castings (LaRue, 1989). It is estimated that on average,every home contains over a ton of castings in the form of pipe fittings,plumbing fixtures, hardware, and furnace and air conditioner parts.Automobiles and other transportation equipment use 50 to 60 percent of allcastings produced - in engine blocks, crankshafts, camshafts, cylinder heads,brake drums or calipers, transmission housings, differential casings, U-joints,suspension parts, flywheels, engine mount brackets, front-wheel steeringknuckles, hubs, ship propellers, hydraulic valves, locomotive undercarriages,and railroad car wheels. The defense industry also uses a large portion of thecastings produced in the U.S. Typical cast parts used by the military includetank tracks and turrets and the tail structure of the F-16 fighter (Walden,1995). Some of other common castings include: pipes and pipe fittings,valves, pumps, pressure tanks, manhole covers, and cooking utensils. Figure1 shows the proportion of various types of castings produced in the U.S.

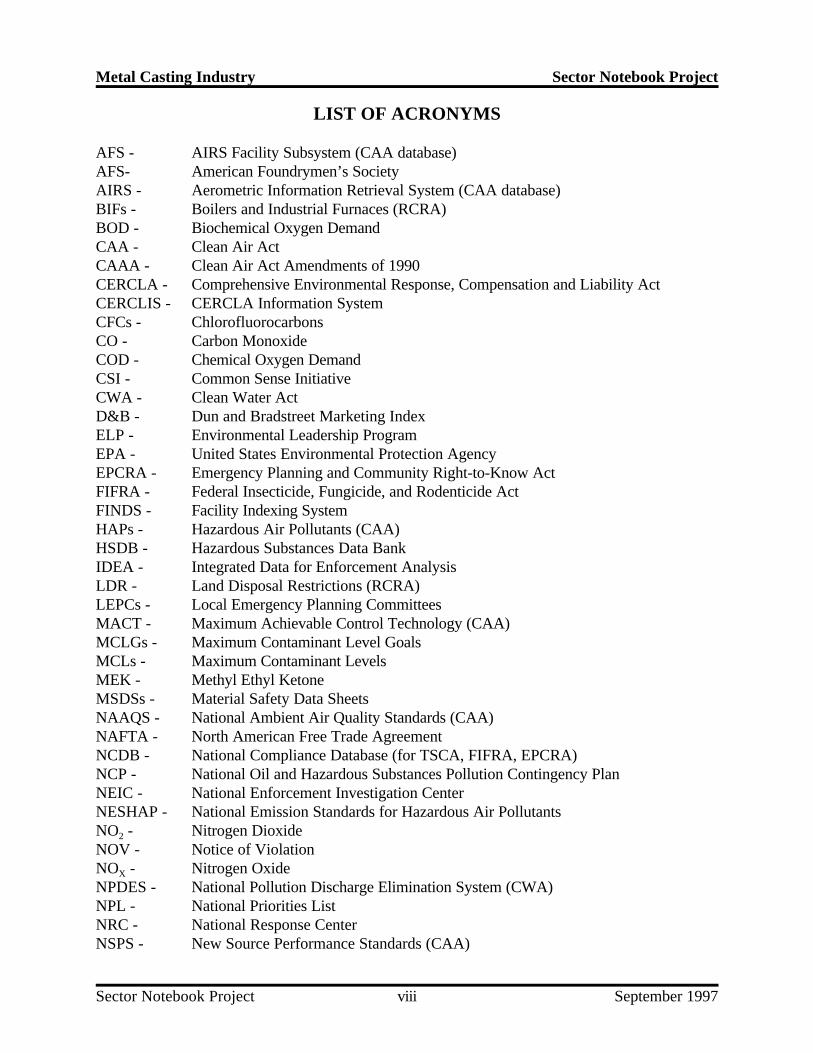
Gray Iron44%
Ductile Iron28%
Malleable Iron2%
Steel
10%
Aluminum11%
Copper2%
Other Nonferrous3%
Metal Casting Industry Introduction
Sector Notebook Project September 19975
Figure 2: Types of Metals Cast
Source: U.S. Department of Energy, 1996.
Iron and Steel (Ferrous) Castings
Depending on the desired properties of the product, castings can be formedfrom many types of metals and metal alloys. Iron and steel (ferrous) castingsare categorized by four-digit SIC code by the Bureau of Census according tothe type of iron or steel as follows:
SIC 3321 - Gray and Ductile Iron FoundriesSIC 3322 - Malleable Iron FoundriesSIC 3324 - Steel Investment FoundriesSIC 3325 - Steel Foundries, Not Elsewhere Classified
Gray and Ductile Iron make up almost 75 percent of all castings (ferrous andnonferrous) by weight (see Figure 2). Gray iron contains a higher percentageof carbon in the form of flake graphite and has a lower ductility than othertypes of iron. It is used extensively in the agricultural, heavy equipment,engine, pump, and power transmission industries. Ductile iron has magnesiumor cerium added to change the form of the graphite from flake to nodular.This results in increased ductility, stiffness, and tensile strength (Loper, 1985).
Malleable iron foundries produce only about two percent of all castings(ferrous and nonferrous). Malleable iron contains small amounts of carbon,silicon, manganese, phosphorus, sulfur and metal alloys to increase strengthand endurance. Malleable iron has excellent machinability and a high
Metal Casting Industry Introduction
Sector Notebook Project September 19976
resistance to atmospheric corrosion. It is often used in the electrical power,conveyor and handling equipment, and railroad industries.
Compared to steel, gray, ductile, and malleable iron are all relativelyinexpensive to produce, easy to machine, and are widely used where thesuperior mechanical properties of steel are not required (Loper, 1985).
Steel castings make up about 10 percent of all castings (ferrous andnonferrous). In general, steel castings have better strength, ductility, heatresistance, durability and weldability than iron castings. There are a numberof different classes of steel castings based on the carbon or alloy content, withdifferent mechanical properties. A large number of different alloying metalscan be added to steel to increase its strength, heat resistance, or corrosionresistance (Loper, 1985). The steel investment casting method produces high-precision castings, usually smaller castings. Examples of steel investmentcastings range from machine tools and dies to golf club heads.
Nonferrous Castings
Nonferrous castings are categorized by four-digit SIC code by the Bureau ofCensus according to the type of metal as follows:
SIC 3363 - Aluminum Die-CastingsSIC 3364 - Nonferrous Die-Castings, Except AluminumSIC 3365 - Aluminum FoundriesSIC 3366 - Copper FoundriesSIC 3369 - Nonferrous Foundries, Except Aluminum and Copper
Nonferrous foundries often use the same basic molding and casting techniquesas ferrous foundries. Many foundries cast both ferrous and nonferrous metals.Aluminum, copper, zinc, lead, tin, nickel, magnesium and titanium are thenonferrous metals of primary commercial importance. Usually, these metalsare cast in combinations with each other or with some of about 40 otherelements to make many different nonferrous alloys. A few of the morecommon nonferrous alloys are: brass, bronze, nickel-copper alloys (Monel),nickel-chromium-iron alloys, aluminum-copper alloys, aluminum-siliconalloys, aluminum-magnesium alloys, and titanium alloys.
Nonferrous metals are used in castings that require specific mechanicalproperties, machinability, and/or corrosion resistance (Kunsman, 1985).Aluminum and aluminum alloy castings are produced in the largest volumes;11 percent of all castings (ferrous and nonferrous) by weight are aluminum.Copper and copper alloy castings make up about two percent of all castingsby weight (DOE, 1996). Figure 2 shows the proportions of raw material typesused in castings in the U.S.

Metal Casting Industry Introduction
Sector Notebook Project September 19977
About 9 percent by weight of all cast metal products are produced using diecasting techniques (DOE, 1996). Die casting is cost effective for producinglarge numbers of a casting and can achieve a wide variety of sizes and shapeswith a high degree of accuracy. Holes, threads, and gears can be cast,reducing the amount of metal to be machined from the casting. Most diecastings are aluminum; however, lead, tin, zinc, copper, nickel, magnesium,titanium, and beryllium alloys are also die cast. Die casts are usually limitedto nonferrous metals and are often under ten pounds. A wide variety ofproducts are produced using the die casting process, ranging from tiny wristwatch parts to one-piece automobile engine blocks (Street, 1977). Othertypical die castings include: aluminum transmission cases, bearings, bushings,valves, aircraft parts, tableware, jewelry and household appliance parts.
II.B.2. Industry Size and Geographic Distribution
According to the 1992 Census of Manufacturers data, there areapproximately 2,813 metal casting facilities under SIC codes 332 and 336.The payroll for 1992 totaled $5.7 billion for a workforce of 158,000employees, and value of shipments totaled $18.8 billion. The industry’s ownestimates of the number of facilities and employment are somewhat higher at3,100 facilities employing 250,000 in 1994 (Cast Metals Coalition, 1995).Based on the Census of Manufacturers data, the industry is labor intensive.The value of shipments per employee, a measure of labor intensity, is$119,000 that is less than half of the steel manufacturing industry value($245,000 per employee) and less than seven percent of the petroleum refiningindustry value ($1.8 million per employee).
Most metal casting facilities in the U.S. are small. About seventy percent ofthe facilities employ fewer than 50 people (see Table 1). Most metal castingfacilities manufacture castings for sale to other companies (U.S. Census ofManufacturers, 1992). An important exception are the relatively few (butlarge) “captive” foundries operated by large original equipment manufacturers(OEM’s) including General Motors, Ford, Chrysler, John Deere, andCaterpillar. OEM’s account for a large portion of the castings produced andemploy a significant number of the industry’s workforce.
Although die casting establishments account for only about 9 percent of castproducts by weight, they make up about 20 percent of metal castingestablishments and value of sales (U.S. Census of Manufacturers, 1992). Inproportion to the industry size, there is very little difference between the sizedistribution of foundries and die casters.

Metal Casting Industry Introduction
Sector Notebook Project September 19978
Table 1: Facility Size Distribution for the Metal Casting Industry
Employees (SIC 332, 3365, 3366, and 3369) (SIC 3363 and 3364)per Facility
Ferrous and Nonferrous Foundries Die Casting Establishments
Number of Percentage of Number of Percentage ofFacilities Facilities Facilities Facilities
1-9 742 33% 167 28%
10-49 843 38% 214 36%
50-249 494 22% 186 31%
250-499 90 4% 25 4%
500-2499 43 2% 4 1%
2500 or more 4 0% 0 0%
Total 2216 100% 596 100%
Source: U.S. Department of Commerce, Census of Manufacturers, 1992.
Geographic Distribution
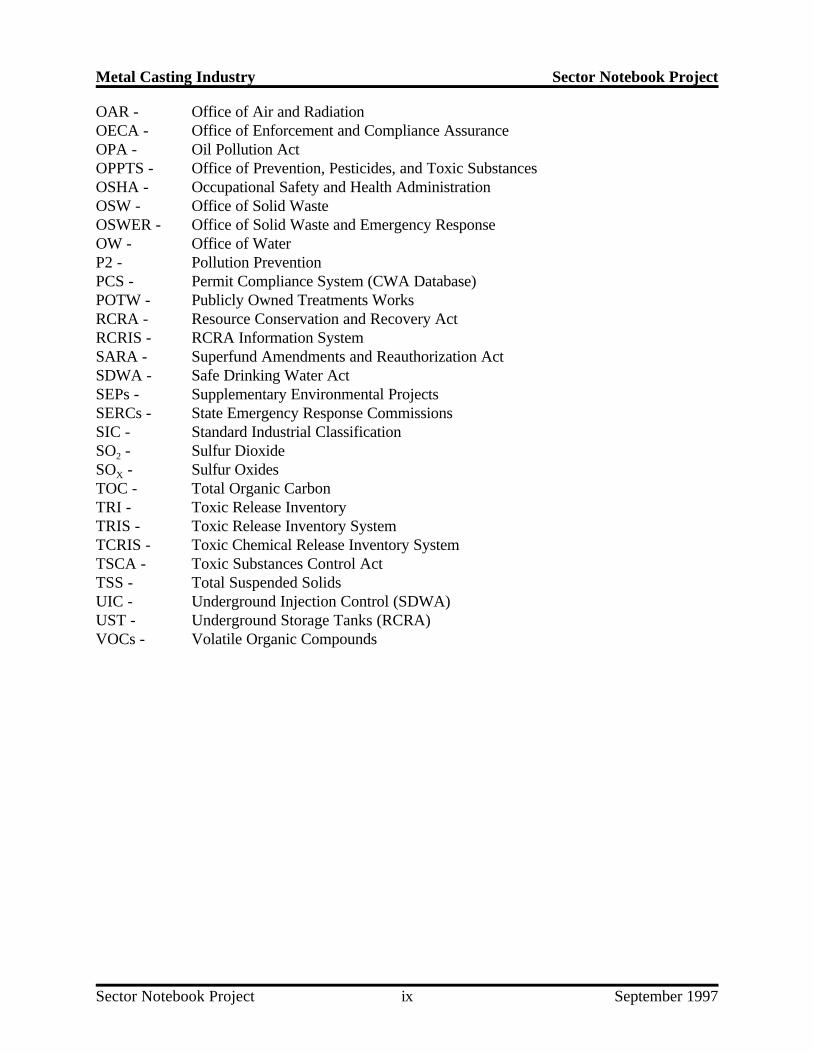
The geographic distribution of the metal casting industry resembles that of theiron and steel industry. The highest geographic concentration of facilities isin the Great Lakes, midwest, southeast regions and California. The top statesby number of facilities in order are: California, Ohio, Pennsylvania, Michigan,Illinois, Wisconsin, and Indiana. Figure 3 shows the U.S. distribution offacilities based on 1992 data from the U.S. Census of Manufacturers.Historically, locations for metal casting establishments were selected for theirproximity to raw materials (iron, steel, and other metals), coal, and water forcooling, processing, and transportation. Traditional metal casting regionsincluded the Monongahela River valley near Pittsburgh and along theMahoning River near Youngstown, Ohio. The geographic concentration ofthe industry is changing as facilities are built where scrap metal and electricityare available at a reasonable cost and there is a local market for the castproducts.

0 - 9
100 - 305
40 - 99
10 - 39
Metal Casting Industry Introduction
Sector Notebook Project September 19979
Figure 3: Geographic Distribution of Metal Casting Establishments
Source: U.S. Census of Manufacturers, 1992.
Dun & Bradstreet’s Million Dollar Directory, compiles financial data on U.S.companies including those operating within the metal casting industry. Dun& Bradstreet ranks U.S. companies, whether they are a parent company,subsidiary or division, by sales volume within their assigned 4-digit SIC code.Readers should note that: (1) companies are assigned a 4-digit SIC thatresembles their principal industry most closely; and (2) sales figures includetotal company sales, including subsidiaries and operations (possibly not relatedto metal casting). Additional sources of company specific financialinformation include Standard & Poor’s Stock Report Services, Ward’sBusiness Directory of U.S. Private and Public Companies, Moody’sManuals, and annual reports.
Metal Casting Industry Introduction
Sector Notebook Project September 199710
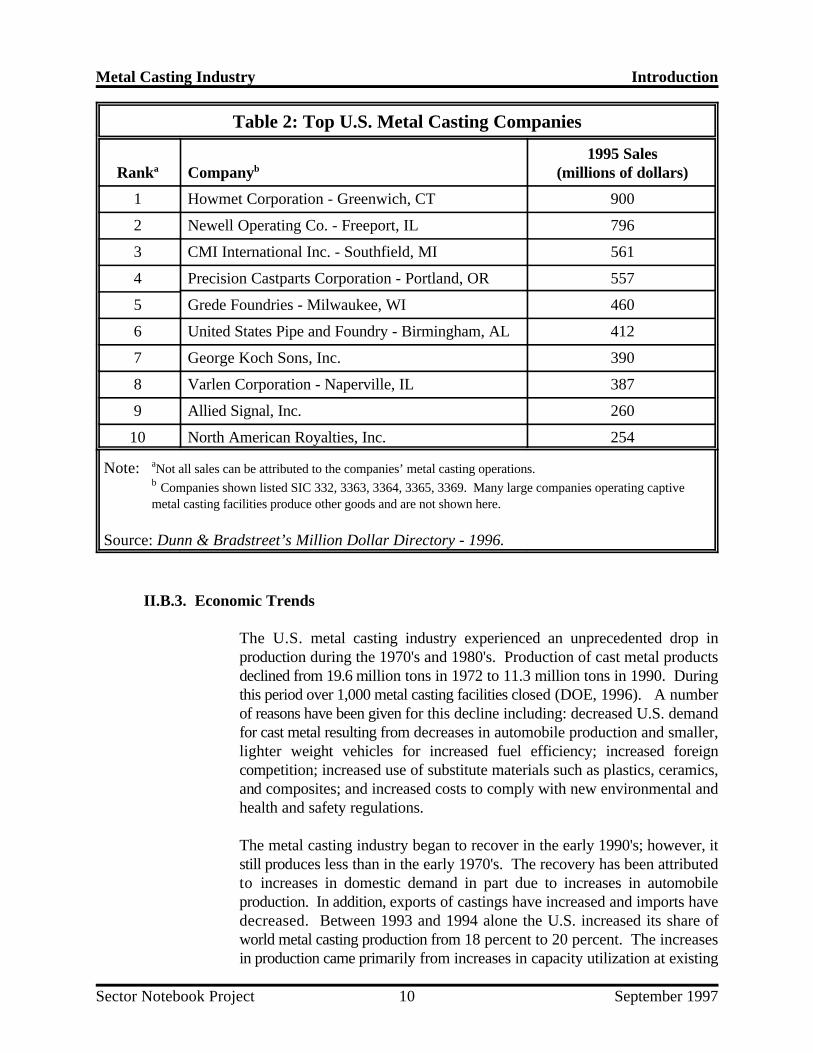
Table 2: Top U.S. Metal Casting Companies
Rank Company (millions of dollars)a b1995 Sales
1 Howmet Corporation - Greenwich, CT 900
2 Newell Operating Co. - Freeport, IL 796
3 CMI International Inc. - Southfield, MI 561
4 Precision Castparts Corporation - Portland, OR 557
5 Grede Foundries - Milwaukee, WI 460
6 United States Pipe and Foundry - Birmingham, AL 412
7 George Koch Sons, Inc. 390
8 Varlen Corporation - Naperville, IL 387
9 Allied Signal, Inc. 260
10 North American Royalties, Inc. 254
Note: Not all sales can be attributed to the companies’ metal casting operations.a
Companies shown listed SIC 332, 3363, 3364, 3365, 3369. Many large companies operating captive b
metal casting facilities produce other goods and are not shown here.
Source: Dunn & Bradstreet’s Million Dollar Directory - 1996.
II.B.3. Economic Trends
The U.S. metal casting industry experienced an unprecedented drop inproduction during the 1970's and 1980's. Production of cast metal productsdeclined from 19.6 million tons in 1972 to 11.3 million tons in 1990. Duringthis period over 1,000 metal casting facilities closed (DOE, 1996). A numberof reasons have been given for this decline including: decreased U.S. demandfor cast metal resulting from decreases in automobile production and smaller,lighter weight vehicles for increased fuel efficiency; increased foreigncompetition; increased use of substitute materials such as plastics, ceramics,and composites; and increased costs to comply with new environmental andhealth and safety regulations.
The metal casting industry began to recover in the early 1990's; however, itstill produces less than in the early 1970's. The recovery has been attributedto increases in domestic demand in part due to increases in automobileproduction. In addition, exports of castings have increased and imports havedecreased. Between 1993 and 1994 alone the U.S. increased its share ofworld metal casting production from 18 percent to 20 percent. The increasesin production came primarily from increases in capacity utilization at existing

Metal Casting Industry Introduction
Sector Notebook Project September 199711
facilities rather than an increase in facilities. In fact, the AmericanFoundrymen’s Society estimates that the number of metal casting facilitiesdecreased by over 200 between 1990 and 1994 (DOE, 1996).
In 1972, only five percent of all castings were aluminum. Today aluminumaccounts for over 11 percent of the market (DOE, 1996). Aluminum castingsare steadily comprising a larger share of the castings market as their use inmotor vehicle and engine applications continues to grow. To produce lighterweight, more fuel efficient vehicles, the automobile industry is in the processredesigning the engine blocks, heads and other parts of passenger cars andlight trucks for aluminum. Cast aluminum is expected to increase from 140pounds per vehicle in 1995 to 180 pounds per vehicle in 2004. This isprimarily at the expense of gray iron which will decrease from 358 pounds pervehicle in 1995 to 215 pounds in 2004 (Modern Casting, September, 1995).
The U.S. metal casting industry that emerged from the two decades of declinein the 1970's and 1980's is stronger and more competitive. The industry isdeveloping new markets and recapturing old markets. Research anddevelopment has resulted in technological advances that have improvedproduct quality, overall productivity and energy efficiency. Important recenttechnological advances have included Computer Aided Design (CAD) ofmolds and castings, the use of sensors and computers to regulate criticalparameters within the processes, and the use of programmable robots toperform dangerous, time consuming or repetitive tasks.
To stay competative, the industry has identified the following priority areasfor research and development to improve its processes and products:
C improving casting technologiesC developing new casting materials (alloys) and die materialsC developing higher strength and lower weight castingsC improving process controlsC improving dimensional controlC improving the quality of casting materialC reducing casting defects (DOE, March 1996)C developing environmentally improved materials to meet today’s
regulations (AFS, 1997)
Research into new casting methods and improvements in the current methodsare resulting in improved casting quality, process efficiency, andenvironmental benefits.

Page 12 intentionally left blank.

Metal Casting Industry Industrial Process Description
Sector Notebook Project September 199713
III. INDUSTRIAL PROCESS DESCRIPTION
This section describes the major industrial processes within the metal castingindustry, including the materials and equipment used and the processesemployed. The section is designed for those interested in gaining a generalunderstanding of the industry, and for those interested in the inter-relationshipbetween the industrial process and the topics described in subsequent sectionsof this profile -- pollutant outputs, pollution prevention opportunities, andFederal regulations. This section does not attempt to replicate publishedengineering information that is available for this industry. Refer to Section IXfor a list of resource materials and contacts that are available.
This section specifically contains a description of commonly used productionprocesses, associated raw materials, the by-products produced or released,and the materials either recycled or transferred off-site. This discussion,coupled with schematic drawings of the identified processes, provide aconcise description of where wastes may be produced in the process. Thissection also describes the potential fate (via air, water, and soil pathways) ofthese waste products.
III.A. Industrial Processes in the Metal Casting Industry
Many different metal casting techniques are in use today. They all have incommon the construction of a mold with a cavity in the external shape of thedesired cast part followed by the introduction of molten metal into the mold.
For the purposes of this profile, the metal casting process has been dividedinto the following five major operations:
C Pattern MakingC Mold and Core Preparation and PouringC Furnace Charge Preparation and Metal MeltingC Shakeout, Cooling and Sand HandlingC Quenching, Finishing, Cleaning and Coating
All five operations may not apply to each casting method. Since the majorvariations between processes occur in the different types of molds used,Section III.A.2 - Mold and Core Preparation is divided into subsectionsdescribing the major casting processes. In addition to the casting techniquesdescribed below, there are numerous special processes and variations of thoseprocesses that cannot be discussed here. Nevertheless, such processes mayplay an important role in a facility’s efforts to comply with environmentalrequirements. Refer to Section IX for a list of references providing moredetail on casting processes.

Metal Casting Industry Industrial Process Description
Sector Notebook Project September 199714
Note that die casting operations have been presented separately in SectionIII.A.6. The different processes, equipment, and environmental impacts of diecasting do not fit easily into operations outlined above.
III.A.1. Pattern Making
Pattern making, or foundry tooling, requires a high level of skill to achieve theclose tolerances required of the patterns and coreboxes. This step is criticalin the casting process since the castings produced can be no better than thepatterns used to make them. In some pattern making shops, computer-aideddrafting (CAD) is used in the design of patterns. Cutter tool paths aredesigned with computer-aided manufacturing (CAM). Numerical output fromthese computers is conveyed to computer-numerical-controlled (CNC)machine tools, which then cut the production patterns to shape. Suchcomputer-aided systems have better dimensional accuracy and consistencythan hand methods (LaRue, 1989).
Patterns and corebox materials are typically metal, plastic, wood or plaster.Wax and polystyrene are used in the investment and lost foam castingprocesses, respectively. Pattern makers have a wide range of tools availableincluding wood working and metal machining tools. Mechanical connectorsand glues are used to join pattern pieces. Wax, plastic or polyester putty areused as “fillet” to fill or round the inside of square corners (LaRue, 1989).
Wastes GeneratedVery little waste is generated during pattern making compared to otherfoundry operations. Typical pattern shop wastes include scrap patternmaterials (wood, plastics, metals, waxes, adhesives, etc.) and particulateemissions from cutting, grinding and sanding operations. Waste solvents andcleaners may be generated from equipment cleaning.
Metal Casting Industry Industrial Process Description
Sector Notebook Project September 199715
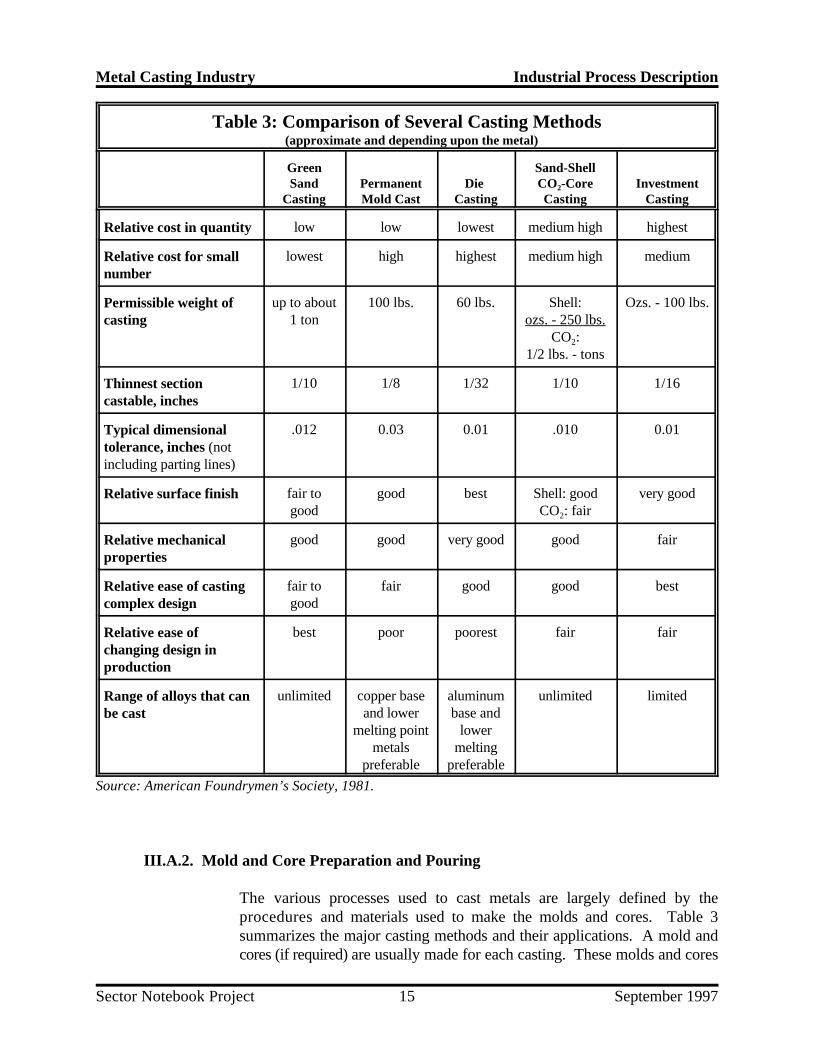
Table 3: Comparison of Several Casting Methods (approximate and depending upon the metal)
Green Sand-ShellSand Permanent Die CO -Core Investment
Casting Mold Cast Casting Casting Casting2
Relative cost in quantity low low lowest medium high highest
Relative cost for smallnumber
lowest high highest medium high medium
Permissible weight ofcasting
up to about 100 lbs. 60 lbs. Shell: Ozs. - 100 lbs.1 ton ozs. - 250 lbs.
CO :2
1/2 lbs. - tons
Thinnest sectioncastable, inches
1/10 1/8 1/32 1/10 1/16
Typical dimensionaltolerance, inches (notincluding parting lines)
.012 0.03 0.01 .010 0.01
Relative surface finish fair to good best Shell: good very goodgood CO : fair2
Relative mechanicalproperties
good good very good good fair
Relative ease of castingcomplex design
fair to fair good good bestgood
Relative ease ofchanging design inproduction
best poor poorest fair fair
Range of alloys that canbe cast
unlimited copper base aluminum unlimited limitedand lower base and
melting point lowermetals melting
preferable preferable
Source: American Foundrymen’s Society, 1981.
III.A.2. Mold and Core Preparation and Pouring
The various processes used to cast metals are largely defined by theprocedures and materials used to make the molds and cores. Table 3summarizes the major casting methods and their applications. A mold andcores (if required) are usually made for each casting. These molds and cores

Metal Casting Industry Industrial Process Description
Sector Notebook Project September 199716
are destroyed and separated from the casting during shakeout (see SectionIII.A.4 - Shakeout, Cooling and Sand Handling). (Exceptions include thepermanent mold process and die casting process in which the molds are usedover and over again.) Most sand is reused over and over in other molds;however, a portion of sand becomes spent after a number of uses and must beremoved as waste. Mold and core making are, therefore, a large source offoundry wastes.
Sand Molds and Cores
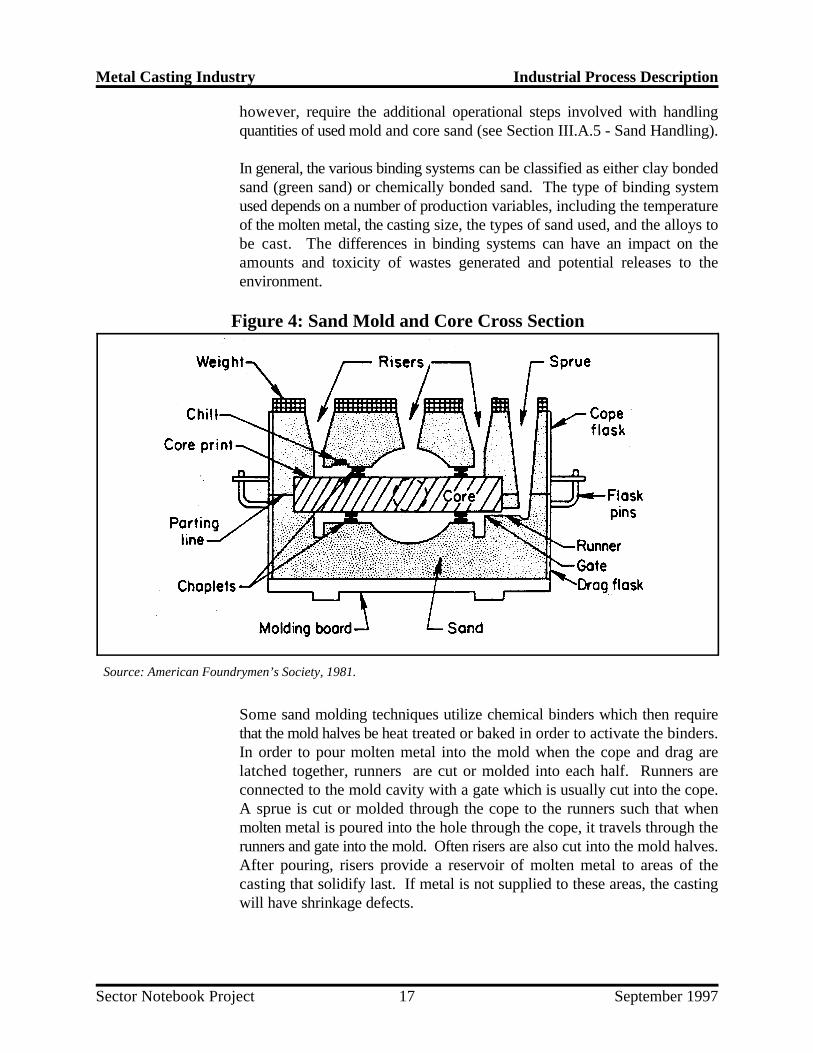
For most sand casting techniques, the following summary of the processapplies (see Figure 4). First, engineers design the casting and specify themetal or alloy to be cast. Next, a pattern (replica of the finished piece) isconstructed from either plastic, wood, metal, plaster or wax. Usually, thepattern is comprised of two halves. The molding sand is shaped around thepattern halves in a metal box (flask) and then removed, leaving the two moldhalves. The top half of the mold (the cope) is assembled with the bottom half(the drag) which sits on a molding board. The interface between the two moldhalves is called a parting line. Weights may be places on the cope to helpsecure the two halves together. The molten metal is poured or injected intoa hole in the cope called a sprue or sprue basin which is connected to the moldcavity by runners. The runners, sprue, gates, and risers comprise the mold’sgating system, which is designed to carry molten metal smoothly to all partsof the mold. The metal is then allowed to solidify within the space defined bythe mold.
Since the molds themselves only replicate the external shape of the pattern,cores are placed inside the mold to form any internal cavities. Cores areproduced in a core box, which is essentially a permanent mold that isdeveloped in conjunction with the pattern. So that molten metal can flowaround all sides of the cores, they are supported on core prints (specificlocations shaved into the mold) or on by metal supports called chaplets.
Foundry molds and cores are most commonly constructed of sand grainsbonded together to form the desired shape of the casting. Sand is usedbecause it is inexpensive, is capable of holding detail, and resists deformationwhen heated. Sand casting affords a great variety of casting sizes andcomplexities. Sand also offers the advantage of reuse of a large portion of thesand in future molds. Depending on the quantity of castings, however, theprocess can be slower and require more man-hours than processes notrequiring a separate mold for each casting. In addition, castings from sandmolds are dimensionally less accurate than those produced from some othertechniques and often require a certain amount of machining (USITC, 1984).The pattern making, melting, cleaning, and finishing operations are essentiallythe same whether or not sand molds are used. Sand molds and cores will,
Metal Casting Industry Industrial Process Description
Sector Notebook Project September 199717
Figure 4: Sand Mold and Core Cross Section
Source: American Foundrymen’s Society, 1981.
however, require the additional operational steps involved with handlingquantities of used mold and core sand (see Section III.A.5 - Sand Handling).
In general, the various binding systems can be classified as either clay bondedsand (green sand) or chemically bonded sand. The type of binding systemused depends on a number of production variables, including the temperatureof the molten metal, the casting size, the types of sand used, and the alloys tobe cast. The differences in binding systems can have an impact on theamounts and toxicity of wastes generated and potential releases to theenvironment.
Some sand molding techniques utilize chemical binders which then requirethat the mold halves be heat treated or baked in order to activate the binders.In order to pour molten metal into the mold when the cope and drag arelatched together, runners are cut or molded into each half. Runners areconnected to the mold cavity with a gate which is usually cut into the cope.A sprue is cut or molded through the cope to the runners such that whenmolten metal is poured into the hole through the cope, it travels through therunners and gate into the mold. Often risers are also cut into the mold halves.After pouring, risers provide a reservoir of molten metal to areas of thecasting that solidify last. If metal is not supplied to these areas, the castingwill have shrinkage defects.

Metal Casting Industry Industrial Process Description
Sector Notebook Project September 199718
Cores require different physical characteristics than molds; therefore, thebinding systems used to make cores may be different from those used formolds. Cores must be able to withstand the strong forces of molten metalfilling the mold, and often must be removed from small passages in thesolidified casting. This means that the binding system used must producestrong, hard cores that will collapse for removal after the casting hashardened. Therefore, cores are typically formed from silica sand (andoccasionally olivine or zircon sand), and strong chemical binders (U.S. EPA,1992). The sand and binder mix is placed in a core box where it hardens intothe desired shape and is removed. Hardening, or curing, is accomplished withheat, a chemical reaction, or a catalytic reaction. The major binding systemsin use for molds and cores are discussed below.
Green SandGreen sand is the most common molding process, making about 90% ofcastings produced in the U.S. Green sand is not used to form cores. Cores areformed using one of the chemical binding systems. Green sand is the onlyprocess that uses a moist sand mix. The mixture is made up of about 85 to 95percent silica (or olivine or zircon) sand, 4 to 10 percent bentonite clay, 2 to10 percent carbonaceous materials such as powdered (sea) coal, petroleumproducts, corn starch or wood flour, and 2 to 5 percent water (AFS, 1996).The clay and water act as the binder, holding the sand grains together. Thecarbonaceous materials burn off when the molten metal is poured into themold, creating a reducing atmosphere which prevents the metal from oxidizingwhile it solidifies (U.S. EPA, 1992).
Advantages and DisadvantagesGreen sand, as exemplified by its widespread use, has a number of advantagesover other casting methods. The process can be used for both ferrous andnon-ferrous metal casting and it can handle a more diverse range of productsthan any other casting method. For example, green sand is used to produceboth small precision castings and large castings of up to a ton. If uniformsand compaction and accurate control of sand properties are maintained, veryclose tolerances can be obtained. The process also has the advantage ofrequiring a relatively short time to produce a mold compared to many otherprocesses. In addition, the relative simplicity of the process makes it ideallysuited to a mechanized process (AFS, 1989).
Wastes GeneratedSand cores that are used in molds break down and become part of the moldsand. Foundries using green sand molds generate waste sand that becomesspent after it has been reused in the process a number of times, as a portionmust be disposed of to prevent the build up of grains that are too fine. Wastechemically bonded core sands are also generated. Typically, damaged coresare not reusable and must be disposed as waste.

Raw Materials Inputs• Sand• Binders
Sand & BinderMixing
Core Forming
Core Curing
Mold & CoreAssembly
Mold Pouring,Cooling
CastingShakeout
Riser Cutoff &Gate Removal
Cleaning, Finishing,& Coating
Inspection &Shipping
Raw Materials Inputs•Metal Scrap or Ingot•Alloys•Fluxing Agents
Scrap & ChargePreparation
Metal Melting•Cupola Furnace•Electric-Arc Furnace•Induction Furnace•Reverberatory Furnace•Crucible Furnace
Tapping, Treatment,Slag & Dross
Removal
MoldMaking
SandPreparation &Treatment•Lump Knockout•Screening•Metal Removal•Thermal Treatment•Wet Scrubbing•Other
Sand
Make-up Sand
Particulates
Waste sand, fines andlumps, metals
Particulates
Particulates
VOCs, HAPs
Particulates, metal oxidefumes, carbon monoxide,
VOCs, HAPs
Particulates
Particulates
Scrap metal, spent tools,abrasives
Particulates, VOCs
Waste cleaning water withsolvents, oil & grease,
suspended solids
Spent solvents, abrasives,coatings, wastewater
treatment sludge
Off-spec castings,packaging materials
Slag, dross, spentrefractory material
Spent refractorymaterial
Particulates,nitrogen oxides,
carbon monoxides,metal oxide fumes,
sulfur dioxide
Particulates,nitrogen oxides,
carbon monoxides,metal oxide fumes,
sulfur dioxide
Particulates,organic ompounds,
HAPs, VOCs
Wet scrubberwastewater with
high pH
Hydrocarbons,carbon monoxide,
smoke
Metal Casting Industry Industrial Process Description
Sector Notebook Project September 199719
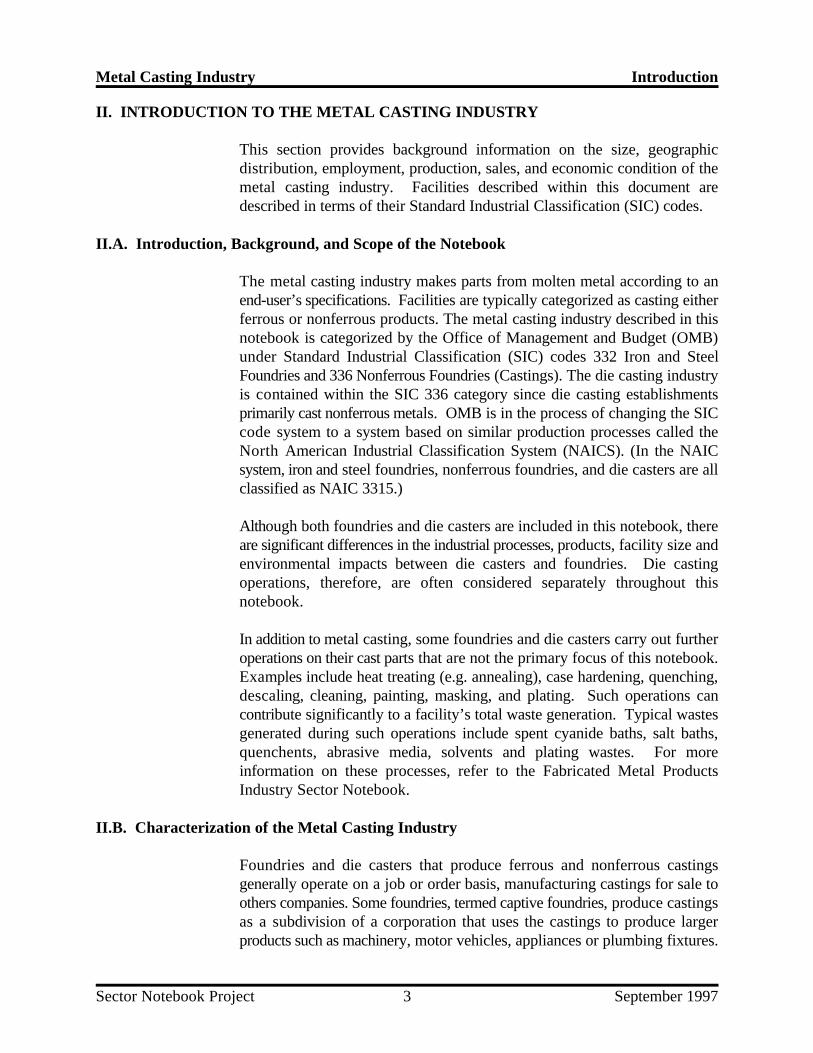
Figure 5: Process Flow and Potential Pollutant Outputs for Typical Green Sand Foundry
Source: Adapted from Kotzin, Air Pollution Engineering Manual: Steel Foundries, 1992.

Metal Casting Industry Industrial Process Description
Sector Notebook Project September 199720
Particulate emissions are generated during mixing, molding and core makingoperations. In addition, gaseous and metal fume emissions develop whenmolten metal is poured into the molds and a portion of the metal volatilizesand condenses. When green sand additives and core sand binders come intocontact with the molten metal, they produce gaseous emissions such as carbonmonoxide, organic compounds, hydrogen sulfide, sulfur dioxide, nitrousoxide, benzene, phenols, and other hazardous air pollutants (HAPs) (Twarog,1993). Wastewater containing metals and suspended solids may be generatedif the mold is cooled with water.
Chemical Binding SystemsChemical binding systems are primarily used for core making. Green sand isnot used for cores because, chemically bound sand is stronger, harder, and canbe more easily removed from the cavity after the metal has solidified. Almostevery foundry using sand molds uses one or more of the chemical bindingsystems described below in constructing sand cores. Although some foundriesalso use chemical binding systems to construct molds, the much more simple,quick and inexpensive green sand molds described previously dominate theindustry in terms of tons of castings produced. When chemical bindingsystems are used for mold making, the “shell-mold” system is most often used.Chemical bonding systems work through either thermal setting, chemical orcatalytic reactions. The major thermal setting systems include: oil-bake, shellcore/mold, hot box, and warm box. The major catalytic systems are the no-bake and cold box systems (U.S. EPA, 1993).
Oil-BakeThe traditional method used to produce cores is the oil-bake, or core-oilsystem. The oil-bake system uses oil and cereal binders mixed with sand. Thecore is shaped in a core box and then baked in an oven to harden it. Oils usedcan be natural, such as linseed oil, or synthetic resins, such as phenolic resins.The oil-bake system was used almost exclusively before 1950, but has nowbeen largely replaced by other chemical binding systems (U.S. EPA, 1981).
Shell CoreThe shell core system uses sand mixed with synthetic resins and a catalyst.The resins are typically phenolic or furan resins, or mixtures of the two. Oftenthe shell core sand is purchased as dry coated sand. The catalyst is a weakaqueous acid such as ammonium chloride. The sand mixture is shaped in aheated metal core box. Starting from the outside edge of the core box andmoving through the sand towards the center of the core box, the heat beginsto cure the sand mix into a hard mass. When the outside 1/8 to 3/16 inchesof sand has been cured, the core box is inverted. The uncured sand pours outof the core box leaving a hard sand core shell behind. The shell core is thenremoved from the core box, allowed to cure for an addition few minutes andis then ready for placement in the mold (LaRue, 1989). The system has the
Metal Casting Industry Industrial Process Description
Sector Notebook Project September 199721
advantage of using less sand and binders than other systems; however, shellsand may be more expensive than sand used in other sand processes.
Shell MoldThe shell mold system is similar to the shell core system, but is used toconstruct molds instead of cores. In this process, metal pattern halves arepreheated, coated with a silicone emulsion release agent, and then covered bythe resin-coated sand mixture. The heat from the patterns cures the sand mixand the mold is removed after the desired thickness of sand is obtained. Thesilicone emulsion acts as a mold release allowing the shell mold to be removedfrom the pattern after curing (LaRue, 1989).
Hot Box CoreThe hot box process uses a phenolic or furan resin and a weak acid catalystthat are mixed with sand to coat the surface of the grains. The majordifference between this system and the shell core system is that the core boxis heated to about 450 to 550 EF until the entire core has become solidified(Twarog, 1993). The system has the advantage of very fast curing times anda sand mix consistency allowing the core boxes to be filled and packedquickly. Therefore, the system is ideal for automation and the massproduction of cores. The disadvantage is that more sand and binder is usedin this system than in the shell core system.
Warm Box CoreThe warm box system is essentially the same as the hot box system, but usesa different catalyst. The catalysts used allow the resin binders to cure at alower temperature (300 to 400 EF). As with the hot box, the resins used arephenolic and furan resins. Either copper salts or sulfonic acids are used as acatalyst. The advantage over hot box is reduced energy costs for heating(Twarog, 1993).
Cold BoxThe cold box process is relatively new to the foundry industry. The systemuses a catalytic gas to cure the binders at room temperature. A number ofdifferent systems are available including phenolic urethane binder with carbondioxide gas as the catalyst. Other systems involve different binders (e.g.,sodium silicate) and gases, such as sulfur dioxide and dimethylethylamine(DMEA), many of which are flammable or irritants. Compared to otherchemical systems, the cold box systems have a short curing time (lower thanten seconds) and therefore are well suited to mass production techniques(AFS, 1981). In addition, the absence of costly oven heating can result insubstantial energy savings.

Metal Casting Industry Industrial Process Description
Sector Notebook Project September 199722
No-BakeThe no-bake or air set binder systems allow curing at room temperaturewithout the use of reactive gases. The no-bake system uses either acidcatalysts or esters to cure the binder. The acid catalysts are typically benzene,toluene, sulfonic or phosphoric acids. Binders are either phenolic resins, furanresins, sodium silicate solution or alkyd urethane. The system has theadvantage of substantial savings in energy costs (Twarog, 1993).
Advantages and DisadvantagesCores are necessarily constructed using chemical binders. Molds, however,may be constructed with chemical binders or green sand. The advantages tousing chemically bonded molds over green sand molds may include: a longerstorage life for the molds, a potentially lower metal pouring temperature, andmolds having better dimensional stability and surface finish. Disadvantagesinclude the added costs of chemical binders, the energy costs for curing thebinders, added difficulties to reclaim used sand, and environmental and workersafety concerns for air emissions associated with binder chemicals duringcuring and metal pouring.
Wastes GeneratedSolid wastes generated include broken cores and sand that has set upprematurely or inadequately. Waste resins and binders can be generated fromspills, residuals in containers, and outdated materials. In addition to fugitivedust from the handling of sand, mold and core making using chemical bindingsystems may generate gaseous emissions such as carbon monoxide, VOCs anda number of gasses listed as hazardous air pollutants (HAPs) under the CleanAir Act. Emissions occur primarily during heating or curing of the molds andcores, removal of the cores from core boxes, cooling, and pouring of metalinto molds (Twarog, 1993). The specific pollutants generated depends on thetype of binding system being used. Section III.B Table 4 lists typical airemissions that may be expected from each major type of chemical bindingsystem. Wastewater containing metals, suspended solids, and phenols may begenerated if molds are cooled with water.
Permanent Mold Casting
In permanent mold casting, metal molds are used repeatedly. Although themolds deteriorate over time, they can be used to make thousands of castingsbefore being replaced. The process is similar to die casting (see SectionIII.A.6 on Die Casting) with the exception being that gravity is used to fill themold rather than external pressure. Permanent molds are designed to beopened, usually on a hinge, so that the castings can be removed. Permanentmolds can be used for casting both ferrous and nonferrous metals as long asthe mold metal has a higher melting point than the casting metal. Cores frompermanent molds can be sand, plaster, collapsible metal or, soluble salts.

Metal Casting Industry Industrial Process Description
Sector Notebook Project September 199723
When cores are not reusable, the process is often referred to assemipermanent mold casting (AFS, 1981).
Since the process is relatively simple after the mold has been fabricated, andsince large numbers of castings are usually produced, permanent mold castingis typically an automated process. The sequence of operations includes aninitial cleaning of the mold followed by preheating and the spraying orbrushing on of a mold coating. The coating serves the purpose of insulatingthe molten metal from the relatively cool, heat conducting mold metal. Thisallows the mold to be filled completely before the metal begins to solidify.The coatings also help produce good surface finish, act as a lubricant tofacilitate casting removal, and allow any air in the mold to escape via spacebetween the mold and coating. After coating, cores are then inserted and themold is closed. The metal is poured and allowed to solidify before openingand ejecting the casting (LaRue, 1989).
MaterialsMold metals are typically made of cast iron. The molds can be very simple orcan have a number of sophisticated features, such as ejector pins to removecastings, water cooling channels and sliding core pins. Coatings are typicallymixtures of sodium silicate and either vermiculite, talc, clay or bentonite(AFS, 1981).
Advantages and DisadvantagesPermanent molds have the obvious advantage of not requiring the making ofa new mold (and the associated time and expenses) for every casting. Theelimination of the mold making process results in a more simple overallcasting process, a cleaner work environment, and far less waste generation.Because molten metal cools and solidifies much faster in a permanent moldthan in a sand mold, a more dense casting with better mechanical propertiesis obtained. The process can also produce castings with a high level ofdimensional accuracy and good surface finish (AFS, 1981). One disadvantageis the high cost of tooling, which includes the initial cost of casting andmachining the permanent mold. In addition, the shapes and sizes of castingsare limited due to the impossibility of removing certain shapes from the molds(USITC, 1984).
Wastes GeneratedCompared to sand casting operations, relatively little waste is generated in thepermanent mold process. Some foundries force cool the hot permanent moldswith water sprayed or flushed over the mold. The waste cooling water maypick up contaminants from the mold such as metals and mold coatings.Fugitive dust and waste sand or plaster are generated if cores are fabricatedof sand or plaster, respectively. Waste coating material may also be generatedduring cleaning of the mold.
Metal Casting Industry Industrial Process Description
Sector Notebook Project September 199724
Plaster Mold Casting
The conventional plaster molding process is similar to the sand moldingprocesses. In cope and drag flasks, a plaster slurry mix is poured over thepattern halves. When the plaster has set, the patterns are removed and themold halves are baked to remove any water (USITC, 1984). Since even smallamounts of water will, when quickly heated during pouring, expand to steamand adversely affect the casting, drying is a critical step in plaster moldcasting. Oven temperatures may be as high as 800EF for as long as 16 to 36hours. As in the sand mold processes, the cores are inserted, and the driedmold halves are attached prior to pouring the molten metal. The plaster moldsare destroyed during the shakeout process. Plaster or sand cores may be usedin the process.
The conventional plaster molding process described here is the most commonof a number of plaster mold casting processes in use. Other processes includethe foamed plaster casting process, the Antioch casting process and the matchplate pattern casting process (AFS, 1981).
MaterialsThe plasters used in plaster mold casting are very strong, hard gypsum(calcium sulfate) cements mixed with either fibrous talcs, finely ground silica,pumice stone, clay or graphite. Plaster mixtures may also be comprised of upto 50 percent sand (AFS, 1981).
Advantages and DisadvantagesThe plaster mold process can produce castings with excellent surface detail,complex and intricate configurations, and high dimensional accuracy. Plastermold castings are also light, typically under 20 pounds (USITC, 1994). Theprocess is limited to nonferrous metals because ferrous metals will react withthe sulfur in the gypsum, creating defects on the casting surface (AFS, 1981).Plaster mold casting is more expensive than sand casting, and has a longerprocess time from mold construction to metal pouring. The process is onlyused, therefore, when the desired results cannot be obtained through sandcasting or when the finer detail and surface finish will result in substantialsavings in machining costs.
Wastes GeneratedWaste mold plaster and fugitive dust can be generated using this process.Waste sand can also be generated, depending on the type of cores used.
Investment/Lost Wax Casting
Investment casting processes use a pattern or replica that is consumed, or lost,from the mold material when heated. The mold-making process results in a

Metal Casting Industry Industrial Process Description
Sector Notebook Project September 199725
one-piece destroyable mold. The most common type of investment casting,the lost wax process, uses patterns fabricated from wax. Plastic patterns,however, are also fairly common in investment casting.
The process begins with the production of a wax or plastic replica of the part.Replicas are usually mass produced by injecting the wax or plastic into a die(metal mold) in a liquid or semi-liquid state. Replicas are attached to a gatingsystem (sprue and runners) constructed of the same material to form a treeassembly (see Figure 6). The assembly is coated with a specially formulatedheat resistant refractory slurry mixture which is allowed to harden around thewax or plastic assembly forming the mold (USITC, 1984).
In the investment flask casting method, the assembly is placed in a flask andthen covered with a refractory slurry which is allowed to harden (see Figure6). In the more common investment shell casting method, the assembly isdipped in a refractory slurry and sand is sifted onto the coated patternassembly and allowed to harden. This process is repeated until the desiredshell thickness is reached (LaRue, 1989). In both methods, the assembly isthen melted out of the mold. Some investment casting foundries are able torecover the melted wax and reuse a portion in the pattern making process.The resulting mold assemblies are then heated to remove any residual patternmaterial and to further cure the binder system. The mold is then ready for thepouring of molten metal into the central sprue which will travel through theindividual sprues and runners filling the mold.
Although normally not necessary, cores can be used in investment casting forcomplex interior shapes. The cores are inserted during the pattern makingstep. The cores are placed in the pattern die and pattern wax or plastic isinjected around the core. After the pattern is removed from the die, the coresare removed. Cores used in investment casting are typically collapsible metalassemblies or soluble salt materials which can be leached out with water or adilute hydrochloric acid solution.
In addition to the investment flask and shell mold casting methods describedabove, a number of methods have been developed which use reusable masterpatterns. These processes were developed to eliminate production ofexpendable patterns, one of the most costly and time-consuming steps in thecasting process. One process, called the Shaw Process, uses a refractoryslurry containing ethyl silicate. The slurry cures initially to a flexible gel whichcan be removed from the pattern in two halves. The flexible mold halves canthen be further cured at high temperatures until a hard mold is formed readyfor assembly and pouring (AFS, 1981).

Metal Casting Industry Industrial Process Description
Sector Notebook Project September 199726
Figure 6: Investment Flask and Shell Casting
Source: American Foundrymen’s Society, 1981.
MaterialsThe refractory slurries used in both investment flask and shell casting arecomprised of binders and refractory materials. Refractory materials includesilica, aluminum silicates, zircon, and alumina. Binders include silica sols(very small silica particles suspended in water), hydrolyzed ethyl silicate,sodium and potassium silicate, and gypsum type plasters. Ethyl silicate istypically hydrolyzed at the foundry by adding alcohol, water, and hydrochloricacid to the ethyl silicate as a catalyst (AFS, 1981).
Pattern materials are most commonly wax or polystyrene. Wax materials canbe synthetic, natural, or a combination. Many different formulations areavailable with varying strengths, hardness, melting points, setting times, andcompatibilities, depending on the specific casting requirements.

Metal Casting Industry Industrial Process Description
Sector Notebook Project September 199727
Advantages and DisadvantagesThe investment casting process produces castings with a higher degree ofdimensional accuracy than any other casting process. The process can alsoproduce castings with a high level of detail and complexity and excellentsurface finish. Investment casting is used to create both ferrous andnonferrous precision pieces such as dental crowns, fillings and dentures,jewelry, and scientific instruments. The costs of investment casting aregenerally higher than for other casting processes due in part to the high initialcosts of pattern die-making (USITC, 1984). In addition, the relatively largenumber of steps in the process is less amenable to automation than many othercasting methods.
Wastes GeneratedWaste refractory material, waxes, and plastic are the largest volume wastesgenerated. Air emissions are primarily particulates. Wastewater withsuspended and dissolved solids and low pH may also be generated if solublesalt cores are used.
Lost Foam Casting
The lost foam casting process, also known as Expanded Polystyrene (EPS)casting, and cavityless casting, is a relatively new process that is gainingincreased use. The process is similar to investment casting in that anexpendable polystyrene pattern is used to make a one-piece expendable mold.As in investment casting, gating systems are attached to the patterns, and theassembly is coated with a specially formulated gas permeable refractory slurry.When the refractory slurry has hardened, the assembly is positioned in a flask,and unbonded sand is poured around the mold and compacted into anyinternal cavities. Molten metal is then poured into the polystyrene patternwhich vaporizes and is replaced by the metal (see Figure 7). When the metalhas solidified, the flask is emptied onto a steel grate for shakeout. The loosesand falls through the grate and can be reused without treatment. Therefractory material is broken away from the casting in the usual manner (AFS,1981).
MaterialsRefractory slurries for lost foam casting must produce a coating strongenough to prevent the loose sand around the coated assembly from collapsinginto the cavity as the pattern vaporizes. Coatings must also be permeable toallow the polystyrene vapors to escape from the mold cavity, through thecoating, into the sand and out of the flask. Flasks for this process have sidevents which allow the vapors to escape (AFS, 1981).

Metal Casting Industry Industrial Process Description
Sector Notebook Project September 199728
Figure 7: Lost Foam Casting Cross Sections
Source: American Foundrymen’s Society, 1981.
Polystyrene patterns can be fabricated from polystyrene boards or by moldingpolystyrene beads. Patterns from boards are fabricated using normal patternforming tools (see Section III.A.1). The boards are available in various sizesand thicknesses, and can be glued together to increase thickness if needed.Molded polystyrene patterns begin as small beads of expandable polystyreneproduct. The beads are pre-expanded to the required density using a vacuum,steam, or hot air processes. In general, the aim is to reduce the bead densityas much as possible in order to minimize the volume of vapors to be ventedduring casting. If vapors are generated faster than can be vented, castingdefects will result. The expanded polystyrene beads are blown into a castaluminum mold. Steam is used to heat the beads causing them to expandfurther, fill void areas, and bond together. The mold and pattern are allowedto cool, and the pattern is ejected (AFS, 1981).
Advantages and DisadvantagesThe lost foam process can be used for precision castings of ferrous andnonferrous metals of any size. In addition to being capable of producinghighly accurate, complex castings with thin walls, good surface finish, and noparting lines, there are numerous practical advantages to the process. Forexample, there are far fewer steps involved in lost foam casting compared tosand casting. Core making and setting is not necessary, nor is the mixing of

Metal Casting Industry Industrial Process Description
Sector Notebook Project September 199729
large amounts of sand and binders. Shakeout and sand handling is a matterof pouring out the sand which is mostly reusable without any treatment sincebinders are not used. Some portion of sand may need to be removed to avoidthe buildup of styrene in the sand. The flasks used are less expensive andeasier to use since there are no cope and drag halves to be fastened together.The reduced labor and material costs make lost foam casting an economicalalternative to many traditional casting methods. Although the potential existsfor other metals to be cast, currently only aluminum and gray and ductile ironare cast using this method (AFS, 1981). In addition there are some limitationsin using the technique to cast low carbon alloys (SFSA, 1997).
Wastes GeneratedThe large quantities of polystyrene vapors produced during lost foam castingcan be flammable and may contain hazardous air pollutants (HAPs). Otherpossible air emissions are particulates related to the use of sand. Waste sandand refractory materials containing styrene may also be generated.
III.A.3. Furnace Charge Preparation and Metal Melting
Foundries typically use recycled scrap metals as their primary source of metal,and use metal ingot as a secondary source when scrap is not available. Thefirst step in metal melting is preparation of the scrap materials. Preparation,which also may be done by the foundry’s metal supplier, consists of cuttingthe materials to the proper size for the furnace and cleaning and degreasingthe materials. Cleaning and degreasing can be accomplished with solvents orby a precombustion step to burn off any organic contaminants (Kotzin, 1992).Prepared scrap metal is weighed and additional metal, alloys, and flux may beadded prior to adding the metal to the furnace. Adding metal to a furnace iscalled “charging.” (Alloys may also be added at various stages of the melt oras the ladle is filled.)
Flux is a material added to the furnace charge or to the molten metal toremove impurities. Flux unites with impurities to form dross or slag, whichrises to the surface of the molten metal where it is removed before pouring(LaRue, 1989). The slag material on the molten metal surface helps toprevent oxidation of the metal. Flux is often chloride or fluoride salts thathave an affinity to bind with certain contaminants. The use of salt fluxes mayresult in emissions of acid gasses.
Five types of furnaces are commonly used to melt metal in foundries: cupola,electric arc, reverberatory, induction and crucible (see Figure 8). Somefoundries operate more than one type of furnace and may even transfer moltenmetal between furnace types in order to make best use of the best features ofeach.
Metal Casting Industry Industrial Process Description
Sector Notebook Project September 199730
Cupola FurnacesThe cupola furnace is primarily used to melt gray, malleable, or ductile iron.The furnace is a hollow vertical cylinder on legs and lined with refractorymaterial. Hinged doors at the bottom allow the furnace to be emptied whennot in use. When charging the furnace, the doors are closed and a bed of sandis placed at the bottom of the furnace, covering the doors. Alternating layersof coke for fuel and scrap metal, alloys and flux are placed over the sand.Although air, or oxygen enriched air, is forced through the layers with ablower, cupolas require a reducing atmosphere to maintain the coke bed.Heat from the burning coke melts the scrap metal and flux, which drip to thebottom sand layer. In addition, the burning of coke under reducing conditionsraises the carbon content of the metal charge to the casting specifications. Ahole level with the top of the sand allows molten metal to be drained off, or“tapped.” A higher hole allows slag to be drawn off. Additional charges canbe added to the furnace as needed (LaRue, 1989).
Electric Arc FurnacesElectric arc furnaces are used for melting cast iron or steel. The furnaceconsists of a saucer-shaped hearth of refractory material for collecting themolten metal with refractory material lining the sides and top of the furnace.Two or three carbon electrodes penetrate the furnace from the top or sides.The scrap metal charge is placed on the hearth and melted by the heat froman electric arc formed between the electrodes. When the electric arc comesinto contact with the metal, it is a direct-arc furnace and when the electric arcdoes not actually touch the metal it is an indirect-arc furnace. Molten metalis typically drawn off through a spout by tipping the furnace. Alloying metalcan be added, and slag can be removed, through doors in the walls of thefurnace (LaRue, 1989). Electric arc furnaces have the advantage of notrequiring incoming scrap to be clean. One disadvantage is that they do notallow precise metallurgical adjustments to the molten metal.
Reverberatory FurnacesReverberatory furnaces are primarily used to melt large quantities ofnonferrous metals. Metal is placed on a saucer-shaped hearth lined withrefractory material on all sides. Hot air and combustion gasses from oil or gasburners are blown over the metal and exhausted out of the furnace. The heatmelts the metal and more charge is added until the level of molten metal ishigh enough to run out of a spout in the hearth and into a well from which itcan be ladled out (LaRue, 1989).
Induction FurnacesInduction furnaces are used to melt both ferrous and non-ferrous metals.There are several types of induction furnaces, but all create a strong magneticfield by passing an electric current through a coil wrapped around the furnace.The magnetic field in turn creates a voltage across and subsequently an

Metal Casting Industry Industrial Process Description
Sector Notebook Project September 199731
electric current through the metal to be melted. The electrical resistance ofthe metal produces heat which melts the metal. Induction furnaces are veryefficient and are made in a wide range of sizes (LaRue, 1989). Inductionfurnaces require cleaner scrap than electric arc furnaces, however, they doallow precise metallurgical adjustments.
Crucible FurnacesCrucible furnaces are primarily used to melt smaller amounts of nonferrousmetals than other furnace types. The crucible or refractory container is heatedin a furnace fired with natural gas or liquid propane. The metal in the cruciblemelts, and can be ladled from the crucible or poured directly by tipping thecrucible (LaRue, 1989).
Wastes GeneratedCupola, reverberatory and electric arc furnaces may emit particulate matter,carbon monoxide, hydrocarbons, sulfur dioxide, nitrogen oxides, smallquantities of chloride and fluoride compounds, and metallic fumes from thecondensation of volatilized metal and metal oxides. Induction furnaces andcrucible furnaces emit relatively small amounts of particulates, hydrocarbons,and carbon monoxide emissions. The highest concentration of furnaceemissions occur when furnaces are opened for charging, alloying, slagremoval, and tapping (Kotzin, 1992). Particulate emissions can be especiallyhigh during alloying and the introduction of additives. For example, ifmagnesium is added to molten metal to produce ductile iron, a strong reactionensues, with the potential to release magnesium oxides and metallic fumes(NADCA, 1996).
Furnace emissions are often controlled with wet scrubbers. Wet scrubberwastewater can be generated in large quantities (up to 3,000 gallons perminute) in facilities using large cupola furnaces. This water may containmetals and phenols, and is typically highly alkaline or acidic and is neutralizedbefore being discharged to the POTW (AFS Air Quality Committee, 1992).Non-contact cooling water with little or no contamination may also begenerated.
Scrap preparation using thermal treatment will emit smoke, organiccompounds and carbon monoxide. Other wastes may include waste solventsif solvents are used to prepare metal for charging. Slag is also generatedduring metal melting operations. Hazardous slag can be generated if thecharge materials contain enough toxic metals such as lead and chromium orif calcium carbide is used in the metal to remove sulfur compounds (seeSection III.B.1) (U.S. EPA, 1992).

Metal Casting Industry Industrial Process Description
Sector Notebook Project September 199732
Figure 8: Sectional Views of Melting Furnaces
Source: American Foundrymen’s Society, 1989.
Metal Casting Industry Industrial Process Description
Sector Notebook Project September 199733
III.A.4. Shakeout, Cooling and Sand Handling
For those foundries using sand molding and core making techniques, castingsneed to be cooled and separated from the sand mold. After molten metal hasbeen ladled into the mold and begins to solidify, it is transported to a coolingarea where the casting solidifies before being separated from the mold.Larger, more mechanized foundries use automatic conveyor systems totransfer the casting and mold through a cooling tunnel on the way to theshakeout area. Less mechanized foundries allow the castings to cool on theshop floor. In the shakeout area, molds are typically placed on vibrating gridsor conveyors to shake the sand loose from the casting. In some foundries, themold may be separated from the casting manually (EPA, 1986).
Sand casting techniques can generate substantial volumes of waste sand.Many foundries reuse a large portion of this sand and only remove a smallportion as waste. Waste sand removed from the foundry is primarily madeup of fine grains that build up as the sand is reused over and over. Mostfoundries, therefore, have a large multi-step sand handling operation forcapturing and conditioning the reusable sand. Larger foundries often haveconveyorized sand-handling systems working continuously. Smaller, lessmechanized foundries often use heavy equipment (e.g., front-end loaders) ina batch process (U.S. EPA, 1992). Increasingly, foundry waste sand is beingsent off-site for use as a construction material (see Section V).
Sand handling operations receive sand directly from the shakeout step or froman intermediate sand storage area. A typical first step in sand handling is lumpknockout. Sand lumps occur when the binders used in sand cores onlypartially degrade after exposure to the heat of molten metal. The lumps, orcore butts, may be crushed and recycled into molding sand during this step.They can also be disposed as waste material. A magnetic separation operationis often used in ferrous foundries to remove pieces of metal from the sand.Other steps involve screening to remove fines that build up over time, andcooling by aeration. In addition, some foundries treat mold and core sandthermally to remove binders and organic impurities (U.S. EPA, 1992).
Wastes GeneratedShakeout, cooling, and sand handling operations generate waste sand andfines possibly containing metals. In addition, particulate emissions aregenerated during these operations. If thermal treatment units are used toreclaim chemically bonded sands, emissions such as carbon monoxide, organiccompounds, and other gasses can be expected.

Metal Casting Industry Industrial Process Description
Sector Notebook Project September 199734
III.A.5. Quenching, Finishing, Cleaning and Coating
Rapid cooling of hot castings by quenching in a water bath is practiced bysome foundries and die casters to cool and solidify the casting rapidly (tospeed the process) and to achieve certain metallurgical properties. The waterbath may be plain water or may contain chemical additives to preventoxidation.
Some amount of finishing and cleaning is required for all castings; however,the degree and specific types of operations will depend largely on the castingspecifications and the casting process used. Finishing and cleaning operationscan be a significant portion of the overall cost to produce a casting.Foundries, therefore, often search for casting techniques and mold designsthat will reduce the finishing needed.
Finishing operations begin once the casting is shaken out and cooled.Hammers, band saws, abrasive cutting wheels, flame cut-off devices, and air-carbon arc devices may be used to remove the risers, runners, and sprues ofthe gating system. Metal fins at the parting lines (lines on a castingcorresponding to the interface between the cope and drag of a mold) areremoved with chipping hammers and grinders. Residual refractory materialand oxides are typically removed by sand blasting or steel shot blasting, whichcan also be used to give the casting a uniform and more attractive surfaceappearance (U.S. EPA, 1992).
The cleaning of castings precedes any coating operations to ensure that thecoating will adhere to the metal. Chemical cleaning and coating operationsare often contracted out to off-site firms, but are sometimes carried out at thefoundries. Scale, rust, oxides, oil, grease, and dirt can be chemically removedfrom the surface using organic solvents (typically chlorinated solvents,although naphtha, methanol, and toluene are also used), emulsifiers,pressurized water, abrasives, alkaline agents (caustic soda, soda ash, alkalinesilicates, and phosphates), or acid pickling. The pickling process involves thecleaning of the metal surface with inorganic acids such as hydrochloric acid,sulfuric acid, or nitric acid. Castings generally pass from the pickling baththrough a series of rinses. Molten salt baths are also used to clean complexinterior passages in castings (U.S. EPA, 1992).
Castings are often given a coating to inhibit oxidation, resist deterioration, orimprove appearance. Common coating operations include: painting,electroplating, electroless nickel plating, hard facing, hot dipping, thermalspraying, diffusion, conversion, porcelain enameling, and organic or fused dry-resin coating (U.S. EPA, 1992).

Metal Casting Industry Industrial Process Description
Sector Notebook Project September 199735
Wastes GeneratedCasting quench water may contain phenols, oil and grease, suspended solids,and metals (e.g., copper, lead, zinc). Metal-bearing sludges may be generatedwhen quench baths are cleaned out (EPA, 1995).
Finishing operations may generate particulate air emissions. Wastewater maycontain cutting oils, ethylene glycol, and metals. Solid wastes include metalchips and spent cutting oils (EPA, 1995).
Cleaning and coating may generate air emissions of VOCs from painting,coating and solvent cleaning; acid mists and metal ion mists from anodizing,plating, polishing, hot dip coating, etching, and chemical conversion coating.Wastewater may contain solvents, metals, metal salts, cyanides, and high orlow pH. Solid wastes include cyanide and metal-bearing sludges, spentsolvents and paints, and spent plating baths (EPA, 1995).
III.A.6. Die Casting
The term “die casting” usually implies “pressure die casting.” The processutilizes a permanent die (metal mold) in which molten metal is forced underhigh pressure. Dies are usually made from two blocks of steel, eachcontaining part of the cavity, which are locked together while the casting isbeing made. Retractable and removable cores are used to form internalsurfaces. The metal is held under pressure until it cools and solidifies. Thedie halves are then opened and the casting is removed, usually by means of anautomatic ejection system. Dies are preheated and lubricated before beingused, and are either air- or water-cooled to maintain the desired operatingtemperature (Loper, 1985). Metal is typically melted on site from prealloyedingot, or by blending the alloying constituents (or occasionally metal scrap).Some aluminum die casters, however, purchase molten aluminum and storeit on site in a holding furnace (NADCA, 1996). Two basic types of diecasting machines are used: hot chamber and cold-chamber (see Figure 9).
Die casting machinesHot-chamber die casting machines are comprised of a molten metal reservoir,the die, and a metal-transferring device which automatically withdraws moltenmetal from the reservoir and forces it under pressure into the die. A steelpiston and cylinder system is often used to create the necessary pressurewithin the die. Pressures can range from a few hundred to over 5,000 psi.Certain metals, such as aluminum alloys, zinc alloys, and pure zinc cannot beused in hot-chamber die casting because they rapidly attack the iron in thepiston and cylinder. These metals, therefore, require a different type ofcasting machine, called a gooseneck. A gooseneck machine utilizes a cast-iron channel to transfer the molten metal from the reservoir to the die (seeFigure 9(b)). After the gooseneck is brought into contact with the die,
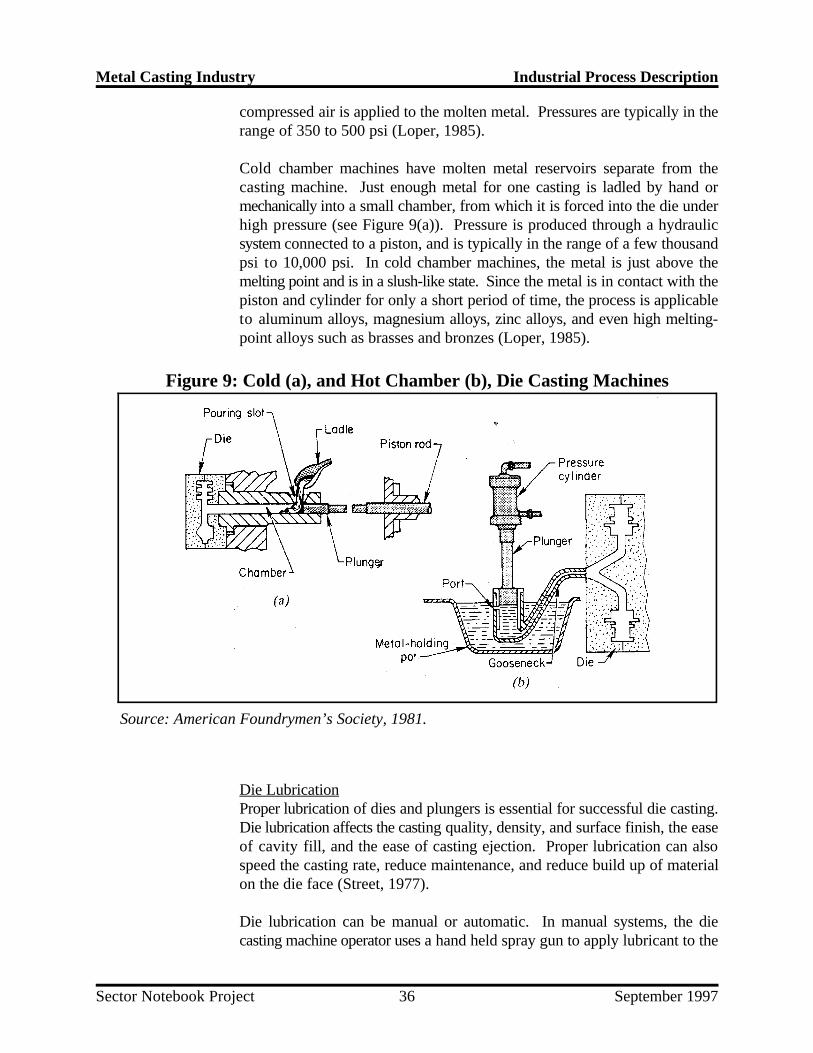
Metal Casting Industry Industrial Process Description
Sector Notebook Project September 199736
Figure 9: Cold (a), and Hot Chamber (b), Die Casting Machines
Source: American Foundrymen’s Society, 1981.
compressed air is applied to the molten metal. Pressures are typically in therange of 350 to 500 psi (Loper, 1985).
Cold chamber machines have molten metal reservoirs separate from thecasting machine. Just enough metal for one casting is ladled by hand ormechanically into a small chamber, from which it is forced into the die underhigh pressure (see Figure 9(a)). Pressure is produced through a hydraulicsystem connected to a piston, and is typically in the range of a few thousandpsi to 10,000 psi. In cold chamber machines, the metal is just above themelting point and is in a slush-like state. Since the metal is in contact with thepiston and cylinder for only a short period of time, the process is applicableto aluminum alloys, magnesium alloys, zinc alloys, and even high melting-point alloys such as brasses and bronzes (Loper, 1985).
Die LubricationProper lubrication of dies and plungers is essential for successful die casting.Die lubrication affects the casting quality, density, and surface finish, the easeof cavity fill, and the ease of casting ejection. Proper lubrication can alsospeed the casting rate, reduce maintenance, and reduce build up of materialon the die face (Street, 1977).
Die lubrication can be manual or automatic. In manual systems, the diecasting machine operator uses a hand held spray gun to apply lubricant to the

Metal Casting Industry Industrial Process Description
Sector Notebook Project September 199737
die surface just before the die is closed. Automatic systems use either fixedor reciprocating spray systems to apply lubricant (Allsop, 1983).
There are many types and formulations of lubricants on the market. No onelubricant meets the requirements for all die casters. The specific lubricantformulation used depends on a number of factors, including: the metal beingcast, the temperatures of casting, the lubricant application method, the surfacefinish requirements, the complexity of the casting, and the type of ejectionsystem. Although specific formulations are proprietary, in general, lubricantsare a mixture of a lubricant and a carrier material. Formulations may alsoinclude additives to inhibit corrosion, increase stability during storage, andresist bacterial degradation (Kaye, 1982).
Lubricants are mostly carrier material which evaporates upon contact with thehot die surface, depositing a thin uniform coating of die lubricant on the dieface. Typical ratios of carrier to lubricant are about 40 to 1 (Kaye, 1982).
Both water-based lubricants and solvent-based lubricants are in use today.Solvents, however, are largely being phased out due to health and fireconcerns associated with the large amounts of solvent vapors released.Water-based lubricants are now used almost exclusively in the U.S.Lubricating materials are typically mineral oils and waxes in water emulsions.Silicone oils and synthetic waxes are finding increased use. In addition,research is under way to develop a permanent release coating for die surfaceswhich will eliminate the need for repeated lubricant application (Kaye, 1982).
Advantages and DisadvantagesDie casting is not applicable to steel and high melting point alloys. Pressuredies are very expensive to design and produce, and the die casting machinesthemselves are major capital investments (LaRue, 1989). Therefore, tocompete with other casting methods, it must be more economical to producea component by virtue of higher production rates, or the finished componentsmust be superior to those produced using other methods -- often, it is acombination of both factors (USITC, 1984).
Once the reusable die has been prepared, the die casting process can sustainvery high production rates. Castings can be made at rates of more than 400per hour. There is a limit, however, to the number of castings produced in asingle die depending on the die design, the alloys being casted, and thedimensional tolerances required. The useable life span of a die can range fromunder 1,000 to over 5,000,000 castings or “shots.” (Allsop, 1983) Therefore,the design of the die itself is critical not only for producing high qualitycastings but also in ensuring the economic viability of the production process.Die design is a very complex exercise. In addition to the design of thecomponent geometry and constituent materials, numerous factors related to
Metal Casting Industry Industrial Process Description
Sector Notebook Project September 199738
the die itself must be considered, including: the type of alloys, the temperaturegradients within the die, the pressure and velocity of the molten metal whenit enters the die, the technique for ejecting the casting from the die, and thelubrication system used (Street, 1977). Computer-aided design and modelingof die designs is now commonplace and has played an important role inadvancing the technology.
One major advantage of die casting over other casting methods is that theproduced castings can have very complex shapes. The ability to cast complexshapes often makes it possible to manufacture a product from a single castinginstead of from an assembly of cast components. This can greatly reducecasting costs as well as costs associated with fabrication and machining.Furthermore, die casting produces castings having a high degree ofdimensional accuracy and surface definition compared to other castingmethods, which may also reduce or eliminate costly machining steps. Finally,castings with relatively thin wall sections can be produced using the diecasting method. This can result in substantial savings in material costs andreductions in component weight (Allsop, 1983).
Wastes GeneratedWastes generated during metal melting will be similar to those of metalmelting in foundries, depending on the particular furnace used. Relativelylittle waste is generated in the actual die casting process compared to othermetal casting processes. However, some gaseous and fume emissions occurduring metal injection. Metal oxide fumes are released as some of the metalvaporizes and condenses. Gaseous emissions can originate from: the moltenmetal itself; the evolution of chemicals from the lubricant as it is sprayed ontothe hot metal die; and as the molten metal contacts the lubricant (NADCA,1996).

Metal Casting Industry Industrial Process Description
Sector Notebook Project September 199739
III.B. Raw Materials Inputs and Pollution Outputs
Raw material inputs and pollutant outputs differ for foundries and die casters.The major difference lies in the use of permanent molds by die castingfacilities which eliminates any need for large mold making operations and thehandling, treatment and disposal of sand and other refractory materials. Forthis reason, the material inputs and pollutant outputs of permanent moldcasting foundries will likely be more similar to those of die casting facilities.Table 4 summarizes the material inputs and pollution outputs discussed in thissection.
III.B.1. Foundries
The main raw material inputs for foundries are sand and other core and moldrefractory materials (depending of the particular processes used), metals in theform of scrap and ingot, alloys, and fuel for metal melting. Other raw materialinputs include binders, fluxing agents, and pattern making materials.
Air Emissions
Air emissions at foundries primarily arise from metal melting, mold and coremaking, shakeout and sand handling, and the cleaning and finishing of castparts (Kotzin, 1992).
Furnaces and Metal MeltingFurnace air emissions consist of the products of combustion from the fuel andparticulate matter in the form of dusts, metallics, and metal oxide fumes.Carbon monoxide and organic vapors may also arise if oily scrap is chargedto the furnace or preheat system (AP-42, 1993). Particulates will varyaccording to the type of furnace, fuel (if used), metal melted, meltingtemperature, and a number of operating practices. Air emissions fromfurnaces and molten metal can often be reduced by applying a number of goodoperating practices (see Section V.A). Particulates can include fly ash,carbon, metallic dusts, and fumes from the volatilization and condensation ofmolten metal oxides. In steel foundries, these particulates may containvarying amounts of zinc, lead, nickel, cadmium, and chromium (Kotzin,1992). Carbon-steel dust can be high in zinc as a result of the use ofgalvanized scrap, while stainless steel dust is high in nickel and chromium.Painted scrap can result in particulates high in lead. Particulates associatedwith nonferrous metal production may contain copper, aluminum, lead, tin,and zinc. The particulate sizes of the oxide fumes are often very small(submicron) and, therefore, require high efficiency control devises (Licht,1992).

Metal Casting Industry Industrial Process Description
Sector Notebook Project September 199740
Furnace air emissions are typically captured in ventilation systems comprisedof hoods and duct work. Hoods and ducts are usually placed over and/or nearthe tapping spouts, and metal charging, slag removal, and pouring areas.Hoods can be permanently fixed at pouring stations or attached to the pouringladle or crane through flexible duct work. Depending on the type of furnaceand metals melted, these ventilation systems may be ducted to coolers to coolthe hot combustion gases, followed by baghouses, electrostatic precipitatorsand/or wet scrubbers to collect particulates. Afterburners may also be usedto control carbon monoxide and oil vapors (Licht, 1992).
Mold and Core MakingThe major air pollutants generated during mold and core making areparticulates from the handling of sand and other refractory materials, andVOCs from the core and mold curing and drying operations. VOCs,particulates, carbon monoxide, and other organic compounds are also emittedwhen the mold and core come into contact with the molten metal and whilethe filled molds are cooled (AP-42, 1993).
The use of organic chemical binding systems (e.g., cold box, hot box, no bake,etc.) may generate sulfur dioxide, ammonia, hydrogen sulfide, hydrogencyanide, nitrogen oxides and large number of different organic compounds.Emissions occur primarily during heating and curing, removal of the coresfrom core boxes, cooling, and pouring the metal into molds and may includea number of gases listed as hazardous air pollutants (HAPs) under the CleanAir Act. Potential HAPs emitted when using chemical binding systemsinclude: formaldehyde, methylene diphenyl diisocyanate (MDI), phenol,triethylamine, methanol, benzene, toluene, cresol/cresylic acid, napthalene,polycyclic-organics, and cyanide compounds (Twarog, 1993).
Some core-making processes use strongly acidic or basic substances forscrubbing the off gasses from the core making process. In the free radicalcure process, acrylic-epoxy binders are cured using an organic hydroperoxideand SO gas. Gasses are typically scrubbed to remove sulfur dioxide before2
release through the stack to the atmosphere. A wet scrubbing unit absorbs theSO gas. A 5 to 10 percent solution of sodium hydroxide at a pH of 8 to 142
neutralizes the SO and prevents the by-product (sodium sulfite) from2
precipitating out of solution (U.S. EPA, 1992).
Amine scrubbers may be used for sulfur dioxide control by foundries. Inamine scrubbing the gas containing sulfur dioxide is first passed through acatalyst bed, where the sulfur compounds are converted to hydrogen sulfide.The gas stream then enters a packed or trayed tower (scrubber) where it iscontacted with a solution of water and an organic amine. The amine solutionis alkaline and the weakly acidic hydrogen sulfide in the gas stream dissolvesin it. The amine solution with hydrogen sulfide is then sent to a stripping

Metal Casting Industry Industrial Process Description
Sector Notebook Project September 199741
tower, where it is boiled and the acid gases stripped out. The amine solutionis cooled and returned to the scrubbing tower for reuse. Acid gases arecooled and treated through neutralization. A number of amines are usedincluding diethanolamine (DEA), monoethanolamine (MEA), andmethyldiethanolamine (MDEA). Air emissions from the amine scrubbers mayinclude some H S and other sulfur compounds. (Scott, 1992).2
Shakeout, Finishing, and Sand HandlingShakeout and sand handling operations generate dust and metallicparticulates. Finishing and cleaning operations will generate metallicparticulates from deburring, grinding, sanding and brushing, and volatileorganic compounds from the application of rust inhibitors or organic coatingssuch as paint. Control systems involve hoods and ducts at key dust generatingpoints followed by baghouses, electrostatic precipitators, or wet scrubbers(AFS Air Quality Committee, 1992).
Wastewater
Wastewater mainly consists of noncontact cooling water and wet scrubbereffluent (Leidel, 1995). Noncontact cooling water can typically be dischargedto the POTW or to surface waters under an NPDES permit. Wet scrubberwastewater in facilities using large cupola furnaces can be generated in largequantities (up to 3,000 gallons per minute). This water is typically highlyalkaline or acidic and is neutralized before being discharged to the POTW(AFS Air Quality Committee, 1992). If amine scrubbers are used, aminescrubbing solution can be released to the plant effluent system through leaksand spills. Some foundries using cupola furnaces also generate wastewatercontaining metals from cooling slag with water. Wastewater may also begenerated in certain finishing operations such as quenching and deburring.Such wastewater can be high in oil and suspended solids (NADCA, 1996).
Residual Wastes
Residual wastes originate from many different points within foundries. Wastesand is by far the largest volume waste for the industry. Other residual wastesmay include dust from dust collection systems, slag, spent investment castingrefractory material, off-spec products, resins, spent solvents and cleaners,paints, and other miscellaneous wastes.
Furnaces and Metal MeltingThe percentage of metal from each charge that is converted to dust or fumesand collected by baghouses, electrostatic precipitators, or wet scrubbers canvary significantly from facility to facility depending on the type of furnaceused and the type of metal cast. In steel foundries, this dust contains varyingamounts of zinc, lead, nickel, cadmium, and chromium. Carbon-steel dust
Metal Casting Industry Industrial Process Description
Sector Notebook Project September 199742
tends to be high in zinc as a result of the use of galvanized scrap, whilestainless steel dust is high in nickel and chromium. Dust high in lead mayresult from the use of scrap painted with leaded paint. Dust associated withnonferrous metal production may contain copper, aluminum, lead, tin, andzinc. Steel dust may be encapsulated and disposed of in a permitted landfill,while nonferrous dust is often sent to a recycler for metal recovery.
Slag is a glassy mass with a complex chemical structure. It can constituteabout 25 percent of a foundry’s solid waste stream (Kotzin, 1995). Slag iscomposed of metal oxides from the melting process, melted refractories, sand,coke ash (if coke is used), and other materials. Large quantities of slag aregenerated in particular from iron foundries that melt in cupola furnaces.Fluxes are used to facilitate removal of contaminants from the molten metalinto the slag so that it can be removed from the molten metal surface.Hazardous slag may be produced in melting operations if the charge materialscontain toxic metals such as lead, cadmium, or chromium. To produce ductileiron by reducing the sulfur content of iron, some foundries use calciumcarbide desulfurization and the slag generated by this process may beclassified as a reactive waste (U.S. EPA, 1992).
Mold and Core MakingThose core-making processes that use strongly acidic or basic substances forscrubbing the off gasses from the core making process may generate sludgesor liquors. These sludges or liquors are typically pH controlled prior todischarge to the sewer system as nonhazardous waste. If not properly treated,the waste may be classified as hazardous corrosive waste and thus subjectedto numerous federal, state and local mandates (U.S. EPA, 1992).
Shakeout and Sand HandlingFoundries using sand molds and cores generate large volumes of waste sands.Waste foundry sand can account for 65 to 90 percent of the total wastegenerated by foundries. In many foundries, casting sands are recycledinternally until they can no longer be used. Some foundries reclaim wastesands so that they can be recycled to the process or recycled off-site foranother use (see Section V.A.1). Sand that can no longer be used by iron orsteel foundries, is often landfilled as nonhazardous waste. Casting sands usedin the production of brass or bronze castings may exhibit toxicitycharacteristic for lead or cadmium. The hazardous sand may be reclaimed ina thermal treatment unit which may be subject to RCRA requirements forhazardous waste incinerators (see Section VI.B) (U.S. EPA, 1992).Approximately two percent of all foundry spent sand is hazardous (Kotzin,1995).

Metal Casting Industry Industrial Process Description
Sector Notebook Project September 199743
Investment casting shells can be used only once and are disposed in landfillsas a nonhazardous waste unless condensates from heavy metal alloyconstituents are present in the shells.
Most foundries generate miscellaneous residual waste that varies greatly incomposition, but makes up only a small percentage of the total waste. Thiswaste includes welding materials, waste oil from heavy equipment andhydraulics, empty binder drums, and scrubber lime (U.S. EPA, 1992).
III.B.2. Die Casters
The main raw material inputs for die casters include: metal in the form ofingot, molten metal, metal scrap, alloys, and fuel for metal melting. Other rawmaterial inputs include: fluxing agents, die lubricants, refractory materials,hydraulic fluid, and finishing and cleaning materials.
Air Emissions
Furnace air emissions consist of the products of combustion from the fuel andparticulate matter in the form of dusts, metallics, and metal oxide fumes.Carbon monoxide and oil vapors may also arise if oily scrap is charged to thefurnace or preheat system. Metallic particulates arise mainly from thevolatilization and condensation of molten metal oxides. These will varyaccording to the type of furnace, fuel, metal, melting temperature, and anumber of operating practices. The particulate sizes of the oxide fumes areoften very small (submicron) and may contain copper, aluminum, lead, tin, andzinc (Licht, 1992).
Fluxing and dross removal operations to remove impurities from the moltenmetal can also be the source of air emissions. Die casters can use a numberof different fluxing agents to remove different impurities, including: sulfurhexafluoride, solvent fluxes, aluminum fluoride, or chlorine. Metallicparticulates, the fluxing agents themselves, and products of chemical reactionswith impurities can be emitted from the molten metal surface or from thesubsequently removed dross as it cools. For example, if chlorine is used, itmay react with aluminum and water in the atmosphere to form aluminumoxide fumes and hydrochloric acid. Although not always necessary,particulate emissions control equipment, such as fabric bag filters, aresometimes used to control furnace emissions at die casting facilities (NADCA,1996).
Die lubrication and plunger tip lubrication can also be a significant source ofair releases from die casting facilities. Both oil- and water-based dielubricants are used. Oil-based lubricants typically contain naphtha and resultin much higher emissions of volatile organic compounds than water-based
Metal Casting Industry Industrial Process Description
Sector Notebook Project September 199744
lubricants. The air emissions will depend on the specific formulation of thelubricant product and may contain hazardous air pollutants (NADCA, 1996).
Other air emissions arise from finishing and cleaning operations whichgenerate metallic particulates from deburring, grinding, sanding and brushing,and volatile organic compounds from the application of rust inhibitors orpaint. Casting quench tanks for the cooling of zinc castings can containvolatile organic compounds and water treatment chemicals resulting inpotential emissions of volatile organic compounds and hazardous airpollutants (NADCA, 1996).
Wastewater
Both process wastewater and waste noncontact cooling water may begenerated at die casting facilities. Noncontact cooling water will likey haveelevated temperature and very little or no chemical contamination. Processwastewater from die casting facilities can be contaminated with spent dielubricants, hydraulic fluid and coolants. Contaminants in such wastewater aretypically oil and phenols. As with foundries, die casters may also generatewastewater in certain finishing operations such as in-process cleaning,quenching and deburring. Such wastewater can be high in oil and suspendedsolids. Typical wastewater treatment at die casting facilities consists ofoil/water separation and/or filtration before discharge to a POTW. Facilitiesgenerating large volumes of wastewater may also utilize biological treatment(NADCA, 1996).
Residual Wastes
Residual waste streams from die casting facilities are relatively smallcompared to most sand casting foundries. Typical residual wastes include:slag or dross generated from molten metal surfaces; refractory materials fromfurnaces and ladles; metallic fines, spent shot (plunger) tips, tools, heatingcoils, hydraulic fluid, floor absorbent, abrasive cutting belts and wheels,quench sludge, and steel shot. Most residual wastes from die casting facilitiesare sent off-site for disposal as a non-hazardous waste. Waste dross is usuallysent to secondary smelters for metal recovery. Waste oils, lubricants andhydraulic fluids may be sent off-site for recycling or energy recovery(NADCA, 1996).

Metal Casting Industry Industrial Process Description
Sector Notebook Project September 199745
Table 4: Summary of Material Inputs and Potential Pollutant Outputsfor the Metal Casting Industry
Industrial Material ResidualProcess Inputs Air Emissions Wastewater Wastes
Pattern Making Wood, plastic, VOCs from glues, Little or no Scrap patternmetal, wax, epoxies, and paints. wastewater generated materialspolystyrene
Mold and Core Preparation and PouringGreen Sand Green sand Particulates, metal oxide Wastewater Waste green sand
and fumes, carbon containing metals, and core sandchemically- monoxide, organic elevated temperature, potentiallybonded sand compounds, hydrogen phenols and other containing metalscores sulfide, sulfur dioxide, organics from wet
and nitrous oxide. Also, dust collectionbenzene, phenols, and systems and moldother hazardous air cooling waterpollutants (HAPs) ifchemically bonded coresare used.
Chemical Binding Sand and Particulates, metallic Scrubber wastewater Waste mold andSystems chemical oxide fumes, carbon with amines or high core sand
binders monoxide, ammonia, or low pH; and potentiallyhydrogen sulfide, wastewater containing containing metalshydrogen cyanide, sulfur metals, elevated and residualdioxide, nitrogen oxides, temperature, phenols chemical bindersand other HAPs and other organics
from wet dustcollection systems andmold cooling water
Permanent Mold Steel mold, Particulates, metallic Waste cooling water Waste core sandpermanent, oxide fumes with elevated or plastersand. plaster, temperature and potentiallyor salt cores wastewater with low containing metals
pH and high indissolved salts ifsoluble salt cores areused
Plaster Mold Plaster mold Particulates, metallic Little or no Spent plastermaterial oxide fumes wastewater generated
Investment/Lost Wax Refractory Particulates, metallic Wastewater with low Waste refractoryslurry, and wax oxide fumes pH and high in material, waxesor plastic dissolved salts if and plastics
soluble salt cores areused
Lost Foam Refractory Particulates, metallic Little or no Waste sand andslurry, oxide fumes, wastewater generated refractory materialpolystyrene polystyrene vapors and potentially
HAPs containing metalsand styrene

Metal Casting Industry Industrial Process Description
Industrial Material ResidualProcess Inputs Air Emissions Wastewater Wastes
Sector Notebook Project September 199746
Furnace Charge Preparation and Metal MeltingCharging and Melting Metal scrap, Products of combustion, Scrubber wastewater Spent refractory
ingot and oil vapors, particulates, with high pH, slag materialreturned metallic oxide fumes cooling water with potentiallycastings metals, and non- containing metals
contact cooling water and alloys
Fluxing and Slag and Fluxing agents Particulates, metallic Wastewater Dross and slagDross Removal oxide fumes, solvents, containing metals if potentially
hydrochloric acid slag quench is utilized containing metals
Pouring Ladles and Particulates, metallic Little or no Spent ladles andother refractory oxide fumes wastewater generated refractorymaterials materials
potentiallycontaining metals
Quenching, Finishing, Cleaning and CoatingPainting and rust Paint and rust VOCs Little or no Spent containersinhibitor application inhibitor wastewater generated and applicators
Cleaning , quenching, Unfinished VOCs, dust and metallic Waste cleaning and Spent solvents,grinding, cutting castings, water, particulates cooling water with steel shot, metallic
steel shot, elevated temperature, particulates,solvents solvents, oil and cutting wheels,
grease, and suspended metallic filings,solids dust from
collection systems,and wastewatertreatment sludge
Shakeout,Cooling andSand Handling
Water and Dust and metallic Wet scrubber Waste foundrycaustic for wet particulates; VOC and wastewater with high sand and dust fromscrubbers organic compounds or low pH or amines, collection systems,
from thermal sand permanent mold metaltreatment systems contact cooling water
with elevatedtemperature, metalsand mold coating
Die Casting1 Metal, fuel, VOCs from die and Waste cooling water Waste hydrauliclubricants, plunger tip lubrication with elevated fluid, lubricants,fluxing agents, temperature and floor absorbent,hydraulic fluid wastewater and plunger tips
contaminated with oil,and phenols
Furnaces, metal melting, finishing, cleaning, and coating operations also apply to die casting.1

Metal Casting Industry Industrial Process Description
Sector Notebook Project September 199747
III.C. Management of Chemicals in Wastestream
The Pollution Prevention Act of 1990 (PPA) requires facilities to reportinformation about the management of Toxic Release Inventory (TRI)chemicals in waste and efforts made to eliminate or reduce those quantities.These data have been collected annually in Section 8 of the TRI reportingForm R beginning with the 1991 reporting year. The data summarized belowcover the years 1993-1996 and are meant to provide a basic understanding ofthe quantities of waste handled by the industry, the methods typically used tomanage this waste, and recent trends in these methods. TRI wastemanagement data can be used to assess trends in source reduction withinindividual industries and facilities, and for specific TRI chemicals. Thisinformation could then be used as a tool in identifying opportunities forpollution prevention compliance assistance activities.
While the quantities reported for 1994 and 1995 are estimates of quantitiesalready managed, the quantities listed by facilities for 1996 and 1997 areprojections only. The PPA requires these projections to encourage facilitiesto consider future source reduction, not to establish any mandatory limits.Future-year estimates are not commitments that facilities reporting under TRIare required to meet.
Foundries
Table 5 shows that the TRI reporting foundries managed about 272 millionpounds of production related wastes (total quantity of TRI chemicals in thewaste from routine production operations in column B) in 1995. From theyearly data presented in column B, the total quantity of production relatedTRI wastes increased between 1994 and 1995. This is likely in part becausethe number of chemicals on the TRI list nearly doubled between those years.Production related wastes were projected to decrease in 1996 and 1997. Theeffects of production increases and decreases on the amount of wastesgenerated are not evaluated here.
Values in Column C are intended to reveal the percent of production-relatedwaste (about 40 percent) either transferred off-site or released to theenvironment. Column C is calculated by dividing the total TRI transfers andreleases by the total quantity of production-related waste. Column C showsa decrease in the amount of wastes either transferred off-site or released to theenvironment from 43 percent in 1994 to 40 percent in 1995. In other words,about 60 percent of the industry’s TRI wastes were managed on-site throughrecycling, energy recovery, or treatment as shown in columns D, E, and F,respectively. Most of these on-site managed wastes were recycled on-site,typically in a metals recovery process. The majority of waste that is releasedor transferred off-site can be divided into portions that are recycled off-site,
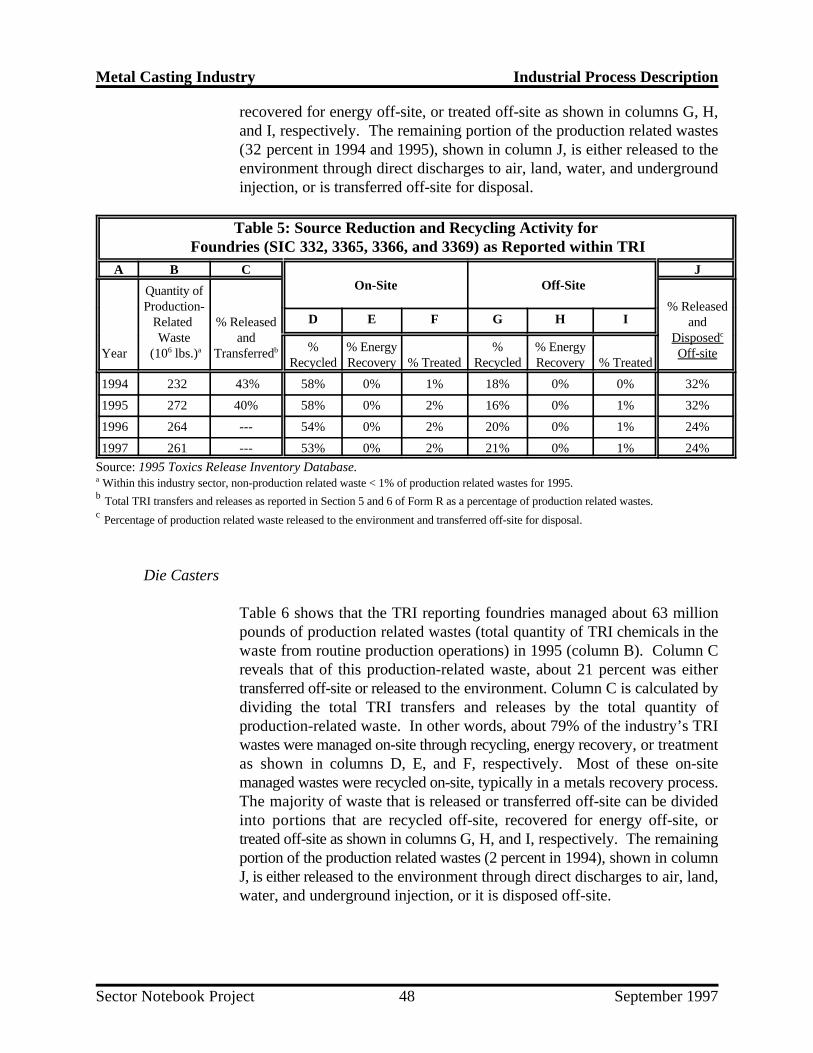
Metal Casting Industry Industrial Process Description
Sector Notebook Project September 199748
recovered for energy off-site, or treated off-site as shown in columns G, H,and I, respectively. The remaining portion of the production related wastes(32 percent in 1994 and 1995), shown in column J, is either released to theenvironment through direct discharges to air, land, water, and undergroundinjection, or is transferred off-site for disposal.
Table 5: Source Reduction and Recycling Activity for Foundries (SIC 332, 3365, 3366, and 3369) as Reported within TRI
A B C JOn-Site Off-Site
Year (10 lbs.) Transferred Off-site
Quantity ofProduction- % Released
Related % Released andWaste and Disposed
6 a b
c
D E F G H I
% % Energy % % EnergyRecycled Recovery % Treated Recycled Recovery % Treated
1994 232 43% 58% 0% 1% 18% 0% 0% 32%
1995 272 40% 58% 0% 2% 16% 0% 1% 32%
1996 264 --- 54% 0% 2% 20% 0% 1% 24%
1997 261 --- 53% 0% 2% 21% 0% 1% 24%
Source: 1995 Toxics Release Inventory Database. Within this industry sector, non-production related waste < 1% of production related wastes for 1995.a
Total TRI transfers and releases as reported in Section 5 and 6 of Form R as a percentage of production related wastes.b
Percentage of production related waste released to the environment and transferred off-site for disposal.c
Die Casters
Table 6 shows that the TRI reporting foundries managed about 63 millionpounds of production related wastes (total quantity of TRI chemicals in thewaste from routine production operations) in 1995 (column B). Column Creveals that of this production-related waste, about 21 percent was eithertransferred off-site or released to the environment. Column C is calculated bydividing the total TRI transfers and releases by the total quantity ofproduction-related waste. In other words, about 79% of the industry’s TRIwastes were managed on-site through recycling, energy recovery, or treatmentas shown in columns D, E, and F, respectively. Most of these on-sitemanaged wastes were recycled on-site, typically in a metals recovery process.The majority of waste that is released or transferred off-site can be dividedinto portions that are recycled off-site, recovered for energy off-site, ortreated off-site as shown in columns G, H, and I, respectively. The remainingportion of the production related wastes (2 percent in 1994), shown in columnJ, is either released to the environment through direct discharges to air, land,water, and underground injection, or it is disposed off-site.
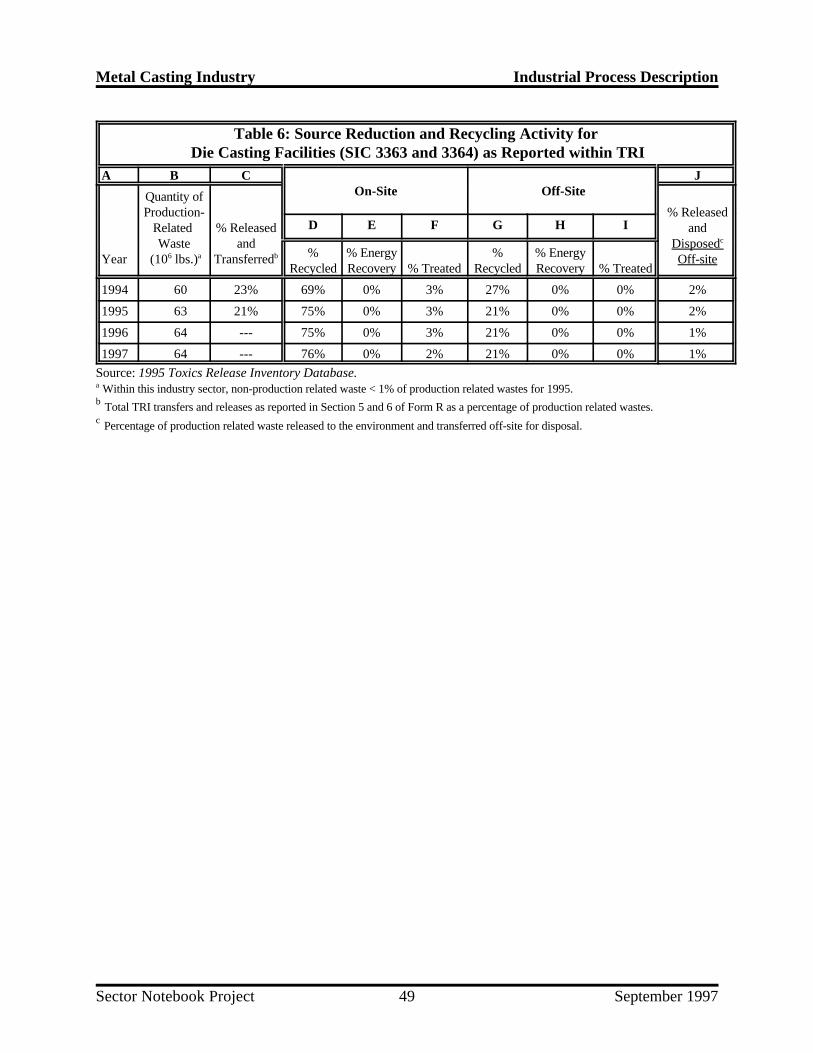
Metal Casting Industry Industrial Process Description
Sector Notebook Project September 199749
Table 6: Source Reduction and Recycling Activity for Die Casting Facilities (SIC 3363 and 3364) as Reported within TRI
A B C JOn-Site Off-Site
Year (10 lbs.) Transferred Off-site
Quantity ofProduction- % Released
Related % Released andWaste and Disposed
6 a b
c
D E F G H I
% % Energy % % EnergyRecycled Recovery % Treated Recycled Recovery % Treated
1994 60 23% 69% 0% 3% 27% 0% 0% 2%
1995 63 21% 75% 0% 3% 21% 0% 0% 2%
1996 64 --- 75% 0% 3% 21% 0% 0% 1%
1997 64 --- 76% 0% 2% 21% 0% 0% 1%
Source: 1995 Toxics Release Inventory Database. Within this industry sector, non-production related waste < 1% of production related wastes for 1995.a
Total TRI transfers and releases as reported in Section 5 and 6 of Form R as a percentage of production related wastes.b
Percentage of production related waste released to the environment and transferred off-site for disposal.c

Page 50 intentionally left blank.

Metal Casting Industry Chemical Releases and Transfers
Sector Notebook Project September 199751
IV. CHEMICAL RELEASE AND TRANSFER PROFILE
This section is designed to provide background information on the pollutantreleases that are reported by this industry. The best source of comparativepollutant release information is the Toxic Release Inventory (TRI). Pursuantto the Emergency Planning and Community Right-to-Know Act, TRI includesself-reported facility release and transfer data for over 600 toxic chemicals.Facilities within SIC Codes 20 through 39 (manufacturing industries) thathave more than 10 employees, and that are above weight-based reportingthresholds are required to report TRI on-site releases and off-site transfers.The information presented within the sector notebooks is derived from themost recently available (1995) TRI reporting year (which includes over 600chemicals), and focuses primarily on the on-site releases reported by eachsector. Because TRI requires consistent reporting regardless of sector, it isan excellent tool for drawing comparisons across industries. TRI data providethe type, amount and media receptor of each chemical released or transferred.
Although this sector notebook does not present historical informationregarding TRI chemical releases over time, please note that in general, toxicchemical releases have been declining. In fact, according to the 1995 ToxicRelease Inventory Public Data Release, reported onsite releases of toxicchemicals to the environment decreased by 5 percent (85.4 million pounds)between 1994 and 1995 (not including chemicals added and removed from theTRI chemical list during this period). Reported releases dropped by 46percent between 1988 and 1995. Reported transfers of TRI chemicals to off-site locations increased by 0.4 percent (11.6 million pounds) between 1994and 1995. More detailed information can be obtained from EPA's annualToxics Release Inventory Public Data Release book (which is availablethrough the EPCRA Hotline at 800-535-0202), or directly from the ToxicRelease Inventory System database (for user support call 202-260-1531).
Wherever possible, the sector notebooks present TRI data as the primaryindicator of chemical release within each industrial category. TRI dataprovide the type, amount and media receptor of each chemical released ortransferred. When other sources of pollutant release data have been obtained,these data have been included to augment the TRI information.
TRI Data Limitations
Certain limitations exist regarding TRI data. Release and transfer reportingare limited to the approximately 600 chemicals on the TRI list. Therefore, alarge portion of the emissions from industrial facilities are not captured byTRI. Within some sectors, (e.g. dry cleaning, printing and transportationequipment cleaning) the majority of facilities are not subject to TRI reportingbecause they are not considered manufacturing industries, or because they are

Metal Casting Industry Chemical Releases and Transfers
Sector Notebook Project September 199752
below TRI reporting thresholds. For these sectors, release information fromother sources has been included. In addition, many facilities report more thanone SIC code reflecting the multiple operations carried out onsite. Therefore,reported releases and transfers may or may not all be associated with theindustrial operations described in this notebook.
The reader should also be aware that TRI "pounds released" data presentedwithin the notebooks is not equivalent to a "risk" ranking for each industry.Weighting each pound of release equally does not factor in the relativetoxicity of each chemical that is released. The Agency is in the process ofdeveloping an approach to assign toxicological weightings to each chemicalreleased so that one can differentiate between pollutants with significantdifferences in toxicity. As a preliminary indicator of the environmental impactof the industry's most commonly released chemicals, the notebook brieflysummarizes the toxicological properties of the top five chemicals (by weight)reported by each industry.
Definitions Associated With Section IV Data Tables
General Definitions
SIC Code -- the Standard Industrial Classification (SIC) is a statisticalclassification standard used for all establishment-based Federal economicstatistics. The SIC codes facilitate comparisons between facility and industrydata.
TRI Facilities -- are manufacturing facilities that have 10 or more full-timeemployees and are above established chemical throughput thresholds.Manufacturing facilities are defined as facilities in Standard IndustrialClassification primary codes 20-39. Facilities must submit estimates for allchemicals that are on the EPA's defined list and are above throughputthresholds.
Data Table Column Heading Definitions
The following definitions are based upon standard definitions developed byEPA’s Toxic Release Inventory Program. The categories below represent thepossible pollutant destinations that can be reported.
RELEASES -- are an on-site discharge of a toxic chemical to theenvironment. This includes emissions to the air, discharges to bodies ofwater, releases at the facility to land, as well as contained disposal intounderground injection wells.
Metal Casting Industry Chemical Releases and Transfers
Sector Notebook Project September 199753
Releases to Air (Point and Fugitive Air Emissions) -- Include all airemissions from industry activity. Point emissions occur through confined airstreams as found in stacks, vents, ducts, or pipes. Fugitive emissions includeequipment leaks, evaporative losses from surface impoundments and spills,and releases from building ventilation systems.
Releases to Water (Surface Water Discharges) -- encompass any releasesgoing directly to streams, rivers, lakes, oceans, or other bodies of water.Releases due to runoff, including storm water runoff, are also reportable toTRI.
Releases to Land -- occur within the boundaries of the reporting facility.Releases to land include disposal of toxic chemicals in landfills, landtreatment/application farming, surface impoundments, and other land disposalmethods (such as spills, leaks, or waste piles).
Underground Injection -- is a contained release of a fluid into a subsurfacewell for the purpose of waste disposal. Wastes containing TRI chemicals areinjected into either Class I wells or Class V wells. Class I wells are used toinject liquid hazardous wastes or dispose of industrial and municipalwastewater beneath the lowermost underground source of drinking water.Class V wells are generally used to inject non-hazardous fluid into or abovean underground source of drinking water. TRI reporting does not currentlydistinguish between these two types of wells, although there are importantdifferences in environmental impact between these two methods of injection.
TRANSFERS -- is a transfer of toxic chemicals in wastes to a facility that isgeographically or physically separate from the facility reporting under TRI.Chemicals reported to TRI as transferred are sent to off-site facilities for thepurpose of recycling, energy recovery, treatment, or disposal. The quantitiesreported represent a movement of the chemical away from the reportingfacility. Except for off-site transfers for disposal, the reported quantities donot necessarily represent entry of the chemical into the environment.
Transfers to POTWs -- are wastewater transferred through pipes or sewersto a publicly owned treatments works (POTW). Treatment or removal of achemical from the wastewater depend on the nature of the chemical, as wellas the treatment methods present at the POTW. Not all TRI chemicals canbe treated or removed by a POTW. Some chemicals, such as metals, may beremoved, but are not destroyed and may be disposed of in landfills ordischarged to receiving waters.
Transfers to Recycling -- are sent off-site for the purposes of regeneratingor recovery by a variety of recycling methods, including solvent recovery,metals recovery, and acid regeneration. Once these chemicals have been
Metal Casting Industry Chemical Releases and Transfers
Sector Notebook Project September 199754
recycled, they may be returned to the originating facility or sold commercially.
Transfers to Energy Recovery -- are wastes combusted off-site in industrialfurnaces for energy recovery. Treatment of a chemical by incineration is notconsidered to be energy recovery.
Transfers to Treatment -- are wastes moved off-site to be treated througha variety of methods, including neutralization, incineration, biologicaldestruction, or physical separation. In some cases, the chemicals are notdestroyed but prepared for further waste management.
Transfers to Disposal -- are wastes taken to another facility for disposalgenerally as a release to land or as an injection underground.

Metal Casting Industry Chemical Releases and Transfers
Sector Notebook Project September 199755
IV.A. EPA Toxic Release Inventory for the Metal Casting Industry
This section summarizes TRI data of ferrous and nonferrous foundriesreporting SIC codes 332, 3365, 3366, and 3369, and ferrous and nonferrousdie casting facilities reporting SIC codes 3363 and 3364 as the primary SICcode for the facility. Of the 2,813 metal casting establishments reported bythe 1992 Census of Manufacturers, 654 reported to TRI in 1995.
Ferrous and nonferrous foundries made up 85 percent (554 facilities) of metalcasting facilities reporting to TRI and accounted for about 89 percent of thetotal metal casting TRI releases and transfers for metal casting facilities in1995. Die casters made up 15 percent (100 facilities) of metal castingfacilities and reported the remaining 11 percent of the total releases andtransfers. Because the TRI information differs for foundries and die casters,the releases and transfers for these two industry segments are presentedseparately below.
IV.A.1. Toxic Release Inventory for Ferrous and Nonferrous Foundries
According to the 1995 TRI data, the reporting ferrous and nonferrousfoundries released and transferred a total of approximately 109 million poundsof pollutants during calendar year 1995. These releases and transfers aredominated by large volumes of metallic wastes. Evidence of the diversity ofprocesses at foundries reporting to TRI is found in the fact that the mostfrequently reported chemical (copper) is reported by only 45 percent of thefacilities and over half of the TRI chemicals were reported by fewer than tenfacilities. The variability in facilities’ pollutant profiles may be attributable tothe large number of different types of foundry processes and products. Forexample, foundries casting only ferrous parts will have different pollutantprofiles than those foundries casting both ferrous and nonferrous products.
Releases
Releases to the air, water, and land accounted for 33 percent (36 millionpounds) of foundries’ total reportable chemicals. Of these releases, 70percent go to onsite land disposal, and about 75 percent are fugitive or pointsource air emissions (See Table 7). Metallic wastes accounted for over 95percent of the industry’s releases. Manganese, zinc, chromium, and leadaccount for over 95 percent of the on-site land disposal. The industry’s airreleases are associated with volatilization, fume or aerosol formation in thefurnaces and byproduct processing. Lighter weight organics, such asmethanol, acids and metal contaminants found in scrap metal are the principaltypes of TRI chemicals released to the air. In addition to air releases ofchemicals reported to TRI, foundries are often a source of particulates, carbonmonoxide, nitrogen oxides and sulfur compounds due to sand handling

Metal Casting Industry Chemical Releases and Transfers
Sector Notebook Project September 199756
operations, curing of chemical binders, and combustion of fossil fuels.Methanol, trichloroethylene and other solvent releases account for most of thefugitive releases (approximately 61 percent).
Transfers
Off-site transfers of TRI chemicals account for 69 percent of foundries’ totalTRI-reportable chemicals (74 million pounds). Almost 57 percent of theindustry’s total TRI wastes (42 million pounds) are metallic wastes that weretransferred off-site for recycling, typically for recovery of the metal content.Metallic wastes account for approximately 95 percent of the industry’stransfers. About 61 percent of off-site transfers reported by foundries are sentoff-site for recycling. Copper, manganese, zinc, chromium, nickel, and leadare the six metals transferred in the greatest amounts and number of facilities(See Table 8). TRI chemicals sent off-site for disposal (primarily manganese,zinc, chromium, and copper) account for 31 percent of transfers. Less thanthree percent of the remaining transfers from foundries go to treatment off-site, discharge to POTWs, and energy recovery.
After metals, the next largest volume of chemicals transferred are acidsincluding: sulfuric acid, nitric acid, phosphoric acid, and hydrochloric acid.Spent acids can be generated in wet scrubber systems. In addition, acids areoften used to clean and finish the surfaces of the metal castings before platingor coating. The spent acids are often sent off-site for recycling or fortreatment. Solvents and other light weight organic compounds are frequentlyreported but account for a relatively small amount of total transfers. Solventsare used frequently for cleaning equipment and cast parts. The primarysolvents and light weight organics include: phenol, xylene, 1,2,4-trimethylbenzene, 1,1,1-trichloroethane, trichloroethylene, methanol, andtoluene. Transferred solvents are mostly sent off-site for disposal or recycling.Phenols and phenoisocyanates are frequently reported but amount to less thanone percent of the total TRI pounds transferred. Phenols are often found inchemical binding systems and may be present in waste sand containingchemical binders (AFS and CISA, 1992).
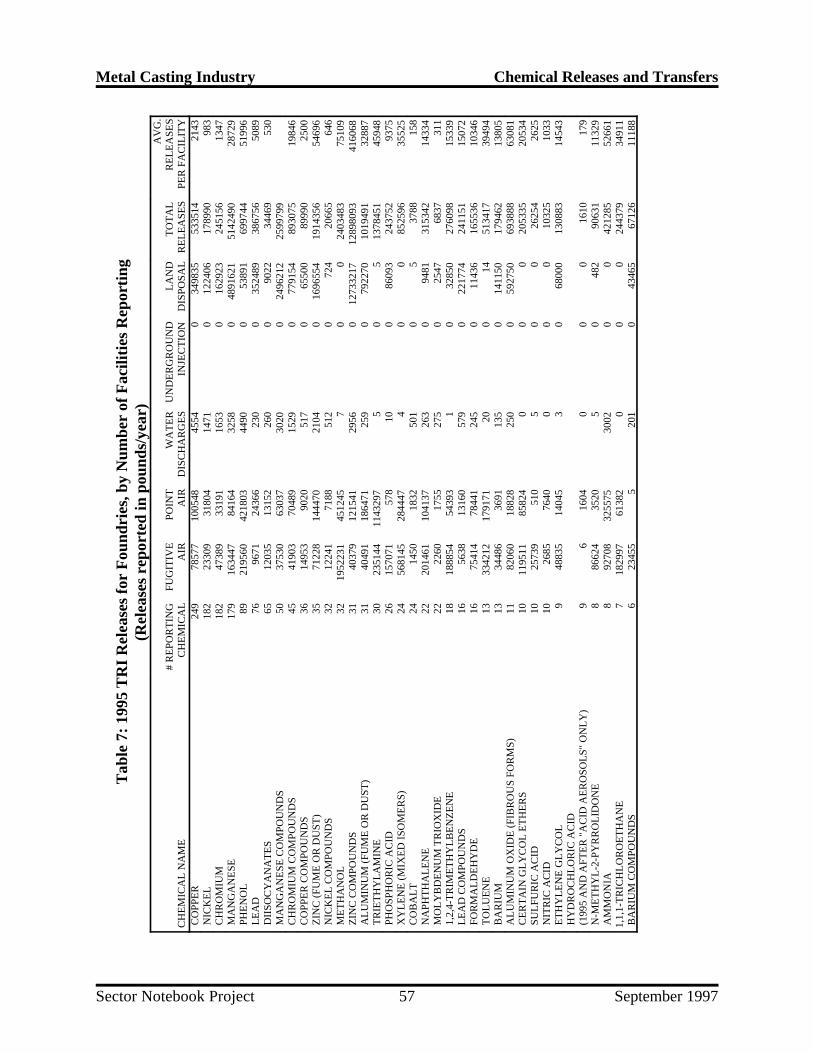
Metal Casting Industry Chemical Releases and Transfers
Sector Notebook Project September 199757
Tab
le 7
: 19
95 T
RI
Rel
ease
s fo
r F
ound
ries
, by
Num
ber
of F
acili
ties
Rep
orti
ng(R
elea
ses
repo
rted
in p
ound
s/ye
ar)
CH
EM
ICA
L N
AM
E#
RE
POR
TIN
GC
HE
MIC
AL
FUG
ITIV
EA
IRPO
INT
AIR
WA
TE
RD
ISC
HA
RG
ES
UN
DE
RG
RO
UN
DIN
JEC
TIO
NL
AN
DD
ISPO
SAL
TO
TA
LR
EL
EA
SES
AV
G.
RE
LE
ASE
SPE
R F
AC
ILIT
Y C
OPP
ER
249
7857
710
0548
4554
034
9835
5335
1421
43 N
ICK
EL
182
2330
931
804
1471
012
2406
1789
9098
3 C
HR
OM
IUM
182
4738
933
191
1653
016
2923
2451
5613
47 M
AN
GA
NE
SE17
916
3447
8416
432
580
4891
621
5142
490
2872
9 P
HE
NO
L89
2195
6042
1803
4490
053
891
6997
4451
996
LE
AD
7696
7124
366
230
035
2489
3867
5650
89 D
IISO
CY
AN
AT
ES
6512
035
1315
226
00
9022
3446
953
0 M
AN
GA
NE
SE C
OM
POU
ND
S50
3753
063
037
3020
024
9621
225
9979
9 C
HR
OM
IUM
CO
MPO
UN
DS
4541
903
7048
915
290
7791
5489
3075
1984
6 C
OPP
ER
CO
MPO
UN
DS
3614
953
9020
517
065
500
8999
025
00 Z
INC
(FU
ME
OR
DU
ST)
3571
228
1444
7021
040
1696
554
1914
356
5469
6 N
ICK
EL
CO
MPO
UN
DS
3212
241
7188
512
072
420
665
646
ME
TH
AN
OL
3219
5223
145
1245
70
024
0348
375
109
ZIN
C C
OM
POU
ND
S31
4037
912
1541
2956
012
7332
1712
8980
9341
6068
AL
UM
INU
M (
FUM
E O
R D
UST
)31
4049
118
6471
259
079
2270
1019
491
3288
7 T
RIE
TH
YL
AM
INE
3023
5144
1143
297
50
513
7845
145
948
PH
OSP
HO
RIC
AC
ID26
1570
7157
810
086
093
2437
5293
75 X
YL
EN
E (
MIX
ED
ISO
ME
RS)
2456
8145
2844
474
00
8525
9635
525
CO
BA
LT
2414
5018
3250
10
537
8815
8 N
APH
TH
AL
EN
E22
2014
6110
4137
263
094
8131
5342
1433
4 M
OL
YB
DE
NU
M T
RIO
XID
E22
2260
1755
275
025
4768
3731
1 1
,2,4
-TR
IME
TH
YL
BE
NZ
EN
E18
1888
5454
393
10
3285
027
6098
1533
9 L
EA
D C
OM
POU
ND
S16
5638
1316
057
90
2217
7424
1151
1507
2 F
OR
MA
LD
EH
YD
E16
7541
478
441
245
011
436
1655
3610
346
TO
LU
EN
E13
3342
1217
9171
200
1451
3417
3949
4 B
AR
IUM
1334
486
3691
135
014
1150
1794
6213
805
AL
UM
INU
M O
XID
E (
FIB
RO
US
FOR
MS)
1182
060
1882
825
00
5927
5069
3888
6308
1 C
ER
TA
IN G
LY
CO
L E
TH
ER
S10
1195
1185
824
00
020
5335
2053
4 S
UL
FUR
IC A
CID
1025
739
510
50
026
254
2625
NIT
RIC
AC
ID10
2685
7640
00
010
325
1033
ET
HY
LE
NE
GL
YC
OL
948
835
1404
53
068
000
1308
8314
543
HY
DR
OC
HL
OR
IC A
CID
(
1995
AN
D A
FTE
R "
AC
ID A
ER
OSO
LS"
ON
LY
)9
616
040
00
1610
179
N-M
ET
HY
L-2
-PY
RR
OL
IDO
NE
886
624
3520
50
482
9063
111
329
AM
MO
NIA
892
708
3255
7530
020
042
1285
5266
11,
1,1-
TR
ICH
LO
RO
ET
HA
NE
718
2997
6138
20
00
2443
7934
911
BA
RIU
M C
OM
POU
ND
S6
2345
55
201
043
465
6712
611
188

Metal Casting Industry Chemical Releases and Transfers
Sector Notebook Project September 199758
Tab
le 7
, con
t.:
1995
TR
I R
elea
ses
for
Fou
ndri
es, b
y N
umbe
r of
Fac
iliti
es R
epor
ting
(Rel
ease
s re
port
ed in
pou
nds/
year
)
CH
EM
ICA
L N
AM
E#
RE
POR
TIN
GC
HE
MIC
AL
FUG
ITIV
EA
IRPO
INT
AIR
WA
TE
RD
ISC
HA
RG
ES
UN
DE
RG
RO
UN
DIN
JEC
TIO
NL
AN
DD
ISPO
SAL
TO
TA
LR
EL
EA
SES
AV
G. R
EL
EA
SES
PER
FA
CIL
ITY
CU
ME
NE
HY
DR
OPE
RO
XID
E6
2000
1300
00
3400
6700
1117
HY
DR
OG
EN
FL
UO
RID
E6
1250
1130
00
023
8039
7 B
EN
ZE
NE
531
5023
9000
70
3624
2193
4843
9 C
HL
OR
INE
58
561
50
062
812
6 C
OB
AL
T C
OM
POU
ND
S4
1550
50
00
520
130
N-B
UT
YL
AL
CO
HO
L4
3327
225
00
00
3352
283
81 4
,4'-I
SOPR
OPY
LID
EN
ED
IPH
EN
OL
475
00
00
075
018
8 A
NT
IMO
NY
426
026
00
00
520
130
DIC
HL
OR
OM
ET
HA
NE
311
0912
00
00
1109
1236
971
ME
TH
YL
ET
HY
L K
ET
ON
E3
3985
178
200
00
4767
115
890
TR
ICH
LO
RO
ET
HY
LE
NE
330
426
4699
60
00
7742
225
807
ST
YR
EN
E3
3342
175
457
00
010
8878
3629
3 T
ET
RA
CH
LO
RO
ET
HY
LE
NE
334
450
1600
00
00
5045
016
817
CA
DM
IUM
35
60
00
114
NIT
RA
TE
CO
MPO
UN
DS
217
000
2300
00
024
700
1235
0 C
UM
EN
E2
340
150
00
049
024
5 E
TH
YL
BE
NZ
EN
E2
4610
1843
90
00
2304
911
525
ME
TH
YL
ISO
BU
TY
L K
ET
ON
E2
4128
463
670
00
4765
123
826
AR
SEN
IC2
250
250
00
050
025
0 P
HO
SPH
OR
US
(YE
LL
OW
OR
WH
ITE
)2
1025
575
00
010
1550
8 A
NT
IMO
NY
CO
MPO
UN
DS
15
50
00
1010
BE
RY
LL
IUM
CO
MPO
UN
DS
10
00
00
00
UR
ET
HA
NE
10
00
00
00
HE
XA
CH
LO
RO
ET
HA
NE
15
250
00
025
525
5 D
IET
HA
NO
LA
MIN
E1
00
00
00
0 P
RO
PYL
EN
E1
00
00
00
0 C
RE
SOL
(M
IXE
D I
SOM
ER
S)1
044
,000
200
044
,020
44,0
20 P
OL
YC
HL
OR
INA
TE
D B
IPH
EN
YL
S1
00
00
00
0 1
,1-D
ICH
LO
RO
-1-F
LU
OR
OE
TH
AN
E1
49,4
160
00
049
,416
49,4
16 S
EL
EN
IUM
10
50
00
55
___
____
____
___
____
___
____
___
___
____
____
___
____
___
____
____
__65
4 5
,621
,089
4,60
4,77
456
,716
025
,719
,306
36,0
01,8
8555
,048

Metal Casting Industry Chemical Releases and Transfers
Sector Notebook Project September 199759
Tab
le 8
: 19
95 T
RI
Tra
nsfe
rs f
or F
ound
ries
, by
Num
ber
and
Fac
iliti
es R
epor
ting
(Tra
nsfe
rs r
epor
ted
in p
ound
s/ye
ar)
CH
EM
ICA
L N
AM
E
#R
EPO
RT
ING
CH
EM
ICA
LPO
TW
TR
AN
SFE
RS
DIS
POSA
LT
RA
NSF
ER
SR
EC
YC
LIN
GT
RA
NSF
ER
ST
RE
AT
ME
NT
TR
AN
SFE
RS
EN
ER
GY
RE
CO
VE
RY
TR
AN
SFE
RS
TO
TA
LT
RA
NSF
ER
S
AV
GT
RA
NSF
ER
PER
FAC
ILIT
Y C
OPP
ER
249
3386
9260
5312
9487
0549
688
113
9278
3355
935
NIC
KE
L18
258
1175
2487
2925
158
2319
31
3706
650
2036
6 C
HR
OM
IUM
182
3568
9473
8320
4241
914
667
530
0804
716
528
MA
NG
AN
ESE
179
2598
6528
832
2834
670
5983
80
9425
938
5265
9 P
HE
NO
L89
2397
2167
5452
7210
282
2671
2399
7626
96 L
EA
D76
1566
7822
982
8352
2276
71
9309
1512
249
DII
SOC
YA
NA
TE
S65
511
0292
5540
449
2510
1535
6123
62 M
AN
GA
NE
SE C
OM
POU
ND
S50
4553
5800
216
6143
043
1524
680
1210
0280
2420
06 C
HR
OM
IUM
CO
MPO
UN
DS
4517
857
4274
721
5249
563
1475
095
4361
621
2080
CO
PPE
R C
OM
POU
ND
S36
1375
1015
6612
8891
731
743
014
2360
139
544
ZIN
C (
FUM
E O
R D
UST
)35
861
5928
6614
2030
985
916
020
9995
259
999
NIC
KE
L C
OM
POU
ND
S32
2093
1015
4614
6337
789
690
1575
985
4925
0 M
ET
HA
NO
L32
219
260
060
826
1622
486
703
ZIN
C C
OM
POU
ND
S31
7308
3479
603
4339
541
5814
580
8407
910
2712
23 A
LU
MIN
UM
(FU
ME
OR
DU
ST)
3174
1913
4759
412
0536
915
000
2561
882
8264
1 T
RIE
TH
YL
AM
INE
305
250
4234
2322
8606
065
2284
2174
3 P
HO
SPH
OR
IC A
CID
2625
522
8515
4947
485
760
2868
2011
032
XY
LE
NE
(M
IXE
D I
SOM
ER
S)24
033
9112
170
250
1638
6917
9680
7487
CO
BA
LT
2415
7421
956
6189
8677
190
6502
3527
093
NA
PHT
HA
LE
NE
224
2127
069
2014
9086
2138
305
1741
MO
LY
BD
EN
UM
TR
IOX
IDE
220
1304
249
6510
860
1909
386
8 1
,2,4
-TR
IME
TH
YL
BE
NZ
EN
E18
121
671
6463
260
7922
3631
720
18 L
EA
D C
OM
POU
ND
S16
8635
1495
1205
5229
284
050
1417
3133
9 F
OR
MA
LD
EH
YD
E16
3845
4407
843
035
300
5188
332
43 T
OL
UE
NE
132
1300
00
7906
9208
708
BA
RIU
M13
294
1213
5670
525
6830
019
9255
1532
7 A
LU
MIN
UM
OX
IDE
(FI
BR
OU
S FO
RM
S)11
065
1926
1740
50
066
9331
6084
8 C
ER
TA
IN G
LY
CO
L E
TH
ER
S10
065
5013
000
255
019
805
1981
SU
LFU
RIC
AC
ID10
600
1516
20
1285
00
2861
228
61 N
ITR
IC A
CID
1025
00
2277
235
331
058
353
5835
ET
HY
LE
NE
GL
YC
OL
938
810
5380
017
368
00
1099
7812
220
HY
DR
OC
HL
OR
IC A
CID
(
1995
AN
D A
FTE
R "
AC
ID A
ER
OSO
LS"
ON
LY
)9
50
076
000
076
005
8445
N-M
ET
HY
L-2
-PY
RR
OL
IDO
NE
824
3526
470
1300
049
0219
3348
740
6093
AM
MO
NIA
813
195
040
250
00
5344
566
81 1
,1,1
-TR
ICH
LO
RO
ET
HA
NE
70
060
025
025
011
0015
7

Metal Casting Industry Chemical Releases and Transfers
Sector Notebook Project September 199760
Tab
le 8
, con
t.:
1995
TR
I T
rans
fers
for
Fou
ndri
es, b
y N
umbe
r an
d F
acili
ties
Rep
orti
ng(T
rans
fers
rep
orte
d in
pou
nds/
year
)
CH
EM
ICA
L N
AM
E
#R
EPO
RT
ING
CH
EM
ICA
LPO
TW
TR
AN
SFE
RS
DIS
POSA
LT
RA
NSF
ER
SR
EC
YC
LIN
GT
RA
NSF
ER
ST
RE
AT
ME
NT
TR
AN
SFE
RS
EN
ER
GY
RE
CO
VE
RY
TR
AN
SFE
RS
TO
TA
LT
RA
NSF
ER
S
AV
GT
RA
NSF
ER
PER
FAC
ILIT
Y B
AR
IUM
CO
MPO
UN
DS
60
1702
2824
5735
250
041
6213
6936
9 C
UM
EN
E H
YD
RO
PER
OX
IDE
60
4900
025
00
5150
858
HY
DR
OG
EN
FL
UO
RID
E6
250
047
746
7900
00
1269
9621
166
BE
NZ
EN
E5
225
00
00
252
50 C
HL
OR
INE
50
00
00
00
CO
BA
LT
CO
MPO
UN
DS
40
5869
3946
550
040
0524
1001
31 N
-BU
TY
L A
LC
OH
OL
40
00
00
00
4,4
'-ISO
PRO
PYL
IDE
NE
DIP
HE
NO
L4
078
170
00
078
170
1954
3 A
NT
IMO
NY
425
50
758
250
012
6331
6 D
ICH
LO
RO
ME
TH
AN
E3
028
00
028
9 M
ET
HY
L E
TH
YL
KE
TO
NE
30
064
5825
010
822
1753
058
43 T
RIC
HL
OR
OE
TH
YL
EN
E3
00
1350
020
0033
5011
17 S
TY
RE
NE
30
00
035
535
511
8 T
ET
RA
CH
LO
RO
ET
HY
LE
NE
30
025
00
025
083
CA
DM
IUM
30
00
100
103
NIT
RA
TE
CO
MPO
UN
DS
237
000
00
037
0018
50 C
UM
EN
E2
040
00
250
065
032
5 E
TH
YL
BE
NZ
EN
E2
00
00
750
750
375
ME
TH
YL
ISO
BU
TY
L K
ET
ON
E2
00
053
053
27 A
RSE
NIC
20
025
00
025
012
5 P
HO
SPH
OR
US
(YE
LL
OW
OR
WH
ITE
)2
519
532
1504
30
034
580
1729
0 A
NT
IMO
NY
CO
MPO
UN
DS
10
00
00
00
BE
RY
LL
IUM
CO
MPO
UN
DS
10
400
00
040
040
0 U
RE
TH
AN
E1
030
000
00
3000
3000
HE
XA
CH
LO
RO
ET
HA
NE
10
00
00
00
DIE
TH
AN
OL
AM
INE
113
000
024
000
3700
3700
PR
OPY
LE
NE
10
00
00
00
CR
ESO
L (
MIX
ED
ISO
ME
RS)
16
..
..
66
PO
LY
CH
LO
RIN
AT
ED
BIP
HE
NY
LS
10
..
..
00
1,1
-DIC
HL
OR
O-1
-FL
UO
RO
ET
HA
NE
10
..
..
00
SE
LE
NIU
M1
05
..
.5
5__
___
____
___
____
___
____
___
____
___
____
____
___
____
___
____
____
_55
412
7,67
827
,142
,416
44,8
45,2
981,
584,
953
212,
233
73,9
15,6
8311
3,02
1

Metal Casting Industry Chemical Releases and Transfers
Sector Notebook Project September 199761
IV.A.2. Toxic Release Inventory for Die Casting Facilities
According to the 1995 TRI data, the reporting die casting facilities releasedand transferred a total of approximately 13 million pounds of TRI chemicalsduring calendar year 1995. As with foundries, the releases and transfers fordie casters are dominated by large volumes of metallic wastes. Evidence ofthe diversity of processes at die casting facilities reporting to TRI is found inthe fact that all but three of the TRI reported chemicals (copper, nickel, andaluminum) are reported by fewer than ten percent of the facilities. Thevariability in facilities’ pollutant profiles may be attributed primarily to thedifferent types of metals cast.
Releases
Releases make up only four percent of die casters’ total TRI-reportablechemicals (518,000 pounds). Almost all of these releases (99 percent) arereleased to the air through point source and fugitive emissions (see Table 9).Metallic wastes (primarily aluminum, zinc, and copper) account for over 67percent of the releases. The remainder of the industry’s releases are primarilysolvents and other volatile organic compounds including, trichloroethylene,tetrachloroethylene, glycol ethers, hexochloroethane, and toluene, whichaccount for 32 percent of the releases. In addition to air releases of chemicalsreported to TRI, die casting facilities can be a source of particulates, carbonmonoxide, nitrogen oxides and sulfur compounds due to the combustion offossil fuels for metal melting, from the molten metal itself, and from diecleaning and lubricating operations.
Transfers
Off-site transfers of TRI chemicals account for 96 percent of die casters’ totalTRI-reportable chemicals (13 million pounds). Almost all off-site transfers(97 percent) reported by die casting facilities are sent off-site for recycling.Copper, aluminum, zinc, and nickel make up 98 percent of all transfers andare reported by the largest number of facilities (see Table 10). Chemicalssent off-site for disposal (primarily aluminum and copper) account for lessthan three percent of transfers. After metals, the next class of chemicalstransferred are solvents. These chemicals account for only about one percentof total transfers.

Metal Casting Industry Chemical Releases and Transfers
Sector Notebook Project September 199762
Tab
le 9
: 19
95 T
RI
Rel
ease
s fo
r D
ie C
asti
ng F
acili
ties
, by
Num
ber
of F
acili
ties
Rep
orti
ng(R
elea
ses
repo
rted
in p
ound
s/ye
ar)
CH
EM
ICA
L N
AM
E#
RE
POR
TIN
GC
HE
MIC
AL
FUG
ITIV
EA
IRPO
INT
AIR
WA
TE
RD
ISC
HA
RG
ES
UN
DE
RG
RO
UN
DIN
JEC
TIO
NL
AN
DD
ISPO
SAL
TO
TA
LR
EL
EA
SES
AV
G.
RE
LE
ASE
SPE
R F
AC
ILIT
Y C
OPP
ER
797,
319
17,2
831,
006
025
025
,858
327
NIC
KE
L24
835
3,02
80
00
3,86
316
1 A
LU
MIN
UM
(FU
ME
OR
DU
ST)
2117
,663
257,
448
220
027
5,13
313
,102
ZIN
C (
FUM
E O
R D
UST
)10
6,74
719
,842
00
026
,589
2,65
9 L
EA
D9
3459
00
093
10 M
AN
GA
NE
SE9
552
824
00
01,
376
153
ZIN
C C
OM
POU
ND
S7
992
6,61
032
10
2,95
910
,882
1,55
5 C
HR
OM
IUM
639
1,06
95
00
1,11
318
6 C
OPP
ER
CO
MPO
UN
DS
384
1,85
30
00
1,93
764
6 M
AN
GA
NE
SE C
OM
POU
ND
S3
00
250
00
250
83 T
RIC
HL
OR
OE
TH
YL
EN
E3
12,6
8910
1,54
50
00
114,
234
38,0
78 N
ITR
IC A
CID
325
01,
000
00
01,
250
417
CH
LO
RIN
E3
255
1,70
50
00
1,96
065
3 C
ER
TA
IN G
LY
CO
L E
TH
ER
S2
4,80
05,
600
00
010
,400
5,20
0 E
TH
YL
EN
E G
LY
CO
L2
00
00
00
0 H
YD
RO
CH
LO
RIC
AC
ID (
1995
AN
D A
FTE
R "
AC
ID A
ER
OSO
LS"
ON
LY
)2
500
00
00
500
250
SU
LFU
RIC
AC
ID2
250
750
00
01,
000
500
LE
AD
CO
MPO
UN
DS
10
111
00
011
111
1 N
ICK
EL
CO
MPO
UN
DS
112
240
00
025
225
2 H
EX
AC
HL
OR
OE
TH
AN
E1
1,14
610
,316
00
011
,462
11,4
62 S
TY
RE
NE
11,
450
00
00
1,45
01,
450
PR
OPY
LE
NE
10
00
00
00
TR
IET
HY
LA
MIN
E1
250
50
00
255
255
TE
TR
AC
HL
OR
OE
TH
YL
EN
E1
5,80
023
,200
.0
029
,000
29,0
00 B
ER
YL
LIU
M1
00
00
55
5__
___
____
___
____
____
____
___
___
____
____
____
___
____
100
61,6
6745
2,48
81,
604
03,
214
518,
973
5,18
9

Metal Casting Industry Chemical Releases and Transfers
Sector Notebook Project September 199763
Tab
le 1
0: 1
995
TR
I T
rans
fers
for
Die
Cas
ting
Fac
iliti
es, b
y N
umbe
r an
d F
acili
ties
Rep
orti
ng(T
rans
fers
rep
orte
d in
pou
nds/
year
)
CH
EM
ICA
L N
AM
E
#R
EPO
RT
ING
CH
EM
ICA
LPO
TW
TR
AN
SFE
RS
DIS
POSA
LT
RA
NSF
ER
SR
EC
YC
LIN
GT
RA
NSF
ER
ST
RE
AT
ME
NT
TR
AN
SFE
RS
EN
ER
GY
RE
CO
VE
RY
TR
AN
SFE
RS
TO
TA
LT
RA
NSF
ER
S
AV
GT
RA
NSF
ER
PER
FAC
ILIT
Y C
OPP
ER
7936
334
,284
4,68
3,62
985
1.
4,71
9,12
759
,736
NIC
KE
L24
452,
623
166,
911
35.
169,
614
7,06
7 A
LU
MIN
UM
(FU
ME
OR
DU
ST)
2126
523
3,31
94,
852,
664
5.
5,08
6,25
324
2,20
3 Z
INC
(FU
ME
OR
DU
ST)
1011
20,8
1025
8,68
55
.27
9,51
127
,951
LE
AD
920
515
10,4
4310
.10
,988
1,22
1 M
AN
GA
NE
SE9
1077
65,
997
..
6,78
375
4 Z
INC
CO
MPO
UN
DS
730
35,
259
488,
477
6,95
5.
500,
994
71,5
71 C
HR
OM
IUM
615
760
750
15.
1,54
025
7 C
OPP
ER
CO
MPO
UN
DS
31
502
64,9
28.
.65
,431
21,8
10 M
AN
GA
NE
SE C
OM
POU
ND
S3
516
,400
.4,
752
.21
,157
7,05
2 T
RIC
HL
OR
OE
TH
YL
EN
E3
01,
836
66,3
3080
0.
68,9
6622
,989
NIT
RIC
AC
ID3
98.
.24
,324
.24
,422
8,14
1 C
HL
OR
INE
30
..
..
00
CE
RT
AIN
GL
YC
OL
ET
HE
RS
20
.50
,000
..
50,0
0025
,000
ET
HY
LE
NE
GL
YC
OL
24
70.
..
7437
HY
DR
OC
HL
OR
IC A
CID
(19
95 A
ND
AFT
ER
"A
CID
AE
RO
SOL
S" O
NL
Y)
20
..
..
00
SU
LFU
RIC
AC
ID2
0.
..
.0
0 L
EA
D C
OM
POU
ND
S1
036
01,
500,
000
..
1,50
0,36
01,
500,
360
NIC
KE
L C
OM
POU
ND
S1
054
7,76
7.
.7,
821
7,82
1 H
EX
AC
HL
OR
OE
TH
AN
E1
0.
..
.0
0 S
TY
RE
NE
10
..
..
00
PR
OPY
LE
NE
10
..
..
00
TR
IET
HY
LA
MIN
E1
0.
..
.0
0 T
ET
RA
CH
LO
RO
ET
HY
LE
NE
1.
.2,
009
..
2,00
92,
009
BE
RY
LL
IUM
10
.75
0.
.75
075
0__
___
____
___
____
___
____
___
____
___
____
____
___
____
____
____
___
100
1,14
031
7,56
812
,159
,340
37,7
520
12,5
15,8
0012
5,15
8

Metal Casting Industry Chemical Releases and Transfers
Being included on this list does not mean that the release is associated with non-compliance with environmental laws.1
Sector Notebook Project September 199764
The TRI database contains a detailed compilation of self-reported, facility-specific chemical releases. The top reporting facilities for the metal castingindustry are listed below in Tables 11 and 12. Facilities that have reportedonly the primary SIC codes covered under this notebook appear on Table 11.Table 12 contains additional facilities that have reported the SIC codescovered within this notebook, or SIC codes covered within this notebookreport and one or more SIC codes that are not within the scope of thisnotebook. Therefore, the second list may include facilities that conductmultiple operations -- some that are under the scope of this notebook, andsome that are not. Currently, the facility-level data do not allow pollutantreleases to be broken apart by industrial process.
Table 11: Top 10 TRI Releasing Metal Casting Facilities1
RankFoundries (SIC 332, 3365, 3366, 3369) Die Casters (SIC 3363, 3364)
Facility Releases in Facility ReleasesTotal TRI Total TRI
Pounds in Pounds
1 GM Powertrain Defiance - Defiance, 14,730,020 Water Gremlin Co. - White Bear 97,111OH Lake, MN
2 GMC Powertrain - Saginaw, MI 2,709,764 BTR Precision Die Casting - 93,903Russelville, KY
3 American Steel Foundries - Granite 1,245,343 QX Inc. - Hamel, MN 67,772City, IL
4 Griffin Wheel Co. - Keokuk, IA 1,065,104 AAP St. Marys Corp. - Saint Marys, 55,582OH
5 Griffin Wheel Co. - Groveport, OH 1,042,040 Impact Industries Inc. - Sandwich, IL 45,175
6 Griffin Wheel Co. - Bessemer, AL 742,135 Tool-Die Eng. Co. - Solon, OH 29,005
7 U.S. Pipe & Foundry Co. - 738,200 Chrysler Corp. - Kokomo, IN 20,652Birmingham, AL
8 American Steel Foundries - East 625,191 Metalloy Corp. - Freemont, IN 13,350Chicago, IN
9 Griffin Wheel Co. - Kansas City, KS 607,266 Tool Products. Inc. - New Hope, 12,194MN
10 CMI - Cast Parts, Inc. - Cadillac, MI 604,100 Travis Pattern & Foundry, Inc. - 11,614Spokane, WA
Source: US Toxics Release Inventory Database, 1995.
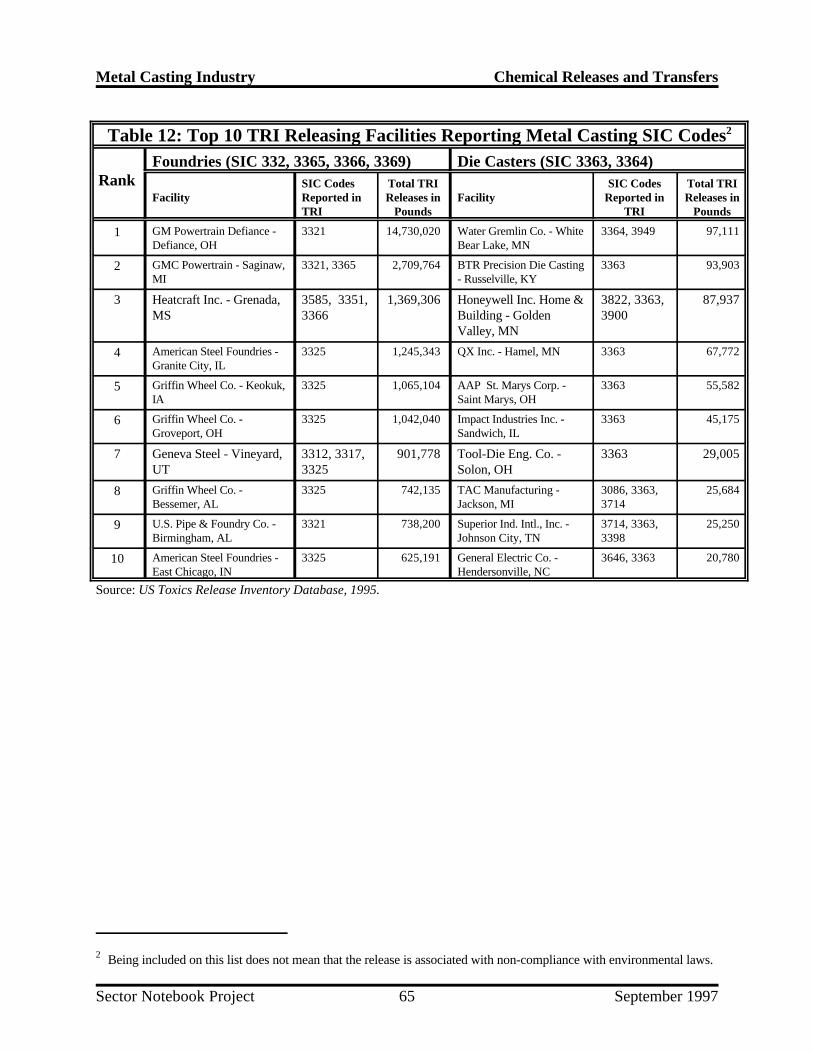
Metal Casting Industry Chemical Releases and Transfers
Being included on this list does not mean that the release is associated with non-compliance with environmental laws.2
Sector Notebook Project September 199765
Table 12: Top 10 TRI Releasing Facilities Reporting Metal Casting SIC Codes2
RankFoundries (SIC 332, 3365, 3366, 3369) Die Casters (SIC 3363, 3364)
Facility Reported in Releases in Facility Reported in Releases inSIC Codes Total TRI SIC Codes Total TRI
TRI Pounds TRI Pounds
1 GM Powertrain Defiance - 3321 14,730,020 Water Gremlin Co. - White 3364, 3949 97,111Defiance, OH Bear Lake, MN
2 GMC Powertrain - Saginaw, 3321, 3365 2,709,764 BTR Precision Die Casting 3363 93,903MI - Russelville, KY
3 Heatcraft Inc. - Grenada, 3585, 3351, 1,369,306 Honeywell Inc. Home & 3822, 3363, 87,937MS 3366 Building - Golden 3900
Valley, MN
4 American Steel Foundries - 3325 1,245,343 QX Inc. - Hamel, MN 3363 67,772Granite City, IL
5 Griffin Wheel Co. - Keokuk, 3325 1,065,104 AAP St. Marys Corp. - 3363 55,582IA Saint Marys, OH
6 Griffin Wheel Co. - 3325 1,042,040 Impact Industries Inc. - 3363 45,175Groveport, OH Sandwich, IL
7 Geneva Steel - Vineyard, 3312, 3317, 901,778 Tool-Die Eng. Co. - 3363 29,005UT 3325 Solon, OH
8 Griffin Wheel Co. - 3325 742,135 TAC Manufacturing - 3086, 3363, 25,684Bessemer, AL Jackson, MI 3714
9 U.S. Pipe & Foundry Co. - 3321 738,200 Superior Ind. Intl., Inc. - 3714, 3363, 25,250Birmingham, AL Johnson City, TN 3398
10 American Steel Foundries - 3325 625,191 General Electric Co. - 3646, 3363 20,780East Chicago, IN Hendersonville, NC
Source: US Toxics Release Inventory Database, 1995.

Metal Casting Industry Chemical Releases and Transfers
TOXNET is a computer system run by the National Library of Medicine that includes a number of toxicological3
databases managed by EPA, National Cancer Institute, and the National Institute for Occupational Safety and Health.For more information on TOXNET, contact the TOXNET help line at 800-231-3766. Databases included in TOXNETare: CCRIS (Chemical Carcinogenesis Research Information System), DART (Developmental and ReproductiveToxicity Database), DBIR (Directory of Biotechnology Information Resources), EMICBACK (Environmental MutagenInformation Center Backfile), GENE-TOX (Genetic Toxicology), HSDB (Hazardous Substances Data Bank), IRIS(Integrated Risk Information System), RTECS (Registry of Toxic Effects of Chemical Substances), and TRI (ToxicChemical Release Inventory). HSDB contains chemical-specific information on manufacturing and use, chemical andphysical properties, safety and handling, toxicity and biomedical effects, pharmacology, environmental fate and exposurepotential, exposure standards and regulations, monitoring and analysis methods, and additional references.
Sector Notebook Project September 199766
IV.B. Summary of Selected Chemicals Released
The following is a synopsis of current scientific toxicity and fate informationfor the top chemicals (by weight) that facilities within this sector self-reportedas released to the environment based upon 1995 TRI data. Because thissection is based upon self-reported release data, it does not attempt to provideinformation on management practices employed by the sector to reduce therelease of these chemicals. Information regarding pollutant release reductionover time may be available from EPA’s TRI and 33/50 programs, or directlyfrom the industrial trade associations that are listed in Section IX of thisdocument. Since these descriptions are cursory, please consult these sourcesfor a more detailed description of both the chemicals described in this section,and the chemicals that appear on the full list of TRI chemicals appearing inSection IV.A.
The brief descriptions provided below were taken from the HazardousSubstances Data Bank (HSDB) and the Integrated Risk Information System(IRIS). The discussions of toxicity describe the range of possible adversehealth effects that have been found to be associated with exposure to thesechemicals. These adverse effects may or may not occur at the levels releasedto the environment. Individuals interested in a more detailed picture of thechemical concentrations associated with these adverse effects should consulta toxicologist or the toxicity literature for the chemical to obtain moreinformation. The effects listed below must be taken in context of theseexposure assumptions that are explained more fully within the full chemicalprofiles in HSDB. For more information on TOXNET , contact the3
TOXNET help line at 1-800-231-3766.
Manganese and Manganese Compounds (CAS: 7439-96-5; 20-12-2)
Sources. Manganese is found in iron charge materials and is used as anaddition agent for alloy steel to obtain desired properties in the final product.In carbon steel, manganese is used to combine with sulfur to improve theductility of the steel. An alloy steel with manganese is used for applications

Metal Casting Industry Chemical Releases and Transfers
Sector Notebook Project September 199767
involving small sections which are subject to severe service conditions, or inlarger sections where the weight saving derived from the higher strength ofthe alloy steels is needed (U.S. EPA, 1995).
Toxicity. There is currently no evidence that human exposure to manganeseat levels commonly observed in ambient atmosphere results in adverse healtheffects.
Chronic manganese poisoning, however, bears some similarity to chronic leadpoisoning. Occurring via inhalation of manganese dust or fumes, it primarilyinvolves the central nervous system. Early symptoms include languor, speechdisturbances, sleepiness, and cramping and weakness in legs. A stolid mask-like appearance of face, emotional disturbances such as absolute detachmentbroken by uncontrollable laughter, euphoria, and a spastic gait with atendency to fall while walking are seen in more advanced cases. Chronicmanganese poisoning is reversible if treated early and exposure stopped.Populations at greatest risk of manganese toxicity are the very young andthose with iron deficiencies.
Ecologically, although manganese is an essential nutrient for both plants andanimals, in excessive concentrations manganese inhibits plant growth.
Carcinogenicity. There is currently no evidence to suggest that manganeseis carcinogenic.
Environmental Fate. Manganese is an essential nutrient for plants andanimals. As such, manganese accumulates in the top layers of soil or surfacewater sediments and cycles between the soil and living organisms. It occursmainly as a solid under environmental conditions, though may also betransported in the atmosphere as a vapor or dust.
Zinc and Zinc Compounds (CAS: 7440-66-6; 20-19-9)
Sources. To protect metal from oxidizing, it is often coated with a materialthat will protect it from moisture and air. In the galvanizing process, steel iscoated with zinc. Galvanized iron and steel is often found in furnace chargematerials (USITC, 1984).
Toxicity. Zinc is a trace element; toxicity from ingestion is low. Severeexposure to zinc might give rise to gastritis with vomiting due to swallowingof zinc dusts. Short-term exposure to very high levels of zinc is linked tolethargy, dizziness, nausea, fever, diarrhea, and reversible pancreatic andneurological damage. Long-term zinc poisoning causes irritability, muscularstiffness and pain, loss of appetite, and nausea.

Metal Casting Industry Chemical Releases and Transfers
Sector Notebook Project September 199768
Zinc chloride fumes cause injury to mucous membranes and to the skin.Ingestion of soluble zinc salts may cause nausea, vomiting, and purging.
Carcinogenicity. There is currently no evidence to suggest that zinc iscarcinogenic.
Environmental Fate. Significant zinc contamination of soil is only seen inthe vicinity of industrial point sources. Zinc is a stable soft metal, though itburns in air. Zinc bioconcentrates in aquatic organisms.
Methanol (CAS: 67-56-1)
Sources. Methanol is used as a cleaning solvent and can be emitted duringthe production of cores using the hot box and no-bake systems.
Toxicity. Methanol is readily absorbed from the gastrointestinal tract and therespiratory tract, and is toxic to humans in moderate to high doses. In thebody, methanol is converted into formaldehyde and formic acid. Methanol isexcreted as formic acid. Observed toxic effects at high dose levels generallyinclude central nervous system damage and blindness. Long-term exposureto high levels of methanol via inhalation cause liver and blood damage inanimals.
Ecologically, methanol is expected to have low toxicity to aquatic organisms.Concentrations lethal to half the organisms of a test population are expectedto exceed one mg methanol per liter water. Methanol is not likely to persistin water or to bioaccumulate in aquatic organisms.
Carcinogenicity. There is currently no evidence to suggest that methanol iscarcinogenic.
Environmental Fate. Methanol is highly volatile and flammable. Liquidmethanol is likely to evaporate when left exposed. Methanol reacts in air toproduce formaldehyde which contributes to the formation of air pollutants.In the atmosphere it can react with other atmospheric chemicals or be washedout by rain. Methanol is readily degraded by microorganisms in soils andsurface waters.
Metal Casting Industry Chemical Releases and Transfers
Sector Notebook Project September 199769
Trichloroethylene (CAS:79-01-6)
Sources. Trichloroethylene is used extensively as a cleaning solvent.
Toxicity. Trichloroethylene was once used as an anesthetic, though its usecaused several fatalities due to liver failure. Short term inhalation exposureto high levels of trichloroethylene may cause rapid coma followed by eventualdeath from liver, kidney, or heart failure. Short-term exposure to lowerconcentrations of trichloroethylene causes eye, skin, and respiratory tractirritation. Ingestion causes a burning sensation in the mouth, nausea, vomitingand abdominal pain. Delayed effects from short-term trichloroethylenepoisoning include liver and kidney lesions, reversible nerve degeneration, andpsychic disturbances. Long-term exposure can produce headache, dizziness,weight loss, nerve damage, heart damage, nausea, fatigue, insomnia, visualimpairment, mood perturbation, sexual problems, dermatitis, and rarelyjaundice. Degradation products of trichloroethylene (particularly phosgene)may cause rapid death due to respiratory collapse.
Carcinogenicity. Trichloroethylene is considered by EPA to be a probablehuman carcinogen via both oral and inhalation exposure, based on limitedhuman evidence and sufficient animal evidence.
Environmental Fate. Trichloroethylene breaks down slowly in water in thepresence of sunlight and bioconcentrates moderately in aquatic organisms.The main removal of trichloroethylene from water is via rapid evaporation.Trichloroethylene does not photodegrade in the atmosphere, though it breaksdown quickly under smog conditions, forming other pollutants such asphosgene, dichloroacetyl chloride, and formyl chloride. In addition,trichloroethylene vapors may be decomposed to toxic levels of phosgene inthe presence of an intense heat source such as an open arc welder. Whenspilled on land, trichloroethylene rapidly volatilizes from surface soils. Someof the remaining chemical may leach through the soil to groundwater.
Xylenes (Mixed Isomers) (CAS: 1330-20-7)
Sources. Xylenes are used extensively as cleaning solvents and paint solventsand may be formed as a decomposition product of binders.
Toxicity. Xylenes are rapidly absorbed into the body after inhalation,ingestion, or skin contact. Short-term exposure of humans to high levels ofxylene can cause irritation of the skin, eyes, nose, and throat, difficulty inbreathing, impaired lung function, impaired memory, and possible changes inthe liver and kidneys. Both short- and long-term exposure to highconcentrations can cause effects such as headaches, dizziness, confusion, and

Metal Casting Industry Chemical Releases and Transfers
Sector Notebook Project September 199770
lack of muscle coordination. Reactions of xylenes (see environmental fate) inthe atmosphere contribute to the formation of ozone in the lower atmosphere.Ozone can affect the respiratory system, especially in sensitive individualssuch as asthma or allergy sufferers.
Carcinogenicity. There is currently no evidence to suggest that xylenes arecarcinogenic.
Environmental Fate. A portion of releases to land and water will quicklyevaporate, although some degradation by microorganisms will occur. Xylenesare moderately mobile in soils and may leach into groundwater, where theymay persist for several years. Xylenes are volatile organic chemicals. Assuch, xylene in the lower atmosphere will react with other atmosphericcomponents, contributing to the formation of ground-level ozone and otherair pollutants.
Chromium and Chromium Compounds (CAS: 7440-47-3; 20-06-4)
Sources. Chromium is used as a plating element for metal to preventcorrosion and is sometimes found on charge materials. Chromium is also aconstituent of stainless steel.
Toxicity. Although the naturally-occurring form of chromium metal has verylow toxicity, chromium from industrial emissions is highly toxic due to strongoxidation characteristics and cell membrane permeability. The majority of theeffects detailed below are based on Chromium VI (an isomer that is moretoxic than Cr III). Exposure to chromium metal and insoluble chromium saltsaffects the respiratory system. Inhalation exposure to chromium andchromium salts may cause severe irritation of the upper respiratory tract andscarring of lung tissue. Dermal exposure to chromium and chromium saltscan also cause sensitive dermatitis and skin ulcers.
Ecologically, although chromium is present in small quantities in all soils andplants, it is toxic to plants at higher soil concentrations (i.e., 0.2 to 0.4 percentin soil).
Carcinogenicity. Different sources disagree on the carcinogenicity ofchromium. Although an increased incidence in lung cancer among workersin the chromate-producing industry has been reported, data are inadequate toconfirm that chromium is a human carcinogen. Other sources considerchromium VI to be a known human carcinogen based on inhalation exposure.

Metal Casting Industry Chemical Releases and Transfers
Sector Notebook Project September 199771
Environmental Fate. Chromium is a non-volatile metal with very lowsolubility in water. If applied to land, most chromium remains in the upperfive centimeters of soil. Most chromium in surface waters is present inparticulate form as sediment. Airborne chromium particles are relativelyunreactive and are removed from the air through wet and dry deposition. Theprecipitated chromium from the air enters surface water or soil. Chromiumbioaccumulates in plants and animals, with an observed bioaccumulationfactor of 1,000,000 in snails.

Metal Casting Industry Chemical Releases and Transfers
Sector Notebook Project September 199772
IV.C. Other Data Sources
The toxic chemical release data obtained from TRI captures only about onequarter of the facilities in the metal casting industry. However, it allows fora comparison across years and industry sectors. Reported chemicals arelimited to the approximately 600 TRI chemicals. A large portion of theemissions from metal casting facilities, therefore, are not captured by TRI.The EPA Office of Air Quality Planning and Standards has compiled airpollutant emission factors for determining the total air emissions of prioritypollutants (e.g., total hydrocarbons, SOx, NOx, CO, particulates, etc.) frommany metal casting sources.
The Aerometric Information Retrieval System (AIRS) contains a wide rangeof information related to stationary sources of air pollution, including theemissions of a number of air pollutants which may be of concern within aparticular industry. With the exception of volatile organic compounds(VOCs), there is little overlap with the TRI chemicals reported above. Table13 summarizes annual releases (from the industries for which a SectorNotebook Profile was prepared) of carbon monoxide (CO), nitrogen dioxide(NO ), particulate matter of 10 microns or less (PM10), sulfur dioxide (SO ),2 2
and volatile organic compounds (VOCs).

Metal Casting Industry Chemical Releases and Transfers
Sector Notebook Project September 199773
Table 13: Air Pollutant Releases by Industry Sector (tons/year)
Industry Sector CO NO PM PT SO VOC2 10 2
Metal Mining 4,670 39,849 63,541 173,566 17,690 915
Nonmetal Mining 25,922 22,881 40,199 128,661 18,000 4,002
Lumber and Wood 122,061 38,042 20,456 64,650 9,401 55,983Production
Furniture and Fixtures 2,754 1,872 2,502 4,827 1,538 67,604
Pulp and Paper 566,883 358,675 35,030 111,210 493,313 127,809
Printing 8,755 3,542 405 1,198 1,684 103,018
Inorganic Chemicals 153,294 106,522 6,703 34,664 194,153 65,427
Organic Chemicals 112,410 187,400 14,596 16,053 176,115 180,350
Petroleum Refining 734,630 355,852 27,497 36,141 619,775 313,982
Rubber and Misc. Plastics 2,200 9,955 2,618 5,182 21,720 132,945
Stone, Clay and Concrete 105,059 340,639 192,962 662,233 308,534 34,337
Iron and Steel 1,386,461 153,607 83,938 87,939 232,347 83,882
Nonferrous Metals 214,243 31,136 10,403 24,654 253,538 11,058
Fabricated Metals 4,925 11,104 1,019 2,790 3,169 86,472
Electronics and Computers 356 1,501 224 385 741 4,866
Motor Vehicles, Bodies, 15,109 27,355 1,048 3,699 20,378 96,338Parts and Accessories
Dry Cleaning 102 184 3 27 155 7,441
Ground Transportation 128,625 550,551 2,569 5,489 8,417 104,824
Metal Casting 116,538 11,911 10,995 20,973 6,513 19,031
Pharmaceuticals 6,586 19,088 1,576 4,425 21,311 37,214
Plastic Resins and 16,388 41,771 2,218 7,546 67,546 74,138Manmade Fibers
Textiles 8,177 34,523 2,028 9,479 43,050 27,768
Power Generation 366,208 5,986,757 140,760 464,542 13,827,511 57,384
Shipbuilding and Repair 105 862 638 943 3,051 3,967
Source: U.S. EPA Office of Air and Radiation, AIRS Database, 1997.

Metal Casting Industry Chemical Releases and Transfers
Sector Notebook Project September 199774
IV.D. Comparison of Toxic Release Inventory Between Selected Industries
The following information is presented as a comparison of pollutant releaseand transfer data across industrial categories. It is provided to give a generalsense as to the relative scale of TRI releases and transfers within each sectorprofiled under this project. Please note that the following figure and table donot contain releases and transfers for industrial categories that are notincluded in this project, and thus cannot be used to draw conclusionsregarding the total release and transfer amounts that are reported to TRI.Similar information is available within the annual TRI Public Data ReleaseBook.
Figure 10 is a graphical representation of a summary of the 1995 TRI data forthe metal casting industry and the other sectors profiled in separatenotebooks. The bar graph presents the total TRI releases and total transferson the vertical axis. The graph is based on the data shown in Table 14 and ismeant to facilitate comparisons between the relative amounts of releases,transfers, and releases per facility both within and between these sectors. Thereader should note, however, that differences in the proportion of facilitiescaptured by TRI exist between industry sectors. This can be a factor of poorSIC matching and relative differences in the number of facilities reporting toTRI from the various sectors. In the case of the metal casting industry, the1995 TRI data presented here covers 654 facilities. These facilities listed SIC332 (Iron and Steel Foundries) and 336 (Nonferrous Foundries) as primarySIC codes.
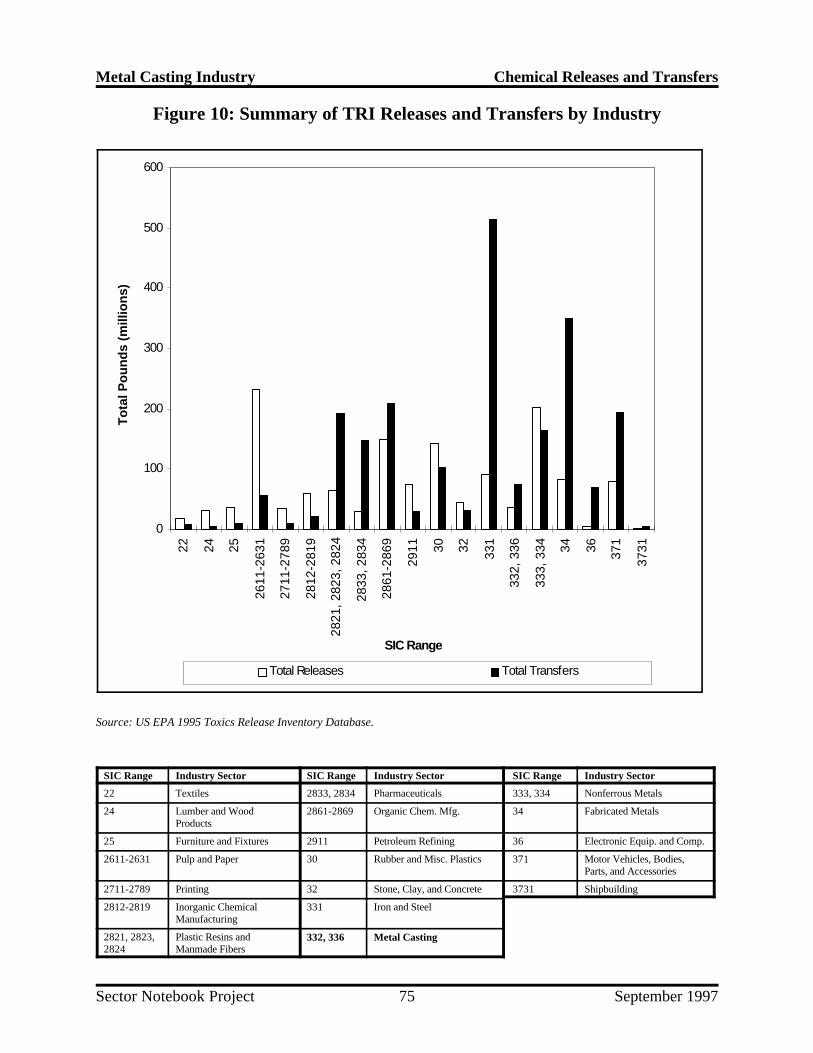
0
100
200
300
400
500
60022 24 25
2611
-263
1
2711
-278
9
2812
-281
9
2821
, 282
3, 2
824
2833
, 283
4
2861
-286
9
2911 30 32 331
332,
336
333,
334 34 36 371
3731
SIC Range
To
tal P
ou
nd
s (m
illio
ns)
Total Releases Total Transfers
Metal Casting Industry Chemical Releases and Transfers
Sector Notebook Project September 199775
Figure 10: Summary of TRI Releases and Transfers by Industry
Source: US EPA 1995 Toxics Release Inventory Database.
SIC Range Industry Sector SIC Range Industry Sector SIC Range Industry Sector
22 Textiles 2833, 2834 Pharmaceuticals 333, 334 Nonferrous Metals
24 Lumber and Wood 2861-2869 Organic Chem. Mfg. 34 Fabricated MetalsProducts
25 Furniture and Fixtures 2911 Petroleum Refining 36 Electronic Equip. and Comp.
2611-2631 Pulp and Paper 30 Rubber and Misc. Plastics 371 Motor Vehicles, Bodies,Parts, and Accessories
2711-2789 Printing 32 Stone, Clay, and Concrete 3731 Shipbuilding
2812-2819 Inorganic Chemical 331 Iron and SteelManufacturing
2821, 2823, Plastic Resins and2824 Manmade Fibers
332, 336 Metal Casting

Metal Casting Industry Chemical Releases and Transfers
Sector Notebook Project September 199776
Tab
le 1
4: T
oxic
s R
elea
se I
nven
tory
Dat
a fo
r Se
lect
ed I
ndus
trie
sT
RI
Rel
ease
sT
RI
Tra
nsfe
rs
Indu
stry
Sec
tor
SIC
Ran
ge
# T
RI
Fac
iliti
esT
otal
Rel
ease
s(m
illio
n lb
s.)
Ave
.R
elea
ses
per
Fac
ility
(pou
nds)
Tot
alT
rans
fers
(mill
ion
lbs.
)
Ave
. Tra
ns.
per
Fac
ility
(pou
nds)
Tot
al R
elea
ses
+Tra
nsfe
rs(m
illio
n lb
s.)
Ave
rage
Rel
ease
s +
Tra
nsfe
rs p
er F
acili
ty(p
ound
s)
Tex
tiles
2233
917
.853
,000
7.0
21,
000
24.8
74,0
00
Lum
ber
and
Woo
d Pr
oduc
ts24
397
30.0
76,0
004.
110
,000
34.1
86,0
00
Furn
iture
and
Fix
ture
s25
336
37.6
112,
000
9.9
29,0
0047
.514
1,00
0
Pulp
and
Pap
er26
11-2
631
305
232.
676
3,00
056
.518
5,00
028
9.1
948,
000
Prin
ting
2711
-278
926
233
.912
9,00
010
.440
,000
44.3
169,
000
Inor
gani
c C
hem
. Mfg
.28
12-2
819
413
60.7
468,
000
21.7
191,
000
438.
565
9,00
0
Plas
tic R
esin
s an
d M
anm
ade
Fibe
rs28
21,2
823,
2824
410
64.1
156,
000
192.
446
9,00
025
6.5
625,
000
Phar
mac
eutic
als
2833
, 283
420
029
.915
0,00
014
7.2
736,
000
177.
188
6,00
0
Org
anic
Che
mic
al M
fg.
2861
-286
940
214
8.3
598,
000
208.
663
1,00
094
6.8
1,22
9,00
0
Petr
oleu
m R
efin
ing
2911
180
73.8
410,
000
29.2
162,
000
103.
057
2,00
0
Rub
ber
and
Mis
c. P
last
ics
301,
947
143.
173
,000
102.
653
,000
245.
712
6,00
0
Ston
e, C
lay,
and
Con
cret
e32
623
43.9
70,0
0031
.851
,000
75.7
121,
000
Iron
and
Ste
el33
142
390
.721
4,00
051
3.9
1,21
5,00
060
4.6
1,42
9,00
0
Met
al C
asti
ng33
2, 3
3665
436
.055
,000
73.9
113,
000
109.
916
8,00
0
Non
ferr
ous
Met
als
333,
334
282
201.
771
5,00
016
458
2,00
036
5.7
1,29
7,00
0
Fabr
icat
ed M
etal
s34
2,67
683
.531
,000
350.
513
1,00
043
4.0
162,
000
Ele
ctro
nic
Equ
ip. a
nd C
omp.
3640
74.
311
,000
68.8
169,
000
73.1
180,
000
Mot
or V
ehic
les,
Bod
ies,
Part
s, a
nd A
cces
sori
es37
175
479
.310
5,00
019
425
7,00
027
3.3
362,
000
Ship
build
ing
3731
432.
456
,000
4.1
95,0
006.
515
1,00
0
Sour
ce: U
S E
PA
Tox
ics
Rel
ease
Inv
ento
ry D
atab
ase,
199
5.

Metal Casting Industry Pollution Prevention Opportunities
Sector Notebook Project September 199777
V. POLLUTION PREVENTION OPPORTUNITIES
The best way to reduce pollution is to prevent it in the first place. Somecompanies have creatively implemented pollution prevention techniques thatimprove efficiency and increase profits while at the same time minimizingenvironmental impacts. This can be done in many ways such as reducingmaterial inputs, re-engineering processes to reuse by-products, improvingmanagement practices, and employing substitution of toxic chemicals. Somesmaller facilities are able to actually get below regulatory thresholds just byreducing pollutant releases through aggressive pollution prevention policies.
The Pollution Prevention Act of 1990 established a national policy ofmanaging waste through source reduction, which means preventing thegeneration of waste. The Pollution Prevention Act also established as nationalpolicy a hierarchy of waste management options for situations in which sourcereduction cannot be implemented feasibly. In the waste managementhierarchy, if source reduction is not feasible the next alternative is recyclingof wastes, followed by energy recovery, and waste treatment as a lastalternative.
In order to encourage these approaches, this section provides both generaland company-specific descriptions of some pollution prevention advances thathave been implemented within the metal casting industry. While the list is notexhaustive, it does provide core information that can be used as the startingpoint for facilities interested in beginning their own pollution preventionprojects. This section provides summary information from activities that maybe, or are being implemented by this sector. When possible, information isprovided that gives the context in which the technique can be used effectively.Please note that the activities described in this section do not necessarily applyto all facilities that fall within this sector. Facility-specific conditions must becarefully considered when pollution prevention options are evaluated, and thefull impacts of the change must examine how each option affects air, land andwater pollutant releases.
Most of the pollution prevention activities in the metal casting industry haveconcentrated on reducing waste sand, waste electric arc furnace (EAF) dustand desulfurization slag, and increasing the overall energy efficiency of theprocesses. This section describes some of the pollution preventionopportunities for foundries within each of these areas.
V.A. Waste Sand and Chemical Binder Reduction and Reuse
Disposal of waste foundry sand in off-site landfills has become less appealingto foundry operators in recent years. Landfill disposal fees have increasedconsiderably, especially in areas that suffer from shortages of landfill capacity.

Metal Casting Industry Pollution Prevention Opportunities
Sector Notebook Project September 199778
Landfill disposal can be a long-term CERCLA liability as well (see SectionVI.A. for a discussion of CERCLA). Currently, about 2 percent of foundrywaste sands generated is considered hazardous waste under RCRA requiringexpensive special treatment, handling and disposal in hazardous wastelandfills. Therefore, there are strong financial incentives for applying pollutionprevention techniques that reduce waste foundry sand generation. In fact, foryears many foundries have been implementing programs to reduce theamounts of waste sand they generate. Also, the industry is conducting asignificant amount of research in this area (AFS, 1996).
V.A.1. Casting Techniques Reducing Waste Foundry Sand Generation
The preferable approach to reducing disposal of waste sands is through sourcereduction rather than waste management and pollution control or treatmenttechniques. Foundry operators aiming to reduce waste sand may want toexamine the feasibility and economic incentives of new casting methods forall or part of their production. A number of the casting techniques describedin Section III.A such as investment casting, permanent mold casting, diecasting, and lost foam casting generate less sand waste than other techniques.
Adopting different casting methods, however, may not always be feasibledepending on the physical characteristics of the parts to be cast (e.g., type ofmetal, casting size and configuration, tolerances and surface finish required,etc.), the capabilities of the alternative methods, and the economic feasibility.When considering the economic feasibility of implementing these alternativemethods, the savings in waste sand handling and disposal and raw materialcosts should be examined.
In addition to the more common methods listed above and described inSection III.A, there are a number of lesser known and/or new casting methodsthat also have the potential to reduce the volume of foundry waste sandgenerated. One promising method, vacuum molding, is described below. Foradditional information on new, alternative casting techniques, see thereferences in Section IX.
Vacuum Molding
Vacuum molding, or the V-Process, uses a strong vacuum applied to free-flowing, dry, unbonded sand around patterns in air tight flasks. The vacuuminside the mold results in a net pressure outside pushing in, holding the sandrigidly in the shape of the pattern even after the pattern is removed. Theprocess uses a specially designed plastic film to seal the open ends of the sandmold and the mold cavity. After the pattern is removed, the mold halves areplaced together and the metal is poured. The plastic film inside the moldcavity melts and diffuses into the sand as it contacts the molten metal. When

Metal Casting Industry Pollution Prevention Opportunities
Sector Notebook Project September 199779
the metal has cooled, the vacuum is removed, allowing the sand to fall awayfrom the casting. Shakeout equipment is not needed and virtually no wastesand is generated. The V-Process can be used on almost all metal types, forall sizes and shapes. Although the process has not gained widespread use, itcan be economical, uses very little energy and can produce castings with highdimensional accuracy and consistency (La Rue, 1989).
V.A.2. Reclamation and Reuse of Waste Foundry Sand and Metal
Although less preferable than source reduction, the more immediate shift inindustry practices is towards waste reclamation and reuse. A number oftechniques are being used to reclaim waste sand and return it to the mold andcore making processes. In addition, markets for off-site reuse of wastefoundry sand have also been found. (Unless otherwise noted, this section isbased on the 1992 EPA Office of Research and Development report, Guidesto Pollution Prevention, The Metal Casting and Heat Treating Industry.)
Waste Segregation
A substantial amount of sand contamination comes from mixing the variousfoundry waste streams with waste sand. The overall amount of sand beingdiscarded can be reduced by implementing the following waste segregationsteps:
• Replumbing the dust collector ducting on the casting metal gate cutoffsaws to collect metal chips for easier recycling
• Installing a new baghouse on the sand system to separate the sandsystem dust from the furnace dust
• Installing a new screening system or magnetic separator on the mainmolding sand system surge hopper to continuously clean metal fromthe sand system
• Separate nonferrous foundry shot blast dust (often a hazardous wastestream) from other nonhazardous foundry and sand waste streams.
• Installing a magnetic separation system on the shotblast system toallow the metal dust to be recycled
• Changing the core sand knockout procedure to keep this sand frombeing mixed in with system sand prior to disposal

Metal Casting Industry Pollution Prevention Opportunities
Sector Notebook Project September 199780
Screen and Separate Metal from Sand
Most foundries screen used sand before reusing it. Some employ severaldifferent screen types and vibrating mechanisms to break down large massesof sand mixed with metal chips. Coarse screens are used to remove largechunks of metal and core butts. The larger metal pieces collected in thescreen are usually remelted in the furnace or sold to a secondary smelter.Increasingly fine screens remove additional metal particles and help classifythe sand by size before it is molded. Some foundries remelt these smallermetal particles; other foundries sell this portion to metal reclaimers. Themetal recovered during the screening process is often mixed with coarser sandcomponents or has sand adhering to it. Therefore, remelting these pieces inthe furnace generates large amounts of slag, especially when the smallerparticles are remelted.
Reclaim Sand by Dry Scrubbing/Attrition
Reclaiming sand by dry scrubbing is widely used, and a large variety ofequipment is available with capacities adaptable to most binder systems andfoundry operations. Dry scrubbing may be divided into pneumatic ormechanical systems.
In pneumatic scrubbing, grains of sand are agitated in streams of air normallyconfined in vertical steel tubes called cells. The grains of sand are propelledupward; they impact each other and/or are thrust against a steel target toremove some of the binder. In some systems, grains are impacted against asteel target. Banks of tubes may be used depending on the capacity anddegree of cleanliness desired. Retention time can be regulated, and fines areremoved through dust collectors. In mechanical scrubbing, a variety ofavailable equipment offers foundries a number of options. An impeller maybe used to accelerate the sand grains at a controlled velocity in a horizontalor vertical plane against a metal plate. The sand grains impact each other andmetal targets, thereby removing some of the binder. The speed of rotation hassome control over impact energy. The binder and fines are removed byexhaust systems, and screen analysis is controlled by air gates or air washseparators. Additional equipment options include:
• A variety of drum types with internal baffles, impactors, anddisintegrators that reduce lumps to grains and remove binder
• Vibrating screens with a series of decks for reducing lumps to grains,with recirculating features and removal of dust and fines
Metal Casting Industry Pollution Prevention Opportunities
Sector Notebook Project September 199781
Southern Aluminum is a high-production automotive foundry in Bay Minette, Alabama. Thecompany recently installed a rotating drum attrition/scrubber sand reclaimer unit to removelumps and tramp aluminum from its spent green sand and core butts so that it could be usedby an asphalt company. Spent sand is fed into one end of the rotating drum where the lumpsare reduced and binder is scrubbed off the grains. The sand then enters a screening andclassifying section, binder and fines are removed by a dust collector, and clean tramp metal isremoved. The company is removing far more aluminum from the sand than expected (about6,000 pounds per day) resulting in substantial cost savings. The equipment paid for itselfbefore it finished treating three-months worth of spent sand stockpiled at the facility (Philbin,1996).
• Shot-blast cleaning equipment that may be incorporated into otherspecially designed units to form a complete casting cleaning/sandreclamation unit
• Vibro-energy systems that use synchronous and diametric vibration,where frictional and compressive forces separate binder from sandgrains.
Reclaim Sand with Thermal Systems
Most foundries recycle core and mold sands; however, these materialseventually lose their basic characteristics, and the portions no longer suitablefor use are disposed of in a landfill. In the reclamation of chemically bondedsands, the system employed must be able to break the bond between the resinand sand and remove the fines that are generated. The systems employedmost commonly are scrubbing/attrition and thermal (rotary reclamation)systems for resin-bonded sands.
Reclamation of green sand for reuse in a green sand system is practiced on alimited basis in the United States. However, reclamation of core sand andchemically bonded molding sand is widespread. Wet reclamation systemsemployed in the 1950s for handling green sands are no longer used. Specificthermal reclamation case studies are summarized in AFS (1989) and ModernCasting August (1996). A typical system to reclaim chemically bonded sandfor reuse in core room and molding operations consists of a lump reductionand metal removal system, a particle classifier, a sand cooler, a dust collectionsystem, and a thermal scrubber (two-bed reactor). A number of thermal sandreclamation techniques are described below. Note that EPA may classifysome types of thermal sand reclamation as incineration. As of June 1996,EPA was taking comments on the regulatory status of thermal recovery units.Contact Mary Cunningham at (703) 308-8453.

Metal Casting Industry Pollution Prevention Opportunities
Sector Notebook Project September 199782
Carondelet Foundry Company in Pevely, Missouri installed a fluidized bed thermal sandreclamation unit and a mechanical reclaimer in 1994 to treat its phenolic urethane no-bake andphenolic urethane Isocure sand. The steel jobbing shop was sending on average 150 tons perday of waste sand off-site for landfill disposal at a cost of about $29 per cubic yard. Inaddition, new sand was costing approximately $22 per ton. The thermal system processes125 tons per day and the mechanical system processes the remaining 25 tons. Only 5 percentof the foundry’s sand is not reclaimed. The reclamations system is estimated to save thefoundry over $1 million per year and payed for itself in under a year. In addition, the foundryfeels that the reclaimed sand is better than new sand and results in better castings (Philbin,1996).
Thermal Calcining/Thermal Dry Scrubbing. These systems are useful forreclamation of organic and clay-bonded systems. Sand grain surfaces are notsmooth; they have numerous crevices and indentations. The application ofheat with sufficient oxygen calcines the binders or burns off organic binders.Separate mechanical attrition units may be required to remove calcinedinorganic binders. Heat offers a simple method of reducing the encrustedgrains of molding sand to pure grains. Both horizontal and vertical rotary kilnand fluidized bed systems are available. Foundries should examine theregulatory requirements of using thermal systems to treat waste sand. The useof these systems may need to be permitted as waste incineration.
Rotary Drum. This system has been used since the 1950s for reclaiming shelland chemically bonded sands. The direct-fired rotary drum is a refractory-lined steel drum that is mounted on casters. The feed end is elevated to allowthe sand to flow freely through the unit. The burners can be at either end ofthe unit with direct flame impingement on the cascading sand; flow can beeither with the flow of solids or counter to it.
In indirect-fired units, the drum is mounted on casters in the horizontalposition and is surrounded by refractory insulation. Burners line the side ofthe drum, with the flames in direct contact with the metal drum. The feed endis elevated to allow the sand to flow freely through the unit, and in some casesflights (paddles connected by chains) are welded to the inside to assistmaterial flow.
Multiple-Hearth Vertical Shaft Furnace. This furnace consists of circularrefractory hearths placed one above the other and enclosed in a refractory-lined steel shell. A vertical rotating shaft through the center of the furnace isequipped with air-cooled alloy arms containing rabble blades (plows) that stirthe sand and move it in a spiral path across each hearth.
Metal Casting Industry Pollution Prevention Opportunities
Sector Notebook Project September 199783
In 1988, R.H. Sheppard Company, Inc. in Hanover, Pennsylvania installed a thermal sandreclamation system to recover its 2,200 tons per year of waste green sand. Between the sandpurchase price and disposal costs, the foundry was spending over $180,000 per year. Evenconsidering the $428,500 capital investment and regular operation and maintenance costs,over the 20 year useful life of the equipment, the company estimates it will save about $2million. This does not include the intangible savings of reduced liability of waste sanddisposal (Pennsylvania DEP, 1996).
Sand is repeatedly moved outward from the center of a given hearth to theperiphery, where it drops through holes to the next hearth. This action givesexcellent contact between sand grains and the heated gases. Material is fedinto the top of the furnace. It makes its way to the bottom in a zigzag fashion,while the hot gases rise counter-currently, burning the organic material andcalcining clay, if one or both are present. Discharge of reclaimed sand can bedirectly from the bottom hearth into a tube cooler, or other cooling methodsmay be used. The units are best suited to large tonnages (five tons or more).
New approaches and equipment designed for sand reclamation units arecontinuing to evolve, and foundries must evaluate each system carefully withregard to the suitability for a particular foundry operation.
Use Sand as a Construction Material
Depending on its physical and chemical characteristics, non-hazardous wastefoundry sand can be used as construction material assuming a market can befound and federal, state, and local regulations relating to handling, storage,and disposal allow it. Many foundries currently recycle foundry waste sandfor construction purposes. Industry research, however, indicates that only asmall portion of the potential market for waste sand is being utilized. Somepotential construction uses for waste sand include: feed stock for portlandcement production; fine aggregate for concrete; fine construction aggregatefor fill; and bituminous concrete (asphalt) fine aggregate.
Metal Casting Industry Pollution Prevention Opportunities
Sector Notebook Project September 199784
Since late 1993, Viking Pump, Inc., of Cedar Falls, Iowa has been shipping spent sand to aportland cement manufacturer for use as a raw material. This reuse reduces the costs for thecement company because the need for mining virgin sand is reduced. Landfill costs for thefoundry have been reduced creating a win-win situation for both companies. When Vikingbegan testing foundry sand for use in cement manufacturing, the sand was loaded with anendloader into grain trucks for hauling to the cement plant. Completing a loading took almostan hour. Once the cement company decided that the waste sand was compatible with itsprocess, Viking invested in a sand silo for storage. The sand is now conveyed to the silo andgravity fed into trucks for transportation, significantly reducing handling time to six minutes. Viking expects to send at least half of the spent foundry sand to the portland cementmanufacturer and is continuing to look for alternative uses to achieve its pollution preventiongoals (U.S. EPA Enviro$en$e Website, 1996).
Not all foundry sand will be ideal for all construction uses. For example,although many foundry sands actually increase compression strengths ofconcrete when used as a fine aggregate, green molding sands have beenshown to decrease compression strengths. In addition, foundries will probablynot be able to find markets for their waste sand in its “as-generated”condition. Some processing is typically required in order to match thecustomers’ product specifications. Waste sand may first need to be dried,crushed, screened and separated from metals.
Waste sand streams from certain foundry processes could render a foundry’sentire waste sand stream worthless if mixed together. A material flow diagramdetailing the flow of sand and its characteristics (particle size distribution,mineralogical composition, moisture content, and chemical and contaminantconcentration) through the production processes will help foundry operatorsidentify those spent sand generation points that must be separated out foreither processing and sale to a customer or for disposal in a landfill.
V.B. Metal Melting Furnaces
The metal casting industry is highly energy intensive and therefore hasopportunities to prevent pollution through increasing energy efficiency. Themajority of the energy is consumed by the furnaces used to melt metal;however, energy used in heat curing of sand molds can also be significantdepending on the process used (DOE, 1996). Increases in energy efficiencyin metal casting operations may have the dual pollution prevention effect ofreducing fossil fuel consumption (and the associated environmental impacts)and reducing the amounts of wastes generated from furnaces and curing ovens(e.g., hazardous desulfurization slag, dust, VOCs, etc.). Since energy costscan be a large portion of a metal caster’s overall operating costs, increases inenergy efficiency can also result in significant cost savings.

Metal Casting Industry Pollution Prevention Opportunities
Sector Notebook Project September 199785
Improve Furnace Efficiency
Currently, many foundry furnaces are less than 35 percent energy efficient.Facilities using reverberatory or crucible furnaces may have opportunities toimprove their furnace efficiency and stack emissions by upgrading theircombustion system (DOE, 1996). New oxygen burners and computerized gasflow metering systems have helped a number of facilities to comply with CleanAir Act regulations for NO and CO emissions while reducing energy costs.x
Some foundries are utilizing regenerative ceramic burner systems. Thesystems are comprised of two burners which function alternately as a burnerand an exhaust port. When one burner fires, the other collects the exhaustgases, recouping the heat from the waste gases. In the next cycle, this burnerthen fires, recombusting the gases. The recombustion of the waste gasesensures complete combustion and has been shown to reduce NO formation.x
One firm implementing this system reported a 33 percent reduction in energyuse and a better melting rate, improving production capacity (Binczewski,1993).
Install Induction Furnaces
Induction furnaces may offer advantages over electric arc or cupola furnacesfor some applications. Induction furnaces are about 75 to 80 percent energyefficient and emit about 75 percent less dust and fumes because of the absenceof combustion gases or excessive metal temperatures. When clean scrapmaterial is used, the need for emission control equipment may be minimized.Of course, production operations and process economics must be consideredcarefully when planning new or retrofit melting equipment (U.S. EPA, 1992).
Minimize Metal Melting
Depending on the casting, between reject castings and gating systems, overhalf of the metal poured into molds may not become a useful part of thecasting. This metal needs to be separated from the castings and remelted,usually at a significant cost. Any increases in yield (reductions in the amountof scrap) will result in energy cost savings from eliminating the need formelting the excess metal. In addition, costs of separating scrap from thecastings and waste sand, and the time and expense in machining of gatingsystems may be reduced. Gating system design that increases yield andreduces the need for machining can reduce a foundry’s costs. Optimallydesigned systems will not use any more metal than is necessary while ensuringthat the metal flows into the mold cavity properly to minimize casting defects.A number of computer software products are available to optimize castingdesign. These products simulate mold filling and casting solidification forvarious designs and can reduce costs by improving quality and reducing scrap.

Metal Casting Industry Pollution Prevention Opportunities
Sector Notebook Project September 199786
A number of casting methods use a central sprue gated to a number ofindividual casting patterns. Such assemblies termed “trees” or patternclusters, can generate less excess metal than single pattern mold designs. Thistechnique is most commonly used in the investment and lost foam castingmethods. A variation of the investment casting method termed, hollow spruecasting, or counter gravity casting, employs a vacuum to fill the mold withmolten metal. A mold or mold cluster assembly fabricated using theinvestment casting technique is placed in a closed mold chamber with only theopen end protruding from the bottom. The mold and mold chamber arelowered to the surface of a ladle or crucible of molten metal until the moldopening is below the surface. A vacuum is then applied to the mold chamberand mold, forcing the molten metal to rise and fill the mold and gating system.The vacuum is maintained until the casting and gates have solidified and isreleased before the sprue has solidified. The sprue metal then drains back intothe molten metal for reuse. If the gating system is designed properly, over 90percent of the metal becomes part of the useful casting.
Use Alternative Fuels for Melting
Some melt furnaces can utilize natural gas or fuel-oil as a fuel source.Particulate emissions from fuel oils tend to be much greater than emissionsfrom natural gas combustion. If fuel oil must be used, particulate emissionscan be reduced by using a lower grade of fuel oil. Petroleum distillates(Numbers 1 and 2 fuel oil) will result in lower particulate emissions thanheavier grade fuels (Nos. 4,5,6). Sulfur dioxide emissions can be reduced bychoosing a fuel with a low sulfur content. Emissions of nitrogen oxides resultfrom the oxidation of nitrogen bound in the fuel. Selection of a low nitrogenfuel oil will reduce NOx emissions (NADCA, 1996).
Air emissions from the operation of furnaces can be further reduced by usingnatural gas as a fuel source. Natural gas is considered a clean fuel which,when combusted, emits relatively small amounts of SOx and particulatematter. The primary emission resulting from the combustion of natural gas isnitrogen oxides. NOx emissions can be reduced by applying alternative firingtechniques, including the recirculation of flue-gas, staged combustion, and theinstallation of low NOx burners (NADCA, 1996).
Proper maintenance of furnaces will also help to reduce air emissions.Inefficient fuel/air mixing may generate excess particulate emissions.

Metal Casting Industry Pollution Prevention Opportunities
Sector Notebook Project September 199787
V.C. Furnace Dust Management
Dust generation, especially in the Electric Arc Furnace (EAF), and itsdisposal, has been recognized as a serious problem, but one with potential forpollution prevention through material recovery and source reduction. EAFdust can have high concentrations of lead and cadmium. Some EAF dust canbe shipped off-site for zinc reclamation. Most of the EAF dust recoveryoptions are only economically viable for dust with a zinc content of at least 15- 20 percent (U.S. EPA, 1995).
In-process recycling of EAF dust may involve pelletizing and then reusing thepellets in the furnace, however, recycling of EAF dust on-site has not provento be technically or economically competitive for all foundries. Improvementsin technologies have made off-site recovery a cost effective alternative tothermal treatment or secure landfill disposal.
Maintain Optimal Operating Parameters
Dust emissions from furnaces can often be minimized through a number ofgood operating practices. Such practices include: avoiding excessivesuperheating of the metal; maintaining a sufficient flux or slag cover over themetal to keep the molten metal separated from the atmosphere; preheating themetal charged; avoiding the addition of metals at maximum furnacetemperatures; and avoiding the heating of the metal too fast.
Recycle EAF Dust to the Original Process
EAFs generate 1 to 2 percent of their charge into dust or fumes. If the zincand lead levels of the metal dust are low, return of the dust to the furnace forrecovery of base metals (iron, chromium, or nickel) may be feasible. Thismethod may be employed with dusts generated by the production of stainlessor alloy steels. However, this method is usually impractical for handling dustassociated with carbon steel production because galvanized metal scrap isoften used and the recovered dust tends to be high in zinc (U.S. EPA, 1992).
Many methods have been proposed for flue-dust recycling, including directzinc recovery. Zinc content can be increased to the required 15 to 20 percentby returning the dust to the furnace from which it is generated. If the dust isinjected into the furnace after the charge of scrap metal is melted,temperatures are high enough for most of the heavy metals to fume off. Thistechnique results in an increased zinc concentration in the dust collected bythe scrubbers, electrostatic precipitation systems, or baghouses (U.S. EPA,1992).

Metal Casting Industry Pollution Prevention Opportunities
Sector Notebook Project September 199788
Recycle Dust Outside the Original Process
Silica-based baghouse dust from sand systems and cupola furnaces may beused as a raw material by cement companies. The dust is preblended withother components and transferred to a kiln operation. It is envisioned thatbaghouse dusts may constitute 5 to 10 percent of the raw material used bycement manufacturers in the future. The use of higher levels may be limitedby adverse effects of the baghouse dust on the setting characteristics of thecement (U.S. EPA, 1992).
Waste EAF dust can be reused outside the original process by reclaiming thezinc, lead, and cadmium concentrated in emission control residuals. Thefeasibility of such reclamation depends on the cost of dust treatment anddisposal, the concentration of metals within the residual, the cost ofrecovering the metals, and the market price for the metals. While thisapproach is useful in the nonferrous foundry industry (i.e., brass foundries),its application within gray iron foundries is extremely limited. Some foundriesmarket furnace dust as input to brick manufacturing and other consumerproduct applications, but product liability limits this option. Recoverymethods include: pyrometallurgical, rotary kiln, electrothermic shaft furnace,and zinc oxide enrichment (U.S. EPA, 1992).
Pyrometallurgical methods for metals recovery are based on the reduction andvolatilization of zinc, lead, cadmium, and other components of EAF dust.Lead is removed preferentially through roasting in an oxidizing environment,while zinc, cadmium and other metals are removed through roasting underreducing conditions. The rotary (or Waelz) kiln method can simultaneouslyreduce ferrous iron oxide to solid iron and lead and zinc oxide to their metallicforms, using a reducing atmosphere such as carbon monoxide and hydrogen.However, rotary kilns must be fairly large and must process large volumes ofdust to be economically and thermally efficient. The electrothermic shaftfurnace can extract metallic zinc from a feed containing at least 40 percent ofthe metal. Typically, agglomerated EAF dust is mixed with other feed toattain this percentage. To recycle dust by direct reduction of oxides, ironoxide is reduced to iron and water using pure hydrogen at a temperature rangeof 1000 to 1100EC. The reduction of zinc oxide produces zinc vapors andsteam at 1000 to 1100EC that are removed from the furnace and subjected toan oxidation step. The zinc reacts with water to produce zinc oxide, andhydrogen is removed and recycled. The zinc oxide produced is separated ina baghouse. The hydrogen containing the steam is further treated for steamcondensation, and then the hydrogen is ready for recycling into the furnace(U.S. EPA, 1992).

Metal Casting Industry Pollution Prevention Opportunities
Sector Notebook Project September 199789
Alter Raw Materials
The predominant source of lead, zinc, and cadmium in ferrous foundrybaghouse dust or scrubber sludge is galvanized scrap metal used as a chargematerial. To reduce the level of these contaminants, their source must beidentified and charge material containing lower concentrations of thecontaminants must be acquired. A charge modification program at a largefoundry can successfully reduce the lead and cadmium levels in dust collectorwaste to below EP-toxicity values. Foundries need to work closely with steelscrap suppliers to develop reliable sources of high-grade scrap.
V.D. Slag and Dross Management
Minimize Hazardous Desulfurizing Slag
In the production of ductile iron, it is often necessary to add a desulfurizingagent in the melt to produce the desired casting microstructure. Onedesulfurization agent used commonly is solid calcium carbide (CaC ).2
Calcium carbide is thought to decompose to calcium and graphite. Thecalcium carbide desulfurization slag is generally removed from the molten ironin the ladle and placed into a hopper. For adequate sulfur removal, CaC must2
be added in slight excess. Since an excess of CaC is employed to ensure2
removal of the sulfur, the resulting slag contains both CaS and CaC and must2
be handled as a reactive waste. The slag might also be hazardous due to highconcentrations of heavy metals (U.S. EPA, 1992).
Treatment of this material consists normally of converting the carbide toacetylene and calcium hydroxide by reacting with water. Problems with thismethod include handling a potentially explosive waste material; generating awaste stream that contains sulfides (due to calcium sulfide in the slag) andmany other toxic compounds; and liberating arsine, phosphine, and other toxicmaterials in the off gas (U.S. EPA, 1992).
One way to reduce the need for calcium carbide is to reduce the amount ofhigh sulfur scrap used as furnace charge materials. While this method iseffective, the ability to obtain a steady supply of high-grade scrap variesconsiderably and may be uneconomical (U.S. EPA, 1992).
To eliminate entirely the use of calcium carbide, several major foundries haveinvestigated the use of alternative desulfurization agents. One proprietaryprocess employs calcium oxide, calcium fluoride, and two other materials.The process can be more economical than carbide desulfurization and resultsin a satisfactory iron quality (U.S. EPA, 1992).

Metal Casting Industry Pollution Prevention Opportunities
Sector Notebook Project September 199790
Often, the amount of sulfur removal for a product is based not on therequirements of that product but on what is achievable in practice. When totalsulfur removal is required, it is not uncommon that 20 to 30 percent excesscarbide is employed resulting in the generation of larger amounts of slag. Ifthe iron were desulfurized only to the extent actually needed, much of thiswaste could be reduced or eliminated (U.S. EPA, 1992).
Recycle Hazardous Desulfurizing Slag
Because calcium carbide slag is often removed from the metal by skimming,it is not uncommon to find large amounts of iron mixed in with the slag.Depending on the means of removal, this metal will either be in the form oflarge blocks or small granules. To reduce metal losses, some foundries crushthe slag and remove pieces of metal by hand or with a magnet for remelting.Other foundries have investigated recharging the entire mass to the remeltingfurnace. Inside the furnace, calcium hydroxide forms in the slag as therecycled calcium carbide either removes additional sulfur or is oxidizeddirectly. While this method has been successful, more research is necessary.For example, it is not known to what extent the calcium sulfide stays with theslag or how much sulfur is carried in the flue gas and the scrubber system.Initial tests indicate that the sulfur does not concentrate in the metal, so thatproduct quality is not affected (U.S. EPA, 1992).
Slag from stainless steel melting operations (where Ni, Mo, and Cr metals areused as alloy additions) is hazardous as a result of high chromiumconcentrations. Such slag can be recycled as a feed to cupola furnaces (grayiron production line). The cupola furnace slag scavenges trace metals fromthe induction furnace slag. The resulting cupola slag may be rendered anonhazardous waste (U.S. EPA, 1992).
Minimize Air Emissions During Dross and Slag Removal
Emissions resulting from the removal of dross and slag can be reduced bydecreasing the time in which the dross is exposed to the air. This is true fordross and slag removal processes throughout the facility (e.g., melting,laundering, die casting). Dross and slag pots should be covered as soon aspossible to eliminate emissions to the atmosphere. Alternative dross and slaghandling techniques can also be practical to reduce emissions. Dross and slagpots can be positioned under or near exhaust hoods in order to divert theemissions to a filter or other emission control device (NADCA, 1996).
Metal Casting Industry Pollution Prevention Opportunities
Sector Notebook Project September 199791
V.E. Wastewater
Reduce Phenols in Die Casting Wastewater Streams
The major pollutants in the wastewater streams from die casting operationsare oils and phenols, with the phenols being the regulated pollutant in mostwastewater discharge situations. Common sources of phenols in die castingare the various oils used in the process, such as phosphate ester-basedhydraulic oil, die lube, way lube, die cast coolant, etc. Cast salts, degreasers,and heat transfer oils may also contain phenols as an impurity (NADCA,1996).
An effective method for source control of phenols would be to check eachindividual raw material used in die casting for phenols, and use or substitutewith materials which have little or no phenols. For example, petroleum oilswhich often contain phenols as contaminants may be substituted with syntheticoils or water-based materials that contain no phenols. Although thealternative materials can be more costly than petroleum-based oils, the annualincremental cost increase may not be significant depending on the volume ofmaterial used. In addition, anticipated reductions in environmental controlcosts may outweigh potential raw material cost increases (NADCA, 1996).
Another effective method of reducing or eliminating phenols in wastewaterconsists of segregating the various waste streams at the point of generationby collecting the materials in catch pans and handling them separately. Forexample, die lube overspray can be collected in a metal pan installed below thedie, screened to remove debris, filtered (if necessary) to remove fineparticulate matter, treated (if necessary) for bacteria contamination, andrecycled for reuse in the plant. Plunger lubricants and other drippings mayalso be collected in pans and recycled off-site as used oil (NADCA, 1996).
Reduce Wastewater and Sludge Generation
Water used to cool parts can be reduced by implementing cooling waterrecycling systems. Further wastewater reductions may be accomplished byoptimizing deburring operations to minimize the total suspended solids inwastewater. This, in turn, will reduce the sludge generation from subsequenttreatment. Sludge dewatering can also be optimized through the use of pHcontrols and filter aids (such as diatomaceous earth) to produce a drier filtercake prior to land disposal.

Metal Casting Industry Pollution Prevention Opportunities
Sector Notebook Project September 199792
R.H. Sheppard Company, Inc. in Hanover, Pennsylvania used large quantities of fresh waterfor cooling metal parts as they were ground to fine tolerances. The company installed a16,000 gallon closed loop cooling system with temperature and bacteria controls whichimproved the grinding process and saves 3.4 million gallons of water per year. From itsreduced coolant disposal costs and savings in water costs, R.H. Sheppard Company expects atwo- to three-year payback period on its $540,000 investment (Pennsylvania DEP, 1996).
Reduce VOC Emissions from Cooling and Quench Water
The primary cause of air emissions from non-contact cooling water coolingtowers and quench baths is the use of additives, such as biocides, whichcontain volatile organic compounds that are eventually emitted to theatmosphere. The best method for reducing air emissions from cooling towersand quench baths is to use fewer additives or to use additives containing noVOCs or Hazardous Air Pollutants (HAPs) (NADCA, 1996).
V.F. Die Casting Lubrication
The majority of emissions generated during the die casting process come fromthe application of die lubes. These emissions consist of VOC, particulatematter, and HAPs. VOC emissions from die lube application can be reducedby the use of water-based die lubricants or solid lubricants. Eliminating thevolatile components of petroleum-based lubricants will also reduce VOCemissions when wet milling finishing techniques are used. However, it isimportant to note that lubricants which reduce VOC emissions may notnecessarily reduce HAP emissions and, in some cases, HAP emissions may begreater from water-based die lubes. Apparently, some of the solventreplacement additives in water-based lubricants may result in increased HAPemissions. It is important to thoroughly evaluate the potential implications forair emissions before alternative lubricant products are used (NADCA, 1996).
In the same manner as VOC emissions, alternative lubricants can be used toreduce particulate emissions from the application of die lubes. However,lubricant-specific evaluations should be performed to determine the particulateemission reduction potential of individual lubricant changes (NADCA, 1996).
V.G. Miscellaneous Residual Wastes
The generation of solid wastes from shipping and receiving processes can beminimized through the use of reusable packaging materials. Metal casters canseek suppliers that use these materials, and work with customers to initiatetheir use of reusable shipping materials. Many of the common packagingmaterials in use today, including shrink wrap, strapping materials, cardboard,

Metal Casting Industry Pollution Prevention Opportunities
Sector Notebook Project September 199793
totes, and drums, can be recycled off-site using commercial recycling services.(NADCA, 1996)
Dross from melting operations is commonly sold to secondary smelters forrecovery of the valuable metals. Die casting shot-tip turnings can be re-sizedon-site and re-used in the original process (NADCA, 1996).
Leaking hydraulic fluid from die cast machines can be segregated from otherdie cast fluids using drip pans and/or containment curbing. Leaking and spenthydraulic fluids may be collected and recycled as used oil. Used oil recyclingoptions include re-refining and burning the material for energy recovery inspace heaters, boilers, or industrial furnaces (NADCA, 1996).
Refractory, coils, and servicing tools must be periodically replaced in themelting and conveyance operations due to wear. Although the generation ofthese materials cannot be eliminated, their generation rates can be minimizedby raising the pollution prevention awareness of maintenance personnel andoptimizing maintenance and servicing schedules (NADCA, 1996).
The generation of floor absorbent solid waste at die cast machines can beminimized through the use of drip pans and containment berming. Hydraulicfluids, die release agents, way lubricants, and other leaking fluids can becollected in this manner. If floor absorbents are to be used, launderableabsorbents should be considered. These absorbents are becoming availableincreasingly from industrial suppliers and laundry services, and can be reusedover and over. The use of launderable absorbents results in reduced landfilldisposal for both the absorbents and the recovered fluids (NADCA, 1996).

Page 94 intentionally left blank.

Metal Casting Industry Federal Statutes and Regulations
Sector Notebook Project September 199795
VI. SUMMARY OF FEDERAL STATUTES AND REGULATIONS
This section discusses the Federal regulations that may apply to this sector.The purpose of this section is to highlight and briefly describe the applicableFederal requirements, and to provide citations for more detailed information.The three following sections are included:
C Section VI.A. contains a general overview of major statutesC Section VI.B. contains a list of regulations specific to this industryC Section VI.C. contains a list of pending and proposed regulations
The descriptions within Section VI are intended solely for generalinformation. Depending upon the nature or scope of the activities at aparticular facility, these summaries may or may not necessarily describe allapplicable environmental requirements. Moreover, they do not constituteformal interpretations or clarifications of the statutes and regulations. Forfurther information, readers should consult the Code of Federal Regulationsand other state or local regulatory agencies. EPA Hotline contacts are alsoprovided for each major statute.
VI.A. General Description of Major Statutes
Resource Conservation and Recovery Act
The Resource Conservation And Recovery Act (RCRA) of 1976 whichamended the Solid Waste Disposal Act, addresses solid (Subtitle D) andhazardous (Subtitle C) waste management activities. The Hazardous andSolid Waste Amendments (HSWA) of 1984 strengthened RCRA’s wastemanagement provisions and added Subtitle I, which governs undergroundstorage tanks (USTs).
Regulations promulgated pursuant to Subtitle C of RCRA (40 CFR Parts260-299) establish a “cradle-to-grave” system governing hazardous wastefrom the point of generation to disposal. RCRA hazardous wastes include thespecific materials listed in the regulations (commercial chemical products,designated with the code "P" or "U"; hazardous wastes from specificindustries/sources, designated with the code "K"; or hazardous wastes fromnon-specific sources, designated with the code "F") or materials which exhibita hazardous waste characteristic (ignitability, corrosivity, reactivity, or toxicityand designated with the code "D").
Regulated entities that generate hazardous waste are subject to wasteaccumulation, manifesting, and record keeping standards. Facilities mustobtain a permit either from EPA or from a State agency which EPA hasauthorized to implement the permitting program if they store hazardous

Metal Casting Industry Federal Statutes and Regulations
Sector Notebook Project September 199796
wastes for more than 90 days before treatment or disposal. Facilities maytreat hazardous wastes stored in less-than-ninety-day tanks or containerswithout a permit. Subtitle C permits contain general facility standards suchas contingency plans, emergency procedures, record keeping and reportingrequirements, financial assurance mechanisms, and unit-specific standards.RCRA also contains provisions (40 CFR Part 264 Subpart S and §264.10) forconducting corrective actions which govern the cleanup of releases ofhazardous waste or constituents from solid waste management units atRCRA-regulated facilities.
Although RCRA is a Federal statute, many States implement the RCRAprogram. Currently, EPA has delegated its authority to implement variousprovisions of RCRA to 47 of the 50 States and two U.S. territories.Delegation has not been given to Alaska, Hawaii, or Iowa.
Most RCRA requirements are not industry specific but apply to any companythat generates, transports, treats, stores, or disposes of hazardous waste.Here are some important RCRA regulatory requirements:
C Identification of Solid and Hazardous Wastes (40 CFR Part 261)lays out the procedure every generator must follow to determinewhether the material in question is considered a hazardous waste,solid waste, or is exempted from regulation.
C Standards for Generators of Hazardous Waste (40 CFR Part 262)establishes the responsibilities of hazardous waste generators includingobtaining an EPA ID number, preparing a manifest, ensuring properpackaging and labeling, meeting standards for waste accumulationunits, and recordkeeping and reporting requirements. Generators canaccumulate hazardous waste for up to 90 days (or 180 days dependingon the amount of waste generated) without obtaining a permit.
C Land Disposal Restrictions (LDRs) (40 CFR Part 268) areregulations prohibiting the disposal of hazardous waste on landwithout prior treatment. Under the LDRs program, materials mustmeet LDR treatment standards prior to placement in a RCRA landdisposal unit (landfill, land treatment unit, waste pile, or surfaceimpoundment). Generators of waste subject to the LDRs must providenotification of such to the designated TSD facility to ensure propertreatment prior to disposal.
C Used Oil Management Standards (40 CFR Part 279) imposemanagement requirements affecting the storage, transportation,burning, processing, and re-refining of the used oil. For parties thatmerely generate used oil, regulations establish storage standards. For
Metal Casting Industry Federal Statutes and Regulations
Sector Notebook Project September 199797
a party considered a used oil processor, re-refiner, burner, or marketer(one who generates and sells off-specification used oil), additionaltracking and paperwork requirements must be satisfied.
C RCRA contains unit-specific standards for all units used to store,treat, or dispose of hazardous waste, including Tanks andContainers. Tanks and containers used to store hazardous wastewith a high volatile organic concentration must meet emissionstandards under RCRA. Regulations (40 CFR Part 264-265, SubpartCC) require generators to test the waste to determine theconcentration of the waste, to satisfy tank and container emissionsstandards, and to inspect and monitor regulated units. Theseregulations apply to all facilities that store such waste, including largequantity generators accumulating waste prior to shipment off-site.
C Underground Storage Tanks (USTs) containing petroleum andhazardous substances are regulated under Subtitle I of RCRA.Subtitle I regulations (40 CFR Part 280) contain tank design andrelease detection requirements, as well as financial responsibility andcorrective action standards for USTs. The UST program alsoincludes upgrade requirements for existing tanks that must be met byDecember 22, 1998.
C Boilers and Industrial Furnaces (BIFs) that use or burn fuelcontaining hazardous waste must comply with design and operatingstandards. BIF regulations (40 CFR Part 266, Subpart H) addressunit design, provide performance standards, require emissionsmonitoring, and restrict the type of waste that may be burned.
EPA's RCRA, Superfund and EPCRA Hotline, at (800) 424-9346, respondsto questions and distributes guidance regarding all RCRA regulations. TheRCRA Hotline operates weekdays from 9:00 a.m. to 6:00 p.m., ET, excludingFederal holidays.
Comprehensive Environmental Response, Compensation, and Liability Act
The Comprehensive Environmental Response, Compensation, and LiabilityAct (CERCLA), a 1980 law known commonly as Superfund, authorizes EPAto respond to releases, or threatened releases, of hazardous substances thatmay endanger public health, welfare, or the environment. CERCLA alsoenables EPA to force parties responsible for environmental contamination toclean it up or to reimburse the Superfund for response costs incurred by EPA.The Superfund Amendments and Reauthorization Act (SARA) of 1986revised various sections of CERCLA, extended the taxing authority for the

Metal Casting Industry Federal Statutes and Regulations
Sector Notebook Project September 199798
Superfund, and created a free-standing law, SARA Title III, also known as theEmergency Planning and Community Right-to-Know Act (EPCRA).
The CERCLA hazardous substance release reporting regulations (40 CFRPart 302) direct the person in charge of a facility to report to the NationalResponse Center (NRC) any environmental release of a hazardous substancewhich equals or exceeds a reportable quantity. Reportable quantities are listedin 40 CFR §302.4. A release report may trigger a response by EPA, or by oneor more Federal or State emergency response authorities.
EPA implements hazardous substance responses according to proceduresoutlined in the National Oil and Hazardous Substances Pollution ContingencyPlan (NCP) (40 CFR Part 300). The NCP includes provisions for permanentcleanups, known as remedial actions, and other cleanups referred to asremovals. EPA generally takes remedial actions only at sites on the NationalPriorities List (NPL), which currently includes approximately 1300 sites.Both EPA and states can act at sites; however, EPA provides responsibleparties the opportunity to conduct removal and remedial actions andencourages community involvement throughout the Superfund responseprocess.
EPA's RCRA, Superfund and EPCRA Hotline, at (800) 424-9346, answersquestions and references guidance pertaining to the Superfund program.The CERCLA Hotline operates weekdays from 9:00 a.m. to 6:00 p.m., ET,excluding Federal holidays.
Emergency Planning And Community Right-To-Know Act
The Superfund Amendments and Reauthorization Act (SARA) of 1986created the Emergency Planning and Community Right-to-Know Act(EPCRA, also known as SARA Title III), a statute designed to improvecommunity access to information about chemical hazards and to facilitate thedevelopment of chemical emergency response plans by State and localgovernments. EPCRA required the establishment of State emergencyresponse commissions (SERCs), responsible for coordinating certainemergency response activities and for appointing local emergency planningcommittees (LEPCs).
EPCRA and the EPCRA regulations (40 CFR Parts 350-372) establish fourtypes of reporting obligations for facilities which store or manage specifiedchemicals:
C EPCRA §302 requires facilities to notify the SERC and LEPC of thepresence of any extremely hazardous substance (the list of suchsubstances is in 40 CFR Part 355, Appendices A and B) if it has such

Metal Casting Industry Federal Statutes and Regulations
Sector Notebook Project September 199799
substance in excess of the substance's threshold planning quantity, anddirects the facility to appoint an emergency response coordinator.
C EPCRA §304 requires the facility to notify the SERC and the LEPCin the event of a release equaling or exceeding the reportable quantityof a CERCLA hazardous substance or an EPCRA extremelyhazardous substance.
C EPCRA §311 and §312 require a facility at which a hazardouschemical, as defined by the Occupational Safety and Health Act, ispresent in an amount exceeding a specified threshold to submit to theSERC, LEPC and local fire department material safety data sheets(MSDSs) or lists of MSDS's and hazardous chemical inventory forms(also known as Tier I and II forms). This information helps the localgovernment respond in the event of a spill or release of the chemical.
C EPCRA §313 requires manufacturing facilities included in SIC codes20 through 39, which have ten or more employees, and whichmanufacture, process, or use specified chemicals in amounts greaterthan threshold quantities, to submit an annual toxic chemical releasereport. This report, known commonly as the Form R, covers releasesand transfers of toxic chemicals to various facilities and environmentalmedia, and allows EPA to compile the national Toxic ReleaseInventory (TRI) database.
All information submitted pursuant to EPCRA regulations is publiclyaccessible, unless protected by a trade secret claim.
EPA's RCRA, Superfund and EPCRA Hotline, at (800) 424-9346, answersquestions and distributes guidance regarding the emergency planning andcommunity right-to-know regulations. The EPCRA Hotline operatesweekdays from 9:00 a.m. to 6:00 p.m., ET, excluding Federal holidays.
Clean Water Act
The primary objective of the Federal Water Pollution Control Act, commonlyreferred to as the Clean Water Act (CWA), is to restore and maintain thechemical, physical, and biological integrity of the nation's surface waters.Pollutants regulated under the CWA include "priority" pollutants, includingvarious toxic pollutants; "conventional" pollutants, such as biochemicaloxygen demand (BOD), total suspended solids (TSS), fecal coliform, oil andgrease, and pH; and "non-conventional" pollutants, including any pollutant notidentified as either conventional or priority.
Metal Casting Industry Federal Statutes and Regulations
Sector Notebook Project September 1997100
The CWA regulates both direct and indirect discharges. The NationalPollutant Discharge Elimination System (NPDES) program (CWA §502)controls direct discharges into navigable waters. Direct discharges or "pointsource" discharges are from sources such as pipes and sewers. NPDESpermits, issued by either EPA or an authorized State (EPA has authorized 42States to administer the NPDES program), contain industry-specific,technology-based and/or water quality-based limits, and establish pollutantmonitoring requirements. A facility that intends to discharge into the nation'swaters must obtain a permit prior to initiating its discharge. A permitapplicant must provide quantitative analytical data identifying the types ofpollutants present in the facility's effluent. The permit will then set theconditions and effluent limitations on the facility discharges.
A NPDES permit may also include discharge limits based on Federal or Statewater quality criteria or standards, that were designed to protect designateduses of surface waters, such as supporting aquatic life or recreation. Thesestandards, unlike the technological standards, generally do not take intoaccount technological feasibility or costs. Water quality criteria and standardsvary from State to State, and site to site, depending on the use classificationof the receiving body of water. Most States follow EPA guidelines whichpropose aquatic life and human health criteria for many of the 126 prioritypollutants.
Storm Water Discharges
In 1987 the CWA was amended to require EPA to establish a program toaddress storm water discharges. In response, EPA promulgated the NPDESstorm water permit application regulations. These regulations require thatfacilities with the following storm water discharges apply for an NPDESpermit: (1) a discharge associated with industrial activity; (2) a dischargefrom a large or medium municipal storm sewer system; or (3) a dischargewhich EPA or the State determines to contribute to a violation of a waterquality standard or is a significant contributor of pollutants to waters of theUnited States.
The term "storm water discharge associated with industrial activity" means astorm water discharge from one of 11 categories of industrial activity definedat 40 CFR 122.26. Six of the categories are defined by SIC codes while theother five are identified through narrative descriptions of the regulatedindustrial activity. If the primary SIC code of the facility is one of thoseidentified in the regulations, the facility is subject to the storm water permitapplication requirements. If any activity at a facility is covered by one of thefive narrative categories, storm water discharges from those areas where theactivities occur are subject to storm water discharge permit applicationrequirements.

Metal Casting Industry Federal Statutes and Regulations
Sector Notebook Project September 1997101
Those facilities/activities that are subject to storm water discharge permitapplication requirements are identified below. To determine whether aparticular facility falls within one of these categories, consult the regulation.
Category i: Facilities subject to storm water effluent guidelines, new sourceperformance standards, or toxic pollutant effluent standards.
Category ii: Facilities classified as SIC 24-lumber and wood products(except wood kitchen cabinets); SIC 26-paper and allied products (exceptpaperboard containers and products); SIC 28-chemicals and allied products(except drugs and paints); SIC 291-petroleum refining; and SIC 311-leathertanning and finishing, 32 (except 323)-stone, clay, glass, and concrete, 33-primary metals, 3441-fabricated structural metal, and 373-ship and boatbuilding and repairing.
Category iii: Facilities classified as SIC 10-metal mining; SIC 12-coalmining; SIC 13-oil and gas extraction; and SIC 14-nonmetallic mineralmining.
Category iv: Hazardous waste treatment, storage, or disposal facilities.
Category v: Landfills, land application sites, and open dumps that receive orhave received industrial wastes.
Category vi: Facilities classified as SIC 5015-used motor vehicle parts; andSIC 5093-automotive scrap and waste material recycling facilities.
Category vii: Steam electric power generating facilities.
Category viii: Facilities classified as SIC 40-railroad transportation; SIC 41-local passenger transportation; SIC 42-trucking and warehousing (exceptpublic warehousing and storage); SIC 43-U.S. Postal Service; SIC 44-watertransportation; SIC 45-transportation by air; and SIC 5171-petroleum bulkstorage stations and terminals.
Category ix: Sewage treatment works.
Category x: Construction activities except operations that result in thedisturbance of less than five acres of total land area.
Category xi: Facilities classified as SIC 20-food and kindred products; SIC21-tobacco products; SIC 22-textile mill products; SIC 23-apparel relatedproducts; SIC 2434-wood kitchen cabinets manufacturing; SIC 25-furnitureand fixtures; SIC 265-paperboard containers and boxes; SIC 267-convertedpaper and paperboard products; SIC 27-printing, publishing, and allied

Metal Casting Industry Federal Statutes and Regulations
Sector Notebook Project September 1997102
industries; SIC 283-drugs; SIC 285-paints, varnishes, lacquer, enamels, andallied products; SIC 30-rubber and plastics; SIC 31-leather and leatherproducts (except leather and tanning and finishing); SIC 323-glass products;SIC 34-fabricated metal products (except fabricated structural metal); SIC35-industrial and commercial machinery and computer equipment; SIC 36-electronic and other electrical equipment and components; SIC 37-transportation equipment (except ship and boat building and repairing); SIC38-measuring, analyzing, and controlling instruments; SIC 39-miscellaneousmanufacturing industries; and SIC 4221-4225-public warehousing andstorage.
Pretreatment Program
Another type of discharge that is regulated by the CWA is one that goes toa publicly-owned treatment works (POTWs). The national pretreatmentprogram (CWA §307(b)) controls the indirect discharge of pollutants toPOTWs by "industrial users." Facilities regulated under §307(b) must meetcertain pretreatment standards. The goal of the pretreatment program is toprotect municipal wastewater treatment plants from damage that may occurwhen hazardous, toxic, or other wastes are discharged into a sewer systemand to protect the quality of sludge generated by these plants. Discharges toa POTW are regulated primarily by the POTW itself, rather than the State orEPA.
EPA has developed technology-based standards for industrial users ofPOTWs. Different standards apply to existing and new sources within eachcategory. "Categorical" pretreatment standards applicable to an industry ona nationwide basis are developed by EPA. In addition, another kind ofpretreatment standard, "local limits," are developed by the POTW in order toassist the POTW in achieving the effluent limitations in its NPDES permit.
Regardless of whether a State is authorized to implement either the NPDESor the pretreatment program, if it develops its own program, it may enforcerequirements more stringent than Federal standards.
Spill Prevention, Control and Countermeasure Plans
The 1990 Oil Pollution Act requires that facilities that could reasonably beexpected to discharge oil in harmful quantities prepare and implement morerigorous Spill Prevention Control and Countermeasure (SPCC) Plan requiredunder the CWA (40 CFR §112.7). There are also criminal and civil penaltiesfor deliberate or negligent spills of oil. Regulations covering response to oildischarges and contingency plans (40 CFR Part 300), and Facility ResponsePlans to oil discharges (40 CFR §112.20) and for PCB transformers and PCB-containing items were revised and finalized in 1995.
Metal Casting Industry Federal Statutes and Regulations
Sector Notebook Project September 1997103
EPA’s Office of Water, at (202) 260-5700, will direct callers with questionsabout the CWA to the appropriate EPA office. EPA also maintains abibliographic database of Office of Water publications which can beaccessed through the Ground Water and Drinking Water resource center, at(202) 260-7786.
Safe Drinking Water Act
The Safe Drinking Water Act (SDWA) mandates that EPA establishregulations to protect human health from contaminants in drinking water.The law authorizes EPA to develop national drinking water standards and tocreate a joint Federal-State system to ensure compliance with these standards.The SDWA also directs EPA to protect underground sources of drinkingwater through the control of underground injection of liquid wastes.
EPA has developed primary and secondary drinking water standards under itsSDWA authority. EPA and authorized States enforce the primary drinkingwater standards, which are, contaminant-specific concentration limits thatapply to certain public drinking water supplies. Primary drinking waterstandards consist of maximum contaminant level goals (MCLGs), which arenon-enforceable health-based goals, and maximum contaminant levels(MCLs), which are enforceable limits set as close to MCLGs as possible,considering cost and feasibility of attainment.
The SDWA Underground Injection Control (UIC) program (40 CFR Parts144-148) is a permit program which protects underground sources of drinkingwater by regulating five classes of injection wells. UIC permits includedesign, operating, inspection, and monitoring requirements. Wells used toinject hazardous wastes must also comply with RCRA corrective actionstandards in order to be granted a RCRA permit, and must meet applicableRCRA land disposal restrictions standards. The UIC permit program isprimarily State-enforced, since EPA has authorized all but a few States toadminister the program.
The SDWA also provides for a Federally-implemented Sole Source Aquiferprogram, which prohibits Federal funds from being expended on projects thatmay contaminate the sole or principal source of drinking water for a givenarea, and for a State-implemented Wellhead Protection program, designed toprotect drinking water wells and drinking water recharge areas.
EPA’s Safe Drinking Water Hotline, at (800) 426-4791, answers questionsand distributes guidance pertaining to SDWA standards. The Hotlineoperates from 9:00 a.m. through 5:30 p.m., ET, excluding Federal holidays.

Metal Casting Industry Federal Statutes and Regulations
Sector Notebook Project September 1997104
Toxic Substances Control Act
The Toxic Substances Control Act (TSCA) granted EPA authority to createa regulatory framework to collect data on chemicals in order to evaluate,assess, mitigate, and control risks which may be posed by their manufacture,processing, and use. TSCA provides a variety of control methods to preventchemicals from posing unreasonable risk.
TSCA standards may apply at any point during a chemical’s life cycle. UnderTSCA §5, EPA has established an inventory of chemical substances. If achemical is not already on the inventory, and has not been excluded by TSCA,a premanufacture notice (PMN) must be submitted to EPA prior tomanufacture or import. The PMN must identify the chemical and provideavailable information on health and environmental effects. If available dataare not sufficient to evaluate the chemicals effects, EPA can imposerestrictions pending the development of information on its health andenvironmental effects. EPA can also restrict significant new uses of chemicalsbased upon factors such as the projected volume and use of the chemical.
Under TSCA §6, EPA can ban the manufacture or distribution in commerce,limit the use, require labeling, or place other restrictions on chemicals thatpose unreasonable risks. Among the chemicals EPA regulates under §6authority are asbestos, chlorofluorocarbons (CFCs), and polychlorinatedbiphenyls (PCBs).
EPA’s TSCA Assistance Information Service, at (202) 554-1404, answersquestions and distributes guidance pertaining to Toxic Substances ControlAct standards. The Service operates from 8:30 a.m. through 4:30 p.m., ET,excluding Federal holidays.
Clean Air Act
The Clean Air Act (CAA) and its amendments, including the Clean Air ActAmendments (CAAA) of 1990, are designed to “protect and enhance thenation's air resources so as to promote the public health and welfare and theproductive capacity of the population.” The CAA consists of six sections,known as Titles, which direct EPA to establish national standards for ambientair quality and for EPA and the States to implement, maintain, and enforcethese standards through a variety of mechanisms. Under the CAAA, manyfacilities will be required to obtain permits for the first time. State and localgovernments oversee, manage, and enforce many of the requirements of theCAAA. CAA regulations appear at 40 CFR Parts 50-99.
Pursuant to Title I of the CAA, EPA has established national ambient airquality standards (NAAQSs) to limit levels of "criteria pollutants," including

Metal Casting Industry Federal Statutes and Regulations
Sector Notebook Project September 1997105
carbon monoxide, lead, nitrogen dioxide, particulate matter, volatile organiccompounds (VOCs), ozone, and sulfur dioxide. Geographic areas that meetNAAQSs for a given pollutant are classified as attainment areas; those that donot meet NAAQSs are classified as non-attainment areas. Under section 110of the CAA, each State must develop a State Implementation Plan (SIP) toidentify sources of air pollution and to determine what reductions are requiredto meet Federal air quality standards. Revised NAAQSs for particulates andozone were proposed in 1996 and may go into effect as early as late 1997.
Title I also authorizes EPA to establish New Source Performance Standards(NSPSs), which are nationally uniform emission standards for new stationarysources falling within particular industrial categories. NSPSs are based on thepollution control technology available to that category of industrial source.
Under Title I, EPA establishes and enforces National Emission Standards forHazardous Air Pollutants (NESHAPs), nationally uniform standards orientedtowards controlling particular hazardous air pollutants (HAPs). Title I,section 112(c) of the CAA further directed EPA to develop a list of sourcesthat emit any of 189 HAPs, and to develop regulations for these categories ofsources. To date EPA has listed 174 categories and developed a schedule forthe establishment of emission standards. The emission standards will bedeveloped for both new and existing sources based on "maximum achievablecontrol technology" (MACT). The MACT is defined as the controltechnology achieving the maximum degree of reduction in the emission of theHAPs, taking into account cost and other factors.
Title II of the CAA pertains to mobile sources, such as cars, trucks, buses,and planes. Reformulated gasoline, automobile pollution control devices, andvapor recovery nozzles on gas pumps are a few of the mechanisms EPA usesto regulate mobile air emission sources.
Title IV of the CAA establishes a sulfur dioxide nitrous oxide emissionsprogram designed to reduce the formation of acid rain. Reduction of sulfurdioxide releases will be obtained by granting to certain sources limitedemissions allowances, which, beginning in 1995, will be set below previouslevels of sulfur dioxide releases.
Title V of the CAA of 1990 created a permit program for all "major sources"(and certain other sources) regulated under the CAA. One purpose of theoperating permit is to include in a single document all air emissionsrequirements that apply to a given facility. States are developing the permitprograms in accordance with guidance and regulations from EPA. Once aState program is approved by EPA, permits will be issued and monitored bythat State.
Metal Casting Industry Federal Statutes and Regulations
Sector Notebook Project September 1997106
Title VI of the CAA is intended to protect stratospheric ozone by phasing outthe manufacture of ozone-depleting chemicals and restrict their use anddistribution. Production of Class I substances, including 15 kinds ofchlorofluorocarbons (CFCs) and chloroform, were phased out (except foressential uses) in 1996.
EPA's Clean Air Technology Center, at (919) 541-0800, provides generalassistance and information on CAA standards. The Stratospheric OzoneInformation Hotline, at (800) 296-1996, provides general information aboutregulations promulgated under Title VI of the CAA, and EPA's EPCRAHotline, at (800) 535-0202, answers questions about accidental releaseprevention under CAA §112(r). In addition, the Clean Air TechnologyCenter’s website includes recent CAA rules, EPA guidance documents, andupdates of EPA activities (www.epa.gov/ttn then select Directory and thenCATC).

Metal Casting Industry Federal Statutes and Regulations
Sector Notebook Project September 1997107
VI.B. Industry Specific Requirements
Resource Conservation and Recovery Act (RCRA)
Under the authority of RCRA, EPA created a regulatory framework thataddresses the management of hazardous waste. The regulations address thegeneration, transport, storage, treatment, and disposal of hazardous waste.
The metal casting industry generates waste during molding and core making,melting operations, casting operations, and finishing and cleaning operations.The wastes that are produced during these processes which meet the RCRAhazardous waste criteria must be handled accordingly.
Molding and core making operations produce large quantities of spentfoundry sand. Although most of the spent sand is non-hazardous, sand thatresults from the production of brass or bronze may exhibit the toxicitycharacteristic for lead or cadmium. The hazardous sand may be reclaimed ina thermal treatment unit which may be subject to RCRA requirements forhazardous waste incinerators. EPA is currently taking public comment on theregulatory status of these units. Wastewaters that are produced duringmolding and core making may exhibit the corrosivity characteristic but aregenerally discharged to a POTW after being neutralized, in which case theyare not subject to RCRA. Sludges resulting from mold and core making mayalso be corrosive hazardous wastes.
The wastes associated with metal casting melting operations include fugitivedust and slag. Lead and chromium contamination may cause the waste slagto be subject to RCRA as a hazardous waste. Additionally, calcium carbidedesulfurization slag generated during metal melting could be a reactivehazardous waste. Spent solvents used in the cleaning and degreasing of scrapmetal prior to melting may also be a hazardous waste. The inorganic acidsand chlorinated solvents used in the cleaning operations could be subject toRCRA as well, if they are spilled or disposed of prior to use.
Casting facilities that use electric arc furnaces (EAF) for metal meltingproduce dust and sludge that may be characteristically hazardous. However,the emission control dust and sludge from foundry operations that use EAFsis not within the K061 hazardous waste listing. Also, this dust and sludge isnot considered to be a solid waste under RCRA when reclaimed.
Finishing operations produce wastes similar to those resulting from thecleaning and degreasing of scrap metal prior to melting, including spentsolvents and alkaline cleaners. Additionally, any sludge from spent pickleliquor recovery generated by metal casting facilities (SIC code 332) would bea listed hazardous waste (K062).

Metal Casting Industry Federal Statutes and Regulations
Sector Notebook Project September 1997108
Clean Air Act
The CAA New Source Review (NSR) requirements apply to new facilities,expansions of existing facilities, or process modifications. New sources of theNAAQS "criteria" pollutants in excess of “major” levels defined by EPA aresubject to NSR requirements (40 CFR §52.21(b)(1)(i)(a)-(b)). NSRs aretypically conducted by the state agency under standards set by EPA andadopted by the state as part of its state implementation plan (SIP). There aretwo types of NSRs: Prevention of Significant Deterioration (PSD) reviews forthose areas that are meeting the NAAQS; and nonattainment (NA) reviewsfor areas that are violating the NAAQS. Permits are required to construct oroperate the new source for PSD and NA areas.
For NA areas, permits require the new source to meet lowest achievableemission rate (LAER) standards and the operator of the new source mustprocure reductions in emissions of the same pollutants from other sources inthe NA area in equal or greater amounts to the new source. These emissionoffsets may be banked and traded through state agencies.
For PSD areas, permits require the best available control technology (BACT),and the operator or owner of the new source must conduct continuous on-siteair quality monitoring for one year prior to the new source addition todetermine the effects that the new emissions may have on air quality.
EPA has not established New Source Performance Standards (NSPSs) for themetal casting industrial category.
Under Title V of the CAAA 1990 (40 CFR Parts 70-72) all of the applicablerequirements of the Amendments are integrated into one federal renewableoperating permit. Facilities defined as major sources under the Act mustapply for permits within one year from when EPA approves the state permitprograms. Since most state programs were not approved until afterNovember 1994, Title V permits, for the most part, began to be due in late1995. Due dates for filing complete applications vary from state to state,based on the status of review and approval of the state’s Title V program byEPA.
A facility is designated as a major source if it includes sources subject to theNSPS acid rain provisions or NESHAPS, or if it releases a certain amount ofany one of the CAAA regulated pollutants (SO , NO , CO, VOC, PM ,x x 10
hazardous air pollutants, extremely hazardous substances, ozone depletingsubstances, and pollutants covered by NSPSs) depending on the region's airquality category. Title V permits may set limits on the amounts of pollutantemissions and require emissions monitoring, recordkeeping, and reporting.
Metal Casting Industry Federal Statutes and Regulations
Sector Notebook Project September 1997109
Many large and some medium-sized foundries are likely to be major sourcesand therefore must apply for a Title V permit. Selected small foundries mayalso be classified as major sources, depending on their location andoperational factors.
Clean Water Act
Foundry and die casting facility wastewater released to surface waters isregulated under the CWA (40 CFR Part 464). National Pollutant DischargeElimination System (NPDES) permits must be obtained to dischargewastewater into navigable waters (40 Part 122). Effluent limitationguidelines, new source performance standards, pretreatment standards fornew sources, and pretreatment standards for existing sources for the MetalMolding and Casting Point Source Category apply to ferrous and non-ferrousfoundries and die casters and are listed under 40 CFR Part 464 and aredivided into subparts according to the metal cast:
Subpart A Applies to aluminum casting operationsSubpart B Applies to copper casting operationsSubpart C Applies to ferrous casting operationsSubpart D Applies to zinc casting operations
In addition to the effluent guidelines, facilities that discharge to a POTW maybe required to meet National Pretreatment Standards for some contaminants.General pretreatment standards applying to most industries discharging to aPOTW are described in 40 CFR Part 403 (Contact Pat Bradley, EPA Officeof Water, 202-260-6963). As shown above, pretreatment standards applyingspecifically to the metal casting point source category are listed in thesubparts of 40 CFR Part 464 (Contact: George Jett, EPA Office of Water,202-260-7151).
Stormwater rules require that metal casting facilities with the following stormwater discharges apply for an NPDES permit: (1) a discharge associated withindustrial activity; (2) a discharge from a large or medium municipal stormsewer system; or (3) a discharge which EPA or the State determines tocontribute to a violation of a water quality standard or is a significantcontributor of pollutants to waters of the United States. The term "stormwater discharge associated with industrial activity" means a storm waterdischarge from one of 11 categories of industrial activity defined at 40 CFR122.26. The rules require that certain facilities with storm water dischargefrom from industrial activity apply for storm water permit applications (seeSection VI.A).

Metal Casting Industry Federal Statutes and Regulations
Sector Notebook Project September 1997110
Comprehensive Environmental Response, Compensation, and Liability Act (CERCLA)
The Comprehensive Environmental Response, Compensation, and LiabilityAct (CERCLA) and the Superfund Amendments and Reauthorization Act of1986 (SARA) provide the basic legal framework for the federal “Superfund”program to clean up abandoned hazardous waste sites (40 CFR Part 305). The metals and metal compounds used in metal casting, are often found incasting facilities’ air emissions, water discharges, or waste shipments for off-site disposal. These include chromium, manganese, aluminum, nickel, copper,zinc, and lead. Metals are frequently found at CERCLA's problem sites. In1989, when Congress ordered EPA and the Public Health Service's Agencyfor Toxic Substances and Disease Registry (ATSDR) to list the hazardoussubstances found most commonly at problem sites and that pose the greatestthreat to human health, lead, nickel, and aluminum all made the list (Breenand Campbell-Mohn, 1993). A number of sites containing foundry wastes areon the National Priorities (Superfund) List. Compliance with therequirements of RCRA lessens the chances that CERCLA compliance will bean issue in the future.

Metal Casting Industry Federal Statutes and Regulations
Sector Notebook Project September 1997111
VI.C. Pending and Proposed Regulatory Requirements
Resource Conservation and Recovery Act (RCRA)
Currently, the practice of adding iron dust or filings to spent foundry sand asa form of stabilization is subject to case-specific interpretation by EPAregarding whether this activity effectively treats the waste. However, EPAhas proposed to regulate this activity as impermissible dilution, which isstrictly prohibited under the land disposal restrictions program, and intendsto examine the issue further.
Thermal processing or reclamation units (TRUs) remove contaminants fromspent foundry sand primarily by combusting the organic binder materials in thesand. These units are identified as foundry furnaces under the definition ofindustrial furnace and are subject to regulation under 40 CFR Part 266,Subpart H when they burn hazardous waste. However, EPA did not considerwhether TRUs would be appropriately controlled under these standards. EPAhas proposed two approaches to ensure controls for TRUs. The first optionis a deferral from regulation under 40 CFR Part 266, Subpart H. This wouldallow development of the foundry maximum achievable control technologyunder the Clean Air Act and potentially the application of these controls toTRUs that process hazardous waste sand. The second option is to providea variance from the RCRA definition of solid waste. Under the varianceprovisions, EPA may grant a variance from the definition of solid waste formaterials that are reclaimed and used as a feedstock within the originalproduction process if the reclamation process is an essential part of theproduction process. Under this option, TRUs would not be subject to RCRAregulation, but could be regulated under the Clean Air Act or state or local airpollution laws (EPA, RCRA Hotline, 1997).
Clean Air Act
In addition to the CAA requirements discussed above, EPA is currentlyworking on or will be working on additional regulations that will directlyaffect the metal casting industry. Under Title III, EPA is required to developnational standards for 189 hazardous air pollutants (HAPs) some of which areemitted from foundries. NESHAP standards may limit the air emissions fromfoundries through Maximum Achievable Control Technology (MACT) basedon performance standards that will set limits based upon concentrations ofHAPs in the waste stream. NESHAP standards for ferrous foundries arescheduled to be promulgated by EPA in November of 2000 (James Maysilles,U.S. EPA, Office of Air, (919) 541-3265). Non-ferrous foundries and diecasting facilities will not be subject to NESHAP standards.

Metal Casting Industry Federal Statutes and Regulations
Sector Notebook Project September 1997112
EPA is also developing the Compliance Assurance Monitoring Rule. The rulemay require monitoring of certain emissions from certain facilities. Facilitiesare required to pay a fee for filing for a permit and are required to pay anannual fee based on the magnitude of the facility's potential emissions.

Metal Casting Industry Compliance and Enforcement History
Sector Notebook Project September 1997113
VII. COMPLIANCE AND ENFORCEMENT HISTORY
Background
Until recently, EPA has focused much of its attention on measuringcompliance with specific environmental statutes. This approach allows theAgency to track compliance with the Clean Air Act, the ResourceConservation and Recovery Act, the Clean Water Act, and otherenvironmental statutes. Within the last several years, the Agency has begunto supplement single-media compliance indicators with facility-specific,multimedia indicators of compliance. In doing so, EPA is in a better positionto track compliance with all statutes at the facility level, and within specificindustrial sectors.
A major step in building the capacity to compile multimedia data for industrialsectors was the creation of EPA's Integrated Data for Enforcement Analysis(IDEA) system. IDEA has the capacity to "read into" the Agency's single-media databases, extract compliance records, and match the records toindividual facilities. The IDEA system can match Air, Water, Waste,Toxics/Pesticides/EPCRA, TRI, and Enforcement Docket records for a givenfacility, and generate a list of historical permit, inspection, and enforcementactivity. IDEA also has the capability to analyze data by geographic area andcorporate holder. As the capacity to generate multimedia compliance dataimproves, EPA will make available more in-depth compliance andenforcement information. Additionally, sector-specific measures of successfor compliance assistance efforts are under development.
Compliance and Enforcement Profile Description
Using inspection, violation and enforcement data from the IDEA system, thissection provides information regarding the historical compliance andenforcement activity of this sector. In order to mirror the facility universereported in the Toxic Chemical Profile, the data reported within this sectionconsists of records only from the TRI reporting universe. With this decision,the selection criteria are consistent across sectors with certain exceptions.For the sectors that do not normally report to the TRI program, data havebeen provided from EPA's Facility Indexing System (FINDS) which tracksfacilities in all media databases. Please note, in this section, EPA does notattempt to define the actual number of facilities that fall within each sector.Instead, the section portrays the records of a subset of facilities within thesector that are well defined within EPA databases.
As a check on the relative size of the full sector universe, most notebookscontain an estimated number of facilities within the sector according to theBureau of Census (See Section II). With sectors dominated by small

Metal Casting Industry Compliance and Enforcement History
EPA Regions include the following states: I (CT, MA, ME, RI, NH, VT); II (NJ, NY, PR, VI); III (DC, DE, MD, PA,4
VA, WV); IV (AL, FL, GA, KY, MS, NC, SC, TN); V (IL, IN, MI, MN, OH, WI); VI (AR, LA, NM, OK, TX); VII(IA, KS, MO, NE); VIII (CO, MT, ND, SD, UT, WY); IX (AZ, CA, HI, NV, Pacific Trust Territories); X (AK, ID, OR,WA).
Sector Notebook Project September 1997114
businesses, such as metal finishers and printers, the reporting universe withinthe EPA databases may be small in comparison to Census data. However, thegroup selected for inclusion in this data analysis section should be consistentwith this sector's general make-up.
Following this introduction is a list defining each data column presentedwithin this section. These values represent a retrospective summary ofinspections and enforcement actions, and reflect solely EPA, State, and localcompliance assurance activities that have been entered into EPA databases.To identify any changes in trends, the EPA ran two data queries, one for thepast five calendar years (April 1, 1992 to March 31, 1997) and the other forthe most recent twelve-month period (April 1, 1996 to March 31, 1997). Thefive-year analysis gives an average level of activity for that period forcomparison to the more recent activity.
Because most inspections focus on single-media requirements, the dataqueries presented in this section are taken from single media databases. Thesedatabases do not provide data on whether inspections are state/local or EPA-led. However, the table breaking down the universe of violations does givethe reader a crude measurement of the EPA's and states' efforts within eachmedia program. The presented data illustrate the variations across EPARegions for certain sectors. This variation may be attributable to state/local4
data entry variations, specific geographic concentrations, proximity topopulation centers, sensitive ecosystems, highly toxic chemicals used inproduction, or historical noncompliance. Hence, the exhibited data do notrank regional performance or necessarily reflect which regions may have themost compliance problems.
Compliance and Enforcement Data Definitions
General Definitions
Facility Indexing System (FINDS) -- this system assigns a common facilitynumber to EPA single-media permit records. The FINDS identificationnumber allows EPA to compile and review all permit, compliance,enforcement and pollutant release data for any given regulated facility.
Integrated Data for Enforcement Analysis (IDEA) -- is a data integrationsystem that can retrieve information from the major EPA program officedatabases. IDEA uses the FINDS identification number to link separate data
Metal Casting Industry Compliance and Enforcement History
Sector Notebook Project September 1997115
records from EPA’s databases. This allows retrieval of records from acrossmedia or statutes for any given facility, thus creating a ?master list” ofrecords for that facility. Some of the data systems accessible through IDEAare: AIRS (Air Facility Indexing and Retrieval System, Office of Air andRadiation), PCS (Permit Compliance System, Office of Water), RCRIS(Resource Conservation and Recovery Information System, Office of SolidWaste), NCDB (National Compliance Data Base, Office of Prevention,Pesticides, and Toxic Substances), CERCLIS (Comprehensive Environmentaland Liability Information System, Superfund), and TRIS (Toxic ReleaseInventory System). IDEA also contains information from outside sourcessuch as Dun and Bradstreet and the Occupational Safety and HealthAdministration (OSHA). Most data queries displayed in notebook sectionsIV and VII were conducted using IDEA.
Data Table Column Heading Definitions
Facilities in Search -- are based on the universe of TRI reporters within thelisted SIC code range. For industries not covered under TRI reportingrequirements (metal mining, nonmetallic mineral mining, electric powergeneration, ground transportation, water transportation, and dry cleaning), orindustries in which only a very small fraction of facilities report to TRI (e.g.,printing), the notebook uses the FINDS universe for executing data queries.The SIC code range selected for each search is defined by each notebook'sselected SIC code coverage described in Section II.
Facilities Inspected --- indicates the level of EPA and state agencyinspections for the facilities in this data search. These values show whatpercentage of the facility universe is inspected in a one-year or five-yearperiod.
Number of Inspections -- measures the total number of inspectionsconducted in this sector. An inspection event is counted each time it isentered into a single media database.
Average Time Between Inspections -- provides an average length of time,expressed in months, between compliance inspections at a facility within thedefined universe.
Facilities with One or More Enforcement Actions -- expresses the numberof facilities that were the subject of at least one enforcement action within thedefined time period. This category is broken down further into federal andstate actions. Data are obtained for administrative, civil/judicial, and criminalenforcement actions. Administrative actions include Notices of Violation(NOVs). A facility with multiple enforcement actions is only counted oncein this column, e.g., a facility with 3 enforcement actions counts as 1 facility.

Metal Casting Industry Compliance and Enforcement History
Sector Notebook Project September 1997116
Total Enforcement Actions -- describes the total number of enforcementactions identified for an industrial sector across all environmental statutes. Afacility with multiple enforcement actions is counted multiple times, e.g., afacility with 3 enforcement actions counts as 3.
State Lead Actions -- shows what percentage of the total enforcementactions are taken by state and local environmental agencies. Varying levelsof use by states of EPA data systems may limit the volume of actionsrecorded as state enforcement activity. Some states extensively reportenforcement activities into EPA data systems, while other states may use theirown data systems.
Federal Lead Actions -- shows what percentage of the total enforcementactions are taken by the United States Environmental Protection Agency.This value includes referrals from state agencies. Many of these actions resultfrom coordinated or joint state/federal efforts.
Enforcement to Inspection Rate -- is a ratio of enforcement actions toinspections, and is presented for comparative purposes only. This ratio is arough indicator of the relationship between inspections and enforcement. Itrelates the number of enforcement actions and the number of inspections thatoccurred within the one-year or five-year period. This ratio includes theinspections and enforcement actions reported under the Clean Water Act(CWA), the Clean Air Act (CAA) and the Resource Conservation andRecovery Act (RCRA). Inspections and actions from the TSCA/FIFRA/EPCRA database are not factored into this ratio because most of the actionstaken under these programs are not the result of facility inspections. Also,this ratio does not account for enforcement actions arising from non-inspection compliance monitoring activities (e.g., self-reported waterdischarges) that can result in enforcement action within the CAA, CWA, andRCRA.
Facilities with One or More Violations Identified -- indicates thepercentage of inspected facilities having a violation identified in one of thefollowing data categories: In Violation or Significant Violation Status(CAA); Reportable Noncompliance, Current Year Noncompliance, SignificantNoncompliance (CWA); Noncompliance and Significant Noncompliance(FIFRA, TSCA, and EPCRA); Unresolved Violation and Unresolved HighPriority Violation (RCRA). The values presented for this column reflect theextent of noncompliance within the measured time frame, but do notdistinguish between the severity of the noncompliance. Violation status maybe a precursor to an enforcement action, but does not necessarily indicate thatan enforcement action will occur.

Metal Casting Industry Compliance and Enforcement History
Sector Notebook Project September 1997117
Media Breakdown of Enforcement Actions and Inspections -- fourcolumns identify the proportion of total inspections and enforcement actionswithin EPA Air, Water, Waste, and FIFRA/TSCA/EPCRA databases. Eachcolumn is a percentage of either the ?Total Inspections,” or the ?TotalActions” column.
VII.A. Metal Casting Industry Compliance History
Table 15 provides an overview of the reported compliance and enforcementdata for the metal casting industry over the past five years (April 1992 toApril 1997). These data are also broken out by EPA Regions therebypermitting geographical comparisons. A few points evident from the data arelisted below.
C Almost 80 percent of metal casting facility inspections and 63 percentof enforcement actions occurred in Regions III, IV, and V, wheremost facilities (68 percent) are located.
C Region X had a high ratio of enforcement to inspections (0.40)compared to other Regions.
C Region IX had a significantly higher average time between inspections(70 months), which means that fewer inspections were carried out inrelation to the number of facilities in the Region (54 facilities and 40inspections).
C Region IV had the shortest average time between inspections (9months), but also had the lowest rate of enforcement actions toinspections of any Region (0.05).

Metal Casting Industry Compliance and Enforcement History
Sector Notebook Project September 1997118
Tab
le 1
5: F
ive-
Yea
r E
nfor
cem
ent
and
Com
plia
nce
Sum
mar
y fo
r th
e M
etal
Cas
ting
Ind
ustr
y
AB
CD
EF
GH
IJ
Reg
ion
Fac
iliti
esin
Sea
rch
Fac
iliti
esIn
spec
ted
Num
ber
ofIn
spec
tion
sA
vera
geM
onth
sB
etw
een
Insp
ecti
ons
Fac
iliti
esw
ith
1 or
Mor
eE
nfor
cem
ent
Act
ions
Tot
alE
nfor
cem
ent
Act
ions
Per
cent
Stat
eL
ead
Act
ions
Per
cent
Fed
eral
Lea
dA
ctio
ns
Enf
orce
men
tto
Ins
pect
ion
Rat
e
I15
844
202
367
%33
%0.
07
II26
1612
812
1019
68%
32%
0.15
III
7461
458
1019
2983
%17
%0.
06
IV77
5350
59
1224
88%
12%
0.05
V30
719
11,
026
1845
6863
%37
%0.
07
VI
4425
103
266
1443
%57
%0.
14
VII
4033
167
146
1030
%70
%0.
06
VII
I9
716
342
210
0%0%
0.13
IX54
1546
704
510
0%0%
0.11
X23
1542
337
1794
%6%
0.40
TO
TA
L66
942
42,
535
1611
319
171
%29
%0.
08

Metal Casting Industry Compliance and Enforcement History
Sector Notebook Project September 1997119
VII.B. Comparison of Enforcement Activity Between Selected Industries
Tables 16 and 17 allow the compliance history of the metal casting sector tobe compared to the other industries covered by the industry sector notebooks.Comparisons between Tables 16 and 17 permit the identification of trends incompliance and enforcement records of the various industries by comparingdata covering the last five years (April 1992 to April 1997) to that of the pastyear (April 1996 to April 1997). Some points evident from the data are listedbelow.
C Over the past year, the industry has had one of the highest proportionsof facilities inspected with violations (103 percent) and enforcementactions (10 percent).
C Over the past year, the average enforcement to inspection rate for themetal casting industry has decreased to 0.06 compared to 0.08 overthe past five years.
C Of the sectors listed, facilities in the metal casting sector had one ofthe highest proportions of federal-lead enforcement actions (29percent).
Tables 18 and 19 provide a more in-depth comparison between the metalcasting industry and other sectors by breaking out the compliance andenforcement data by environmental statute. As in the previous Tables (Tables16 and 17), the data cover the last five years (Table 18) and the last one year(Table 19) to facilitate the identification of recent trends. A few pointsevident from the data are listed below.
C The percentage of inspections carried out under each environmentalstatute has changed little over the past five years compared to the pastyear. Inspections under CAA account for the majority (about 60percent) followed by RCRA and CWA.
C The percentage of CAA enforcement actions increased from 44percent over the past five years to 58 percent over the past year. Inaddition, the percentage of enforcement actions carried underFIFRA/TSCA/EPCRA/Other decreased from 14 percent to 0 percentwhile CWA and RCRA remained about the same.

Metal Casting Industry Compliance and Enforcement History
Sector Notebook Project September 1997120
Tab
le 1
6: F
ive-
Yea
r E
nfor
cem
ent
and
Com
plia
nce
Sum
mar
y fo
r Se
lect
ed I
ndus
trie
s
AB
CD
EF
GH
IJ
Indu
stry
Sec
tor
Fac
iliti
esin
Sear
ch
Fac
iliti
esIn
spec
ted
Num
ber
ofIn
spec
tion
sA
vera
geM
onth
sB
etw
een
Insp
ecti
ons
Fac
iliti
es w
ith
1or
Mor
eE
nfor
cem
ent
Act
ions
Tot
alE
nfor
cem
ent
Act
ions
Per
cent
Stat
e L
ead
Act
ions
Per
cent
Fed
eral
Lea
dA
ctio
ns
Enf
orce
men
tto
Insp
ecti
onR
ate
Met
al M
inin
g1,
232
378
1,60
046
6311
153
%47
%0.
07
Coa
l Min
ing
3,25
674
13,
748
5288
132
89%
11%
0.04
Oil
and
Gas
Ext
ract
ion
4,67
61,
902
6,07
146
149
309
79%
21%
0.05
Non
-Met
allic
Min
eral
Min
ing
5,25
62,
803
12,8
2625
385
622
77%
23%
0.05
Tex
tiles
355
267
1,46
515
5383
90%
10%
0.06
Lum
ber
and
Woo
d71
247
32,
767
1513
426
570
%30
%0.
10
Furn
iture
499
386
2,37
913
6591
81%
19%
0.04
Pulp
and
Pap
er48
443
04,
630
615
047
880
%20
%0.
10
Prin
ting
5,86
22,
092
7,69
146
238
428
88%
12%
0.06
Inor
gani
c C
hem
ical
s44
128
63,
087
989
235
74%
26%
0.08
Res
ins
and
Man
mad
e Fi
bers
329
263
2,43
08
9321
976
%24
%0.
09
Phar
mac
eutic
als
164
129
1,20
18
3512
280
%20
%0.
10
Org
anic
Che
mic
als
425
355
4,29
46
153
468
65%
35%
0.11
Agr
icul
tura
l Che
mic
als
263
164
1,29
312
4710
274
%26
%0.
08
Petr
oleu
m R
efin
ing
156
148
3,08
13
124
763
68%
32%
0.25
Rub
ber
and
Plas
tic1,
818
981
4,38
325
178
276
82%
18%
0.06
Ston
e, C
lay,
Gla
ss a
nd C
oncr
ete
615
388
3,47
411
9727
775
%25
%0.
08
Iron
and
Ste
el34
927
54,
476
512
130
571
%29
%0.
07
Met
al C
asti
ngs
669
424
2,53
516
113
191
71%
29%
0.08
Non
ferr
ous
Met
als
203
161
1,64
07
6817
478
%22
%0.
11
Fabr
icat
ed M
etal
Pro
duct
s2,
906
1,85
87,
914
2236
560
075
%25
%0.
08
Ele
ctro
nics
1,25
086
34,
500
1715
025
180
%20
%0.
06
Aut
omob
ile A
ssem
bly
1,26
092
75,
912
1325
341
382
%18
%0.
07
Ship
build
ing
and
Rep
air
4437
243
920
3284
%16
%0.
13
Gro
und
Tra
nspo
rtat
ion
7,78
63,
263
12,9
0436
375
774
84%
16%
0.06
Wat
er T
rans
port
atio
n51
419
281
638
3670
61%
39%
0.09
Air
Tra
nspo
rtat
ion
444
231
973
2748
9788
%12
%0.
10
Foss
il Fu
el E
lect
ric
Pow
er3,
270
2,16
614
,210
1440
378
976
%24
%0.
06
Dry
Cle
anin
g6,
063
2,36
03,
813
9555
6695
%5%
0.02

Metal Casting Industry Compliance and Enforcement History
Sector Notebook Project September 1997121
Tab
le 1
7: O
ne-Y
ear
Enf
orce
men
t an
d C
ompl
ianc
e Su
mm
ary
for
Sele
cted
Ind
ustr
ies
AB
CD
EF
GH
Fac
iliti
es w
ith
1 or
Mor
eV
iola
tion
sF
acili
ties
wit
h 1
or m
ore
Enf
orce
men
t A
ctio
nsT
otal
Enf
orce
men
tA
ctio
nsIn
dust
ry S
ecto
rF
acili
ties
inSe
arch
Fac
iliti
esIn
spec
ted
Num
ber
ofIn
spec
tion
sN
umbe
rP
erce
nt*
Num
ber
Per
cent
*E
nfor
cem
ent
toIn
spec
tion
Rat
eM
etal
Min
ing
1,23
214
221
110
272
%9
6%10
0.05
Coa
l Min
ing
3,25
636
276
590
25%
206%
220.
03
Oil
and
Gas
Ext
ract
ion
4,67
687
41,
173
127
15%
263%
340.
03
Non
-Met
allic
Min
eral
Min
ing
5,25
61,
481
2,45
138
426
%73
5%91
0.04
Tex
tiles
355
172
295
9656
%10
6%12
0.04
Lum
ber
and
Woo
d71
227
950
719
269
%44
16%
520.
10
Furn
iture
499
254
459
136
54%
94%
110.
02
Pulp
and
Pap
er48
431
778
824
878
%43
14%
740.
09
Prin
ting
5,86
289
21,
363
577
65%
283%
530.
04
Inor
gani
c C
hem
ical
s44
120
054
815
578
%19
10%
310.
06
Res
ins
and
Man
mad
e Fi
bers
329
173
419
152
88%
2615
%36
0.09
Phar
mac
eutic
als
164
8020
984
105%
810
%14
0.07
Org
anic
Che
mic
als
425
259
837
243
94%
4216
%56
0.07
Agr
icul
tura
l Che
mic
als
263
105
206
102
97%
55%
110.
05
Petr
oleu
m R
efin
ing
156
132
565
129
98%
5844
%13
20.
23
Rub
ber
and
Plas
tic1,
818
466
791
389
83%
337%
410.
05
Ston
e, C
lay,
Gla
ss a
nd C
oncr
ete
615
255
678
151
59%
197%
270.
04
Iron
and
Ste
el34
919
786
617
488
%22
11%
340.
04
Met
al C
asti
ngs
669
234
433
240
103%
2410
%26
0.06
Non
ferr
ous
Met
als
203
108
310
9891
%17
16%
280.
09
Fabr
icat
ed M
etal
2,90
684
91,
377
796
94%
637%
830.
06
Ele
ctro
nics
1,25
042
078
040
296
%27
6%43
0.06
Aut
omob
ile A
ssem
bly
1,26
050
71,
058
431
85%
357%
470.
04
Ship
build
ing
and
Rep
air
4422
5119
86%
314
%4
0.08
Gro
und
Tra
nspo
rtat
ion
7,78
61,
585
2,49
968
143
%85
5%10
30.
04
Wat
er T
rans
port
atio
n51
484
141
5363
%10
12%
110.
08
Air
Tra
nspo
rtat
ion
444
9615
169
72%
88%
120.
08
Foss
il Fu
el E
lect
ric
Pow
er3,
270
1,31
82,
430
804
61%
100
8%13
50.
06
Dry
Cle
anin
g6,
063
1,23
41,
436
314
25%
121%
160.
01
*Per
cent
ages
in C
olum
ns E
and
F a
re b
ased
on
the
num
ber
of fa
cili
ties
insp
ecte
d (C
olum
n C
). P
erce
ntag
es c
an e
xcee
d 10
0% b
ecau
se v
iola
tion
s an
d ac
tion
s ca
n oc
cur
wit
hout
a fa
cili
ty in
spec
tion
.

Metal Casting Industry Compliance and Enforcement History
Sector Notebook Project September 1997122
Tab
le 1
8: F
ive-
Yea
r In
spec
tion
and
Enf
orce
men
t Su
mm
ary
by S
tatu
te f
or S
elec
ted
Indu
stri
es
Indu
stry
Sec
tor
Fac
iliti
esIn
spec
ted
Tot
alIn
spec
tion
s
Tot
alE
nfor
cem
ent
Act
ions
Cle
an A
ir A
ctC
lean
Wat
er A
ctR
CR
AF
IFR
A/T
SCA
/E
PC
RA
/Oth
er
% o
f T
otal
Insp
ecti
ons
% o
fT
otal
Act
ions
% o
f T
otal
Insp
ecti
ons
% o
fT
otal
Act
ions
% o
f T
otal
Insp
ecti
ons
% o
fT
otal
Act
ions
% o
f T
otal
Insp
ecti
ons
% o
fT
otal
Act
ions
Met
al M
inin
g37
81,
600
111
39%
19%
52%
52%
8%12
%1%
17%
Coa
l Min
ing
741
3,74
813
257
%64
%38
%28
%4%
8%1%
1%
Oil
and
Gas
Ext
ract
ion
1,90
26,
071
309
75%
65%
16%
14%
8%18
%0%
3%
Non
-Met
allic
Min
eral
Min
ing
2,80
312
,826
622
83%
81%
14%
13%
3%4%
0%3%
Tex
tiles
267
1,46
583
58%
54%
22%
25%
18%
14%
2%6%
Lum
ber
and
Woo
d47
32,
767
265
49%
47%
6%6%
44%
31%
1%16
%
Furn
iture
386
2,37
991
62%
42%
3%0%
34%
43%
1%14
%
Pulp
and
Pap
er43
04,
630
478
51%
59%
32%
28%
15%
10%
2%4%
Prin
ting
2,09
27,
691
428
60%
64%
5%3%
35%
29%
1%4%
Inor
gani
c C
hem
ical
s28
63,
087
235
38%
44%
27%
21%
34%
30%
1%5%
Res
ins
and
Man
mad
e Fi
bers
263
2,43
021
935
%43
%23
%28
%38
%23
%4%
6%
Phar
mac
eutic
als
129
1,20
112
235
%49
%15
%25
%45
%20
%5%
5%
Org
anic
Che
mic
als
355
4,29
446
837
%42
%16
%25
%44
%28
%4%
6%
Agr
icul
tura
l Che
mic
als
164
1,29
310
243
%39
%24
%20
%28
%30
%5%
11%
Petr
oleu
m R
efin
ing
148
3,08
176
342
%59
%20
%13
%36
%21
%2%
7%
Rub
ber
and
Plas
tic98
14,
383
276
51%
44%
12%
11%
35%
34%
2%11
%
Ston
e, C
lay,
Gla
ss a
nd C
oncr
ete
388
3,47
427
756
%57
%13
%9%
31%
30%
1%4%
Iron
and
Ste
el27
54,
476
305
45%
35%
26%
26%
28%
31%
1%8%
Met
al C
asti
ngs
424
2,53
519
155
%44
%11
%10
%32
%31
%2%
14%
Non
ferr
ous
Met
als
161
1,64
017
448
%43
%18
%17
%33
%31
%1%
10%
Fabr
icat
ed M
etal
1,85
87,
914
600
40%
33%
12%
11%
45%
43%
2%13
%
Ele
ctro
nics
863
4,50
025
138
%32
%13
%11
%47
%50
%2%
7%
Aut
omob
ile A
ssem
bly
927
5,91
241
347
%39
%8%
9%43
%43
%2%
9%
Ship
build
ing
and
Rep
air
3724
332
39%
25%
14%
25%
42%
47%
5%3%
Gro
und
Tra
nspo
rtat
ion
3,26
312
,904
774
59%
41%
12%
11%
29%
45%
1%3%
Wat
er T
rans
port
atio
n19
281
670
39%
29%
23%
34%
37%
33%
1%4%
Air
Tra
nspo
rtat
ion
231
973
9725
%32
%27
%20
%48
%48
%0%
0%
Foss
il Fu
el E
lect
ric
Pow
er2,
166
14,2
1078
957
%59
%32
%26
%11
%10
%1%
5%
Dry
Cle
anin
g2,
360
3,81
366
56%
23%
3%6%
41%
71%
0%0%

Metal Casting Industry Compliance and Enforcement History
Sector Notebook Project September 1997123
Tab
le 1
9: O
ne-Y
ear
Insp
ecti
on a
nd E
nfor
cem
ent
Sum
mar
y by
Sta
tute
for
Sel
ecte
d In
dust
ries
Fac
iliti
esIn
spec
ted
Tot
alIn
spec
tion
s
Tot
alE
nfor
cem
ent
Act
ions
Cle
an A
ir A
ctC
lean
Wat
er A
ctR
CR
AF
IFR
A/T
SCA
/E
PC
RA
/Oth
er
Indu
stry
Sec
tor
% o
f T
otal
Insp
ecti
ons
% o
fT
otal
Act
ions
% o
f T
otal
Insp
ecti
ons
% o
fT
otal
Act
ions
% o
f T
otal
Insp
ecti
ons
% o
fT
otal
Act
ions
% o
f T
otal
Insp
ecti
ons
% o
fT
otal
Act
ions
Met
al M
inin
g14
221
110
52%
0%40
%40
%8%
30%
0%30
%
Coa
l Min
ing
362
765
2256
%82
%40
%14
%4%
5%0%
0%
Oil
and
Gas
Ext
ract
ion
874
1,17
334
82%
68%
10%
9%9%
24%
0%0%
Non
-Met
allic
Min
eral
Min
ing
1,48
12,
451
9187
%89
%10
%9%
3%2%
0%0%
Tex
tiles
172
295
1266
%75
%17
%17
%17
%8%
0%0%
Lum
ber
and
Woo
d27
950
752
51%
30%
6%5%
44%
25%
0%40
%
Furn
iture
254
459
1166
%45
%2%
0%32
%45
%0%
9%
Pulp
and
Pap
er31
778
874
54%
73%
32%
19%
14%
7%0%
1%
Prin
ting
892
1,36
353
63%
77%
4%0%
33%
23%
0%0%
Inor
gani
c C
hem
ical
s20
054
831
35%
59%
26%
9%39
%25
%0%
6%
Res
ins
and
Man
mad
e Fi
bers
173
419
3638
%51
%24
%38
%38
%5%
0%5%
Phar
mac
eutic
als
8020
914
43%
71%
11%
14%
45%
14%
0%0%
Org
anic
Che
mic
als
259
837
5640
%54
%13
%13
%47
%34
%0%
0%
Agr
icul
tura
l Che
mic
als
105
206
1148
%55
%22
%0%
30%
36%
0%9%
Petr
oleu
m R
efin
ing
132
565
132
49%
67%
17%
8%34
%15
%0%
10%
Rub
ber
and
Plas
tic46
679
141
55%
64%
10%
13%
35%
23%
0%0%
Ston
e, C
lay,
Gla
ss a
nd C
oncr
ete
255
678
2762
%63
%10
%7%
28%
30%
0%0%
Iron
and
Ste
el19
786
634
52%
47%
23%
29%
26%
24%
0%0%
Met
al C
asti
ngs
234
433
2660
%58
%10
%8%
30%
35%
0%0%
Non
ferr
ous
Met
als
108
310
2844
%43
%15
%20
%41
%30
%0%
7%
Fabr
icat
ed M
etal
849
1,37
783
46%
41%
11%
2%43
%57
%0%
0%
Ele
ctro
nics
420
780
4344
%37
%14
%5%
43%
53%
0%5%
Aut
omob
ile A
ssem
bly
507
1,05
847
53%
47%
7%6%
41%
47%
0%0%
Ship
build
ing
and
Rep
air
2251
454
%0%
11%
50%
35%
50%
0%0%
Gro
und
Tra
nspo
rtat
ion
1,58
52,
499
103
64%
46%
11%
10%
26%
44%
0%1%
Wat
er T
rans
port
atio
n84
141
1138
%9%
24%
36%
38%
45%
0%9%
Air
Tra
nspo
rtat
ion
9615
112
28%
33%
15%
42%
57%
25%
0%0%
Foss
il Fu
el E
lect
ric
Pow
er1,
318
2,43
013
559
%73
%32
%21
%9%
5%0%
0%
Dry
Cle
anin
g1,
234
1,43
616
69%
56%
1%6%
30%
38%
0%0%

Metal Casting Industry Compliance and Enforcement History
Sector Notebook Project September 1997124
VII.C. Review of Major Legal Actions
Major Cases/Supplemental Environmental Projects
This section provides summary information about major cases that haveaffected this sector, and a list of Supplemental Environmental Projects(SEPs).
VII.C.1. Review of Major Cases
As indicated in EPA’s Enforcement Accomplishments Report, FY1995 andFY1996 publications, 8 significant enforcement actions were resolved between1995 and 1996 for the metal casting industry.
EMI Company (Pennsylvania): On May 29, 1996, EPA executed a consentagreement and order settling an administrative action against EMI Companyfor payment of $20,000 and agreement to perform a SupplementalEnvironmental Project (SEP). The SEP requires respondent to install andoperate (for one (1) year) baghouse emissions control technology for four (4)electric induction furnaces presently not subject to Best Available ControlTechnology (BAT) control requirements. The total SEP capital costs andoperating expenditure costs for one year are estimated to be at least$786,664. Those particulates include some of the regulated materials (copperand manganese) that are the subject of this action. Region III filed theadministrative complaint against EMI Company of Erie, Pennsylvania forEPCRA reporting violations.
Leggett and Platt (Grafton, Wisconsin): On Monday, April 1, 1996, aconsent decree was entered in the Milwaukee Federal court with Leggett &Platt, concerning their Grafton, WI, facilities (2). A penalty of $450,000 wasstipulated in the decree based on four years of reporting failures andexceeding the Federal Pretreatment standards for the Metal Molding andCasting industry. Also, the company agreed in the consent decree not todischarge process wastes to the Grafton POTW. As a result of thisstipulation the company started a water recycle system in April, 1995, withseveral levels of plant water cleanliness. After several months ofexperimentation the company observed that the recycle system had a two-yearpayout due to the reduction of the use of plant lubricants. The yearly savingswere in excess of $50,000/year. Therefore, there was no economic benefitavailable for recovery.
Cooper Cameron (Richmond, Texas): This enforcement action arose out ofthe Region VI Foundry Initiative. EPA conducted an inspection of theCooper Industries, Inc., Oil Tool Division in Richmond, Texas on September21-23, 1994. At that facility, the Cooper Oil Tool Division manufactured a

Metal Casting Industry Compliance and Enforcement History
Sector Notebook Project September 1997125
variety of low and high carbon steel and stainless steel oil tool castings forvalves and other equipment. During the inspection, EPA discovered a wastepile which contained Electric Arc Furnace (EAF) baghouse dust. Thismaterial was sampled using the TCLP method and was found to containchromium (D007) above the 5.0 mg/L regulatory level. Therefore, the EAFbaghouse dust is a hazardous waste. Cooper Oil Tool Division was acquiredby Cooper Cameron Corporation which was spun off from Cooper Industries,Inc. in 1995. As the corporate successor to the Oil Tool Division, CooperCameron became responsible for the cited violations. Region VIsimultaneously filed the consent agreement/consent order on September 30,1996, assessing a civil penalty of $45,000 plus injunctive relief. Additionally,Cooper Cameron has agreed to remediate, under the Texas Natural ResourceConservation Commision (TNRCC) Voluntary Cleanup Program,approximately 30 acres of waste materials stored in piles on their site. It isestimated that this action will reduce the risk of releasing more than 100 tonsof chromium contaminated soil. The agreement to remediate the waste pileis a result of concern over environmental justice. The surrounding communityis approximately 51% minority while Texas’ average is 39%.
HICA Steel Foundry and Upgrade Co. (Shreveport, Louisiana): OnNovember 7, 1995, EPA issued HICA Steel Foundry and Upgrade Companyan administrative order (complaint). The order proposed a $472,000 fine andrequired closure of several unauthorized hazardous waste management units.This action required the removal and proper disposal of 2,600 gallons oncorrosive and ignitable hazardous waste and 255 tons of lead and chromiumcontaminated waste from the facility.
NIBCO, Inc. (Blytheville, Arkansas): A final consent agreement/consentorder was signed by both Region VI and NIBCO on September 30, 1996.NIBCO agreed to pay $750,000 in cash to satisfy the approximately $2.5million in civil penalties assessed by Region VI in this Foundry Initiativeenforcement action. The enforcement action against NIBCO originatedbecause the facility was treating sand used in the casting of metal valves(casting sand) with metallic iron dust, without a permit, and disposing of thematerial in the Nacogdoches municipal landfill. The casting sand absorbs leadduring the casting process, making it a hazardous waste. In order to offsetthe civil penalty, NIBCO agreed to work with Texas Natural ResourceConservation Commision (TNRCC) and the City of Nacogdoches tocharacterize the foundry sand waste disposed of in the Nacogdochesmunicipal landfill, and ensure closure and post-closure measures areperformed in accordance with all applicable requirements and schedulesestablished by TNRCC.

Metal Casting Industry Compliance and Enforcement History
Sector Notebook Project September 1997126
Lynchburg Foundry Company (Lynchburg, VA): On August 24, 1995, theRegion III Administrator signed a consent order which requires LynchburgFoundry Company to perform tasks set out in the compliance section of theconsent agreement, and to pay $330,000 to EPA. Lynchburg, located inLynchburg, Virginia, operates two facilities: Radford and Archer Creek, bothof which manufacture metal automotive parts. Under the terms of the consentagreement and order, Lynchburg must: 1) list all hazardous wastes handledat both facilities within its hazardous waste notification filed with the VirginiaDepartment of Hazardous Waste; 2) amend or supplement its emergencycontingency plans for both facilities to reflect the arrangements agreed to bylocal emergency services; and 3) permanently cease illegally storing ortreating D006 and D008 hazardous wastes in waste piles at either facility.
Great Lakes Casting Corporation (Ludington, MI): On November 15, 1994,a consent decree was entered in the U.S. District Court for the WesternDistrict of Michigan in the U.S. v. Great Lakes Casting Corporation caserequiring Great Lakes to pay a civil penalty of $350,000 for illegal hazardouswaste disposal under RCRA.
CMI-Cast Parts, Inc. (Cadillac, MI): A consent agreement and final orderwas signed on December 22, 1994, which settled an administrative complaintagainst CMI-Cast Parts, Inc. CMI-Cast Parts, Inc. is a Michigan corporationwhich owns and operates an iron foundry in Cadillac, Michigan. CMI-CastParts, Inc. failed to obtain interim status or a proper operating permit to treat,store or dispose of hazardous waste at its Cadillac facility. From September1990 to January 1994, the facility failed to comply with the hazardous wastemanagement standards. On January 26, 1995, CMI-Cast Parts, Inc., submitteda certified check in the amount of $454,600.00, payable to the Treasurer ofthe United States of America, for final settlement of the enforcement action.
VII.C.2. Supplementary Environmental Projects (SEPs)
SEPs are compliance agreements that reduce a facility's non-compliancepenalty in return for an environmental project that exceeds the value of thereduction. Often, these projects fund pollution prevention activities that canreduce the future pollutant loadings of a facility. Information on SEP casescan be accessed via the Internet at EPA’s Enviro$en$e Website:http://es.inel.gov/sep.
Metal Casting Industry Activities and Initiatives
Sector Notebook Project September 1997127
VIII. COMPLIANCE ASSURANCE ACTIVITIES AND INITIATIVES
This section highlights the activities undertaken by this industry sector andpublic agencies to voluntarily improve the sector's environmentalperformance. These activities include those initiated independently byindustrial trade associations. In this section, the notebook also contains alisting and description of national and regional trade associations.
VIII.A. Sector-related Environmental Programs and Activities
VIII.A.1. Federal Activities
Metalcasting Competitiveness Research (MCR) Program
The U.S. Department of Energy (DOE) Metalcasting CompetitivenessResearch Act (Public Law 101-425) was signed in 1990 and established theU.S. DOE, Office of Industrial Technology Metalcasting CompetitivenessResearch (MCR) Program. The program provides assistance to themetalcasting industry by fostering R&D in technology areas that wereidentified as priority in nature by the industry including technologycompetitiveness and energy efficiency. In this program, industry and the DOEprovide cost-share funding to metalcasting research institutions that conductthe R&D. Projects are chosen based on a set of research priorities developedby the Metalcasting Industrial Advisory Board (IAB). The IAB meets oncea year to revise these priorities. As of 1996, 24 projects have been fundedthrough the MCR Program, a number of them having direct and indirectbenefits to the environment.
Casting Emission Reduction Program
The Casting Emission Reduction Program (CERP) is primarily focused ondeveloping new materials, processes or equipment for metalcastingmanufacturing which will achieve a near-zero effect on the environment whileproducing high quality components for the U.S. military and other users. Theprogram also has the objective of bridging the critical gap between laboratoryand full scale casting production. The result will be a platform for proofingand validating the next generation of light weight weapon system componentsusing near net shape metal castings.
The program was initiated by the Department of Defense (DoD) in responseto the rapid reduction in domestic foundries capable of producing the criticalcomponents of military hardware. These parts range from tank tracks andturrets to the tail structure of the F-16 fighter. The DoD sees an immediatethreat to sand casting foundries and their ability to withstand the changesresulting from the Titles III and V Amendments to the 1990 Clean Air Act.

Metal Casting Industry Activities and Initiatives
Sector Notebook Project September 1997128
In addition, DoD realizes that the needs of the military for post year 2000hardware will depend on manufacturing technologies which do not exist todayor are unable to make the transition from the lab bench to the shop floor.CERP aims to provide the country with the ability to launch lighter weightcastings more quickly and at the same time meet the more demandingenvironmental regulations of the 1990 Clean Air Act Amendments. Althoughthe program was initiated to address military needs, it is anticipated that it willbenefit the entire industry.
The specific activities of CERP will include obtaining a baseline of emissionsfrom foundries across the U.S., developing a pilot foundry at McClellan AFBin California for the testing and prototyping of new casting processes andmaterials, and developing the real-time emission instrumentation forfoundries. The five-year program receives Congressional appropriationsunder the Research, Development, Test & Defense Wide category. Othertechnical partners directly supporting the project include the AmericanFoundrymen’s Society, the U.S. Environmental Protection Agency (EPA), theCalifornia Air Resources Board (CARB), and the U.S. Council forAutomotive Research (USCAR). Contact: Bill Walden, (916) 643-1090.
EPA Region VI Foundry Initiative
EPA’s Region VI (Oklahoma, Texas, Louisiana, Arkansas, New Mexico)began a Foundry Initiative in 1993 to improve compliance rates among the600 foundries in the region. An initial inspection of 27 foundries in theRegion indicated that a large percentage had potential RCRA violations.Region VI formed a partnership with the States and the AmericanFoundrymen’s Society to develop an initiative for environmental compliancewhich would be beneficial to foundries. EPA, the States and foundryrepresentatives established a workgroup that provides an open forum fordiscussion, identifies relevant environmental issues facing foundries anddevelops educational assistance programs.
Through education and compliance assistance, the program aims to improvecommunication between the industry and the regulatory agencies and increasevoluntary compliance with the regulations. The program provides foundrieswith information to fix problems before active enforcement occurs. Forexample, in Oklahoma where the initiative has recently been completed, a sixmonth correction period was offered. Workshops and seminars were held ineach state and individual compliance assistance and site visits are beingoffered. Contact: Joel Dougherty, Ph.D., (214) 665-2281.

Metal Casting Industry Activities and Initiatives
Sector Notebook Project September 1997129
VIII.A.2. State Activities
Oklahoma
The Oklahoma Department of Environmental Quality (DEQ) CustomerAssistance Program recently completed its Foundry Initiative with EPARegion VI (See above). After Region 6 made plans to inspect 12 facilities inOklahoma, the Oklahoma (DEQ) suggested an alternate strategy. A multi-media workshop was held in April 1995 that focused on pollution issuesfacing the foundry industry. From that workshop, an entire state-widecompliance achievement program was developed for metal casting facilities.
The Program consisted of the following trade-offs between industry and theregulators.
1) The industry would perform an environmental self-audit andfix any problems identified.
2) The DEQ and the EPA would allow a six month “correctionperiod.”
3) During the correction period any regularly scheduled annualinspections were canceled. This allowed the facility to focuson identifying and correcting areas of non-compliance.
4) At the end of the “correction period” there would be a returnto normally scheduled inspections.
Of the 45 qualifying facilities in Oklahoma, 23 participated in the program.Each of the 23 facilities performed a self-audit that covered air quality, waterquality, and waste management issues. Each facility also completed theprogram, which included workshops, self-audits, site visits, and “free”inspections. The types of compliance issues that were corrected as a result ofthe program were:
1) state minor air permits,2) solid waste disposal approvals,3) storm water pollution prevention plans,4) SARA Title III reporting, and5) air pollution controls.
An important outcome was the new relationship between the foundries andthe agency. This new relationship was based on information sharing for thecommon goal of compliance. The participating foundries were able to obtainpermits and disposal approvals without penalty. Several facilities continue towork with the DEQ to solve more complex compliance issues, such as on-siteland disposal of foundry sand. Contact: Dave Dillon, Customer AssistanceProgram, Oklahoma DEQ, (405) 271-1400.
Metal Casting Industry Activities and Initiatives
Sector Notebook Project September 1997130
University of Wisconsin - Milwaukee Center for By-Product Utilization
At the University of Wisconsin - Milwaukee Center for By-ProductUtilization researchers are examining the feasibility of using spent foundrysand and slag as feed for concrete manufacturing. The center is testing thecompression strengths of concrete mixed with 25 percent and 35 percent (byweight) of different types of used foundry sand. Tests are also being carriedout substituting foundry sand in asphaltic concrete. Many of the tests haveshown that structural grade concrete and asphaltic concrete can be producedsuccessfully and economically using waste foundry sand.

Metal Casting Industry Activities and Initiatives
Sector Notebook Project September 1997131
VIII.B. EPA Voluntary Programs
33/50 Program
The 33/50 Program is a groundbreaking program that has focused onreducing pollution from seventeen high-priority chemicals through voluntarypartnerships with industry. The program's name stems from its goals: a 33%reduction in toxic releases by 1992, and a 50% reduction by 1995, against abaseline of 1.5 billion pounds of releases and transfers in 1988. The resultshave been impressive: 1,300 companies have joined the 33/50 Program(representing over 6,000 facilities) and have reached the national targets ayear ahead of schedule. The 33% goal was reached in 1991, and the 50%goal -- a reduction of 745 million pounds of toxic wastes -- was reached in1994. The 33/50 Program can provide case studies on many of the corporateaccomplishments in reducing waste (Contact 33/50 Program Director DavidSarokin -- 202-260-6396).
Table 19 lists those companies participating in the 33/50 program thatreported four-digit SIC codes within 332 and 336 to TRI. Some of thecompanies shown also listed facilities that are not producing metal castings.The number of facilities within each company that are participating in the33/50 program and that report metal casting SIC codes is shown. Whereavailable and quantfiable against 1988 releases and transfers, each company’s33/50 goals for 1995 and the actual total releases and transfers and percentreduction between 1988 and 1994 are presented.
Fourteen of the seventeen target chemicals were reported to TRI by metalcasting facilities in 1994. Of all TRI chemicals released and transferred by themetal casting industry, nickel and nickel compounds, and chromium andchromium compounds (both 33/50 target chemicals), were released andtransferred second and third most frequently (behind copper), and were in thetop ten largest volume released and transferred. Other frequently reported33/50 target chemicals were lead and lead compounds, xylenes and toluene.
Table 20 shows that 55 companies comprised of 129 facilities reporting SIC332 and 336 are participating in the 33/50 program. For those companiesshown with more than one metal casting facility, all facilities may not beparticipating in 33/50. The 33/50 goals shown for companies with multiplemetal casting facilities, however, are company-wide, potentially aggregatingmore than one facility and facilities not carrying out metal casting operations.In addition to company-wide goals, individual facilities within a company mayhave their own 33/50 goals or may be specifically listed as not participatingin the 33/50 program. Since the actual percent reductions shown in the lastcolumn apply to all of the companies’ metal casting facilities and only metalcasting facilities, direct comparisons to those company goals incorporating

Metal Casting Industry Activities and Initiatives
Sector Notebook Project September 1997132
non-metal casting facilities or excluding certain facilities may not be possible.For information on specific facilities participating in 33/50, contact DavidSarokin (202-260-6907) at the 33/50 Program Office.
Table 20: Metal Casting Industry Participation in the 33/50 Program
Parent Company (Headquarters Location)
Company- Company- 1988 TRI 1994 TRI Actual %Owned Metal Wide % Releases and Releases and Reduction for
Casting Facilities Reduction Transfers of Transfers of Metal CastingReporting 33/50 Goal 33/50 Chemicals 33/50 Chemicals Facilities
Chemicals (1988 to 1995) (pounds) (pounds) (1988-1994)
1
2 2
A B & I IncorporatedOakland, CA
1 98 455,570 345,419 24
Allied-Signal IncMorristown, NJ
1 50 500 0 100
American Cast Iron Pipe Co Birmingham, AL
3 25 761,209 188,769 75
Ampco Metal Mfg. Inc.Milwaukee, WI
2 * 2,500 12,552 -402
Amsted IndustriesIncorporated - Chicago, IL
9 66 1,066,730 2,174,300 -104
Armco Inc - Pittsburgh, PA 3 4 74,810 16,480 78Auburn Foundry IncAuburn, IN
1 99 592,150 465 100
Bloomfield Foundry IncBloomfield, IA
1 *** 500 520 -4
Burnham CorporationLancaster, PA
1 95 99,149 700 99
Cast-Fab Technologies IncCincinnati, OH
1 54 24,196 50 100
Caterpillar Inc - Peoria, IL 2 60 24,650 265,815 -978Chrysler CorporationAuburn Hills, MI
2 80 37,082 18,281 51
Columbia Steel Casting CoPortland, OR
1 * 0 16,801 -
Cooper Industries IncHouston, TX
4 75 100,873 224,830 -123
Dalton Foundries IncWarsaw, IN
2 75 594,000 106,996 82
Dana CorporationToledo, OH
1 ** 0 8,860 -
Deere & CompanyMoline, IL
1 * 161,942 8,337 95
Duriron Company IncDayton, OH
1 36 49,725 0 100
Electric Steel Castings CoIndianapolis, IN
1 *** 0 0 -
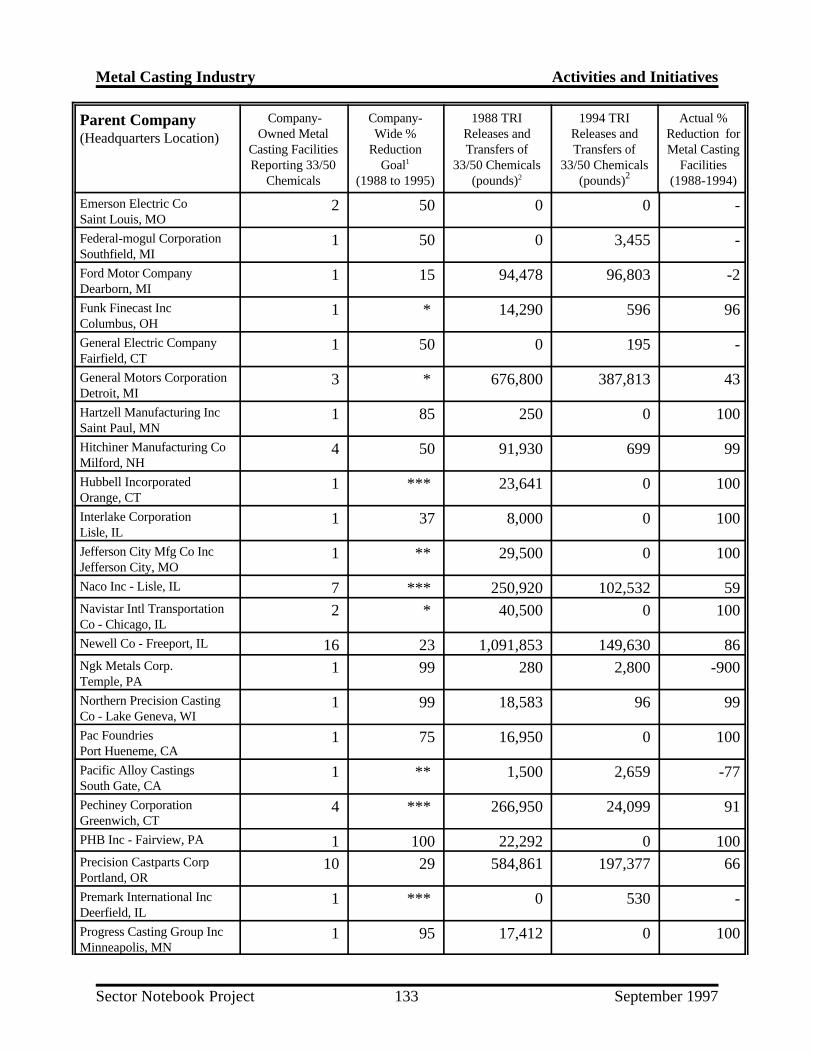
Metal Casting Industry Activities and Initiatives
Parent Company (Headquarters Location)
Company- Company- 1988 TRI 1994 TRI Actual %Owned Metal Wide % Releases and Releases and Reduction for
Casting Facilities Reduction Transfers of Transfers of Metal CastingReporting 33/50 Goal 33/50 Chemicals 33/50 Chemicals Facilities
Chemicals (1988 to 1995) (pounds) (pounds) (1988-1994)
1
2 2
Sector Notebook Project September 1997133
Emerson Electric CoSaint Louis, MO
2 50 0 0 -
Federal-mogul CorporationSouthfield, MI
1 50 0 3,455 -
Ford Motor CompanyDearborn, MI
1 15 94,478 96,803 -2
Funk Finecast IncColumbus, OH
1 * 14,290 596 96
General Electric Company Fairfield, CT
1 50 0 195 -
General Motors CorporationDetroit, MI
3 * 676,800 387,813 43
Hartzell Manufacturing IncSaint Paul, MN
1 85 250 0 100
Hitchiner Manufacturing CoMilford, NH
4 50 91,930 699 99
Hubbell IncorporatedOrange, CT
1 *** 23,641 0 100
Interlake CorporationLisle, IL
1 37 8,000 0 100
Jefferson City Mfg Co IncJefferson City, MO
1 ** 29,500 0 100
Naco Inc - Lisle, IL 7 *** 250,920 102,532 59Navistar Intl TransportationCo - Chicago, IL
2 * 40,500 0 100
Newell Co - Freeport, IL 16 23 1,091,853 149,630 86Ngk Metals Corp.Temple, PA
1 99 280 2,800 -900
Northern Precision CastingCo - Lake Geneva, WI
1 99 18,583 96 99
Pac Foundries Port Hueneme, CA
1 75 16,950 0 100
Pacific Alloy CastingsSouth Gate, CA
1 ** 1,500 2,659 -77
Pechiney CorporationGreenwich, CT
4 *** 266,950 24,099 91
PHB Inc - Fairview, PA 1 100 22,292 0 100Precision Castparts CorpPortland, OR
10 29 584,861 197,377 66
Premark International IncDeerfield, IL
1 *** 0 530 -
Progress Casting Group IncMinneapolis, MN
1 95 17,412 0 100
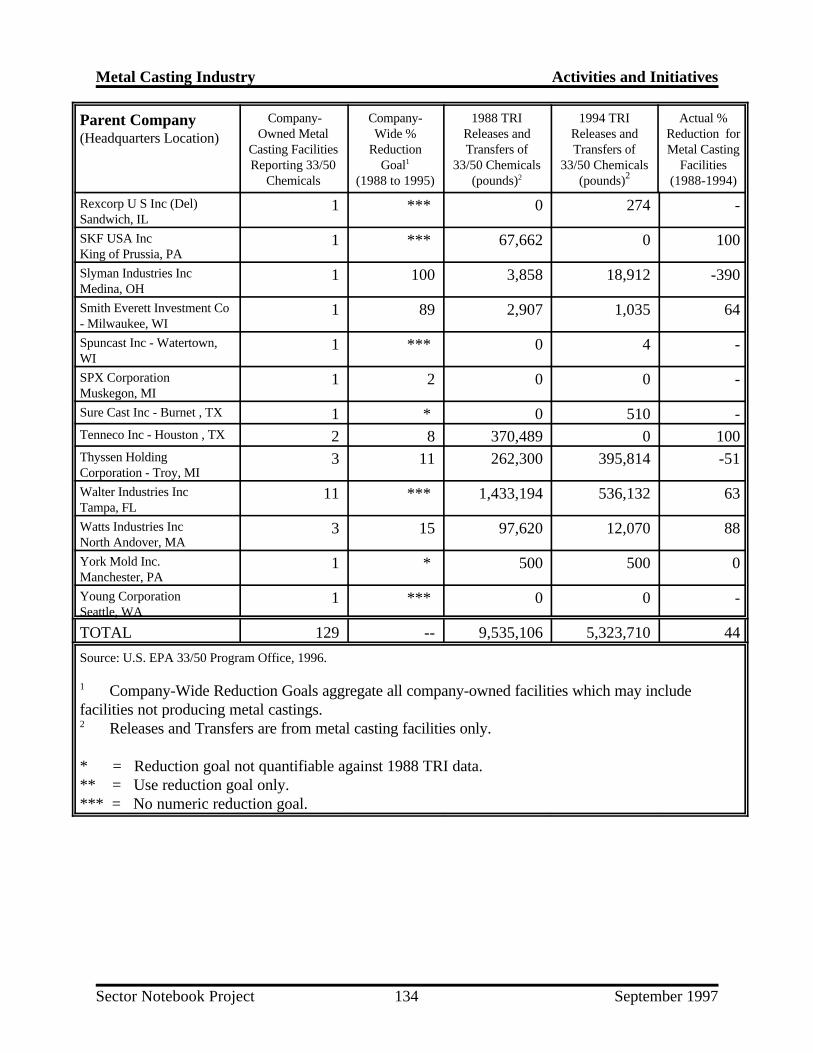
Metal Casting Industry Activities and Initiatives
Parent Company (Headquarters Location)
Company- Company- 1988 TRI 1994 TRI Actual %Owned Metal Wide % Releases and Releases and Reduction for
Casting Facilities Reduction Transfers of Transfers of Metal CastingReporting 33/50 Goal 33/50 Chemicals 33/50 Chemicals Facilities
Chemicals (1988 to 1995) (pounds) (pounds) (1988-1994)
1
2 2
Sector Notebook Project September 1997134
Rexcorp U S Inc (Del)Sandwich, IL
1 *** 0 274 -
SKF USA IncKing of Prussia, PA
1 *** 67,662 0 100
Slyman Industries IncMedina, OH
1 100 3,858 18,912 -390
Smith Everett Investment Co- Milwaukee, WI
1 89 2,907 1,035 64
Spuncast Inc - Watertown,WI
1 *** 0 4 -
SPX CorporationMuskegon, MI
1 2 0 0 -
Sure Cast Inc - Burnet , TX 1 * 0 510 -Tenneco Inc - Houston , TX 2 8 370,489 0 100Thyssen HoldingCorporation - Troy, MI
3 11 262,300 395,814 -51
Walter Industries IncTampa, FL
11 *** 1,433,194 536,132 63
Watts Industries IncNorth Andover, MA
3 15 97,620 12,070 88
York Mold Inc. Manchester, PA
1 * 500 500 0
Young CorporationSeattle, WA
1 *** 0 0 -
TOTAL 129 -- 9,535,106 5,323,710 44
Source: U.S. EPA 33/50 Program Office, 1996.
Company-Wide Reduction Goals aggregate all company-owned facilities which may include1
facilities not producing metal castings. Releases and Transfers are from metal casting facilities only.2
* = Reduction goal not quantifiable against 1988 TRI data.** = Use reduction goal only.*** = No numeric reduction goal.

Metal Casting Industry Activities and Initiatives
Sector Notebook Project September 1997135
Environmental Leadership Program
The Environmental Leadership Program (ELP) is a national initiativedeveloped by EPA that focuses on improving environmental performance,encouraging voluntary compliance, and building working relationships withstakeholders. EPA initiated a one year pilot program in 1995 by selecting 12projects at industrial facilities and federal installations which woulddemonstrate the principles of the ELP program. These principles include:environmental management systems, multimedia compliance assurance, third-party verification of compliance, public measures of accountability, pollutionprevention, community involvement, and mentor programs. In return forparticipating, pilot participants received public recognition and were given aperiod of time to correct any violations discovered during these experimentalprojects.
EPA is making plans to launch its full-scale Environmental LeadershipProgram in 1997. The full-scale program will be facility-based with a 6-yearparticipation cycle. Facilities that meet certain requirements will be eligibleto participate, such as having a community outreach/employee involvementprograms and an environmental management system (EMS) in place for 2years. (Contact: http://es.inel.gov/elp or Debby Thomas, ELP DeputyDirector, at 202-564-5041)
Project XL
Project XL was initiated in March 1995 as a part of President Clinton’sReinventing Environmental Regulation initiative. The projects seek toachieve cost effective environmental benefits by providing participantsregulatory flexibility on the condition that they produce greater environmentalbenefits. EPA and program participants will negotiate and sign a Final ProjectAgreement, detailing specific environmental objectives that the regulatedentity shall satisfy. EPA will provide regulatory flexibility as an incentive forthe participants’ superior environmental performance. Participants areencouraged to seek stakeholder support from local governments, businesses,and environmental groups. EPA hopes to implement fifty pilot projects infour categories, including industrial facilities, communities, and governmentfacilities regulated by EPA. Applications will be accepted on a rolling basis.For additional information regarding XL projects, including applicationprocedures and criteria, see the May 23, 1995 Federal Register Notice.(Contact: Fax-on-Demand Hotline 202-260-8590, Web:http://www.epa.gov/ProjectXL, or Christopher Knopes at EPA’s Office ofPolicy, Planning and Evaluation 202-260-9298)

Metal Casting Industry Activities and Initiatives
Sector Notebook Project September 1997136
Climate Wise Program
Climate Wise is helping US industries turn energy efficiency and pollutionprevention into a corporate asset. Supported by the technical assistance,financing information and public recognition that Climate Wise offers,participating companies are developing and launching comprehensiveindustrial energy efficiency and pollution prevention action plans that savemoney and protect the environment. The nearly 300 Climate Wise companiesexpect to save more than $300 million and reduce greenhouse gas emissionsby 18 million metric tons of carbon dioxide equivalent by the year 2000.Some of the actions companies are undertaking to achieve these resultsinclude: process improvements, boiler and steam system optimization, aircompressor system improvements, fuel switching, and waste heat recoverymeasures including cogeneration. Created as part of the President’s ClimateChange Action Plan, Climate Wise is jointly operated by the Department ofEnergy and EPA. Under the Plan many other programs were also launchedor upgraded including Green Lights, WasteWi$e and DoE’s Motor ChallengeProgram. Climate Wise provides an umbrella for these programs whichencourage company participation by providing information on the range ofpartnership opportunities available. (Contact: Pamela Herman, EPA, 202-260-4407 or Jan Vernet, DoE, 202-586-4755)
Energy Star Buildings Program
EPA’s ENERGY STAR Buildings Program is a voluntary, profit-based programdesigned to improve the energy-efficiency in commercial and industrialbuildings. Expanding the successful Green Lights Program, ENERGY STAR
Buildings was launched in 1995. This program relies on a 5-stage strategydesigned to maximize energy savings thereby lowering energy bills, improvingoccupant comfort, and preventing pollution -- all at the same time. Ifimplemented in every commercial and industrial building in the United States,ENERGY STAR Buildings could cut the nation’s energy bill by up to $25 billionand prevent up to 35% of carbon dioxide emissions. (This is equivalent totaking 60 million cars of the road). ENERGY STAR Buildings participantsinclude corporations; small and medium sized businesses; local, federal andstate governments; non-profit groups; schools; universities; and health carefacilities. EPA provides technical and non-technical support includingsoftware, workshops, manuals, communication tools, and an informationhotline. EPA’s Office of Air and Radiation manages the operation of theENERGY STAR Buildings Program. (Contact: Green Light/Energy Star Hotlineat 1-888-STAR-YES or Maria Tikoff Vargas, EPA Program Director at 202-233-9178 or visit the ENERGY STAR Buildings Program website athttp://www.epa.gov/appdstar/buildings/)

Metal Casting Industry Activities and Initiatives
Sector Notebook Project September 1997137
Green Lights Program
EPA’s Green Lights program was initiated in 1991 and has the goal ofpreventing pollution by encouraging U.S. institutions to use energy-efficientlighting technologies. The program saves money for businesses andorganizations and creates a cleaner environment by reducing pollutantsreleased into the atmosphere. The program has over 2,345 participants whichinclude major corporations, small and medium sized businesses, federal, stateand local governments, non-profit groups, schools, universities, and healthcare facilities. Each participant is required to survey their facilities andupgrade lighting wherever it is profitable. As of March 1997, participants hadlowered their electric bills by $289 million annually. EPA provides technicalassistance to the participants through a decision support software package,workshops and manuals, and an information hotline. EPA’s Office of Air andRadiation is responsible for operating the Green Lights Program. (Contact:Green Light/Energy Star Hotline at 1-888-STARYES or Maria TikoffVargar, EPA Program Director, at 202-233-9178)
WasteWi$e Program
The WasteWi$e Program was started in 1994 by EPA’s Office of Solid Wasteand Emergency Response. The program is aimed at reducing municipal solidwastes by promoting waste prevention, recycling collection and themanufacturing and purchase of recycled products. As of 1997, the programhad about 500 companies as members, one third of whom are Fortune 1000corporations. Members agree to identify and implement actions to reducetheir solid wastes setting waste reduction goals and providing EPA withyearly progress reports. To member companies, EPA, in turn, providestechnical assistance, publications, networking opportunities, and national andregional recognition. (Contact: WasteWi$e Hotline at 1-800-372-9473 orJoanne Oxley, EPA Program Manager, 703-308-0199)
NICE3
The U.S. Department of Energy is administering a grant program called TheNational Industrial Competitiveness through Energy, Environment, andEconomics (NICE ). By providing grants of up to 45 percent of the total3
project cost, the program encourages industry to reduce industrial waste atits source and become more energy-efficient and cost-competitive throughwaste minimization efforts. Grants are used by industry to design, test, anddemonstrate new processes and/or equipment with the potential to reducepollution and increase energy efficiency. The program is open to allindustries; however, priority is given to proposals from participants in theforest products, chemicals, petroleum refining, steel, aluminum, metal casting

Metal Casting Industry Activities and Initiatives
Sector Notebook Project September 1997138
and glass manufacturing sectors. (Contact: http//www.oit.doe.gov/access/nice3, Chris Sifri, DOE, 303-275-4723 or Eric Hass, DOE, 303-275-4728)
Design for the Environment (DfE)
DfE is working with several industries to identify cost-effective pollutionprevention strategies that reduce risks to workers and the environment. DfEhelps businesses compare and evaluate the performance, cost, pollutionprevention benefits, and human health and environmental risks associated withexisting and alternative technologies. The goal of these projects is toencourage businesses to consider and use cleaner products, processes, andtechnologies. For more information about the DfE Program, call (202) 260-1678. To obtain copies of DfE materials or for general information aboutDfE, contact EPA’s Pollution Prevention Information Clearinghouse at (202)260-1023 or visit the DfE Website at http://es.inel.gov/dfe.
VIII.C. Trade Association/Industry Sponsored Activity
VIII.C.1. Industry Research Programs
American Metalcasting Consortium (AMC)
The American Metalcasting Consortium (AMC) is a group of sixorganizations from the metalcasting industry that have joined together to allythe thousands of small and medium sized metalcasters within the market in aneffort to re-establish American viability in the metalcasting industry. AMCaims to energize critical facets of the industry which stimulate lead time andcost reductions, quality, and market share/growth. These goals are beingimplemented through efforts focused on projects in the areas of 1) appliedresearch and development, 2) education, training, and technology transfer, 3)small business, and 4) casting applications development. Many of the projectswill result in positive environmental impacts by improving the industry’soverall energy efficiency and reducing the quantity of wastes and off-speccastings. The AMC organizations are: The American Foundrymen’s Society(AFS); Non-Ferrous Founders’ Society (NFFS); North American Die CastingAssociation (NADCA); and the Steel Founders’ Society of America (SFSA).
Cast Metals Coalition (CMC)
In 1995, Chief Executive Officers and Presidents from the foundry, diecasting,and foundry supply industries developed goals for the future of the industryin Beyond 2000: A Vision for the American Metalcasting Industry.Representatives from the American Foundrymen’s Society, the SteelFounders’ Society of America, and the North American Die CastersAssociation formed the Cast Metals Coalition (CMC). The CMC is working

Metal Casting Industry Activities and Initiatives
Sector Notebook Project September 1997139
towards developing a technology roadmap for pursuing and achieving thesegoals. CMC is working with industry and research institutions, includinguniversities and national laboratories to develop this roadmap.
Pennsylvania Foundry Consortia
A consortia of Pennsylvania foundries, the Pennsylvania Foundrymen’sAssociation and Penn State University have been working cooperatively since1985 on issues associated with solid waste disposal, sand reclamation, andbeneficial use of foundry residuals. This group is addressing the impedimentsto beneficial use of foundry residuals on a comprehensive national level. Thegoals of the research are to maximize the beneficial reuse of environmentallysafe foundry residuals and to streamline the path for their acceptability byother industries. Specific tasks carried out involve establishing a database oftechnical and environmental information to support reuse applications,developing and administering a comprehensive survey of potential aggregateusers, and performing physical and environmental testing to demonstrate theapplicability of residual wastes for reuse applications. The program receivesfunding from a U.S. EPA grant.

Metal Casting Industry Activities and Initiatives
Sector Notebook Project September 1997140
VIII.C.2. Trade Associations
American Foundrymen’s Society, Inc. Members: 12,800(AFS) Staff: 60505 State Street Contact: Gary Mosher, Des Plaines, IL 60016-8399 Vice President, Environmental Health andPhone: (800) 537-4237 SafetyFax: (847) 824-7848
The American Foundrymen’s Society (AFS) is the primary trade association for thefoundry industry. Founded in 1896, the Society has student and local groupsthroughout the U.S. and internationally. AFS is the technical, trade, and managementassociation of foundrymen, pattern makers, technologists, and educators. The societysponsors foundry training courses through the Cast Metals Institute on all subjectspertaining to the casting industry and sponsors numerous regional and localconferences and meetings. AFS maintains an extensive Technical Information Center,conducts research programs, compiles statistics, and provides marketing information,environmental services, and testing. The monthly trade magazine, Modern Casting,covers current technology practices and other factors affecting the production andmarketing of metal castings.
North American Die Casting Association Members: 3,200(NADCA) Staff: 179701 W. Higgins Rd., Ste. 880 Contact: Dan TwarogRosemont, IL 60018 Phone: 847-292-3600Fax: 847-292-3620
The North American Die Casting Association (NADCA) was founded in 1989 andis made up of producers of die castings and suppliers to industry, product and diedesigners, metallurgists, and students. There are regional and local groups across theU.S. NADCA develops product standards; compiles trade statistics on metalconsumption trends; conducts promotional activities; and provides information onchemistry, mechanics, engineering, and other arts and sciences related to die casting.The association also maintains a library and provides training materials and short,intensive courses in die casting. A trade magazine, Die Casting Engineer, ispublished periodically and contains information on new products and literature,chapter news, and a calendar of events.

Metal Casting Industry Activities and Initiatives
Sector Notebook Project September 1997141
Non-Ferrous Founders’ Society Members: 185455 State St., Suite 100 Staff: 2Des Plaines, IL 60016 Contact: Jim Mallory or MarkPhone: 847-299-0950 Remlinger, Chair ofFax: 847-299-3598 Environment Committee
The Non-Ferrous Founders’ Society (NFFS) is comprised of manufacturers of brass,bronze, aluminum, and other nonferrous castings. Founded in 1943, NFFS conductsresearch programs and compiles statistics related to the nonferrous castings industry.The Society has committees related to: export government relations; insurance; localmanagement group; management conferences; planning; quality; and technicalresearch. NFFS publishes The Crucible bimonthly. This trade magazine containsarticles relevant to the day-to-day management of aluminum, brass, bronze, and othernonferrous foundries. NFFS also publishes a biennial Directory of NonferrousFoundries listing member and nonmember foundries producing primarily aluminum,brass, and bronze castings.
Steel Founders’ Society of America Members: 75 (SFSA) Staff: 6Cast Metals Fed. Bldg. Contact: Raymond Monroe455 State St.Des Plaines, IL 60016Phone: 847-299-9160Fax: 847-299-3105
The Steel Founders Society of America (SFSA) is comprised of manufacturers ofsteel castings. Founded in 1902, the Society conducts research programs andcompiles statistics related to the steel casting industry. SFSA periodically publishesCASTEEL which contains special articles on specifications and technical aspects ofsteel castings. SFSA also publishes a biennial Directory of Steel Foundries listingsteel foundries in the U.S., Canada, and Mexico. Committees include Marketing,Specifications, and Technical Research.
Investment Casting Institute Members: 2758350 N. Central Expressway Staff: 5Suite M 1110 Contact: Henry BidwellDallas, TX 75206Phone: 214-368-8896Fax: 214-368-8852
The Investment Casting Institute is an international trade association comprised ofmanufacturers of precision castings for industrial use made by the investment (or lostwax) process and suppliers to such manufacturers. The Institute provides training

Metal Casting Industry Activities and Initiatives
Sector Notebook Project September 1997142
courses and other specialized education programs and publishes the monthlynewsletter Incast.
Casting Industry Suppliers Association Members: 66 (CISA) Staff: 1455 State St., Suite 104 Contact: Darla BoudjenahDes Plaines, IL 60016Phone: 708-824-7878Fax: 708-824-7908
The Casting Industry Suppliers Association (CISA) was founded in 1986 andrepresents manufacturers of foundry equipment and supplies such as moldingmachinery, dust control equipment and systems, blast cleaning machines, tumblingequipment, and related products. CISA also aims to foster better trade practices andserve as an industry representative before the government and the public. TheAssociation also compiles industry statistics and disseminates reports of progress innew processes and methods in foundry operation.
The Ferroalloys Association (TFA) Members: 21 900 2nd St. NE, Suite 201 Staff: 3Washington, DC 20002 Contact: Edward Kinghorn Jr.Phone: 202-842-0292 Fax: 202-842-4840
The purpose of The Ferroalloys Association’s (TFA) is to promote the generalwelfare of the producers of chromium, manganese, silicon, vanadium ferroalloys andrelated basic alloys/metals in the United States and to engage in all lawful activitiesto that end. Founded in 1971, TFA consistently provides the ferroalloy industry ameans to accomplish tasks through a common bond of business interests.
The ferroalloy industry produces high strength metals created by submerged electricarc smelting, induction melting, alumino/silicothermic reduction processes, andvacuum reduction furnaces, as well as by electrolytic processes. More than 50different alloys and metals in hundreds of compositions and sizes are produced by theferroalloy industry for use in the manufacturing of stainless steel, iron, and aluminum.The industry also produces vital materials used in the production of chemicals, semi-conductors, solar cells, coatings, and catalysts.
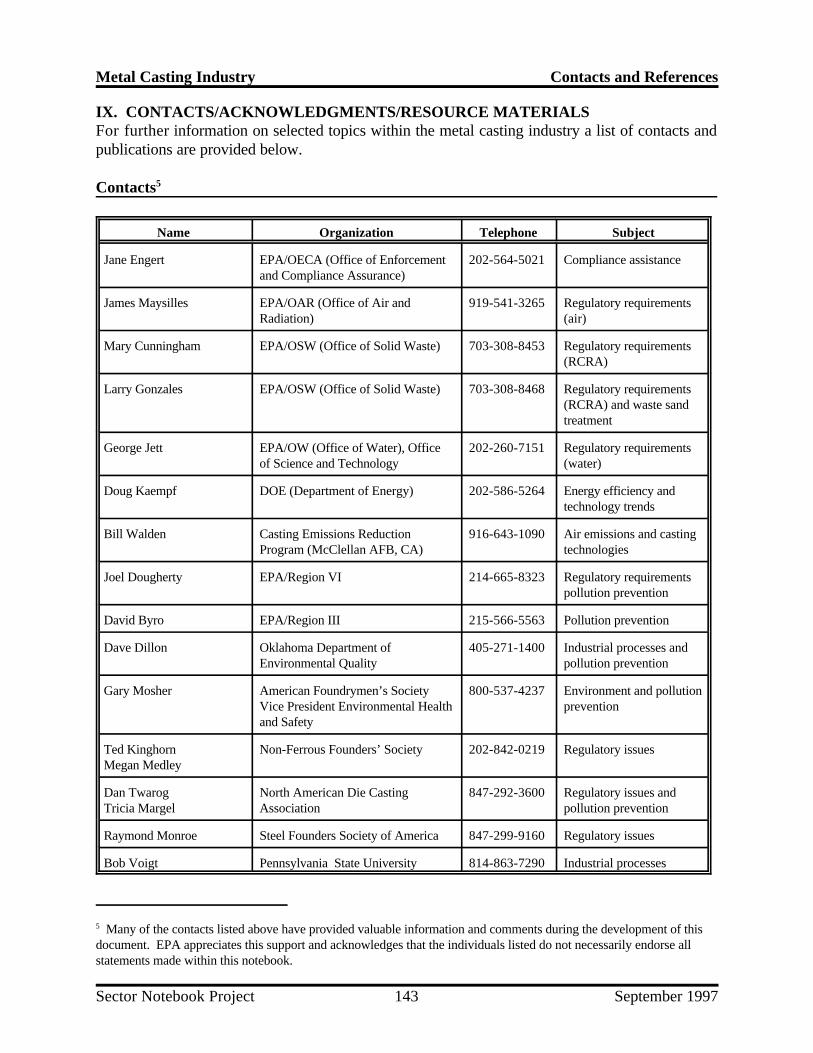
Metal Casting Industry Contacts and References
Many of the contacts listed above have provided valuable information and comments during the development of this5
document. EPA appreciates this support and acknowledges that the individuals listed do not necessarily endorse allstatements made within this notebook.
Sector Notebook Project September 1997143
IX. CONTACTS/ACKNOWLEDGMENTS/RESOURCE MATERIALSFor further information on selected topics within the metal casting industry a list of contacts andpublications are provided below.
Contacts5
Name Organization Telephone Subject
Jane Engert EPA/OECA (Office of Enforcement 202-564-5021 Compliance assistanceand Compliance Assurance)
James Maysilles EPA/OAR (Office of Air and 919-541-3265 Regulatory requirementsRadiation) (air)
Mary Cunningham EPA/OSW (Office of Solid Waste) 703-308-8453 Regulatory requirements(RCRA)
Larry Gonzales EPA/OSW (Office of Solid Waste) 703-308-8468 Regulatory requirements(RCRA) and waste sandtreatment
George Jett EPA/OW (Office of Water), Office 202-260-7151 Regulatory requirementsof Science and Technology (water)
Doug Kaempf DOE (Department of Energy) 202-586-5264 Energy efficiency andtechnology trends
Bill Walden Casting Emissions Reduction 916-643-1090 Air emissions and castingProgram (McClellan AFB, CA) technologies
Joel Dougherty EPA/Region VI 214-665-8323 Regulatory requirementspollution prevention
David Byro EPA/Region III 215-566-5563 Pollution prevention
Dave Dillon Oklahoma Department of 405-271-1400 Industrial processes andEnvironmental Quality pollution prevention
Gary Mosher American Foundrymen’s Society 800-537-4237 Environment and pollutionVice President Environmental Health preventionand Safety
Ted Kinghorn Non-Ferrous Founders’ Society 202-842-0219 Regulatory issuesMegan Medley
Dan Twarog North American Die Casting 847-292-3600 Regulatory issues andTricia Margel Association pollution prevention
Raymond Monroe Steel Founders Society of America 847-299-9160 Regulatory issues
Bob Voigt Pennsylvania State University 814-863-7290 Industrial processes
Metal Casting Industry Contacts and References
Sector Notebook Project September 1997144
Section II: Introduction to the Metal Casting Industry
LaRue, James P., Ed.D., Basic Metal Casting, American Foundrymen’s Society, Des Plaines, IL,1989.
U.S. Industrial Outlook 1994, U.S. Department of Commerce, International Trade Administration,1995.
1992 Census of Manufacturers Industry Series: Ferrous and Nonferrous Foundries, Department ofCommerce, Bureau of the Census, 1996.
Trends Effecting [sic] R&D in the Metalcasting Industry, U.S. Department of Energy, Office ofIndustrial Technologies, Washington, D.C., March 1996.
Kirgin, Kenneth H., 1990s Provide Stability for Ferrous Foundries, Part 1, Modern Casting,American Foundrymen’s Society, Des Plaines, IL, vol. 86 no. 8, August 1995. pp35-37.
Beyond 2000: A Vision for the American Metalcasting Industry, Cast Metals Coalition, September,1995.
Walden, William C., Casting Emissions Reduction Program (CERP) Primer, U.S. Department ofDefense, September, 1995.
Rost, John E., Rebound in Casting Markets Bodes Well for U.S. Foundries, Modern Casting,American Foundrymen’s Society, Des Plaines, IL, vol. 82 no. 1, January 1992. pp29-31.
Loper, Carl R. Jr., Foundry Practice and Equipment, Mark’s Standard Handbook for MechanicalEngineers, 8th ed., McGraw Hill, 1985. pp. 13-2 - 13-9.
Kunsman, C.D., and Carlson, C.C., NonFerrous Metals, Mark’s Standard Handbook for MechanicalEngineers, 8th ed., McGraw Hill, 1985. pp. 6-59 - 6-89.
Kirgin, Kenneth H., Slowing Economy Lowers Casting Demand, Modern Casting, AmericanFoundrymen’s Society, Des Plaines, IL, vol. 85 no. 6, June 1994. p70.
Kirgin, Kenneth H., Forecast Remains Bullish for ‘95, Modern Casting, American Foundrymen’sSociety, Des Plaines, IL, vol. 85 no. 3, March 1995. p51.
Kirgin, Kenneth H., Continued Slowdown in ‘96 Could Lower Casting Shipments 7%, ModernCasting, American Foundrymen’s Society, Des Plaines, IL, vol. 85 no. 9, September 1995. p54.
Metal Casting Industry Contacts and References
Sector Notebook Project September 1997145
Section III: Industrial Process Description
LaRue, James P., Ed.D., Basic Metal Casting, American Foundrymen’s Society, Des Plaines, IL,1981.
Metal Casting and Molding Processes, ed. Kotzin, Ezra L., American Foundrymen’s Society, DesPlaines, IL, 1981.
Kotzin, Ezra L., Steel Foundries: Air Pollution Engineering Manual, ed. Buonicore, Anthony J. andDavis, Wayne T., Air and Waste Management Association, Van Nostrand Reinhold, New York,1992. pp. 733-738.
Scott, Bruce, Sulfur: Air Pollution Engineering Manual, ed. Buonicore, Anthony J. and Davis,Wayne T., Air and Waste Management Association, Van Nostrand Reinhold, New York, 1992. pp.476-477.
Licht, Charles A., Secondary Brass and Bronze Melting Processes: Air Pollution EngineeringManual, ed. Buonicore, Anthony J. and Davis, Wayne T., Air and Waste Management Association,Van Nostrand Reinhold, New York, 1992. pp. 733-738.
Leidel, Dieter S., Pollution Prevention and Foundries, from Industrial Pollution PreventionHandbook, ed. Freeman, Harry M., McGraw-Hill, Inc., New York, 1995. pp. 667-684.
Profile of the Fabricated Metal Products Industry, Sector Notebook Project, U.S. EPA Office ofCompliance, Washington D.C., September 1995. (EPA-310-R-95-007)
Pretreatment of Industrial Wastes, Manual of Practice No. FD-3, Water Environment Federation,Alexandria, Virginia, 1994.
American Foundrymen’s Society Air Quality Committee, Iron Foundries: Air Pollution EngineeringManual, ed. Buonicore, Anthony J. and Davis, Wayne T., Air and Waste Management Association,Van Nostrand Reinhold, New York, 1992. pp. 719-723.
Summary of Factors Affecting Compliance by Ferrous Foundries, Volume I - Text, Final Report,U.S. EPA, Office of General Enforcement, Washington D.C., January 1981. (EPA-340/1-80-020)
Allsop, D. F., and Kennedy, D., Pressure Diecasting, Pergamon Press, Oxford, 1983.
Kaye, Alan, and Street, Arthur, Die Casting Metallurgy, Butterworth Scientific, London, 1982.
Street, Arthur, The Diecasting Book, Portcullis Press Ltd., Surrey, U.K., 1977.
Form R Reporting of Binder Chemicals Used in Foundries, American Foundrymen’s Society, DesPlaines, IL, and Casting Industry Suppliers Association, Worthington, OH, 1992.
Metal Casting Industry Contacts and References
Sector Notebook Project September 1997146
Competitive Assessment of the U.S. Foundry Industry, U.S. International Trade Commission,Washington, D.C., 1984. (USITC Publication 1582)
Twarog, Daniel L., and University of Alabama, Waste Management Study of Foundries Major WasteStreams: Phase I, Hazardous Waste Research and Information Center, Champaign, IL, January 1993.(HWRIC TR-011)
McKinley, Marvin D., et al., Waste Management Study of Foundries Major Waste Streams: PhaseII, Hazardous Waste Research and Information Center, Champaign, IL, April 1994. (HWRIC TR-016)
AP-42 Sections 7.13: Steel Foundries and 7.10: Gray Iron Foundries, U.S. EPA Office of Air andRadiation, October 1986.
Section IV: Chemical Release and Transfer Profile
1994 Toxics Release Inventory Public Data Release, U.S. EPA Office of Pollution Prevention andToxics, June 1996. (EPA 745-R-96-002)
Section V: Pollution Prevention Opportunities
Guides to Pollution Prevention, The Metal Casting and Heat Treating Industry, U.S. EPA, Officeof Research and Development, Cincinnati, OH, September 1992. (EPA/625/R-92/009)
Foundry Sand Beneficial Reuse Manual, Special Report, ed. Thomas, Susan P., AmericanFoundrymen’s Society, Des Plaines, IL, 1996.
Philbin, Matthew L., Sand Reclamation Equipment Users Answer the Questions, Modern Casting,American Foundrymen’s Society, Des Plaines, IL, vol. 86 no. 8, August 1996. pp22-26.
Leidel, Dieter S., Pollution Prevention and Foundries, from Industrial Pollution PreventionHandbook, ed. Freeman, Harry M., McGraw-Hill, Inc., New York, 1995. pp. 667-684.
Pollution Prevention Practices for the Die Casting Industry, North American Die CastingAssociation, Rosemont, IL, 1996.
Personal Correspondence with Ms. Suzanne Simoni, Pennsylvania Department of EnvironmentalProtection, Office of Pollution Prevention and Compliance Assistance, Conshohocken, PA,November 1996.
U.S. EPA Enviro$en$e website, http://www.portfolio/epa/environet/ncpd/auscase_ studies/mason.html, 1996.

Metal Casting Industry Contacts and References
Sector Notebook Project September 1997147
Twarog, Daniel L., and University of Alabama, Waste Management Study of Foundries Major WasteStreams: Phase I, Hazardous Waste Research and Information Center, Champaign, IL, January 1993.(HWRIC TR-011)
McKinley, Marvin D., et al., Waste Management Study of Foundries Major Waste Streams: PhaseII, Hazardous Waste Research and Information Center, Champaign, IL, April 1994. (HWRIC TR-016)
Archer, Hugh V., et al., Foundry Calculates the Value of Pollution Prevention, Water Environmentand Technology, vol. 6, no. 6, June, 1994.
Estes, John M., Energy Cutting Can Give Foundries Real Savings, Modern Casting, AmericanFoundrymen’s Society, Des Plaines, IL, vol. 84, no. 11, November 1994.
Binczewski, George J., Aluminum Casting and Energy Conservation, Light Metal Age, vol. 51, no.11-12, December 1993.
Profile of the Iron and Steel Industry, U.S. EPA Office of Compliance, Washington D.C., 1995.
Section VI: Summary of Applicable Federal Statutes and Regulations
Transactions of the American Foundrymen’s Society, Proceedings of the Ninety-Ninth AnnualMeeting, April 23-26, 1995, American Foundrymen’s Society, Des Plaines, IL, vol.103.
Lessiter, Michael J., Foundries Prepare for Clean Air Act’s Title V Showdown, Modern Casting,American Foundrymen’s Society, Des Plaines, IL, November 1994. pp. 58-59.
Title V Air Operating Permits: What They Mean for Foundries, Modern Casting, AmericanFoundrymen’s Society, Des Plaines, IL, vol. 85, no. 1, February 1995. pp. 52-53.
Kwan, Quon Y., and Kaempf, Douglas E., Environmental Compliance in Metalcasting, Part 1,Foundry Management and Technology, pg. 42, October 1995.
Kwan, Quon Y., and CEMF, Douglas E., Environmental Compliance in Metalcasting, Part 2,Foundry Management and Technology, pg. 39, November 1995.
Breen, Barry, and Campbell-Mohn, Celia, Sustainable Environmental Law, Chapter 16: Metals,Environmental Law Institute, West Publishing Co., St. Paul, MN, 1993.

Metal Casting Industry Contacts and References
Sector Notebook Project September 1997148
Section VIII: Compliance Activities and Initiatives
American Metalcasting Consortium, http://www.scra.org/amc/, 1996.
U.S. EPA Enviro$en$e website, http://www.portfolio/epa/environet/ncpd/auscase_studies/mason.html, 1996.
Beyond 2000: A Vision for the American Metalcasting Industry, Cast Metals Coalition, September,1995.
Personal Correspondence with Mr. David Byro, U.S. EPA, Region III, Philadelphia, PA, June 1996.
Personal Correspondence with Joel Dougherty, Ph.D., U.S. EPA, Region 6, Hazardous WasteEnforcement Branch, Dallas, TX, October 1996.
Personal Correspondence with Mr. Bill Walden, U.S. Department of Defense, McClellan AFB, CA,June 1996.
Personal Correspondence with Ms. Kathy Martin, Oklahoma Department of Environmental Quality,Oklahoma City, OK, September 1996.
Personal Correspondence with Ms. Suzanne Simoni, Pennsylvania Department of EnvironmentalProtection, Office of Pollution Prevention and Compliance Assistance, Conshohocken, PA,November 1996.
Personal Correspondence with Mr. Douglas Kaempf, U.S. Department of Energy, Industries of theFuture, Washington, D.C., July 1996.
A - 1
APPENDIX AINSTRUCTIONS FOR DOWNLOADING THIS NOTEBOOK
Electronic Access to this Notebook via the U.S. EPA Site on the World Wide Web (WWW)
This Notebook is available through the EPA Public Access Server and the Enviro$enseCommunications Network on the World Wide Web at http://www.epa.gov/oeca/sector/index.html.Enviro$ense is a free, public, environmental exchange system operated by EPA's Office ofEnforcement and Compliance Assurance and Office of Research and Development. The Networkallows regulators, the regulated community, technical experts, and the general public to shareinformation regarding: pollution prevention and innovative technologies; environmental enforcementand compliance assistance; laws, executive orders, regulations, and policies; points of contact forservices and equipment; and other related topics. The Network welcomes receipt of environmentalmessages, information, and data from any public or private person or organization.
ACCESS THROUGH THE U.S.EPA WORLD WIDE WEB SITE
To access this Notebook through the Web, set your web browser to the aforementioned webaddress, and select the desired Notebook; or point and click your way there as follows:
1) set your browser to our primary web address: http://www.epa.gov/oeca;
2) select “Industry and Gov’t. Sectors”;
3) select “EPA Sector Notebooks”; and
4) select the desired sector and file format.
HELPLINE NUMBER FOR OECA’S WORLD WIDE WEB SITE : 703-908-2007
EPA OECA WORLD WIDE WEB MANAGER: Louis Paley 202-564-2613
Recommended