PRIVATE PARTICIPATION IN INDIA’S WATER SECTOR:
IMPACT ON WATER ACCESS AND SERVICE QUALITY INDICATORS
A Thesis submitted
to the Faculty of the
Graduate School of Arts and Sciences
of Georgetown University
in partial fulfillment of the requirements for the
degree of Master of Public Policy
in Public Policy
By
Ananthi Shankar Bharadwaj, B.A. LL. B. (Hons.)
Washington, D.C.
April 13, 2017

ii
Copyright 2017 by Ananthi Shankar Bharadwaj
All Rights Reserved
iii
PRIVATE PARTICIPATION IN INDIA’S WATER SECTOR:
IMPACT ON WATER ACCESS AND SERVICE QUALITY INDICATORS
Ananthi Shankar Bharadwaj, B.A. LL.B. (Hons.)
Thesis Advisor: Andreas Kern, Ph.D.
ABSTRACT
Water service delivery is an integral part of India’s development agenda specifically in urban areas.
Private sector participation through public-private partnership (PPP) arrangements is a key
component of this agenda. However, it is essential that private sector participation is designed to
deliver water service that is affordable, accessible, adequate and meets minimum drinking water
quality standards. Existing literature suggests that the impact of water PPPs on water access and
service varies widely indicating that project-specific features also determine their overall impact.
This paper focuses on the Indian experience with private participation in water supply.
Specifically, I attempt to isolate the effect of water PPPs on indicators of water access and service
quality in Indian states and districts using difference-in-difference estimation methods. The results
of my empirical analysis are inconsistent and ambiguous, reinforcing the importance of project
specific features. For instance, household access to main drinking water source is positively
correlated with water PPPs at the state level, however, this association is reversed at the district
level. In cases where the effect is consistent across the state and district level analysis, the results
do not support my hypothesis that private participation positively impacts water access and service
quality. For instance, household access to piped drinking water is negatively correlated with water
PPPs at the state and the district level. Notably, water PPPs are negatively correlated with adequacy
of drinking water supply during all times of the year and the average daily duration of water supply.
As such no causal claims are possible.

iv
ACKNOWLEDGEMENT
I thank Dr. Andreas Kern for his constant support, mentorship and advice on the research and
writing of this paper. I am very grateful to Sridar, my family, and friends for their unconditional
and unwavering support and encouragement during my time at Georgetown University. This paper
would not have been possible without all your help.
Many thanks,
Ananthi Shankar Bharadwaj

v
TABLE OF CONTENTS
1. Introduction ........................................................................................................................................... 1
2. Background ........................................................................................................................................... 3
2.1 Rationale for Public Provision of Water ............................................................................................. 3
2.2 Towards Private Provision of Public Services .................................................................................... 5
3. Literature Review .................................................................................................................................. 6
3.1 Effect of Private Participation on Distribution of Gains and Losses .................................................. 7
3.2 Impact on Sector-wide Productivity, Efficiency, and Profitability ..................................................... 7
3.3 Impact of Private Participation on Water Access and Service Quality ............................................... 8
3.4 Impact of Private Participation in Water on Health Outcomes ......................................................... 10
4. Theory of Change ............................................................................................................................... 11
5. Empirical Strategy and Framework .................................................................................................... 12
5.1 Primary Data Sources ....................................................................................................................... 13
India Human Development Survey (IHDS) ........................................................................................ 13
Government of India Data on PPPs .................................................................................................... 14
PPI Database on PPPs ......................................................................................................................... 14
5.2 Unit of Analysis ................................................................................................................................ 14
5.3 Dependent Variables ......................................................................................................................... 15
Water Access ...................................................................................................................................... 17
Water Service Quality Indicators ........................................................................................................ 18
5.4 Control Variables .............................................................................................................................. 19
6. Descriptive Statistics ........................................................................................................................... 20
6.1 Piped Water Access Within Housing Compound ............................................................................. 21
6.2 Main Sources of Drinking Water ...................................................................................................... 21
6.3 Duration and Adequacy of Water Supply ......................................................................................... 21
6.4 Household Characteristics ................................................................................................................ 21
6.5 State-level Controls ........................................................................................................................... 22
6.6 PPP Projects in Water and Sanitation ............................................................................................... 22
7. Empirical Results ................................................................................................................................ 23
7.1 Impact of Water PPPs on Household Access to Water ..................................................................... 24
Access to Drinking Water Source Within the Housing Compound .................................................... 24
Access to Piped Water Within the Housing Compound ..................................................................... 25
vi
7.2 Impact of Water PPPs on Access to an Improved Drinking Water Source ...................................... 26
7.3 Impact of PPPs in Water Supply on Water Service Indicators ......................................................... 27
Adequacy Drinking Water Availability all Year Round ..................................................................... 27
Duration of Average Daily Water Supply ........................................................................................... 28
8. Limitations .......................................................................................................................................... 28
8.1 Aggregation of Data at the State Level ............................................................................................. 28
8.2 Heterogeneity of Treatment and Control Groups .............................................................................. 29
8.3 Endogeneity of Treatment Variable .................................................................................................. 30
8.4 Strategies to Boost Internal Validity ................................................................................................. 31
9. Robustness Analysis ........................................................................................................................... 32
10. Concluding Remarks ....................................................................................................................... 33
Appendix A: Descriptive Statistics ............................................................................................................. 37
Appendix B: Empirical Results (State and District Level) ......................................................................... 42
Appendix C: Limitations ............................................................................................................................. 49
Appendix D: Robustness Analysis .............................................................................................................. 51
References ................................................................................................................................................... 57
1
1. Introduction
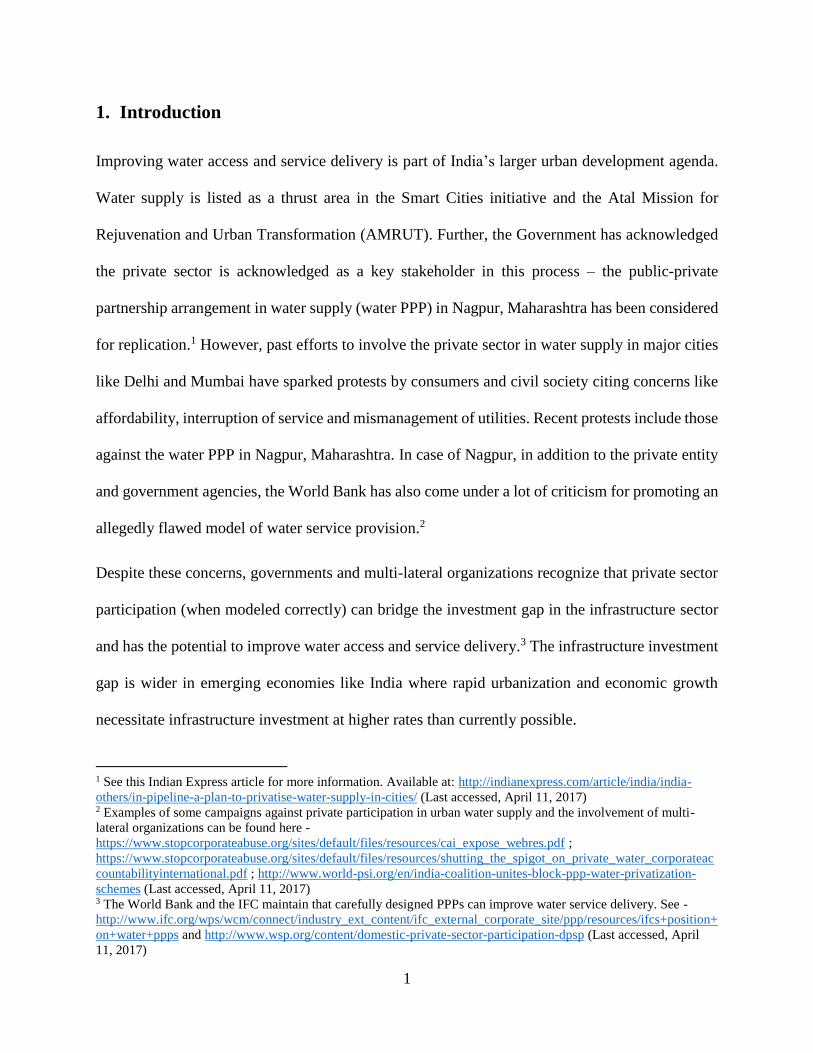
Improving water access and service delivery is part of India’s larger urban development agenda.
Water supply is listed as a thrust area in the Smart Cities initiative and the Atal Mission for
Rejuvenation and Urban Transformation (AMRUT). Further, the Government has acknowledged
the private sector is acknowledged as a key stakeholder in this process – the public-private
partnership arrangement in water supply (water PPP) in Nagpur, Maharashtra has been considered
for replication.1 However, past efforts to involve the private sector in water supply in major cities
like Delhi and Mumbai have sparked protests by consumers and civil society citing concerns like
affordability, interruption of service and mismanagement of utilities. Recent protests include those
against the water PPP in Nagpur, Maharashtra. In case of Nagpur, in addition to the private entity
and government agencies, the World Bank has also come under a lot of criticism for promoting an
allegedly flawed model of water service provision.2
Despite these concerns, governments and multi-lateral organizations recognize that private sector
participation (when modeled correctly) can bridge the investment gap in the infrastructure sector
and has the potential to improve water access and service delivery.3 The infrastructure investment
gap is wider in emerging economies like India where rapid urbanization and economic growth
necessitate infrastructure investment at higher rates than currently possible.
1 See this Indian Express article for more information. Available at: http://indianexpress.com/article/india/india-
others/in-pipeline-a-plan-to-privatise-water-supply-in-cities/ (Last accessed, April 11, 2017) 2 Examples of some campaigns against private participation in urban water supply and the involvement of multi-
lateral organizations can be found here -
https://www.stopcorporateabuse.org/sites/default/files/resources/cai_expose_webres.pdf ;
https://www.stopcorporateabuse.org/sites/default/files/resources/shutting_the_spigot_on_private_water_corporateac
countabilityinternational.pdf ; http://www.world-psi.org/en/india-coalition-unites-block-ppp-water-privatization-
schemes (Last accessed, April 11, 2017) 3 The World Bank and the IFC maintain that carefully designed PPPs can improve water service delivery. See -
http://www.ifc.org/wps/wcm/connect/industry_ext_content/ifc_external_corporate_site/ppp/resources/ifcs+position+
on+water+ppps and http://www.wsp.org/content/domestic-private-sector-participation-dpsp (Last accessed, April
11, 2017)

2
Much of the controversy is due to lack of information and evidence on the actual impact of water
PPPs on utility performance, water access and service delivery. There is need for rigorous
evaluation of water PPPs in India. These results can inform future policy decisions by government
agencies and promote evidence-based policy making. Moreover, since past efforts at involving the
private sector have been marred by protests, empirical evidence will also inform discussions with
stakeholders.
The main purpose of this paper is to identify the impact of private participation in India’s water
service delivery (water PPPs) on water access and service quality indicators using a difference-in-
difference estimation (DD). I begin with a background on the water service delivery sector’s
transition from state-controlled provision to a combination of public and private provision (Section
2). I apply the public goods theory to offer a rationale for pure public provision of water services.
I then describe the shift towards private provision and public-private partnerships in water service
delivery (“water PPPs”).
Then, I review evidence from empirical studies on water supply projects around the world with
varying levels of private participation (Section 3). I structure the review along four themes – impact
on water utilities’ performance metrics like efficiency, productivity and profitability, impact on
stakeholders in terms of distribution of gains and losses, impact on water access and service
quality, and impact on health outcomes.
Based on existing literature on the subject, I hypothesize that water PPPs are likely to have a
positive impact on water access and service quality indicators. I describe my theory of change in
Section 4.
The rest of the paper focuses on my empirical framework and analysis. Using a difference-in-
difference estimation, I conceptualize an empirical framework using variables on water access and

3
service quality. Section 5 describes my empirical strategy and framework in detail including
sources of data. This is followed by a discussion on descriptive statistics in Section 6. Section 7
describes my empirical findings on the impact of water PPPs on water access and service quality.
For each regression model, I discuss the results at the state and district level. Then, I discuss the
limitations on my study in Section 8 and attempt to address some of them in by carrying out a
robustness analysis (Section 9).
I conclude my paper with a discussion on my empirical findings (Section 10). I find that the
empirical results are inconsistent and not robust across the state and the district level. This is
mainly due to the lack of project or utility level data and the possible endogeneity of the treatment
variable (water PPPs). I identify future areas of research and emphasize the importance of project-
level data collection and evaluation to inform future efforts at improving water service delivery in
India.
2. Background
Historically, water has been provided by the public sector in many countries. Gradual decline in
public investment and a general disillusionment with the state’s role in public services led to
private participation in water supply. In this section, I summarize the transition of water service
delivery around the world from state-controlled provision to a combination of public and private
provision.
2.1 Rationale for Public Provision of Water
Historically, water has primarily been provided by the public sector. Roth observes that in Assyria,
Babylon, Persia and Roman cities, the state built, operated and maintained elaborate water works

4
to supply water to its people. He attributes this to the geopolitical and strategic importance of water
in times of war (Roth, 1987).
The public goods theory offers a rationale for public provision of certain services. Generally,
economic theory suggests that a competitive market results in efficient production and distribution
of goods and services. However, in case of public goods, economic theory acknowledges that pure
private sector provision is likely to lead to inefficient market outcomes (Gruber, 2004). Thus, to
remedy market failures and attain an optimal production and distribution of public goods, a
potential role for governments arises (Gruber, 2004).
Existing literature concludes that water is a commodity prone to market failures for several
reasons. First, developing water supply infrastructure requires significant fixed costs. Further, a
new entrant would need to invest in duplicating fixed assets already developed by its competitors.
Therefore, economists argued that no new entrant can compete with the first firm in the market.
This is perhaps why the water industry is called a “natural monopoly” (Cowan 1993 cited in
Bakker, 2003). Second, water supply results in positive externalities like health and hygiene. It
also gives rise to negative externalities such as pollution. These are not factored into the price of
water (Winpenny, 1994 in Bakker, 2003). Finally, water was viewed as a strategic and essential
input for an economy’s development. Further, it was crucial for industrialization in general and
specifically for expanding irrigation; critical for modernizing agriculture (Bakker, 2003).
By the mid-twentieth century, in most of the OECD countries, State agencies owned and controlled
most of the water infrastructure. For instance, in England and Wales the water supply and waste
disposal management functions were performed by municipal agencies (and later, under public
ownership). In France and US, the water infrastructure was state-owned but in some cases operated
5
by local or private providers. The then government in Spain controlled surface water resources in
all sectors (Bakker, 2003).
From an equity perspective, state ownership of water resources afforded states the opportunity to
implement universal access and coverage policies. From a public health perspective, access to
clean drinking water was essential. A state-sponsored water sector expanded access and coverage
to majority of the population free of charge or at heavily subsidized prices. Provision of drinking
water gradually emerged as the duty of the state and peoples’ right in a welfare society (Bakker,
2003).
2.2 Towards Private Provision of Public Services
Bakker (2003) argues that the 1970s and 80s were characterized by the deterioration of the welfare
state and general disillusionment surrounding the role of the state in society. States’ strategy for
water infrastructure development through building dams also came under criticism due to concerns
of environmental degradation and displacement. Public investment in water sector gradually
declined followed by a decline in the quality and quantity of service. States’ failure as the sole
provider of water thus paved the way for private participation.
In 1987, Roth argued that the private sector can play an important role in economic development.
In his work, he presents various examples of private sector involvement in the provision of public
services around the world to dispel the then prevalent notion that the public sector is best placed
to provide public services in developing countries (Roth, 1987).
The transition from purely state-controlled water provision to provision through public-private
partnerships (PPPs) was marked by a period of pure privatization in Europe and the Americas. The
idea of a public and private partnership in water service delivery emerged from France and Spain

6
where the water utility is operated and maintained by a private entity while the assets are owned
by the state (Marin, 2009).
In the 1990s many PPP contracts were awarded around the developing world. Between 1990 and
2000, the number of developing countries with PPPs increased from 4 to 38 (Marin, 2009). In the
period between 2001-07 private investment slowed down due to lack of adequate access to finance.
By 2007, there were approximately 220 active PPPs in 41 developing countries. The resurgence
of PPPs was marked by a change in the financing structures – a combination of public and private
financing became common.
In India, although private participation in the water sector was conceptualized in the 1990s, only
four public-private partnership (PPP) contracts were awarded prior to 2004. After 2005, all the
PPP projects conceptualized projects were awarded. Further, they covered a wide cross-section of
Indian states and cities (World Bank, Water and Sanitation Program Field Note, 2011). The nature
and extent of private participation and investment varies – while some of them were undertaken
on a Build-Operate-Transfer (BOT) basis, others were operations and maintenance (O&M)
contracts. The term PPP in this paper refers to either of or a combination of such arrangements.
3. Literature Review
In this section, I review evidence from empirical studies on water supply projects around the world
with varying levels of private participation. I structure the review along four themes – impact on
water utilities’ performance metrics like efficiency, productivity and profitability, impact on
stakeholders in terms of distribution of gains and losses, impact on water access and service
quality, and impact on health outcomes.
7
3.1 Effect of Private Participation on Distribution of Gains and Losses
One line of academic inquiry is at the utility level, analyzing the effect of privatization on the
distribution of costs and benefits or gains and losses among stakeholders in the process. Estache
and Grifell-Tatje (2011) studied the distribution of the gains and losses from this privatization
exercise in Mali, across various stakeholders in the process. In the year 2001, Mali privatized its
main water operator agency to the French company SAUR. Although the transfer was for a period
of 20 years, it was re-municipalized after 5 years. The authors use data from the annual reports of
the water utility company study the distribution of the gains and losses from this privatization
exercise across various stakeholders in the process. The study found that workers and domestic
intermediaries in the water sector received the largest chunk of the gains followed by consumers
who benefitted by the fall in real price of water during the period. The water company did not
benefit as much despite significant gains in productivity because it could not recover all its costs
from consumers. Most importantly, the paper points out that the privatization did yield significant
gains, however, its distribution among various actors did little to retain the SAUR’s interest in
honoring the contract. Earlier, Abdala (1996) used a cost-benefit analysis framework to measure
the distribution of gains and losses across various stakeholders, following a privatization exercise
of water and sewerage services.
3.2 Impact on Sector-wide Productivity, Efficiency, and Profitability
Another body of evidence deals with the effect of privatization on sector-wide efficiency,
productivity and profits. Estache et. al (2002) use data on 50 water companies from 29 countries
in Asia Pacific region to find that efficiency is not significantly different for private and public
utilities. Kirkpatrick et al. (2006) also find similar results on examining data from 110 water
utilities in Africa.

8
Wang et. al (2010) examine the impact of private sector participation on urban water supply in 35
cities in China between 1998 and 2008. This study attempts to delineate the effect of foreign
companies versus domestic companies on urban water supply. This study measures the impact of
private sector participation in terms of production capacity, water coverage rate and the investment
in fixed assets in the urban water supply sector. The authors use industry-level data available at
the city/municipality level between 1998 and 2008 for their analysis and use a fixed effects model
with instrumental variables. The study finds that private sector participation results in an increase
in production capacity (from 11.8 to 14.9 per cent) as well as the coverage rate (from 4 to 5.2 per
cent).
3.3 Impact of Private Participation on Water Access and Service Quality
The third line of academic inquiry is on the impact of privatization of water services on consumers.
Clarke et. al (2004) studied the effect of private sector participation on water and sewerage
coverage (in terms of connection rates). For their analysis, the authors used information on
connections to water and sewerage services from household surveys in Argentina, Bolivia and
Brazil. Since this data is collected over many years at the municipal/city level, it is amenable to a
before and after analysis. It also offers a natural control group in areas where there was no private
sector participation. In their analysis, the authors compare access to water/sewerage connections
at the city level before and after privatization (treatment) relative to cities where no private
investment was made (control). They find that access to water and sewerage improved in both the
treatment and control groups including access for poor sections of the population. However, the
results did not indicate that the increase in access was attributable to private sector participation.
Boccanfuso et al. (2005) attempted to identify the winners and losers following the privatization
of water services in Senegal between 1995-2000. On a micro level, the study looks at distributional

9
impacts of privatization of water services; the population is divided into quintiles based on income
distribution and then the access to water of a given quintile is isolated. The study finds that
although the network of water pipes increased because of privatization, this benefitted only the
population in the fourth quintile of the income distribution. The lowest quintiles did not benefit
from the increased network of water pipes. This period also saw an increase in the price of water
adversely affecting affordability of water especially for the poor.
Carillo et al. (2007) compare indicators of water coverage, quality, and prices in both cities, before
and after privatization of water services in two cities in Ecuador, Quito and Guayaquil. The goal
of the study is to examine these indicators for changes in water provision over the years. By
controlling for income, the authors also specifically examine these changes for the poor. The
primary source of data are national income and expenditure surveys from years 1995 (before
privatization) and 2004 (after privatization). The main finding of this paper is that households in
the lowest income quintile in Guayaquil experienced reduced access to water post privatization,
however in Quito, such households benefitted from an increase in access to water post
privatization. This is one of the few studies that was able to analyze data on water prices over time
– during the ten-year period (1996-2005) average water prices increased post privatization in
Guayaquil and increased at a faster rate compared to water prices in Quito.
De Oliviera (2008) studied Brazil’s experience with private sector participation in water services
and evaluated its impact on access and affordability metrics especially for the poor. The author
finds no evidence of an adverse impact on affordability or accessibility to water as result of
privatization. In turn, she finds that access improved after privatization specifically for
municipalities with poorer sections of the population. She concludes that low-income households
benefitted the most from such privatization efforts chiefly because private operators had to assume
10
certain investment obligations under the concessions granted to them by the Government. The
effects of privatization on affordability however were unclear.
Lee (2011) uses household expenditure data to evaluate the impact of privatization on access and
affordability of water services. The study finds that the impact of privatization on access and
affordability is ambiguous. While privatization did not have an adverse impact on affordability,
there was no evidence of improved access to water post privatization. The author attributes this to
the role of regulatory institutions in tariff setting and the fact that the government held considerable
stake in the privatized water companies.
Borraz et al. (2013) explore the impact of privatization of water services in Uruguay and its
subsequent nationalization on access to water networks and its quality. The findings suggest that
privatization had little impact on network access. Interestingly, however, nationalization led to an
increase in water network access and water quality (when compared to regions that where water
was consistently publicly owned). However, these results cannot be generalized and interpreted to
mean that public sector generally does better in terms of providing access to quality water.
3.4 Impact of Private Participation in Water on Health Outcomes
A final theme of academic inquiry concerns itself with analyzing the impact of privatization of
water on health outcomes. Galiani et al. (2002) examine the impact of Argentina’s privatization
drive in the water sector on child health outcomes specifically, child mortality rates to find that
child mortality fell from 5 to 7 per cent in areas that had undergone privatization of water services.
Further, the study found the effect to be largest in areas with poor populations.

11
4. Theory of Change
In 2009, the World Bank and PPIAF published a study reviewing experiences of developing
countries with water PPPs since the 1990s (Marin, 2009). The study asserts that PPPs are indeed
valuable in increasing access and efficiency of service delivery overall. According to Marin, the
population served by private water operators in developing countries has been steadily increasing
from 94 million in 2000 to 160 million by 2007.
In terms of access, Marin’s study finds that PPPs in water have provided more than 24 million
people in developing countries access to piped water since 1990. In terms of the impact on
consumers, results of empirical studies vary considerably and are therefore hard to generalize.
While Borraz et. al. (2013) and Lee (2011) fail to find any significant improvement in access to
water following privatization exercises. De Oliviera (2008) however found that private sector
participation in Brazil improved access to water especially for municipalities with poorer sections
of the population. Similarly, Carillo et. al (2007) found that households in Quito, Ecuador
benefitted from an increase in water access post-privatization.
In terms of quality of service delivery, Marin argues that the private sector has a track record of
improving service continuity and overall operational efficiency. Empirical evidence on the impact
of private participation on industry efficiency is ambiguous – although Wang et. al (2010) found
an increase in productivity following private sector participation, Estache et. al (2002) and
Kirkpatrick et. al (2006) do not find a significant difference in efficiency between public and
private water utilities in the Asia-Pacific and Africa region respectively.
Given that the empirical results on the impact of private participation are largely ambiguous and
divergent, I am inclined to rely on Marin’s general conclusion that private sector participation in
12
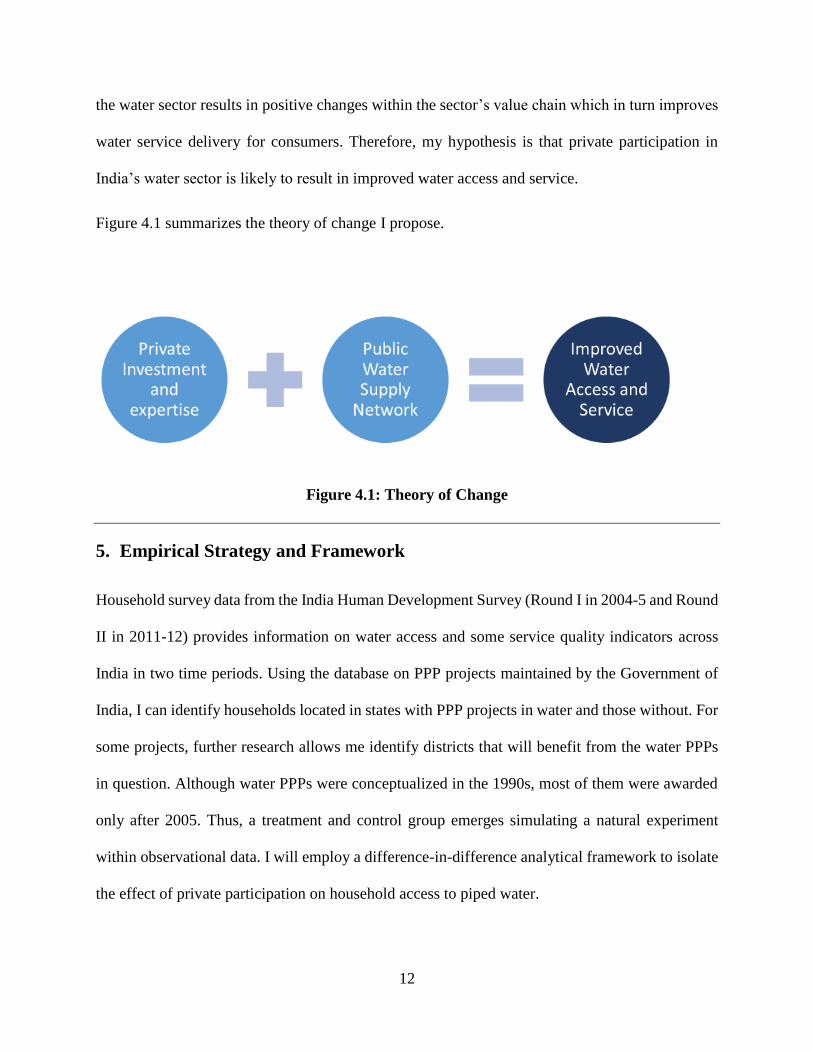
the water sector results in positive changes within the sector’s value chain which in turn improves
water service delivery for consumers. Therefore, my hypothesis is that private participation in
India’s water sector is likely to result in improved water access and service.
Figure 4.1 summarizes the theory of change I propose.
Figure 4.1: Theory of Change
5. Empirical Strategy and Framework
Household survey data from the India Human Development Survey (Round I in 2004-5 and Round
II in 2011-12) provides information on water access and some service quality indicators across
India in two time periods. Using the database on PPP projects maintained by the Government of
India, I can identify households located in states with PPP projects in water and those without. For
some projects, further research allows me identify districts that will benefit from the water PPPs
in question. Although water PPPs were conceptualized in the 1990s, most of them were awarded
only after 2005. Thus, a treatment and control group emerges simulating a natural experiment
within observational data. I will employ a difference-in-difference analytical framework to isolate
the effect of private participation on household access to piped water.

13
Therefore, the following baseline model is proposed:
Yhst = β0 + β1 (Xpost) + β2(Xtreatment) + β3 (Xpost * Xtreatment) + β4 (Xcontrols) + uhst
Where, Yhst represents the dependent variables of interest (See section 5.3 below). Xpost is the
variable indicating post treatment period. It is categorical variable coded as 1 if year is 2012 (time
period post treatment), 0 otherwise. Xtreatment is the treatment variable indicating whether a state s
or district d received PPP investment for a water sector project clustered at the State/District level.
It is a categorical variable coded as 1 if the Indian state or district received private investment for
a PPP project in water sector, 0 otherwise. Xpost * Xtreatment is the main independent variable of
interest; an interaction variable of post-treatment period and treatment. Xcontrols represents the
control variables. These are described in greater detail in section 5.4 below. Finally, Uist represents
the idiosyncratic error term.
5.1 Primary Data Sources
I use household level data on water access from the water and sanitation questionnaire of the India
Human Development Survey (Rounds I and II) and state-level data on PPP projects in the water
and sanitation sector from the website of the Department of Economic Affairs, Ministry of
Finance, Government of India.
India Human Development Survey (IHDS)
The India Human Development Survey is available at two time periods – 2005 and 2012. This
survey was carried out by researchers at the National Council of Applied Economic Research in
India and the University of Maryland. It is a nationally representative survey of 42152 households
in 1503 villages and 971 urban neighborhoods across India. This data set provides information on
the household access to various sources of drinking water and some indicators of service quality.
14
Government of India Data on PPPs
The Department of Economic Affairs, Ministry of Finance, Government of India maintains a
database of all PPP projects awarded by various line ministries on its website. This database
provides information on PPP projects awarded by state, date of award, total cost of project, sector
and sub-sector. Since the database also has information on the supervising authority and the name
of the city/district that will benefit from the project, I was able to identify the district-level data for
my analysis. However, this was not possible for all the projects.
PPI Database on PPPs
The Private Participation in Infrastructure (PPI) database has data on 6,400 infrastructure projects
around the world and is an initiative supported by the World Bank Group. Although the list of PPP
projects in India is not as exhaustive as the Government of India source, this database was useful
to identify the districts that benefit from some of the water PPP projects and to create the district
level treatment variable.
5.2 Unit of Analysis
I carry out my analysis at two levels – state and the district. The PPP data is available at the state
level. Therefore, the state level analysis has complete information for all water PPP projects
between 2005-12.
With some further research, I narrowed down some projects to the district level. However, due to
lack of information, this was not possible for all water PPPs. The district level analysis is included
to demonstrate higher exposure to the treatment. Water supply projects are usually carried out at
the utility level and each utility serves only a group of towns or local government areas. These
areas are likely to have the highest exposure to the treatment. However, since this data is not

15
available, I am using district-level analysis to narrow down the treatment exposure. Doing this
could possibly provide more accurate estimates of the impact than aggregating the effects at the
state level. The district level is the lowest level of aggregation possible, given the data I have.
5.3 Dependent Variables
I examine the effect of water PPPs on water access and some indicators of water service quality.
Table 5.1 below describes each of these variables.
16
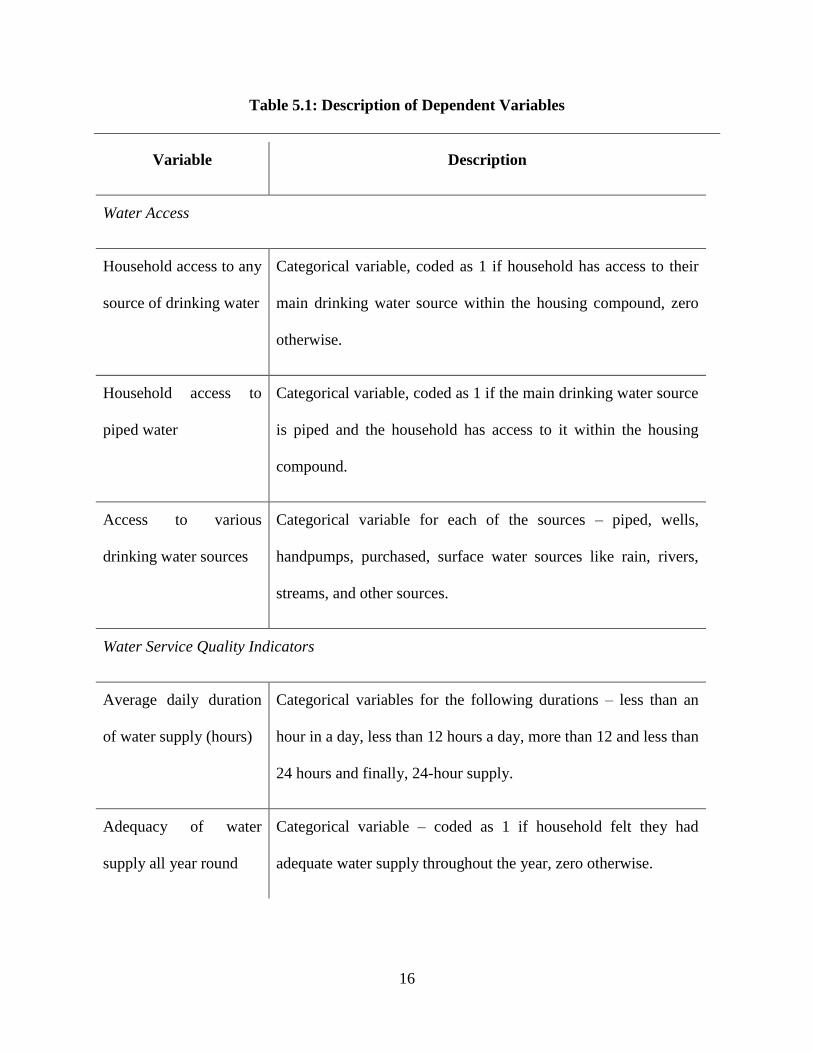
Table 5.1: Description of Dependent Variables
Variable Description
Water Access
Household access to any
source of drinking water
Categorical variable, coded as 1 if household has access to their
main drinking water source within the housing compound, zero
otherwise.
Household access to
piped water
Categorical variable, coded as 1 if the main drinking water source
is piped and the household has access to it within the housing
compound.
Access to various
drinking water sources
Categorical variable for each of the sources – piped, wells,
handpumps, purchased, surface water sources like rain, rivers,
streams, and other sources.
Water Service Quality Indicators
Average daily duration
of water supply (hours)
Categorical variables for the following durations – less than an
hour in a day, less than 12 hours a day, more than 12 and less than
24 hours and finally, 24-hour supply.
Adequacy of water
supply all year round
Categorical variable – coded as 1 if household felt they had
adequate water supply throughout the year, zero otherwise.

17
Water Access
I examine whether water PPPs are associated with access to an improved water source.
This analysis is modelled on the water and sanitation categories for improved and unimproved
water sources developed by the WHO/UNICEF Joint Monitoring Programme for Water Supply
and Sanitation (JMP)4. Figure 5.1 shows the categorization developed by the JMP.
Source: WHO/UNICEF Joint Monitoring Programme, https://www.wssinfo.org/uploads/tx_ecomedias/600/wat_facilities.jpg
Figure 5.1: Unimproved and Improved Source of Drinking Water by WHO/UNICEF JMP
Specifically, I analyze whether water PPPs are (i) associated with an increased probability of
access to a water source within the household and (ii) associated with an increased probability of
access to an improved water source generally.
Panel A in Table 5.2 below, describes my framework for household access analysis. Household
access variables allow me to isolate the effect of water PPPs on access to piped water, an improved
4 See website for more details - https://www.wssinfo.org/definitions-methods/watsan-categories/ (Last accessed on
April 11, 2017)

18
source since it is protected and most likely treated. Any other water source within the household
can also reasonably be presumed to be improved since it is likely to be protected relative to sources
located outside the housing compound. Panel B in Table 5.2 below describes my framework for
my analysis on access to main drinking water sources – piped, wells, handpump, surface water,
purchased and others.
Water Service Quality Indicators
I also examine the impact of water PPPs on water service quality. I use data on average daily
duration of water supply measured in hours and a self-assessment of adequacy of water supply
during the year. Panel C in Table 5.2 below describes my analytical framework for water service
quality indicators. Average daily duration of water supply is divided in to four categories – less
than an hour’s supply in a day, less than 12 hours’ supply in a day, more than 12 and less than 24
hours’ supply in a day, and finally, 24-hour supply in a day. Adequacy is a self-assessed measure
of whether the household received adequate drinking water supply all year round.

19
Table 5.2: Summary of Empirical Framework
Dependent Variables Panel A Panel B Panel C
Household Access to any source √
Household access to piped water √
Main drinking water source – piped, wells, handpump, surface
water, purchased or other
√
Daily average hours of water supply (hours) - <1, <12, 12<x<24,
and 24-hour supply.
√
Adequacy of annual water supply (Self-assessed measure) √
5.4 Control Variables
At the state level, I am controlling for population growth and groundwater-levels. Data on
population growth is based on Census of India, 2001 projected to 2005 and 2011. Groundwater
level data is from the Government of India’s GIS database and is measured in meters below ground
level and has been collapsed at the state level for my analysis. Variation in population and
groundwater levels are both likely to affect access to water and quality of service.
At the household level, I am controlling for household size, its location in an urban or non-urban
area, whether a household is living below poverty line5 and finally, whether a household shares its
5 As determined by the Government of India

20
water connection with others in the compound6. All these controls are available in the IHDS data.
I chose them based on UNESCO’s guide to analyzing household survey data7 and a general
understanding of household conditions that are likely to influence water access and service.
6. Descriptive Statistics
Table 1 in Appendix A presents descriptive statistics. Panel A presents descriptive data on water
access and water service variables like household access to piped water, main source of drinking
water, average daily duration of water supply, and adequacy of water throughout the year. Panel
B describes household characteristics like household size, poverty, households with shared
connections and households located in urban areas. Panel C presents descriptive data on state-level
characteristics like population and groundwater levels.
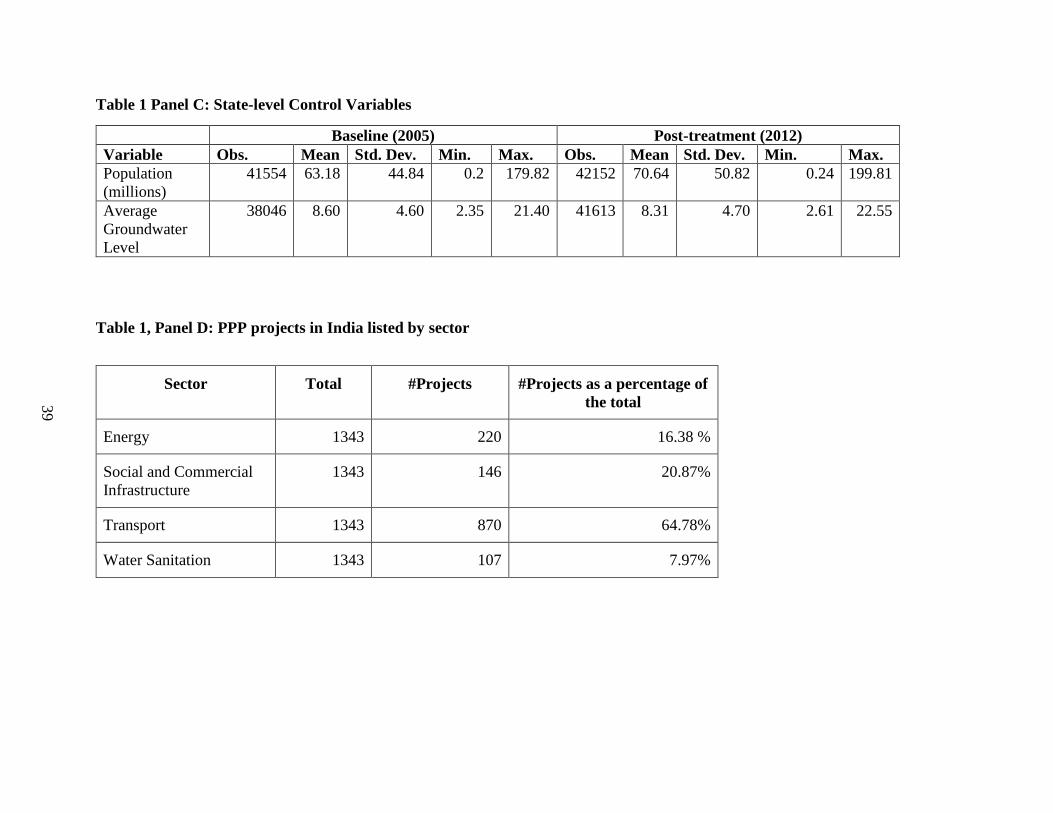
Descriptive data on water PPPs are presented in Table 1, Panels D and E. Panel D shows
descriptive data on PPP projects in India by sector – energy, social and commercial infrastructure,
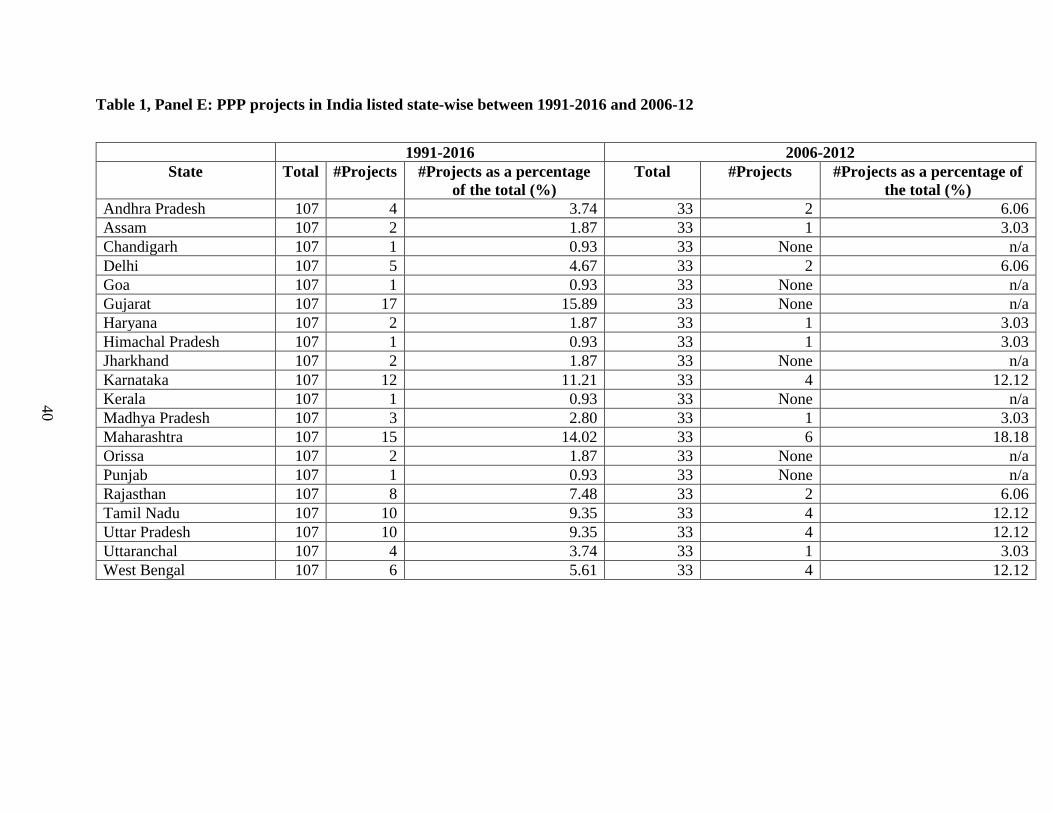
transport, and water and sanitation. Panel E describes data on PPP projects in India by state
between 1991-2016 and between 2006-12 (the post-treatment period for the purpose of this paper).
Panel F shows water PPPs by district between 2006-12.
6 Shared water connections are common in low income housing with communal sanitation facilities. Examples of
such housing types are slums or chawls in urban areas. 7 The guide is available at - http://www.uis.unesco.org/Library/Documents/hhsguide04-en.pdf (Last accessed on
April 11, 2017)
21
6.1 Piped Water Access Within Housing Compound
At the baseline, 30.25 per cent of households in the sample had access to piped water located
within their housing compound. Post-treatment (2012), 31.51 per cent of households in the sample
reported having access to piped water within the housing compound.
6.2 Main Sources of Drinking Water
The main sources of drinking water at the baseline include piped water (46 per cent), wells (24.09
per cent), and hand pumps (27.02 per cent). Other sources of drinking water include surface/rain
water (1.22 per cent) and purchased/private source (0.99 per cent). Post treatment, the main sources
of drinking water remained the same. Notably, percentage of households reporting piped water as
the main source of drinking water increased to 48.17 per cent (relative to 46 per cent at base line).
6.3 Duration and Adequacy of Water Supply
Not enough is known about the duration of water supply. This may be attributed to missing data
(average of 52 per cent across both time periods). Notably, only 3.23 per cent of the sample
reported receiving water 24 hours a day at baseline. In 2012, this reduced to 2.49 per cent. At
baseline, 89.63% of households in the sample reported having adequate year-round access to
water. In 2012, this increased to 91.65 per cent of households. It must be noted, however, that the
answer to this question is based on self-assessment.
6.4 Household Characteristics
At baseline, household size in the sample ranged between 1 and 38 - average household size was
5.19 with a standard deviation of 2.49. In 2012, household size ranged between 1 and 33 – average
household size was 4.85 with a standard deviation of 2.32.

22
The percentage of households located in urban areas remained mostly constant between baseline
and 2012. At baseline, 35.66 per cent of households in the sample reported living in urban areas at
baseline. In 2012, 34.57 per cent of households in the sample reported living in urban areas.
Percentage of households in the sample living below poverty line reduced in 2012 relative to
baseline. At baseline, 19.55 per cent of households in the sample reported living below the poverty
line while 16.41 per cent of households in the sample reported living below the poverty line in
2012.
Finally, the percentage of households living in housing with shared connections reduced in 2012
relative to baseline. At baseline, 18.19 per cent of households lived in housing with shared
connections. This reduced to 3.95 per cent by 2012.
6.5 State-level Controls
Population is measured in millions at the state level - at the baseline, the average population was
63.18 million across all states in India with significant variation (44.84 million); this is apparent
from the range (see Panel C, Table 1). Post-treatment, the average population rose to 70.64 million
across the country again with significant variation (50.82); range is reported in Panel B, Table 1.
Groundwater levels are measured state-wise, on average. At baseline, groundwater levels averaged
at 8.60 meters below ground level across the country. Post treatment, the groundwater levels
averaged at 8.31 meters below ground level across the country.
6.6 PPP Projects in Water and Sanitation
Panel D, Table 1 describes PPP projects in India by sector. At 107 projects, water and sanitation
projects account for only 8 per cent of the total PPP projects in India.

23
Panel E, Table 1 lists water and sanitation PPP projects in India by state between 1991 and 2016,
and between 2006-12 (“post-treatment”). It is also apparent that a potential treatment and control
group emerges. For example, in Panel E, Table 1 the states that received some PPP investment in
water and sanitation are considered for the treatment group and those that did not receive any PPP
investment in the water and sanitation sector between 2006-12 form the control group. PPP
investment in sanitation and waste management is not likely to have any direct impact on water
access or service coverage. Therefore, I further refined the treatment group to include only those
PPP projects in water supply or treatment. These projects are identified in Panel F, Table 1.
Corresponding districts within these states that received PPP investment in water supply or
treatment between 2006-12 are also identified. These states and districts form the treatment group
for the empirical analysis while the rest are designated as the control group.8
7. Empirical Results
In this section, I discuss the results of my empirical analysis. For each model, I discuss results at
the state level and the district level. First, I discuss the impact of water PPPs on household access.
Next, I discuss the impact of water PPPs on access to other drinking water sources. Finally, I
discuss the impact of water PPPs on water service quality indicators - annual adequacy of drinking
water availability and average hours of daily water supply.
8 Not all states with PPP projects had information on the district-level. Only those districts that were identifiable are
included in the analysis.

24
7.1 Impact of Water PPPs on Household Access to Water
Here, I discuss the impact of water PPPs on household access to piped water in the treatment group
relative to the control group. At both the state and district level, I find that water PPPs are
negatively correlated with household access to water. This association holds across model
specifications. A detailed discussion follows.
Access to Drinking Water Source Within the Housing Compound
State-level Analysis
Table 1, Panel A in Appendix B shows the impact of water PPPs on access to main drinking water
sources within the housing compound. My results suggest that water PPPs are positively correlated
with household access to their main drinking water source. This association holds across model
specifications (See Model 3 and 4, Table 1: Panel A)
I find that, on average, households located in treatment states are more likely to have drinking
water access within their housing compound (regardless of water source), controlling for state-
level and household-level characteristics. OLS results in Model 3, Table 1: Panel A estimates that
households in treatment states have a 3.84 percentage point higher probability of having access to
their main drinking water source within their housing compound relative to households in control
states (controlling for state and household level characteristics).
District-level Analysis
Model 3, Table 2: Panel A (Appendix B) shows district level impact of water PPPs on household
access to the main drinking water source. On average households in districts with water PPPs are
less likely to report having access to their main drinking water source within the housing
compound relative to households in control districts. Controlling for state and household level

25
characteristics, on average, a household in a treatment district has a 5.16 percentage point lower
probability of reporting access to its main drinking water source within its housing compound
relative to households in control districts.
Access to Piped Water Within the Housing Compound
State-level Analysis
Table 1: Panel B, Appendix B describes the impact of water PPPs on the access to piped water
access in households in those states, measured at the state level. My results suggest that water PPPs
are negatively correlated with household access to piped water. This association holds across
model specifications (See Model 4, Table 1: Panel B).
On average, I find that households in states with water PPPs are less likely to have access to piped
water within their housing compounds relative to households in control states, controlling for state-
level population and groundwater levels and household characteristics. OLS results in Model 3,
Table 1, Panel A suggest that on average, a household in a treatment state has a 1.35 percentage
point lower probability of having piped water access within its housing compound relative to a
household in a control state while controlling for state and household level characteristics.
District-level Analysis
Model 1, Table 2: Panel A, Appendix B suggests that on average, households in districts with
water PPPs are less likely to report having access to piped water within their housing compound
relative to households in control districts. Controlling for state and household level characteristics,
on average, a household in a treatment district has a 5.62 percentage point lower probability of
reporting access to piped water within its housing compound relative to households in control
districts.

26
7.2 Impact of Water PPPs on Access to an Improved Drinking Water Source
Here, I discuss the impact of water PPPs on access to an improved drinking water source at the
state and district level.
At the state level, Table 1: Panel C presents the effect of water PPPs on the main drinking water
source of households in treatment and control groups. I find that on average, households in
treatment states are less likely to report piped water as their main drinking water source than
households in control states. Model 1, Table 1: Panel C predicts that on average, the probability
that a household in a treatment state reports piped water as its main drinking water source is 2.53
percentage points lesser than a household in a control state, controlling for state and household
level characteristics. This finding is consistent with my earlier finding on household access to
piped water.
On the other hand, I also find that households in treatment states are less likely to report surface
water sources as their main drinking water source relative to households in control states. Surface
water sources are considered “unimproved” since there is increased risk of contamination. Model
4, Table 1: Panel C predicts that the probability that households in treatment states report surface
water as their main drinking water source is 0.62 percentage points lower than households in
control states, controlling for relevant state and household level characteristics.
Finally, I also find that on average, households in treatment states are more likely to use wells for
their drinking water needs or purchase their drinking water from private providers like tankers,
relative to households in control states, controlling for state and household level characteristics.
This implies that they are not benefitting from the water supply network.
27
At the district level, Table 2: Panel B shows the impact of water PPPs on access to main drinking
water source between treatment and control groups. My analysis reveals that households in
treatment districts are more likely to rely on wells for their drinking water needs than households
in control districts. This effect is consistent with my findings at the state level. On average and
controlling for state and household level characteristics, I find that households in treatment districts
have a 5.07 percentage point higher probability of reporting wells as their main drinking water
source relative to control states.
Further, I find that the households in treatment districts are less likely to rely on piped water or
handpumps for their drinking water needs relative to households in control states on average. I
find no effect on households’ reliance on surface water sources (unlike at the state level)
7.3 Impact of PPPs in Water Supply on Water Service Indicators
Overall, I find that water PPPs are negatively correlated with water service indicators like self-
reported adequacy of water supply and average duration of daily water supply.
Adequacy Drinking Water Availability all Year Round
Model 5, Table 1: Panel D (Appendix B) presents results on the effect of water PPPs on self-
assessed adequacy of water supply all year-round at the state level. I find that households in
treatment states are less likely to report that they had adequate access to a water source all year
round relative to control states. My model predicts that on average, controlling for state and
household characteristics, the probability that a household in a treatment state reports adequate
access to water all year round is 0.91 percentage point lower than households in control states.
At the district level, on average, I find that households in treatment districts have a 2.1 percentage
point lower probability of reporting adequate access to drinking water all year round relative to

28
households in control states, controlling for state and household level characteristics (Model 5,
Table 2: Panel C, Appendix B).
Duration of Average Daily Water Supply
Likewise, I find that households in states with water PPPs are less likely to receive 24 hours’ water
supply daily, relative to households in control states. Model 1, Table 1: Panel D presents my results
on this variable. On average, I find that the probability that a household in a treatment state receives
water 24 hours a day is 0.98 percentage points lower than households in control states, controlling
for state and household level characteristics.
At the district level, results in Model 1-4, Table 2: Panel C suggests that on average, households
in treatment districts report reduced duration of water supply relative to households in control
states. For instance, households in treatment districts have a 1.53 percentage point lower
probability of reporting 24-hour water supply relative to households in control states controlling
for state and household level characteristics.
8. Limitations
In this section, I acknowledge and discuss three main concerns to internal validity – aggregation
of data, heterogeneity across the treatment and control group and finally, the endogeneity of the
treatment variable.
8.1 Aggregation of Data at the State Level
Water resources are listed as a state subject under the Indian Constitution – this means that states
in India have the primary responsibility to legislate and make policy on water resource
management. Local governments such as municipalities and panchayats play a crucial role water
service delivery. In most Indian states, water supply is managed by water utilities or agencies at

29
the municipal, metropolitan or village level. For instance, in the state of Karnataka, there is a rural
water supply and sanitation agency, a municipal or urban water supply and drainage board and a
separate water supply and sewerage board for the Bangalore metropolitan area (capital city of
Karnataka).
Private participation in water supply usually occurs at the utility level which is a municipal (local
government) body - the PPP arrangements are between the municipal corporation and the private
party. It follows that such PPP arrangements are likely to impact water access and quality only in
the towns and neighborhoods served by that municipal corporation. However, for the purpose of
this paper, I have aggregated my data at the state and district level because utility-level data was
not accessible/available. Therefore, it is possible that the association between private participation
and water supply and the effects I observe at the state level may be different from the effects I
could observe using municipal or utility level data.
8.2 Heterogeneity of Treatment and Control Groups
In a DD approach, homogeneity between treatment and control groups boosts internal validity. To
make causal inferences, the treatment and control group should not differ significantly on
measurable/observable characteristics at baseline.
Table 1, Appendix C examines the difference between outcome variables in the treatment and
control groups at baseline. All outcome variables I use in my analysis including household access
to piped water, sources of drinking water, daily duration of water supply and annual adequacy are
statistically different at 1 per cent level or lower across both groups at baseline. Higher proportion
of households in the treatment group have access to an improved source of drinking water and
have household access to water at baseline.
30
Table 2, Appendix C examines differences between household characteristics in the treatment and
control groups at baseline. At baseline, treatment and control groups vary significantly on
household characteristics at the one per cent level or lower. Notably, household size in the
treatment group is smaller than the control group at baseline. Further, households with shared
water connections are also fewer in the treatment group. The only exception is the proportion of
households living below poverty line across both groups at baseline.
Table 3 in Appendix C examines differences between state level characteristics – population and
average groundwater level in the treatment and control groups at baseline. On both these
characteristics, I observe that treatment and control groups vary in statistically different terms (one
percent or lower) at baseline. This points towards my next limitation, the endogeneity of the
treatment variable.
8.3 Endogeneity of Treatment Variable
The exogeneity of the treatment variable is crucial to make any causal inferences in case of a
natural or quasi experiment i.e. variation in the key independent variable should not be driven by
the outcome variable or any related factors (Remler and Van Ryzin, 2015).
In the absence of random assignment, I need to inquire in to the factors that drive the independent
variable i.e. private participation in India’s water supply (Remler and Van Ryzin, 2015). The
factors that drive private investment in Indian states is a separate area of inquiry and as such,
outside the scope of this paper. However, results in Appendix C point to the possibility that there
are other determinants of firms’ decision to invest in one Indian state over another. Evidence
suggests that there is considerable variation in private investment across Indian states. A study by
Mallick (2013, 2011) indicates that infrastructure, gross fiscal deficit, market size, economic
uncertainty, quality of governance, availability of finance and labor productivity are some of the

31
determinants of private investment inflow to Indian states. These factors are therefore likely to
impact the probability of an Indian state receiving private participation in its water sector.
Arguably these are not directly related to the outcome variables I am examining. However, they
are determinants common to both water service delivery metrics and private investment. This
might explain why states in treatment group record higher levels of water access and service even
before receiving the treatment.
Therefore, private participation in India’s water sector is not completely exogenous – factors that
affect water service delivery metrics in a state are also driving investors’ decision to invest in that
state. The results in Appendix C further support the notion that the treatment is likely to be
endogenous.
8.4 Strategies to Boost Internal Validity
The aggregation problem could partially be solved by aggregating the household survey data at
the municipal level like Wang et. al (2010), Clarke at. al (2004) and Carillo et. al (2007) did in
their study. Unfortunately, it is not possible to perform such granular analysis with my data source
since IHDS data does not have a municipal area identifier. Another possible approach would be to
carry out a utility level analysis like the ones by Estache and Grifell-Tatje (2011) and Kirpatrick
et. al (2002) who used utility level data to examine the impact of private participation on their
variables of interest. Lee’s approach (2011) of using household expenditure data to examine
impact of privatization on access and affordability of water services is also an option. I am unable
to carry out such analysis due to paucity of data and resources.
The endogeneity and the heterogeneity problem can be jointly addressed using techniques like
instrumental variables or propensity score matching (Heckman et. al, 2006; Angrist and Pischke,
2008). However, this exercise will require additional data collection including data on covariates

32
that affect the probability of an Indian state receiving private investment (preferably in the water
sector). This analysis is beyond the scope of my paper and therefore I have not addressed it.
9. Robustness Analysis
In this section, I address some of the limitations described in the preceding section, using clustered
robust standard errors. Bertrand et al. (2004) point out that many studies that employ DD
estimation ignore that the traditional OLS model of DD estimation is likely to produce inconsistent
standard errors due to serial correlation. Serial correlation produces inefficient estimates. Bertrand
et al. (2004) argue that DD estimation is vulnerable to serial correlation for three reasons – first,
usually these studies use data from several time periods. Second, the dependent variable is likely
to be positively serially correlated over time. Finally, the treatment variable itself changes very
little over time within a state. Although I am using data from only two time periods, the dependent
variables are likely to be positively correlated and water PPPs (the treatment) do change very little
over time within a state.
Further, I am grouping household data in to clusters at the state and district level. Cameron and
Miller (2015) argue that regression models that use individual or person or firm level cross-section
or panel data clustered on a geographical region (like village or state) is likely to generate standard
errors that overstate estimator precision. This is because the model errors are likely to be correlated
within the cluster. This within cluster error correlation is likely to result in misleadingly small
standard errors and as a result, overstated statistical significance. It could also be argued that
removing within cluster correlation is not appropriate considering households in one state or
district do vary from each other. However, before I make any causal inferences, I will control for

33
within-cluster error correlation by using cluster-robust standard errors with clustering at the state
level (the highest level of aggregation).9
Appendix D, Table 1 (Panels A, B and C) and Table 2 shows the state and district level analysis
with cluster-robust standard errors, clustered at the state level. I find that when I account for within-
cluster correlation, water PPPs have no significant impact on water access variables at the state or
district level. Notably, I find that the quality of water service i.e. average daily duration of water
supply (12 hours or more) and annual adequacy are negatively associated with water PPPs at the
state level. The results in Panel C suggest that the probability that a household in a treatment state
receives 12 or more hours of water supply in a day is significantly lower in treatment states relative
to control states. This effect does not hold at the district level.
10. Concluding Remarks
Water service delivery is an integral part of India’s development agenda specifically in urban areas.
Private sector participation through PPP arrangements is a key component of this agenda given
their potential to bridge the infrastructure investment gap and their breadth of sector-specific
expertise. However, it is also essential to ensure that private sector participation through water
PPPs is designed to deliver water service that is affordable, accessible, adequate and meets
minimum drinking water quality standards.
Existing literature suggests that the impact of water PPPs on water access and service varies
widely. This paper contributes to existing literature by focusing on the Indian experience with
private participation in water supply. Specifically, I attempt to isolate the effect of water PPPs on
indicators of water access and service quality in Indian states and districts. The results of my
9 As suggested by Cameron and Miller (2015) citing Bertrand et al. (2004).
34
empirical analysis are inconsistent and ambiguous, pointing to the importance of project specific
features. As such no causal claims are possible.
For most water access variables, empirical results are neither robust nor consistent across the state
and district level. For instance, household access to main drinking water source is positively
correlated with water PPPs at the state level, however, this association is reversed at the district
level.
In cases where the effect is consistent across the state and district level analysis, the results do not
support the theory of change proposed in Section 4. For instance, household access to piped
drinking water (the gold standard in terms of access to an improved source of drinking water) is
negatively correlated with water PPPs at the state and the district level. At the district level, this
effect is more pronounced. This result is consistent with my understanding that exposure levels to
the treatment are likely to be higher at the district level relative to the state level. I suspect that the
level of data aggregation influences the results. I try to address this issue by clustering the standard
errors at the state level to account for within cluster correlation. However, based on the ambiguity
of existing literature on the subject, I am inclined to conclude that project-specific features also
matter in determining their impact on water access and service. Therefore, a utility level or project
level analysis is likely to yield better results.
Notably, the effect of water PPPs on service quality indicators is consistent across the state and
district levels. Water PPPs are negatively correlated with adequacy of drinking water supply during
all times of the year and the average daily duration of water supply. State-level effects are robust;
however, district level effects do not hold when I account for within cluster correlation. Although
these results are inconclusive, a utility-level or project-level study will yield more accurate
estimates of the effect on service quality indicators.

35
Given the inconsistent and ambiguous results, it is not possible to make any causal claims at this
stage. The main threat to internal validity is the possible endogeneity of the treatment variable.
Preliminary analysis in section 8 reveals that the treatment and control groups vary significantly
in observable characteristics. For instance, treatment states appear to have higher levels of water
access and service quality at baseline indicating that there are other factors at play in determining
private participation in India’s water sector. There is some empirical evidence to support this
hypothesis.10 Currently, my analysis does not account for this due to paucity of data. There is need
for further research focused on identifying the determinants of private participation in India’s water
sector. A sub-national analysis would be more valuable in understanding the factors that influence
private participation in India’s water sector and correcting for any selection bias in studies
evaluating the impact of specific projects. Further, such analyses will strengthen future efforts to
identify the effect of water PPPs on water access and service quality.
Finally, data collection at the project level is essential for facilitating future research. Ideally, this
should be done at baseline and post treatment, at the utility level and the household level where
the PPP arrangement is carried out. Doing so will require cooperation from municipal/local
government agencies and private partners operating and managing water utilities. Some utility
level-data is possibly routinely collected under the PPP contractual arrangements. Household data
will likely need to be collected specifically for the sake of evaluating the project.
Given that water PPPs are usually user-fee based and likely to be controversial, robust impact
evaluations can garner consumer support for future projects and/or help government agencies and
private investors remodel the PPP arrangements to improve outcomes.
10 Mullick (2011)

36
Overall, my findings support the notion that systematic evidence-based research and analysis is
required to assess the viability of water PPPs.

37
Appendix A: Descriptive Statistics Table 1, Panel A: Water access variables (total sample)
Baseline (2005) Post-Treatment (2012)
Variable Obs. Percentage of the
total sample (%)
Missing
Data (%)
Obs. Percentage of total
sample (%)
Missing
Data (%)
Household has access to
piped water
41554 30.25% 42152 31.51%
Main Drinking Water
Source
41554 42152
Piped 46 % 48.17 %
Wells 24.09 % 20.96 %
Hand-pump 27.02 % 26.44 %
Surface/rain water 1.22 % 1.45 %
Purchased/Private 0.99 % 1.69 %
Other 0.54 % 0.93 %
Average hours of daily
water supply
41554 54.01 % 42152 52.93 %
Less than an hour 15.92 % 17.18 %
1 – 6 hours 22.39 % 23.80 %
7 – 12 hours 3.68 % 2.87 %
13-23 hours 0.78 % 0.73 %
24 hours 3.23 % 2.49 %

38
Table 1, Panel A contd.
Baseline (2005) Post-Treatment (2012)
Variable Obs. Percentage of the
total sample (%)
Missing
Data (%)
Obs. Percentage of total
sample (%)
Missing
Data (%)
Household has adequate
access to drinking water
source all year round.
41554 89.63 % 2.98 % 42152 91.65 % 1.32 %
Table 1 Panel B: Other Household Characteristics Variables
Baseline (2005) Post-Treatment (2012)
Variable Obs. Percentage of the
total sample (%)
Missing
Data (%)
Obs. Percentage of
total sample (%)
Missing
Data (%)
Households located in urban
areas
41554 35.66% 42152 34.57%
Households living below
poverty line
41554 19.55% 42152 16.41%
Households living in housing
with shared water connections
like chawls or slums
41554 18.19% 42152 3.95%
Baseline (2005) Post-treatment (2012)
Variable Obs. Mean Std. Dev. Min. Max. Obs. Mean Std. Dev. Min. Max.
Household
Size
41554 5.19 2.49 1 38 42152 4.85 2.32 1 33
39
Table 1 Panel C: State-level Control Variables
Baseline (2005) Post-treatment (2012)
Variable Obs. Mean Std. Dev. Min. Max. Obs. Mean Std. Dev. Min. Max.
Population
(millions)
41554 63.18 44.84 0.2 179.82 42152 70.64 50.82 0.24 199.81
Average
Groundwater
Level
38046 8.60 4.60 2.35 21.40 41613 8.31 4.70 2.61 22.55
Table 1, Panel D: PPP projects in India listed by sector
Sector Total #Projects #Projects as a percentage of
the total
Energy 1343 220 16.38 %
Social and Commercial
Infrastructure
1343 146 20.87%
Transport 1343 870 64.78%
Water Sanitation 1343 107 7.97%
40
Table 1, Panel E: PPP projects in India listed state-wise between 1991-2016 and 2006-12
1991-2016 2006-2012
State Total #Projects #Projects as a percentage
of the total (%)
Total #Projects #Projects as a percentage of
the total (%)
Andhra Pradesh 107 4 3.74 33 2 6.06
Assam 107 2 1.87 33 1 3.03
Chandigarh 107 1 0.93 33 None n/a
Delhi 107 5 4.67 33 2 6.06
Goa 107 1 0.93 33 None n/a
Gujarat 107 17 15.89 33 None n/a
Haryana 107 2 1.87 33 1 3.03
Himachal Pradesh 107 1 0.93 33 1 3.03
Jharkhand 107 2 1.87 33 None n/a
Karnataka 107 12 11.21 33 4 12.12
Kerala 107 1 0.93 33 None n/a
Madhya Pradesh 107 3 2.80 33 1 3.03
Maharashtra 107 15 14.02 33 6 18.18
Orissa 107 2 1.87 33 None n/a
Punjab 107 1 0.93 33 None n/a
Rajasthan 107 8 7.48 33 2 6.06
Tamil Nadu 107 10 9.35 33 4 12.12
Uttar Pradesh 107 10 9.35 33 4 12.12
Uttaranchal 107 4 3.74 33 1 3.03
West Bengal 107 6 5.61 33 4 12.12

41
Table 1, Panel F: Water Supply or Treatment PPP projects in Indian states listed by District (2006-12)
S. No State District
1 Maharashtra Thane, Nagpur, Kolhapur, Ahmadnagar, and Bid
2 Karnataka Bangalore, Mysore, Bijapur, and Dharwad
3 Orissa Kordha
4 Jharkhand Paschimi Singhbhum
5 Tamil Nadu Chennai, Coimbatore
6 Delhi Delhi
7 Haryana Kaithal
8 West Bengal Kolkata, and South 24 parganahs
9 Madhya Pradesh Dewas, East Nimar, and Shivpur
10 Andhra Pradesh Vishakapatnam
11 Gujarat Ahemdabad
12 Rajasthan Not available
13 Kerala Bekal
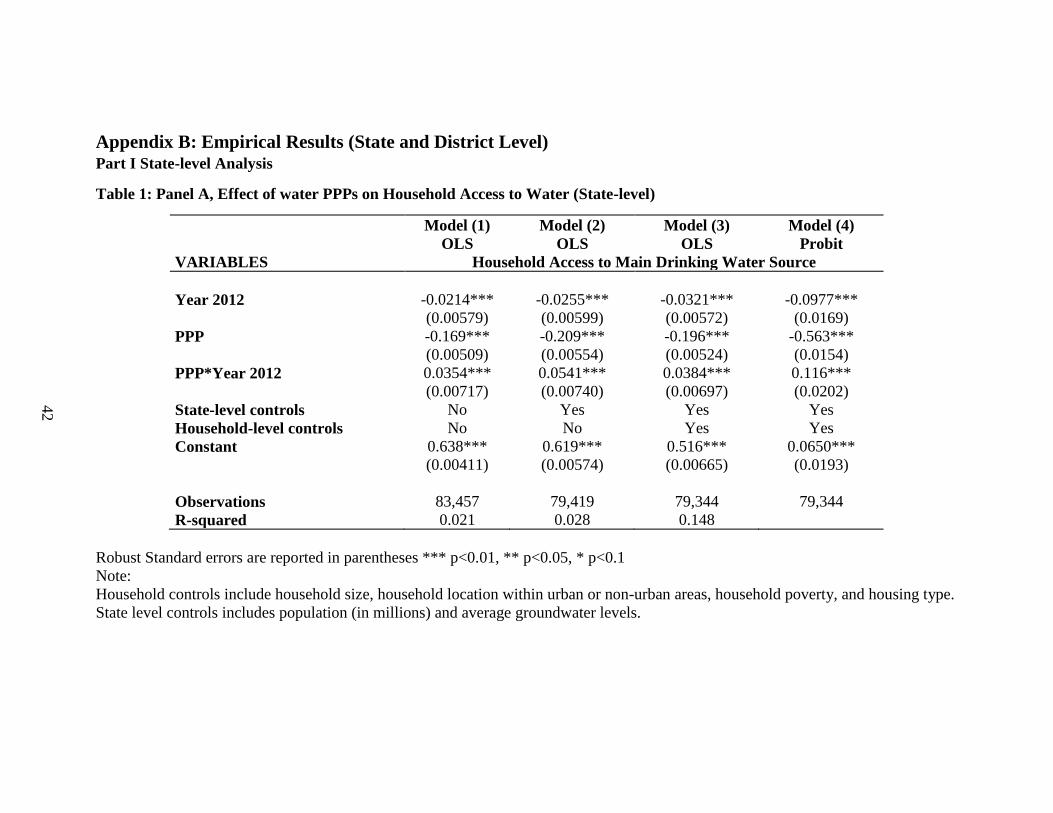
42
Appendix B: Empirical Results (State and District Level) Part I State-level Analysis
Table 1: Panel A, Effect of water PPPs on Household Access to Water (State-level)
Model (1)
OLS
Model (2)
OLS
Model (3)
OLS
Model (4)
Probit
VARIABLES Household Access to Main Drinking Water Source
Year 2012 -0.0214*** -0.0255*** -0.0321*** -0.0977***
(0.00579) (0.00599) (0.00572) (0.0169)
PPP -0.169*** -0.209*** -0.196*** -0.563***
(0.00509) (0.00554) (0.00524) (0.0154)
PPP*Year 2012 0.0354*** 0.0541*** 0.0384*** 0.116***
(0.00717) (0.00740) (0.00697) (0.0202)
State-level controls No Yes Yes Yes
Household-level controls No No Yes Yes
Constant 0.638*** 0.619*** 0.516*** 0.0650***
(0.00411) (0.00574) (0.00665) (0.0193)
Observations 83,457 79,419 79,344 79,344
R-squared 0.021 0.028 0.148
Robust Standard errors are reported in parentheses *** p<0.01, ** p<0.05, * p<0.1
Note:
Household controls include household size, household location within urban or non-urban areas, household poverty, and housing type.
State level controls includes population (in millions) and average groundwater levels.

43
Table 1, Panel B: Effect of water PPPs on piped water access within housing compound (State-level)
Model (1)
OLS Model (2)
OLS Model (3)
OLS Model (4)
Probit
VARIABLES Piped Water Access within Household
Year 2012 0.0178*** 0.0236*** 0.0228*** 0.0915***
(0.00528) (0.00507) (0.00477) (0.0179)
PPP in water
supply
0.0704*** 0.0256*** 0.0248*** 0.149***
(0.00467) (0.00494) (0.00452) (0.0162)
PPP*Year 2012 -0.00740 -0.000892 -0.0135** -0.0574***
(0.00661) (0.00651) (0.00601) (0.0215)
State-level
controls
No Yes Yes Yes
Household
Controls
No No Yes Yes
Constant 0.256*** 0.223*** 0.140*** -1.074***
(0.00373) (0.00509) (0.00578) (0.0203)
Observations 83,644 79,605 79,524 79,524
R-squared 0.005 0.047 0.179
Robust Standard errors are reported in parentheses *** p<0.01, ** p<0.05, * p<0.1
Note:
Household controls include household size, household location within urban or non-urban areas, household poverty, and housing type.
State level controls includes population (in millions) and average groundwater levels.
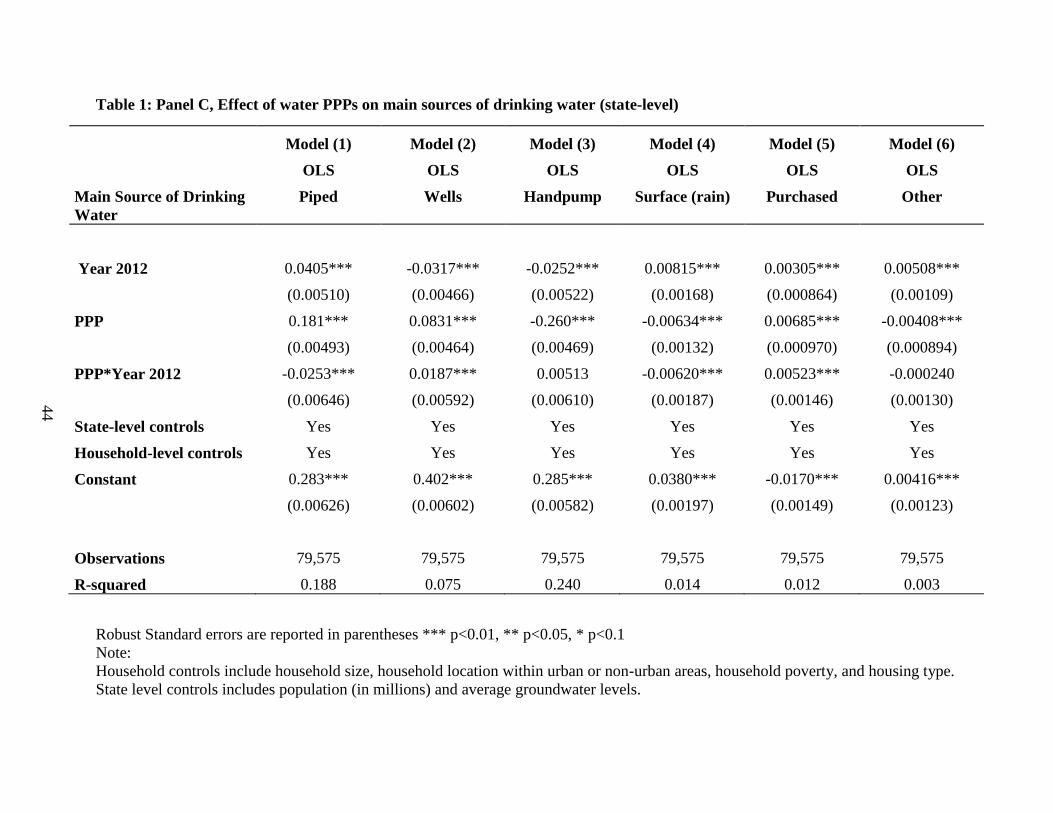
44
Table 1: Panel C, Effect of water PPPs on main sources of drinking water (state-level)
Model (1)
OLS
Model (2)
OLS
Model (3)
OLS
Model (4)
OLS
Model (5)
OLS
Model (6)
OLS
Main Source of Drinking
Water
Piped Wells Handpump Surface (rain) Purchased Other
Year 2012 0.0405*** -0.0317*** -0.0252*** 0.00815*** 0.00305*** 0.00508***
(0.00510) (0.00466) (0.00522) (0.00168) (0.000864) (0.00109)
PPP 0.181*** 0.0831*** -0.260*** -0.00634*** 0.00685*** -0.00408***
(0.00493) (0.00464) (0.00469) (0.00132) (0.000970) (0.000894)
PPP*Year 2012 -0.0253*** 0.0187*** 0.00513 -0.00620*** 0.00523*** -0.000240
(0.00646) (0.00592) (0.00610) (0.00187) (0.00146) (0.00130)
State-level controls Yes Yes Yes Yes Yes Yes
Household-level controls Yes Yes Yes Yes Yes Yes
Constant 0.283*** 0.402*** 0.285*** 0.0380*** -0.0170*** 0.00416***
(0.00626) (0.00602) (0.00582) (0.00197) (0.00149) (0.00123)
Observations 79,575 79,575 79,575 79,575 79,575 79,575
R-squared 0.188 0.075 0.240 0.014 0.012 0.003
Robust Standard errors are reported in parentheses *** p<0.01, ** p<0.05, * p<0.1
Note:
Household controls include household size, household location within urban or non-urban areas, household poverty, and housing type.
State level controls includes population (in millions) and average groundwater levels.

45
Table 1: Panel D, Effect of PPPs in water supply on water service indicators - average hours of daily water supply and
adequacy of water supply (state-level)
Model (1)
OLS
Model (2)
OLS
Model (3)
OLS
Model (4)
OLS
Model (5)
OLS
Average duration of daily water supply (hours) Adequacy of
water supply
Variables 24 < 1 <12 12>, <24 Year-round
Year 2012 0.00329 0.00216 0.0249*** 0.00367*** 0.00995***
(0.00254) (0.00302) (0.00502) (0.00136) (0.00281)
PPP -0.0278*** 0.153*** 0.214*** -0.00609*** -0.0260***
(0.00208) (0.00358) (0.00490) (0.00111) (0.00305)
PPP*2012 -0.00980*** -0.00494 -0.0142** -0.00481*** -0.00905**
(0.00276) (0.00464) (0.00642) (0.00148) (0.00375)
State-level controls Yes Yes Yes Yes Yes
Household-level controls Yes Yes Yes Yes Yes
Constant 0.0532*** 0.0145*** 0.215*** 0.0115*** 0.937***
(0.00281) (0.00461) (0.00621) (0.00137) (0.00371)
Observations 79,575 79,575 79,575 79,575 77,872
R-squared 0.025 0.060 0.167 0.009 0.006
Robust standard errors in parentheses
*** p<0.01, ** p<0.05, * p<0.1
Note:
Household controls include household size, household location within urban or non-urban areas, household poverty, and housing type.
State level controls includes population (in millions) and average groundwater levels.
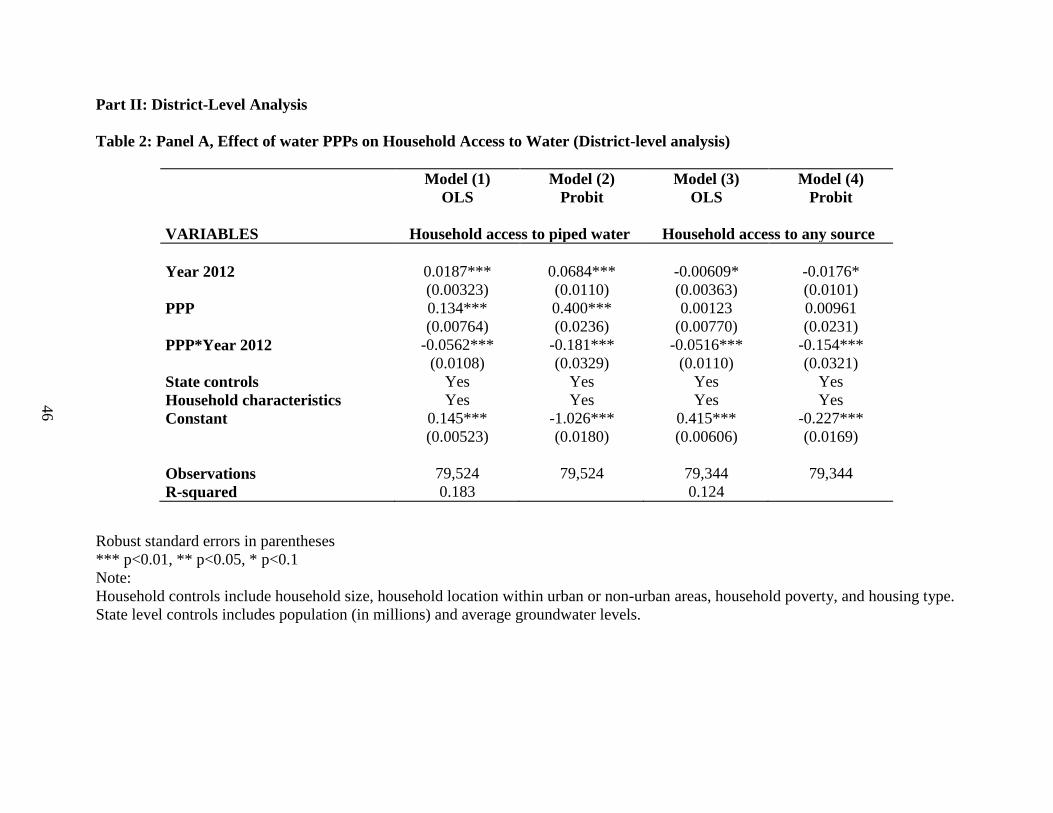
46
Part II: District-Level Analysis
Table 2: Panel A, Effect of water PPPs on Household Access to Water (District-level analysis)
Model (1)
OLS
Model (2)
Probit
Model (3)
OLS
Model (4)
Probit
VARIABLES Household access to piped water Household access to any source
Year 2012 0.0187*** 0.0684*** -0.00609* -0.0176*
(0.00323) (0.0110) (0.00363) (0.0101)
PPP 0.134*** 0.400*** 0.00123 0.00961
(0.00764) (0.0236) (0.00770) (0.0231)
PPP*Year 2012 -0.0562*** -0.181*** -0.0516*** -0.154***
(0.0108) (0.0329) (0.0110) (0.0321)
State controls Yes Yes Yes Yes
Household characteristics Yes Yes Yes Yes
Constant 0.145*** -1.026*** 0.415*** -0.227***
(0.00523) (0.0180) (0.00606) (0.0169)
Observations 79,524 79,524 79,344 79,344
R-squared 0.183 0.124
Robust standard errors in parentheses
*** p<0.01, ** p<0.05, * p<0.1
Note:
Household controls include household size, household location within urban or non-urban areas, household poverty, and housing type.
State level controls includes population (in millions) and average groundwater levels.
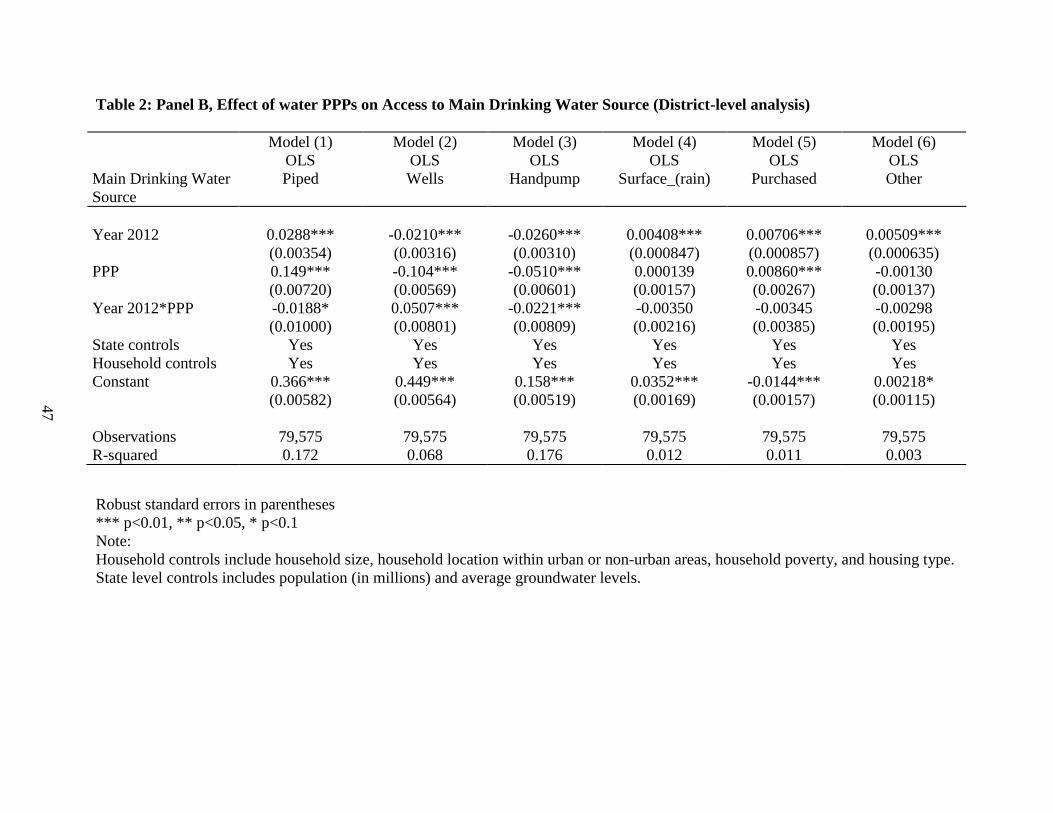
47
Table 2: Panel B, Effect of water PPPs on Access to Main Drinking Water Source (District-level analysis)
Model (1)
OLS
Model (2)
OLS
Model (3)
OLS
Model (4)
OLS
Model (5)
OLS
Model (6)
OLS
Main Drinking Water
Source
Piped Wells Handpump Surface_(rain) Purchased Other
Year 2012 0.0288*** -0.0210*** -0.0260*** 0.00408*** 0.00706*** 0.00509***
(0.00354) (0.00316) (0.00310) (0.000847) (0.000857) (0.000635)
PPP 0.149*** -0.104*** -0.0510*** 0.000139 0.00860*** -0.00130
(0.00720) (0.00569) (0.00601) (0.00157) (0.00267) (0.00137)
Year 2012*PPP -0.0188* 0.0507*** -0.0221*** -0.00350 -0.00345 -0.00298
(0.01000) (0.00801) (0.00809) (0.00216) (0.00385) (0.00195)
State controls Yes Yes Yes Yes Yes Yes
Household controls Yes Yes Yes Yes Yes Yes
Constant 0.366*** 0.449*** 0.158*** 0.0352*** -0.0144*** 0.00218*
(0.00582) (0.00564) (0.00519) (0.00169) (0.00157) (0.00115)
Observations 79,575 79,575 79,575 79,575 79,575 79,575
R-squared 0.172 0.068 0.176 0.012 0.011 0.003
Robust standard errors in parentheses
*** p<0.01, ** p<0.05, * p<0.1
Note:
Household controls include household size, household location within urban or non-urban areas, household poverty, and housing type.
State level controls includes population (in millions) and average groundwater levels.

48
Table 2: Panel C, Effect of water PPPs on Water Service Indicators (District-level analysis)
OLS Model (1) Model (2) Model (3) Model (4) Model (5)
Average Daily Duration of Water Supply (hours)
VARIABLES 24 <1 <12 >12, < 24 Adequacy
Year 2012 -0.00275** 0.00711** 0.0203*** 0.00103 0.00475**
(0.00125) (0.00283) (0.00356) (0.000660) (0.00206)
PPP 0.00880** 0.0303*** 0.134*** 0.00614*** 0.0319***
(0.00365) (0.00777) (0.00801) (0.00217) (0.00432)
PPP*Year 2012 -0.0153*** -0.0521*** -0.00420 -0.00911*** -0.0210***
(0.00461) (0.0102) (0.0110) (0.00271) (0.00605)
State controls Yes Yes Yes Yes Yes
Household controls Yes Yes Yes Yes Yes
Constant 0.0393*** 0.0888*** 0.315*** 0.00834*** 0.923***
(0.00227) (0.00456) (0.00582) (0.00110) (0.00343)
Observations 79,575 79,575 79,575 79,575 77,872
R-squared 0.017 0.030 0.139 0.007 0.004
Robust standard errors in parentheses
*** p<0.01, ** p<0.05, * p<0.1
Note:
Household controls include household size, household location within urban or non-urban areas, household poverty, and housing type.
State level controls includes population (in millions) and average groundwater levels.

49
Appendix C: Limitations Table 1: Difference between outcome variables in the treatment and control groups at baseline (2005).
Treatment Control
Outcome Variable Observations % of the total
sample
Observations % of the total
sample
Difference
in Means
Standard
Error
Household access to piped
water
27845 32.61 % 13647 25.56% -.07*** 0.005
Main source of drinking water
Piped water 27878 52.40% 13676 32.98% -0.19*** 0.005
Wells 27878 25.67% 13676 20.86% -0.05*** 0.004
Handpumps 27878 19.12% 13676 43.11% 0.24*** 0.004
Surface water 27878 0.89% 13676 1.89% 0.01*** 0.001
Purchased water 27878 1.35% 13676 0.28% -0.01*** 0.001
Other sources 27878 0.47% 13676 0.67% 0.001** 0.0007
Duration of supply (daily)
24 hours 27878 2.58% 13676 4.56% 0.019*** 0.001
Less than an hour 27878 20.84% 13676 5.88% -0.15*** 0.004
Less than 12 hours 27878 49.14% 13676 27.38% -0.22*** 0.005
More than 12 but less than 24
hours
27878 0.66% 13676 1.01% 0.003*** 0.001
Adequacy (annual) 26852 91.71% 13464 93.7% 0.02*** 0.003
***p<0.001, **p<0.05

50
Table 2: Difference between household characteristics in the treatment and control groups at baseline (2005).
Treatment Control
Household Variable Observations Mean Observations Mean Difference in
Means
Standard
Error
Household size 27878 5.01 13676 5.56 0.55*** 0.026
Prevalence of poverty 27878 18.98% 13676 18.88% -0.001 0.004
Households using shared water
connections in chawls/slums
etc.
27878 18.98% 13676 16.57% -0.024*** 0.004
Share of households in urban
areas
27878 37.3% 13676 32.31% -0.049*** 0.005
***p<0.001, **p<0.05
Table 3: Difference between state-level characteristics in the treatment and control groups at baseline (2005).
Treatment Control
State Variable Observations Mean Observations Mean Difference in
Means
Standard
Error
Population (millions) 27878 61.71 13676 66.16 4.44*** 0.468
Average ground water level 25498 9.93 12548 5.91 -4.02*** 0.046
***p<0.001, **p<0.05
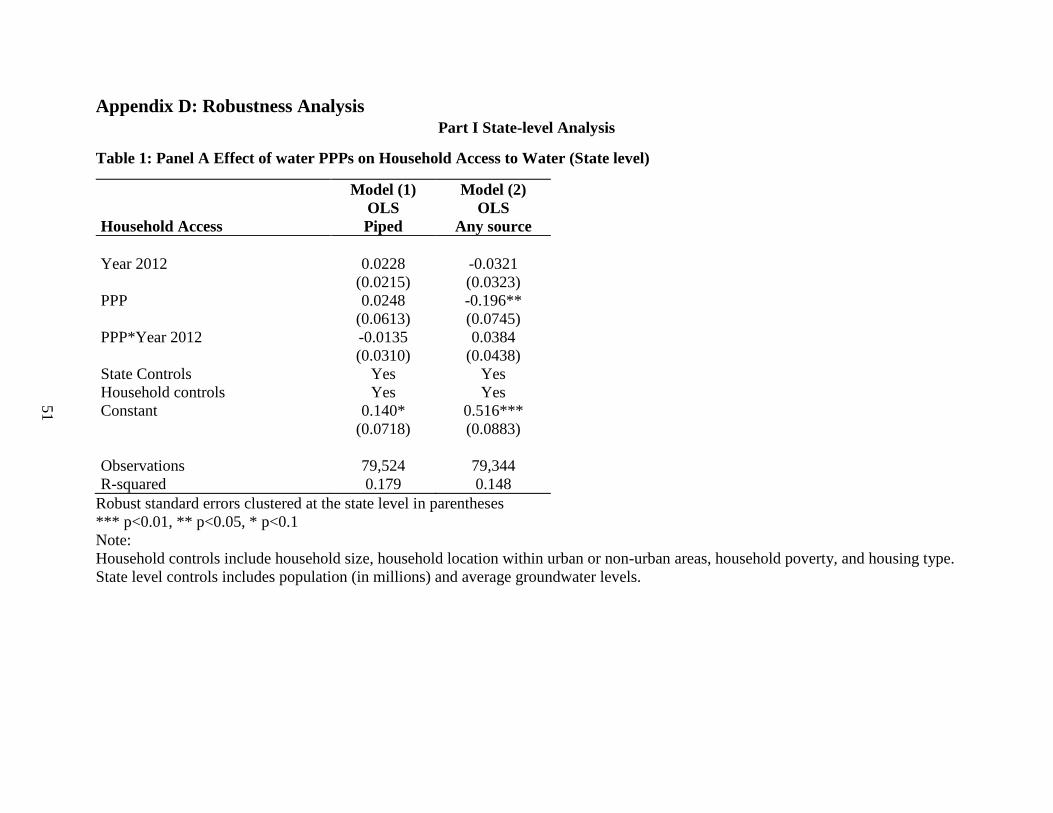
51
Appendix D: Robustness Analysis Part I State-level Analysis
Table 1: Panel A Effect of water PPPs on Household Access to Water (State level)
Model (1)
OLS
Model (2)
OLS
Household Access Piped Any source
Year 2012 0.0228 -0.0321
(0.0215) (0.0323)
PPP 0.0248 -0.196**
(0.0613) (0.0745)
PPP*Year 2012 -0.0135 0.0384
(0.0310) (0.0438)
State Controls Yes Yes
Household controls Yes Yes
Constant 0.140* 0.516***
(0.0718) (0.0883)
Observations 79,524 79,344
R-squared 0.179 0.148
Robust standard errors clustered at the state level in parentheses
*** p<0.01, ** p<0.05, * p<0.1
Note:
Household controls include household size, household location within urban or non-urban areas, household poverty, and housing type.
State level controls includes population (in millions) and average groundwater levels.

52
Table 1: Panel B Effect of water PPPs on Access to Main Drinking Water Source (State level)
Model (1)
OLS
Model (2)
OLS
Model (3)
OLS
Model (4)
OLS
Model (5)
OLS
Model (6)
OLS
Main Drinking Water
Source
Piped Wells Handpump Surface (rain) Purchased Other
Year 2012 0.0405 -0.0317 -0.0252 0.00815 0.00305 0.00508
(0.0257) (0.0487) (0.0660) (0.00813) (0.00273) (0.00352)
PPP 0.181* 0.0831 -0.260*** -0.00634 0.00685 -0.00408
(0.0976) (0.0776) (0.0736) (0.00679) (0.00543) (0.00271)
PPP*Year 2012 -0.0253 0.0187 0.00513 -0.00620 0.00523 -0.000240
(0.0367) (0.0571) (0.0715) (0.00819) (0.00494) (0.00416)
State Controls Yes Yes Yes Yes Yes Yes
Household controls Yes Yes Yes Yes Yes Yes
Constant 0.283** 0.402*** 0.285*** 0.0380*** -0.0170*** 0.00416
(0.113) (0.110) (0.0833) (0.0106) (0.00383) (0.00301)
Observations 79,575 79,575 79,575 79,575 79,575 79,575
R-squared 0.188 0.075 0.240 0.014 0.012 0.003
Robust standard errors clustered at the state level in parentheses
*** p<0.01, ** p<0.05, * p<0.1
Note:
Household controls include household size, household location within urban or non-urban areas, household poverty, and housing type.
State level controls includes population (in millions) and average groundwater levels.

53
Table1: Panel C, Panel B Effect of water PPPs on Water Service Variables (State level)
Model (1)
OLS
Model (2)
OLS
Model (3)
OLS
Model (4)
OLS
Model (5)
OLS
Average daily duration of water supply(hours)
Water Service Variables 24 <1 <12 12<x<24 Adequacy
Year 2012 0.00329 0.00216 0.0249*** 0.00367*** 0.00995***
(0.00254) (0.00302) (0.00502) (0.00136) (0.00281)
PPP -0.0278*** 0.153*** 0.214*** -0.00609*** -0.0260***
(0.00208) (0.00358) (0.00490) (0.00111) (0.00305)
PPP*2012 -0.00980*** -0.00494 -0.0142** -0.00481*** -0.00905**
(0.00276) (0.00464) (0.00642) (0.00148) (0.00375)
State controls Yes Yes Yes Yes Yes
Household controls Yes Yes Yes Yes Yes
Constant 0.0532*** 0.0145*** 0.215*** 0.0115*** 0.937***
(0.00281) (0.00461) (0.00621) (0.00137) (0.00371)
Observations 79,575 79,575 79,575 79,575 77,872
R-squared 0.025 0.060 0.167 0.009 0.006
Robust standard errors in parentheses clustered at the state level
*** p<0.01, ** p<0.05, * p<0.1
Note:
Household controls include household size, household location within urban or non-urban areas, household poverty, and housing type.
State level controls includes population (in millions) and average groundwater levels.
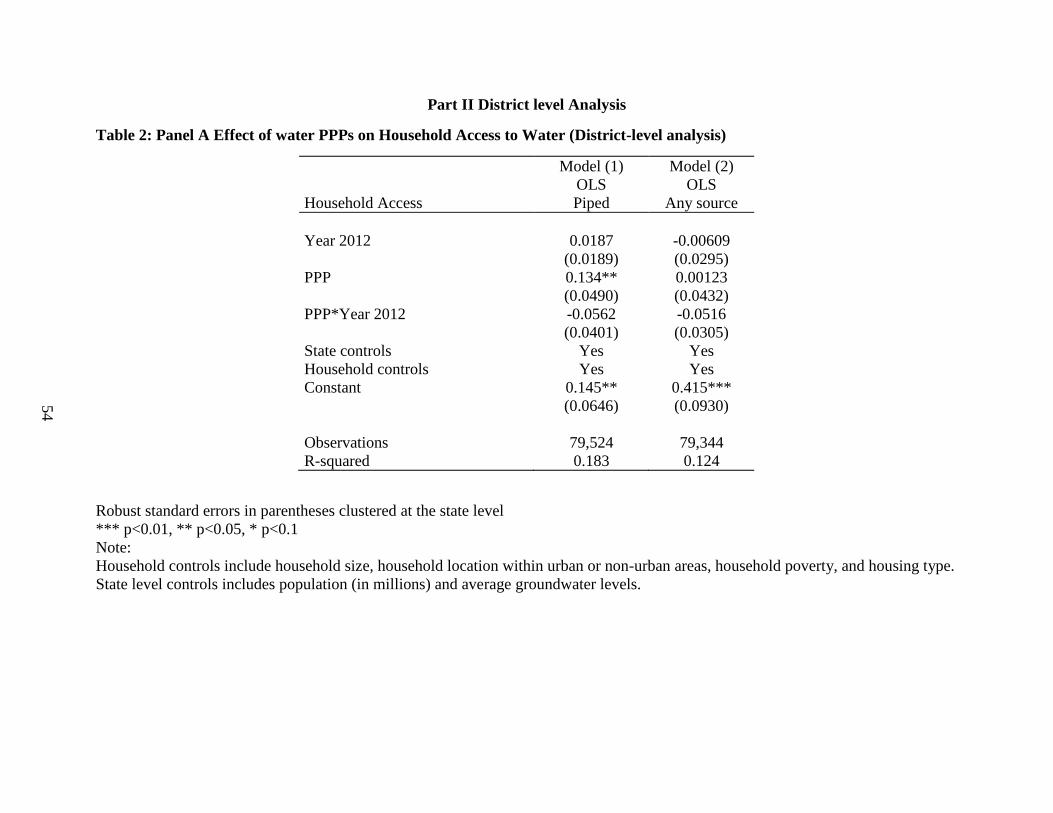
54
Part II District level Analysis
Table 2: Panel A Effect of water PPPs on Household Access to Water (District-level analysis)
Model (1)
OLS
Model (2)
OLS
Household Access Piped Any source
Year 2012 0.0187 -0.00609
(0.0189) (0.0295)
PPP 0.134** 0.00123
(0.0490) (0.0432)
PPP*Year 2012 -0.0562 -0.0516
(0.0401) (0.0305)
State controls Yes Yes
Household controls Yes Yes
Constant 0.145** 0.415***
(0.0646) (0.0930)
Observations 79,524 79,344
R-squared 0.183 0.124
Robust standard errors in parentheses clustered at the state level
*** p<0.01, ** p<0.05, * p<0.1
Note:
Household controls include household size, household location within urban or non-urban areas, household poverty, and housing type.
State level controls includes population (in millions) and average groundwater levels.
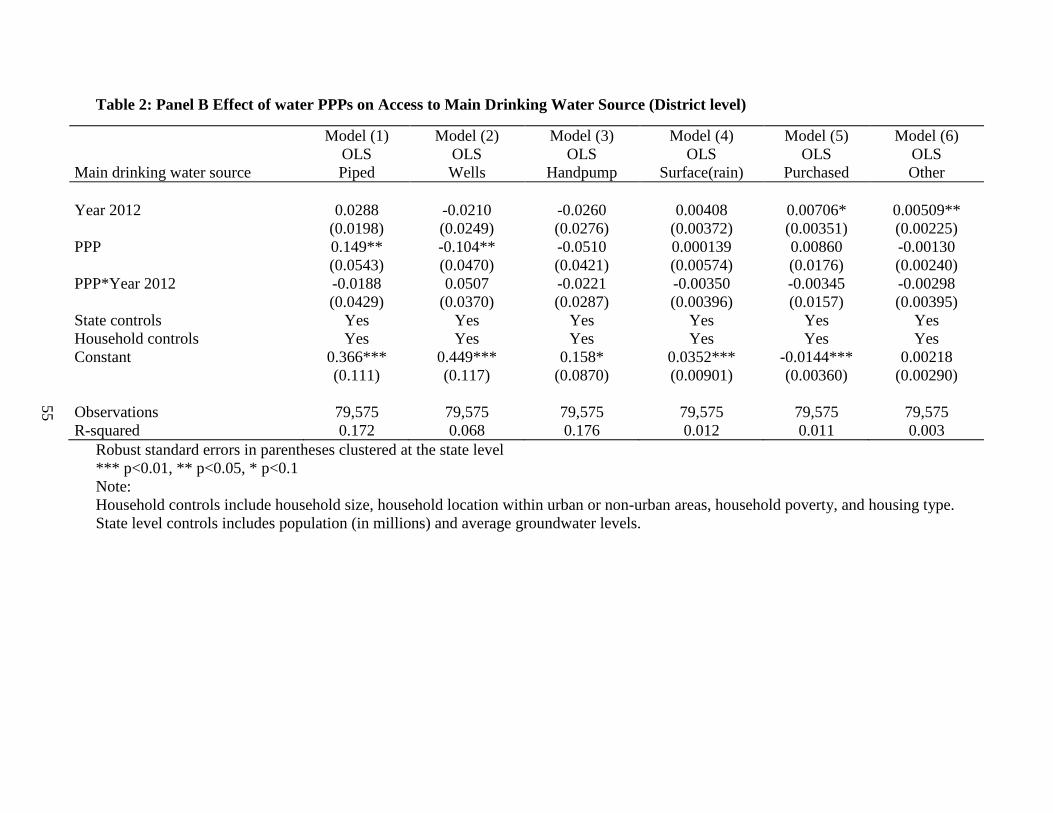
55
Table 2: Panel B Effect of water PPPs on Access to Main Drinking Water Source (District level)
Model (1)
OLS
Model (2)
OLS
Model (3)
OLS
Model (4)
OLS
Model (5)
OLS
Model (6)
OLS
Main drinking water source Piped Wells Handpump Surface(rain) Purchased Other
Year 2012 0.0288 -0.0210 -0.0260 0.00408 0.00706* 0.00509**
(0.0198) (0.0249) (0.0276) (0.00372) (0.00351) (0.00225)
PPP 0.149** -0.104** -0.0510 0.000139 0.00860 -0.00130
(0.0543) (0.0470) (0.0421) (0.00574) (0.0176) (0.00240)
PPP*Year 2012 -0.0188 0.0507 -0.0221 -0.00350 -0.00345 -0.00298
(0.0429) (0.0370) (0.0287) (0.00396) (0.0157) (0.00395)
State controls Yes Yes Yes Yes Yes Yes
Household controls Yes Yes Yes Yes Yes Yes
Constant 0.366*** 0.449*** 0.158* 0.0352*** -0.0144*** 0.00218
(0.111) (0.117) (0.0870) (0.00901) (0.00360) (0.00290)
Observations 79,575 79,575 79,575 79,575 79,575 79,575
R-squared 0.172 0.068 0.176 0.012 0.011 0.003
Robust standard errors in parentheses clustered at the state level
*** p<0.01, ** p<0.05, * p<0.1
Note:
Household controls include household size, household location within urban or non-urban areas, household poverty, and housing type.
State level controls includes population (in millions) and average groundwater levels.

56
Table 2: Panel C, Effect of water PPPs on Water Service Indicators (District-level analysis)
OLS Model (1) Model (2) Model (3) Model (4) Model (5)
Average daily hours of water supply (hours)
VARIABLES 24 <1 <12 12<x<24 Adequacy
Year 2012 -0.00275 0.00711 0.0203 0.00103 0.00475
(0.00375) (0.0165) (0.0183) (0.00118) (0.0157)
PPP 0.00880 0.0303 0.134** 0.00614 0.0319**
(0.0157) (0.0888) (0.0621) (0.0105) (0.0140)
PPP*Year 2012 -0.0153 -0.0521 -0.00420 -0.00911 -0.0210
(0.0127) (0.0688) (0.0496) (0.00819) (0.0247)
State controls Yes Yes Yes Yes Yes
Household controls Yes Yes Yes Yes Yes
Constant 0.0393* 0.0888 0.315*** 0.00834** 0.923***
(0.0229) (0.0592) (0.103) (0.00388) (0.0274)
Observations 79,575 79,575 79,575 79,575 77,872
R-squared 0.017 0.030 0.139 0.007 0.004
Robust standard errors in parentheses clustered at the state level
*** p<0.01, ** p<0.05, * p<0.1
Note:
Household controls include household size, household location within urban or non-urban areas, household poverty, and housing type.
State level controls includes population (in millions) and average groundwater levels.

57
References
Abdala, M. A. (1997). Welfare effects of Buenos Aires' water and sewerage services
privatization. In Anales de la XXXII Reunion Anual de la Asociación Argentina de
Economia Política, www. aaep. org. ar.
Bakker, K. J. (2003). An uncooperative commodity: Privatizing water in England and Wales.
OUP Oxford.
Bertrand, M., Duflo, E., & Mullainathan, S. (2002). How much should we trust differences-in-
differences estimates? (No. w8841). National Bureau of Economic Research.
Boccanfuso, D., Estache, A., & Savard, L. (2005). A poverty and inequality assessment of
liberalization of water utility in Senegal: A macro-micro analysis. Cahier de
recherche/Working paper, 05-13.
Borraz, F., Pampillón, N. G., & Olarreaga, M. (2013). Water nationalization and service
quality. The World Bank Economic Review, 27(3), 389-412.
Cameron, A. C., & Miller, D. L. (2015). A practitioner’s guide to cluster-robust
inference. Journal of Human Resources, 50(2), 317-372.
Carrillo, P. E., Bellettini, O., & Coombs, E. (2007). Stay Public or Go Private?: A Comparative
Analysis of Water Services between Quito and Guayaquil.
Clarke, G. R., Kosec, K., & Wallsten, S. (2009). Has private participation in water and sewerage
improved coverage? Empirical evidence from Latin America. Journal of International
Development, 21(3), 327-361.
58
De Oliveira, A. R. (2008). Private Provision of Water Service in Brazil: Impacts on Access and
Affordability.
Estache, A., & Grifell-Tatjé, E. (2011). Assessing the impact of Mali's water privatization across
stakeholders.
Estache, A., & Rossi, M. A. (2002). How different is the efficiency of public and private water
companies in Asia?. The World Bank Economic Review, 16(1), 139-148.
Galiani, S., Gertler, P., & Schargrodsky, E. (2005). Water for life: The impact of the
privatization of water services on child mortality. Journal of political economy, 113(1),
83-120.
Gruber, J. (2004). Public finance and public policy. Macmillan.
Kirkpatrick, C., Parker, D., & Zhang, Y. F. (2006). State versus private sector provision of water
services in Africa: an empirical analysis. The World bank economic review, 20(1), 143-
163.
Lee, C. (2011). Privatization, water access and affordability: Evidence from Malaysian
household expenditure data. Economic Modelling, 28(5), 2121-2128.
Remler, D. K., & Van Ryzin, G. G. (2010). Research methods in practice: Strategies for
description and causation. Sage Publications.
Roth, G., & Banque internationale pour la reconstruction et le développement. (1987). The
private provision of public services in developing countries. Oxford: Oxford University
Press.

59
Mallick, J. (2011). DETERMINANTS OF PRIVATE INVESTMENT IN INDIAN STATES:
AN APPLICATION OF PANEL FIXED EFFECT MODEL. Indian Journal of
Economics & Business, 10(1).
Mallick, J. (2013). Private investment in India: regional patterns and determinants. The Annals of
Regional Science, 51(2), 515-536.
Marin, P. (2009). Public Private Partnerships for Urban Water Utilities: a review of experiences
in developing countries (Vol. 8). World Bank Publications.
Wang, H., Wu, W., & Zheng, S. (2011). An econometric analysis of private sector participation
in China’s urban water supply. Utilities Policy, 19(3), 134-141.
Water and Sanitation Program. (2011). Trends in Private Sector Participation in the Indian
Water Sector: A Critical Review. World Bank Publications.
WHO/UNICEF Joint Water Supply, & Sanitation Monitoring Programme. World Health
Organization. Available at: https://www.wssinfo.org/definitions-methods/watsan-
categories/ (Last accessed on April 11, 2017)
UNESCO. UEPA/APS. USAID. UNICEF. DHS EdDATA. (2004). Guide to the Analysis and
Use of Household Survey and Census Education Data. Available at:
http://www.uis.unesco.org/Library/Documents/hhsguide04-en.pdf
Recommended