Shelley Peers
PrimaryConnections:
linking science with literacy
South Africa IBSE Conference 11-13 May 2010
Project Director,
PrimaryConnections
Shelley Peers

2
Overview
• What are the underpinning philosophies of PrimaryConnections?
• Project design
• Professional learning design
• Curriculum resources design
• Is Primary Connections making a difference?

3
What is inquiry-based science education?
• Scientific inquiry can be defined as an attempt to develop explanations
about the natural world by using evidence and logic.
(American Assn for the Advancement of Science)
• While inquiry teaching is being recommended, a major dilemma that
has arisen is the lack of clear definition for classroom teachers.
(Newman et al 2004)
Seed and branch

4
Purpose: Increase the quality and quantity of
science teaching and learning in
primary schools
Vision: Engaged students
– Confident and competent teachers
PrimaryConnections

5
Professional
learning program
Complimented by
curriculum resources
What is PrimaryConnections?
- a multi-pronged IBSE approach
Based on research
PrimaryConnections - a way of thinking about teaching and learning in science

6
“…any serious attempt to support
teachers implementing a significant
science curriculum initiative in Australia
would need to encompass both resource
development, and a significant
professional learning approach that
allowed local control and contextual
variation, that attended to teacher beliefs,
and was supported in local areas through
networks and consultants.”
Tytler, R., 2006, p62
Supporting teachers

7
The nature of school science
8 key elements for quality school science:
• Scientific methods and critical testing
• The role of creativity in science
• Historical development of scientific knowledge
• Science and questioning
• The diversity of scientific thinking
• The relationship between science and certainty
• The role of hypothesis and prediction
• The role of competition and collaboration
ie explore how science works
(Osborne, J. F.,Radcliffe, M., Collins, S., Millar, R. & Duschill, R., 2003)

8
5 underpinning principles:
• 5Es teaching and learning model
• embedded assessment
• linking science with literacy and numeracy
• student-planned investigations
• cooperative learning
using argumentation pedagogy
(Australian Academy of Science, 2005)
The PrimaryConnections inquiry approach

9
Engage „PROE‟
• Predict
• Reason
• Observe
• Explain

10
1. PrimaryConnections 5Es framework
Phase Focus
ENGAGE Engage students and elicit prior knowledge
Diagnostic assessment
EXPLORE Provide hands-on experience of the phenomenon
Formative assessment
EXPLAIN Develop scientific explanations for observations and represent developing conceptual
understanding. Consider current scientific explanations
Formative assessment
ELABORATE Extend understanding to a new context or make connections to additional concepts
through a student-planned investigation
Summative assessment of the investigating outcomes
EVALUATE Students re-represent their understanding and reflect on their learning journey and
teachers collect evidence about the achievement of outcomes
Summative assessment of the conceptual outcomes
EXPLORE before EXPLAIN!


12
2. Embedded assessment
Assess what?Do we assess what we value?
• Science as conceptual understanding
• Science as a human endeavour
• Science as inquiry
• „Literacies of science‟
• Science attitudes
Assessment types
• diagnostic
• formative
• summative
„Scientific literacy‟?
Assessment „for‟ learning
Assessment „of‟ learning
Assessment „as‟ learning

13

14
If I had to reduce all of educational psychology to just one principle, I
would say this: The most important single factor influencing learning is
what the learner already knows. Ascertain this and teach him (sic)
accordingly. (Ausubel, 1968, p. iv)
How ascertain what students think?

15
3. Linking science with literacy
Language is not simply part of science, but an „essential constitutive element‟.
[Norris and Phillips 2003]
The construction of argument and it‟s critical evaluation, are discursive
activities which are central to science, and central to
the learning of science.
[Osborne, J. ACER 2006, p2]

16
Measuring and recording observations of
broad bean seed germination in a science
journal
Creating a labelled diagram to
represent understanding of parts of
a germinating broad bean seed
Science and literacy –a mutually supportive relationship

17
PrimaryConnections ‘literacies of science’
particular language practices, processes and
products that students learn about and use to reason,
represent and communicate their understanding of
science concepts and processes.
(Australian Academy of Science, 2005)
Linking science with literacy
eg drawings, labelled diagrams, tables, graphs,
timelines, word walls, role plays, science journals,
posters, oral presentations, factual recounts,
procedural texts, summaries, flow charts…

18
- Students use their everyday literacies to learn
the „literacies of science‟.
- Literacy skills don‟t develop in isolation from a context.
- Science provides an authentic, meaningful context for
literacy (and numeracy) learning.
Linking science with literacy


20
What we think
we know
What we want
to learn
What we learned How we know
TWLH chart – inquiry ‘literacy focus’
Impacts on:
• intellectual engagement
• conceptual development
T W L H
PrimaryConnections Design feature

21
Linking literacy with science
• Literacy practices are needed to engage with science ideas
• Students use representations [literacies of science] to reason and think
• Re-representation of ideas allows students and the teacher to monitor student learning and give feedback to enhance learning
• multi-modal representations of understanding include:
- text, tables, graphs, models, drawings, and - embodied forms such as gesture and role play
• If students‟ representational competence is taken seriously,there is a need to re-consider assessment (Prain, 2009, personal conversation).
- and the alignment of assessment and instructional design.

22
4. InvestigatingPlanning
Communicating
Evaluating
Conducting
Interpreting and
representing


24
What is argumentation?• articulating and communicating
understanding
• testing ideas in a community
• giving and receiving feedback
• evaluating and reaching consensus.
Duschl, R., Schweingruber. H., & Shouse, A. (Eds.). (2007).
Taking science to school: learning and teaching science in
grades K-8. Washington D.C.: The National Academies Press.
School frameworks:
• Claims
• Evidence
• Reasoning

25
Why argumentation?
Students typically:
• discount the data that they have collected
if the data contradict their current thinking
regarding their prediction or outcome of
their investigation
• provide explanations which include
claims with little evidence or justification
drawn from the data that they have
collected or observed
A deep understanding of science content is characterised by the ability to explain
phenomena …by articulating and convincing others of that understanding.
Klentschy, M. (2008). Using science notebooks in elementary classrooms. Virginia: NSTA Press.

26
Importance of Scientific Argumentation
Science is a social process in which scientists debate knowledge claims and continuously refine knowledge based on evidence
Using argumentation pedagogy:
• Changes students‟ image of science
• Enhances students‟ scientific reasoning abilities
• Fosters deeper understanding of important science concepts

27
Why teach science as argument?
Focusing on ideas, evidence and argument has the potential to:
• improve conceptual understanding of science
• enhance ability to reason and think critically
• develop deeper understanding of the nature of beliefs in science
• make the nature of the learning experience more enjoyable
Osborne, J. ACER Conference 2006
- key purposes of school science education
28
Links between teaching and learning
LearningTeaching
After Mia O‟Brien, 2002
Abstract
ideas &
inquiry
Frameworks of
conceptual
understanding
Simple concepts
Facts and information

29
Open questions that inspire scientific thinking
What patterns do you notice?
Why do you think that…….?
What else might have caused…..?
Why do you suppose…….?
How was it different than….?
How can you explain…….?
What evidence do you have?
How will you know if……?
Have you considered…..?
How did you decide…….?
Do you think you could…..?

30
Continuum for teaching science as argument
Activity
based
Investigation
based
Evidence
based
Argument
based
Zembal-Saul, C. (2009). Learning to teach elementary school science as argument. Science Education, 93(4):687-719.
Fun, hands-on
activities designed
to motivate
students and keep
them physically
engaged
Abilities to engage
in inquiry; ask
testable questions
and design fair
tests; focus on
collecting data
Need to support
claims with
evidence; evidence
is not questioned
in terms of quality,
coherence etc
Argument
construction
is central;
coordinating
evidence and
claims is viewed
as important;
emerging attention
to considering
alternatives.

31
Claim thinker
Reviews question,
predictions and claim/s
What was your question?
What was your prediction?
What is your claim now?
Evidence thinker
Summarises results, reviews
their representation, examines
link between claims and
evidence
What is your evidence?
Does the evidence support your
prediction?
Why did you choose to show your
results in that way?
Sceptic thinker
Explores other ideas and
explanations for results, asks
questions, seeks others ideas,
establishes resulting questions for
investigation
What problems did you have?
Is there another explanation
for what happened?
What do you think you could
have done better?
Thinkers’ roles


33
33
Incorporating Indigenous perspectives
The PrimaryConnections Indigenous Perspectives
framework is designed to support teachers to link
science, literacy and Indigenous perspectives.
www.science.org.au/primaryconnections/indigenous/

34
Incorporating Indigenous perspectives
- in 16 of 19 units

35
Kennedy Primary School pilot (Western Australia)
Term 4, 2007

36
Project design
Rationale for Project
• Constructivist theories and inquiry-based approaches
• The most effective way to implement reform is to enable all current (and pre-
service) teachers
• The approach must be achievable in a primary classroom by novice teacher
• PrimaryConnections is a way of thinking about teaching and learning science –
it is an approach, not just a set of books or a set of workshops.
Design principles for Project
• reform orientation
• focus on the teacher
• scalable – able to have large scale uptake
• sustainable
• based on research
Design features for Project
• 2 pronged approach – Professional learning and curriculum resources
• informed by ongoing trialling and evaluation

37
Professional Learning Design
Underpinning philosophies for professional learning
• Constructivist theories
• Positive approach – not a deficit model
Design principles for professional learning
• Not one-off workshops but a program to build competence - PCK
• Informed by pedagogical principles
• Takes account of the stages of concern for teachers implementing an innovation
• Based on research
Design features for professional learning
• variety of staged professional learning training
• x 24 Facilitation Tools and techniques
• a resource of a series of prepared workshops
that can be tailored to context by facilitators
• Provide ppt slides on CD
• Informed by ongoing trialling and evaluation

38
Professional learning model
Professional learning resources
[manual, powerpoints, DVD, on-line learning support]
(Peers, 2009)
Curriculum resources
[units, CD of science info, assessment rubrics, DVD, digital pedagogies]
Train 45 Master Facilitators
Train University educators
Train Curriculum leaders
(2 days training)
Train professional learning
facilitators (3 days training)
Trainers conduct workshops for
pre- and in-service teachers

39
Building confidence and competence
Trained leaders 2006 - 2010:
125 University lecturers
(ie Tertiary Facilitators)(2 days training)
Over 1000 Teacher leaders(2 days training)
500 Facilitators(3 days training)
Over 6,000 workshops conducted by
Academy staff and trained facilitators
Professional learning:

40
Primary science pedagogical content knowledge
• curriculum, outcomes and standards
• science concepts, processes
and the nature of science
• science teaching
and assessment pedagogies
• literacy practices and forms of
representation relating to science
• students and their learning
PCK - Knowledge of:

41
12 segments
• Overview
• Facilitation tools and techniques
• Introduction to Primary Connections
• Science and literacy
• 5Es
• Investigating
• Assessment
• Cooperative learning
• Indigenous perspective
• Unit planning
• Questioning Minds DVD
• Reflecting and journaling
MakingConnections training manual and DVD

42
Curriculum Resource DesignUnderpinning philosophies for Curriculum resources
• Constructivist theories
• Inquiry based investigative approach
• Linking science with literacy
• Primary Connections 5Es teaching and learning model
• Co-operative/collaborative learning
Design principles for Curriculum resources
• Curriculum replacement strategy
• Should be do-able by novice teacher
• Resources teach teachers how to teach science (educative curriculum materials)
• Scalable – suitable for uptake Australia-wide
• Based on research
• Informed by ongoing trialling and evaluation
Design features for Curriculum resources
• Aligns with teacher core business
• Reflects the nature of science
• Builds student capacity for inquiry
• Literacy focuses and „literacies of science‟
• TWLH chart
• Interesting and hands-on activities, Student work samples
• Cross curricular approach to planning, inclusion of curriculum links
• Do-able within one term (10 weeks of instruction)

43
2006
2008
2007
2009
• 19 award winning units
• Background Science CD
in every unit
• Links science with literacy
• Indigenous perspectives
• Supporting web resources:
- Unit overviews
- Assessment rubrics
- Equipment lists
- „How to‟ appendices
Award winning units
Deputy PM Julia Gillard
launches „Schoolyard Safari‟
unit - April 2008
PrimaryConnections Curriculum resources

44
PrimaryConnections Unit Map, March 2010

45
1. Identify desired results
National standards
2. Determine acceptable evidence of learning
Design Evaluate activities
3. Develop learning experiences and activities for
Engage, Explore, Explain, Elaborate
Unit design process
BSCS Backward design

46
1. Identify desired results (learning outcomes)
Mandated national documents
2. Identify possible student alternative conceptions Research literature
3. What pedagogical strategies facilitate conceptual change for the topic?
4. Opportunities for students to represent and re-represent their developing
understanding in the learning journey? „Literacy focuses‟
5. Potential questions for investigation and investigation types
Elaborate, Explore and Engage activities
6. What culminating activity will allow students to show what they know?
Evaluate activities
7. How might scientists explanations be represented? Explain activities
8. Align the outcomes, representational assessment and conceptual
coherence of the unit
PrimaryConnections Unit design process

47
Unit features

48
Unit at a glance
‘Change detectives’

49
Unit outcomes
‘Change detectives’
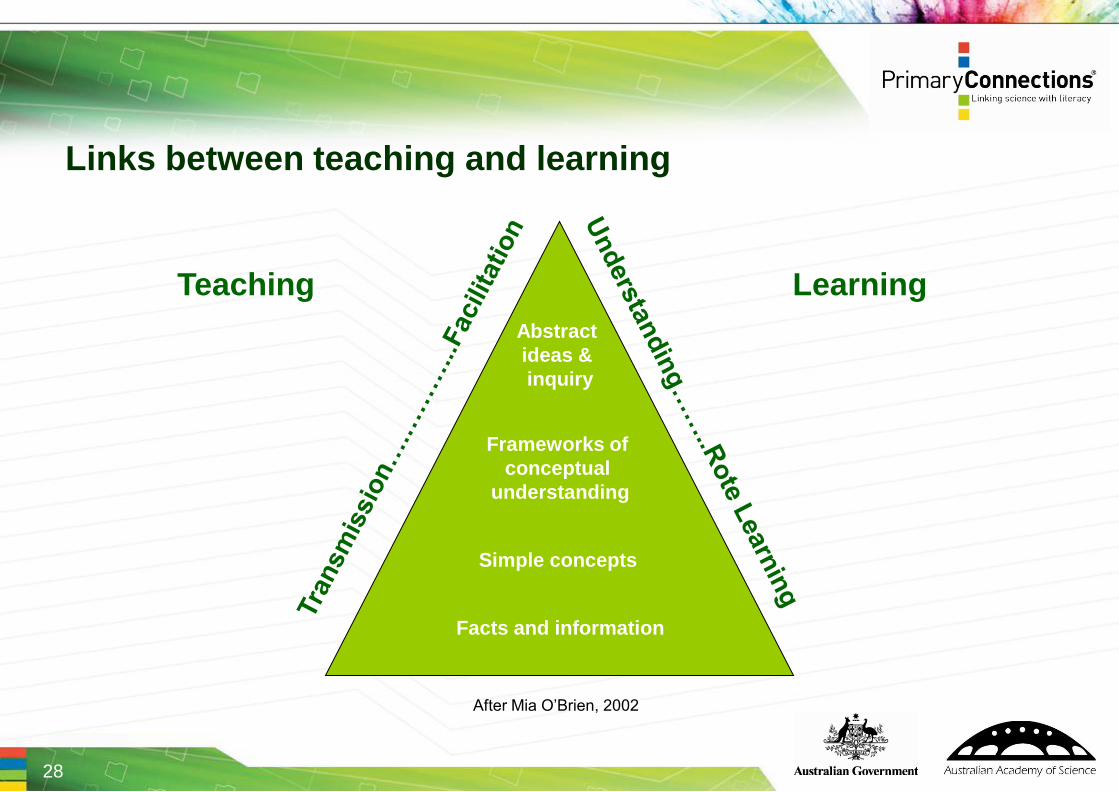
50
Teacher
background
information
‘Change detectives’
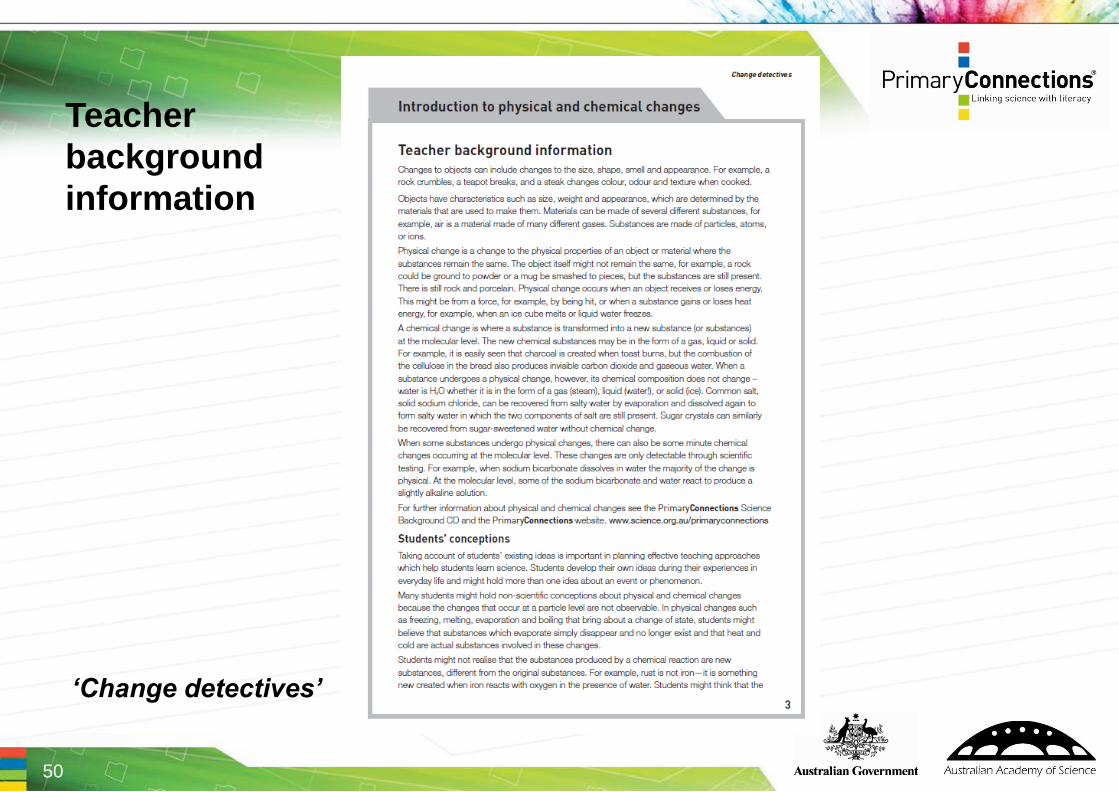
51
Engage
Lesson 1
‘Change detectives’

52
Explore
Lesson 2
‘Change detectives’

53
Investigation
planner
‘Change detectives’

54
Investigation
planner
‘Change detectives’

55
Appendix
How to use a word wall
‘Change detectives’

56
Equipment list
‘Change detectives’

57
AppendixUnit overview
‘Change detectives’

58
PrimaryConnections Assessment rubrics
Plants in action Level 2 and 3 investigating outcomes
Task Students investigate the conditions that affect plant growth.
Investigating unit outcomes Beginning Developing Achieving
Level 2 Identify some variables that can
be investigated.
Students can describe what a
variable is.
Students can identify a variable in the
investigation.
Students can identify a variable in the investigation and
suggest how this variable might affect the outcome of the
investigation.
Make and record observations. Students can make observations. Students can make and share
observations with others.
Students can make, share and record observations.
Investigating unit outcomes Beginning Developing Achieving
Level 3 Show awareness of the need for
fair testing.
Students can identify what makes a
test unfair.
Students can describe what a fair test
is.
Students can describe what a fair test is and explain the
importance of a fair test.
Make predictions. Students can guess what might
happen.
Students can make a prediction. Students can justify a prediction.
Make measurements and
observations.
Students can make observations of
seed germination.
Students can make observations of
seed germination and measure the
growth of seedlings.
Students can make observations of seed germination and
measure the growth of seedlings, describing conditions a
seedling needs to grow.
Display results in simple tables
and graphs or as scientific
diagrams.
Students can record their results of
their investigation in a table.
Students can record their results of
their investigation in a table and
displays results in a simple graph.
Students can record their results of their investigation in a
table and display results in a simple graph or as a
scientific diagram, explaining the difference in plant
growth.
Identify and summarise patterns
in results.
Students can identify patterns in
investigation results.
Students can identify and discuss
patterns in investigation results.
Students can identify, discuss and summarise patterns in
investigation results.

59
What is the evidence of impact?
Trialled by 150 teachers in 56 + schools
• Teachers with low belief in their capacity to teach science decreased from
22 to 1 in two terms.
• 98% said their teaching improved.
• 90% reported that students responded positively or very positively to the
approach.
• 75% believed the quality and amount of science learning was improved.
• Teachers said science provided a meaningful and relevant context for
learning literacy.
• The status of science in the school and the time on teaching improved.
Stage 2 Research (2005)

60
Research - Curriculum Leaders
Research Report 14: Curriculum Leaders Workshops (May 2008)
• Had a large, positive impact on participants‟ confidence as teachers
and self-efficacy as curriculum leaders
• Participants shifted to supporting :
– a sophisticated view of inquiry-based pedagogy
– the need for literacy work to be meaningful and purposeful
• Participants‟ evaluations of the workshops were extremely positive

61
Research - students
Research Report 15 (June 2008)
• Is the achievement on literacies of science and science processes
by Primary Connections students greater than that of students from
non-Primary Connections classes in equivalent schools?
Jurisdiction Number of students Number of schools
WA 1113 18
Queensland 354 8
Total 1467 26

62
Students from Primary Connections classes:
• Reported a greater perception of frequency of science lessons
• Were significantly more curious during science lessons
• Were more likely to affirm that they learned interesting things in science
Student attitudes towards science
Research report 15 (2008)

63
Research instruments – Report 15
• Three tasks:
- Draw your thumb task (observation skills and diagrams)
- Rolling balls task (investigative skills)
- Shoe size and length task (graphing and interpreting data)
• Each with 6-9 components that were attributed achievement scores
• Mean achievement scores were calculated for:
- Literacies of science components
- Processes of science components

64
Is there a title?How accurate is the diagram?
Is size indicated?
How muchinformation is there?
Are the labels clear and informative?
Draw your thumb task

65
Draw your thumb task
No information recorded 0
Simple representation of thumb 1
Provides extended representation 2
How accurate is the diagram?
How much information is there?
No information recorded 0
Simple representation of thumb 1
Provides extended representation 2
PC* Non PC*
49% 25%
PC* Non PC*
31% 21%
*Year 5, 6 and 7 students
Scoring rubrics

66
Rolling balls task

67
1. Identify one thing that you could investigate that might affect how far a ball will roll.
2. What effect do you think this thing would have on how far a ball will roll?
3. Write the question that you would be trying to answer if you did this investigation.
4. For this investigation, complete the table below to show what you would change, measure and
keep the same to make it a fair test.
What I would
change
What I would
measure
What I would keep the same to
make it a fair test
5. In the space below draw a table that you would use to record the results from this investigation.
Is a table created?
Does it allow for repeat trials and averages?
Is an independent variable identified?
Is a prediction made?
Is a question for investigation formulated?
Are the variables identified?
Rolling balls task

68
Other 0
Table has column for IV or DV 1
Table has column for IV and DV 2
Does it allow for repeat trials and averages?
Is a table created?
Other 0
Table allows for repeat trials 1
Table allows for repeat trials and
averages
2
PC* Non PC*
32% 18%
PC* Non PC*
7% 3%
*Year 5, 6 and 7 students
Rolling balls task
Scoring rubrics

69
Means of processes of science scores
for sub-groups of year 5-7 students
Research report 15
** p<.01 for all groups

70
** ** ** ** **** p<.01
Means of literacies of science scores
for sub-groups of year 5-7 students
Research report 15
** p<.01 for all groups

71
PrimaryConnections success indicators
• improved student learning outcomes in science
• improved student learning outcomes in
the „literacies of science‟
• enhanced teacher self-efficacy and confidence in
teaching science and literacy
• increased teaching time for science
• an enhanced profile for the teaching of science in
Australian primary schools.Project Brief

72
Total Unit Distribution by Period
-
50,000
100,000
150,000
200,000
250,000
300,000
Febr
uary 200
6
Apr
il 20
06
June
200
6
Aug
ust 2
006
Octob
er 200
6
Dec
embe
r 20
06
Febr
uary 200
7
Apr
il 20
07
June
200
7
Aug
ust 2
007
Octob
er 200
7
Dec
embe
r 20
07
Febr
uary 200
8
Apr
il 20
08
June
200
8
Aug
ust 2
008
Octob
er 200
8
Dec
embe
r 20
08
Febr
uary 200
9
Apr
il 20
09
Jun-09
Aug
-09
Oct-09
Dec
-09
Feb-
10
Apr
-10
Distribution Period
Un
it D
istr
ibu
tio
n V
olu
me
TOTAL:
278,241
PrimaryConnections unit distribution
53% of Australian schools
278,241 units
distributed in
4 years

73
PrimaryConnections
- a collaborative project
• Steering committee:
- Australian Academy of Science and DEEWR
• Reference Group:
– Australian Academy of Science
– Department of Education, Employment and Workplace Relations
– Universities - Australian Council of Deans of Education
– Literacy, English and Science Educator Associations
– State Education Departments
– Catholic and Independent Schools Associations
– Australian Primary Principals Association
74
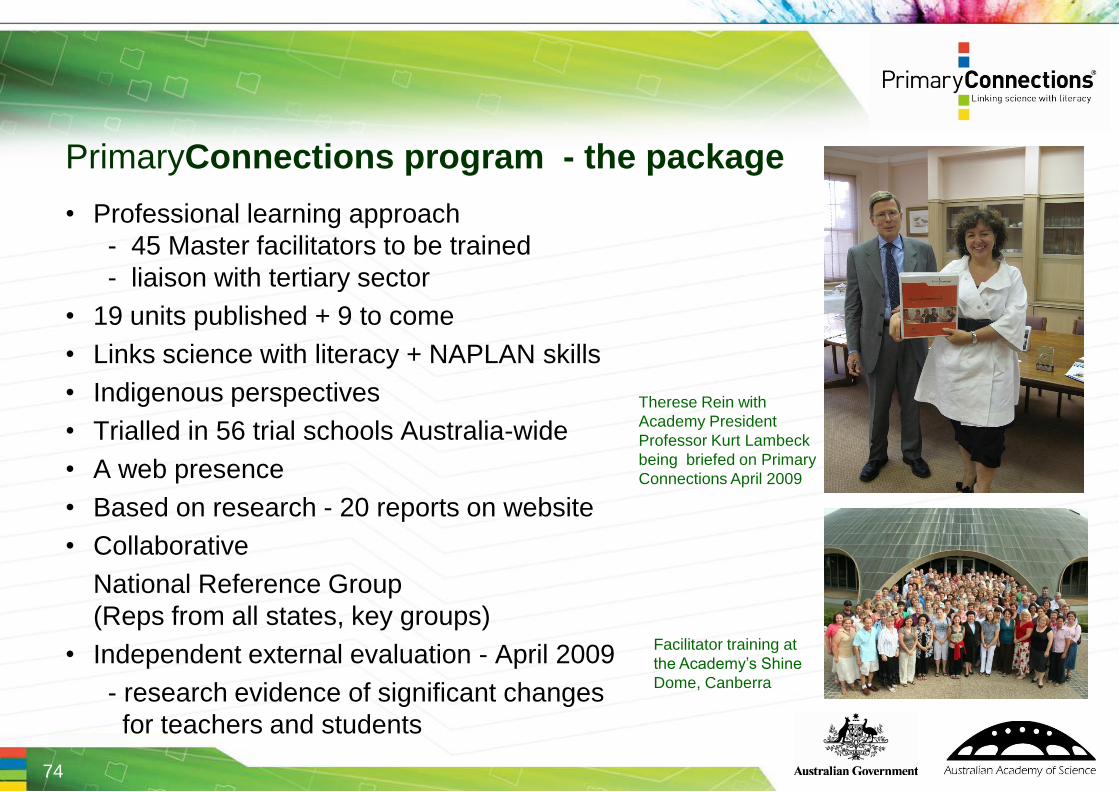
PrimaryConnections program - the package
• Professional learning approach
- 45 Master facilitators to be trained
- liaison with tertiary sector
• 19 units published + 9 to come
• Links science with literacy + NAPLAN skills
• Indigenous perspectives
• Trialled in 56 trial schools Australia-wide
• A web presence
• Based on research - 20 reports on website
• Collaborative
National Reference Group
(Reps from all states, key groups)
• Independent external evaluation - April 2009
- research evidence of significant changes
for teachers and students
Therese Rein with
Academy President
Professor Kurt Lambeck
being briefed on Primary
Connections April 2009
Facilitator training at
the Academy‟s Shine
Dome, Canberra

75
There is much excitement
and enthusiasm around
the school this term… it is
all a buzz with science
I had children walking
out saying that science
was fun, interesting and
even their ‘favourite
subject’.
It gave me renewed
skills as a teacher
Thanks to the workshops I was
able to teach science to primary
age students in an engaging
and meaningful way.
This has been the most
invigorating and rewarding
project I have been involved in.
I now feel I can actually teach
science in a quality way …
and enjoy doing it
www.science.org.au/primary connections/

76
Primary Curriculum time/week
Learning area Minutes/week
English 564
Maths 263
Science 45
Total time /week 1486
Science - 2.7% of teaching time
(Angus et al, 2007)

77
The draft Australian Curriculum: Science
The draft Australian Curriculum: Science
- organised around three interrelated strands:
• Science as a Human Endeavour (SHE)
• Science Inquiry Skills (SIS)
• Science Understanding (SU)
Each strand is of equal importance (ACARA, March 2010).


82
Unit Distribution by State and Period
-
10,000
20,000
30,000
40,000
50,000
60,000
70,000
80,000
90,000
Febru
ary 20
06
April 20
06
June
200
6
Augus
t 2006
Octob
er 2006
Dec
embe
r 200
6
Febru
ary 20
07
April 20
07
June
200
7
Augus
t 2007
Octob
er 2007
Dec
embe
r 200
7
Febru
ary 20
08
April 20
08
June
200
8
Augus
t 2008
Octob
er 2008
Dec
embe
r 200
8
Febru
ary 20
09
April 20
09
Jun-
09
Aug-0
9
Oct-0
9
Dec
-09
Feb-1
0
Apr-1
0
Distribution Period
Un
it D
istr
ibu
tio
n V
olu
me
SA
QLD
WA
NSW
VIC
TAS
NT
ACT
International
Unit distribution by state
TOTAL: over 278,000 units distributed

83
What is science?
What is school science?
What is primary school science education?
Draft Australian Curriculum: Science
Curriculum intent
Teaching and Learning
Students and Teachers
Overview


85
Year K - 6 content descriptions –
Science as a Human endeavour
• Nature of science
• Influence of science
• Everyday science
• Science in the community
• Collaboration in science
• Contribution of scientists
• Science and culture

86
Science as a Human Endeavour – nature of science

87
Science as a Human Endeavour – nature of science

88
Science as a Human Endeavour –Year 5/6
1. Nature of science
Science ideas and understandings
change as new evidence becomes
available
Claim 1: If all of the cane toads were removed from Australia the environment would go back to what it was before they arrived.
Agree Disagree Unsure
[„Life in the balance‟ Year 6 trial unit 2010]

89
Science as a Human Endeavour –Year 5/6
4. Contribution of scientists
Australian scientists have made a
significant contribution to scientific
understanding in various fields of
human endeavour
[„Life in the balance‟ Year 6 trial unit 2010]
90
Science as a Human Endeavour –Year 5/6
5. Science and culture
Science and culture interact to influence
personal and community choices
http://player.sbs.com.au/naca/#/naca/living_black/Latest/playlist/Toad-Rage
[„Life in the balance‟ Year 6 trial unit 2010]

91
Science Inquiry Skills
posing questions, planning, conducting and
critiquing investigations, collecting, analysing and
interpreting evidence and communicating findings.
This strand is concerned with:
evaluating claims, investigating ideas and solving problems,
making valid conclusions and developing evidence-based arguments.
It also recognises that:
scientific explanations change as
new or different evidence becomes available.[ACARA draft consultation version, p4]
These involve:

92
Why teach science as argument?
„Student learning from hands-on investigation is dramatically improved when they present their ideas and arguments about investigations to their peers.
Debating with peers can help make scientific tasks more meaningful, lead to more productive and conceptually rich classroom dialogue, and improve conceptual mastery.‟
Duschl, R., Schweingruber. H., & Shouse, A. (Eds.). (2007).
Taking science to school: learning and teaching science
in grades K-8. Washington D.C.: The National Academies Press.


94
Recommended