Pricing Carbon into NYISO’s Wholesale Energy Market to Support New York’s Decarbonization Goals
PREPARED FOR
PREPARED BY
Samuel A. Newell
Roger Lueken
Jürgen Weiss
Kathleen Spees
Pearl Donohoo-Vallett
Tony Lee
August 10, 2017

1 | brattle.com
This report was prepared for the New York Independent System Operator. All results and any
errors are the responsibility of the authors and do not represent the opinion of The Brattle Group
or its clients.
Acknowledgement: We acknowledge the valuable contributions of many individuals to this
report and to the underlying analysis, including members of The Brattle Group for peer review.
Copyright © 2017 The New York Independent System Operator
i | brattle.com
Table of Contents Executive Summary ............................................................................................................................. iv
Context ........................................................................................................................................ iv
Problem Statement ...................................................................................................................... v
Approach ..................................................................................................................................... vi
Estimated Customer Cost Impacts ........................................................................................... viii
Market Design Considerations ................................................................................................... ix
Conclusions and Next Steps ....................................................................................................... xi
I. Motivation and Policy Context .................................................................................................. 1
II. Economic and Policy Framework .............................................................................................. 3
A. The Environmental Externality ........................................................................................ 3
B. Spectrum of Approaches for Addressing the Externality ................................................ 4
C. How New York’s Decarbonization Interacts with Regional Efforts ............................... 6
III. Lessons Learned from Other Jurisdictions ................................................................................. 9
A. Ontario’s Deep Decarbonization ....................................................................................... 9
B. California Cap-and-Trade Program................................................................................. 12
C. United Kingdom ............................................................................................................... 15
D. NEPOOL’s “Integrating Markets and Public Policy” Initiative ..................................... 17
IV. Options for Pricing Carbon into NYISO’s Wholesale Energy Market ................................... 18
A. Carbon Charges Applied to Commitment and Dispatch ............................................... 19
B. New York-Only Cap-and-Trade ..................................................................................... 19
C. Tighten the RGGI Cap ..................................................................................................... 20
V. Market Design Issues with a Carbon Charge ........................................................................... 21
A. Establishing the Appropriate Carbon Price and Adjustments Over Time .................... 21
B. Returning Charges to Customers .................................................................................... 22
C. Preventing Emissions Leakage to Neighboring Energy Markets ................................... 23
1. Preventing Leakage from Imports ......................................................................... 23
2. Preventing Leakage from Exports .......................................................................... 25
3. Other Types of Leakage .......................................................................................... 26
D. Distributed Resources and REV ...................................................................................... 26
E. Interactions with Other Design Elements and Processes in NYISO ............................. 27
F. Interactions with Renewable Energy Credits ................................................................. 28
G. Whether to Include Upstream Emissions ....................................................................... 29

ii | brattle.com
VI. Benefits of Pricing Carbon into the Wholesale Energy Market ............................................. 30
A. Shifting Commitment and Dispatch ............................................................................... 31
B. Tilting Investment in Renewable Resources Toward Those with Greater
Abatement Rates .............................................................................................................. 31
C. Supporting Investment in Combined-Cycle Generation (CCs) ..................................... 32
D. Incorporating Storage and Demand Response ................................................................ 34
E. Incentivizing Energy Efficiency and Conservation ....................................................... 36
F. Spurring Other Innovative and Idiosyncratic Opportunities ........................................ 37
G. Resulting Impacts on Economic Efficiency .................................................................... 37
VII. Impact on Customer Costs ........................................................................................................ 38
A. Key Assumptions about 2025 .......................................................................................... 40
1. Supply and Demand ................................................................................................ 40
2. Wholesale Electricity Prices .................................................................................. 40
3. Annual Carbon Emissions and Marginal Emissions Rates .................................... 41
B. Static Analysis of Energy-Related Cost Impacts of a Carbon Charge ........................... 42
1. Increase in Wholesale Energy Prices ..................................................................... 43
2. Refund of Carbon Revenues to Customers ............................................................ 43
3. Lower ZEC Prices ................................................................................................... 44
4. Lower REC Prices ................................................................................................... 45
5. Increased TCC Value .............................................................................................. 47
6. Energy Revenue Flow Schematic .......................................................................... 48
C. Adjustments to Static Cost Analysis due to the Entry of CCs ....................................... 49
D. Carbon-Price-Induced Abatement .................................................................................. 50
E. Net Impacts on Customer Costs ...................................................................................... 51
F. Uncertainty Analysis ........................................................................................................ 52
G. Effect on Generator Revenues ......................................................................................... 57
H. Upstate Equilibrium Marginal Emissions Rate ............................................................... 57
1. Long-Run Equilibrium between Upstate and Downstate Additions ................... 58
2. Long-Run Equilibrium Considering Transmission Upgrades .............................. 60
VIII. Conclusions and Next Steps ...................................................................................................... 61
List of Acronyms ................................................................................................................................. 63
Bibliography ........................................................................................................................................ 65

iii | brattle.com
Table of Figures Figure 1 New York CO2e Emissions by Sector, 1990–2013 ................................................................ 2
Figure 2 Historical NYISO Fossil CO2 Emissions by Generator Type ................................................ 2
Figure 3 Spectrum of Approaches for Addressing the Carbon Externality ....................................... 4
Figure 4 RGGI Binding with Price Less than NY Abatement Cost ................................................... 7
Figure 5 RGGI and Eastern Interconnect (EI) CO2 Emission Reductions (2017–2031) ................... 9
Figure 6 Hourly Ontario Energy Price .............................................................................................. 11
Figure 7 Regional Economy-wide Carbon Reduction Goals ............................................................ 21
Figure 8 Share of 2015 Emissions Avoided If All NY Steam & CT Generation Replaced with
Gas CCs ...................................................................................................................................... 35
Figure 9 Estimated Customer Cost Impact of a $40/ton Carbon Charge in 2025 under the
Assumptions Made, Compared to Existing Policies Alone ..................................................... 39
Figure 10 Illustration of Revenue Flows among Suppliers and Customers ..................................... 49
Figure 11 Estimated Customer Cost Impact of $40/ton Carbon Charge in 2025, by Zone
($/MWh) .................................................................................................................................... 52
Figure 12 Impact of a $40/ton Carbon Charge on Customer Costs (¢/kWh) Effect of Major
Sources of Uncertainty .............................................................................................................. 53
Figure 13 Effect of a $40/ton Carbon Charge on Generator Revenues ............................................ 57
Figure 14 2016 Upstate Average vs. Marginal Fuel Mix ................................................................... 58
Figure 15 Relative Cost of Reducing Emissions with Upstate and Downstate Wind ..................... 60

iv | brattle.com
Executive Summary
At the request of its stakeholders, the New York Independent System Operator (NYISO)
commissioned The Brattle Group in August 2016 to explore whether and how New York State
environmental policies may be pursued within the existing wholesale market structure. In
developing its analysis, Brattle received valuable input from the NYISO, the New York
Department of Public Service (DPS), and stakeholders. The resulting report, presented here,
considers that input but solely reflects the opinions of its authors. This report is intended to
provide a first step in a discussion on how to harmonize state policy and wholesale markets in
New York.
CONTEXT
New York’s State Energy Plan (SEP) calls for reducing state economy-wide greenhouse gas
emissions 40% by 2030 and 80% by 2050, relative to 1990 levels. The Plan also calls for
generating 50% of electricity from renewable sources by 2030 to help meet that goal.
The Clean Energy Standard (CES) adopts those goals and establishes mandates and mechanisms
for meeting them in the electricity sector. Most notably, the CES provides for the procurement of
Renewable Energy Credits (RECs) to attract investment in new renewable generation and the
procurement of Zero-Emissions Credits (ZECs) to retain existing nuclear generation. The CES
characterizes these measures “as part of a strategy to reduce statewide greenhouse gas (GHG)
emissions 40% by 2030.”1 These measures complement numerous other state policies that reduce
electric-sector greenhouse gas emissions, including energy efficiency programs, the Reforming
the Energy Vision (REV) strategy, and participation in the Regional Greenhouse Gas Initiative
(RGGI).
To help decarbonize the transportation, commercial, residential, and industrial sectors, New
York has energy efficiency programs and other policies, although nothing as extensive as the
CES. Decarbonizing these sectors enough to accomplish economy-wide goals will likely require
significant electrification and disproportionate emissions reductions in the electricity sector by
2030. The electricity sector may have to decarbonize more deeply than the CES currently
contemplates, especially on a percentage-of-load basis.
New York recognizes that decarbonization is valuable but not without cost. The state’s
commitment to reducing carbon emissions in the electricity sector is expressed monetarily in its
ZEC payments to Upstate nuclear plants. ZEC payments reflect the New York Public Service
Commission’s (NYPSC’s) adoption of the Social Cost of Carbon (SCC) as estimated by the U.S.
Interagency Working Group on the Social Cost of Carbon, starting at $43/ton CO2 today and
rising to $65/ton by 2029.1 Similarly, the NYPSC recently issued an order to value the
1 See NYPSC (2016a), pp. 49, 51, and 131, and U.S. Government (2015).

v | brattle.com
environmental benefits of some distributed energy resources (DERs) at the higher of the Tier 1
REC price or the SCC.2,3
PROBLEM STATEMENT
Presently, the wholesale electricity markets operated by NYISO are not aligned with the state’s
decarbonization objective. The wholesale markets are designed to provide electricity reliably and
cost effectively, but the costs considered in the markets do not include the cost of carbon
emissions—except as conveyed through the RGGI price, which is currently quite low. By not
internalizing the environmental costs, the markets are not aligned with New York’s carbon
reduction targets. This inconsistency is growing as carbon policy objectives become more
ambitious.
Harmonizing state goals and the operation of wholesale electricity markets could leverage
market forces to more efficiently meet both state goals and traditional electric system goals of
providing affordable, reliable supply. This report focuses on the wholesale market for electric
energy, not capacity, because energy production is the cause of emissions. The capacity market
only addresses the adequacy of total supply to keep the lights on during the few hours of the year
with highest demand, so it is not the appropriate venue to try to achieve clean energy objectives.
An obvious way to harmonize wholesale electricity markets with decarbonization goals is
through carbon pricing. This is already done through the existing RGGI program, but at carbon
price levels that are too low to support New York’s objectives. NYISO could incorporate a higher
carbon price into its energy market by adding a charge to resources’ costs based on their
emissions rate and a price-per-ton established by the NYPSC. These charges would affect unit
commitment, dispatch, and settlement. Locational Based Marginal Prices (LBMPs) would
increase according to the emissions rate of the marginal, price-setting resources (the “marginal
emissions rate” or “MER”). NYISO would pay each generator the LBMP minus its individual
carbon charge and then distribute carbon revenues to load-serving entities (LSEs), which our
analysis assumes would be returned to customers. In addition, NYISO would assess emissions-
based charges on electric energy imported into the state.
Higher carbon prices would incentivize competition from low-cost sources of carbon abatement
and consequently reduce the total economic cost of meeting New York’s decarbonization goals.
Carbon pricing would invite a broader, more competitive range of solutions than targeted
procurements under the CES alone. Higher carbon prices would provide a stronger market signal
than current RGGI prices and reward efficiency improvements across the fossil fleet, incentivize
conservation and energy efficiency, encourage storage and other technologies that can reduce
emissions, and lead to other market responses that are difficult to predict. More explicit carbon
2 See NYPSC (2017), p. 15.
3 “Tier 1” is defined as all new Main Tier RPS-eligible resources with an in-service date on or after
January 1, 2015. Main Tier eligible resource categories include biogas, biomass, liquid biofuels, fuel
cells, hydroelectric, solar, tidal/ocean, and wind. See NYPSC (2016a), p. 105.

vi | brattle.com
pricing would make REC procurements more effective by sharpening the rewards for clean
energy produced at times and locations that reduce emissions the most, potentially achieving
more carbon abatement from the same quantity of procured RECs. It could tilt any new
investment in traditional generation toward the lowest-emitting technologies. It could also help
support the Upstate nuclear fleet—New York’s largest sources of carbon-free generation—after
the ZEC program expires, if nuclear plants are more economical than other clean resources.
As a result of these factors, carbon pricing would likely reduce the total economic cost of
meeting New York’s decarbonization goals relative to current approaches targeting a narrower
set of solutions. However, a basic question is how a policy that improves overall economic
efficiency shares the economic gains between consumers and producers. Would it merely burden
consumers with increased LBMPs, while enriching clean generators? Or would returned carbon
revenues and other effects allow consumers to share in the economic gains?
The purpose of this study is therefore twofold: (1) to assess market design options for a carbon
charge, informed by other jurisdictions that have implemented carbon pricing or have pursued
decarbonization in other ways; and (2) to estimate how a carbon charge would affect customer
costs in New York. We assume the carbon charge is designed to complement (rather than
replace) the CES and other existing policies that contribute to decarbonization.
APPROACH
To provide a starting point for discussions between NYISO, DPS, and stakeholders, we conducted
a high-level analysis of the impacts of a carbon charge. We analyzed a snapshot of the NYISO
market in 2025 using a spreadsheet model designed to enable testing of a wide range of
assumptions. Our analysis compares New York customer costs and emissions with a carbon
charge to a Base Case without a carbon charge. The Base Case assumes a “business-as-usual” view
of the future with planned changes to the system and with the CES and other established policies
in place. The difference between cases therefore reflects only the effect of supplementing
established clean energy policies with a carbon charge, not the cost of clean energy vs. traditional
energy.
In 2025, generation capacity is expected to be broadly similar to today’s, with the Indian Point
nuclear power plant retired, and with additional new Tier 1 renewable generation built to
replace the loss of carbon-free energy from Indian Point, and 1,750 MW of planned new gas-
fired combined cycle plants. With these changes in generation capacity and with slightly lower
forecast load, fossil generation output is projected to be 8% lower than in 2015. Our 2025 Base
Case has 14% lower internal fossil emissions than 2015 and slightly lower hourly marginal
emission rates due to retirements of coal-fired generation. We assume that wholesale energy
prices rise proportionally with natural gas prices, RGGI prices rise to $17/ton with declining
regional caps, and capacity prices increase according to the DPS’s forecast in its study of the
CES.4
4 Some of these forecasts have changed since our analysis was completed.

vii | brattle.com
Starting with these Base Case assumptions, we analyzed the customer cost impact of adding a
$40/ton carbon charge—roughly consistent with the CES’s stated value of carbon for 2025 less
the expected $17/ton RGGI price. We analyze the average cost impacts on customers in each
zone and across all zones.
The analysis has two complementary parts that must be combined to provide a complete picture.
The first part is a typical static analysis of how prices and customer costs change assuming no
adjustments to generation investment or dispatch occur from the Base Case, and with hourly
marginal emission rates based on 2015 data. The second part is a dynamic analysis of adjustments
to the static analysis. The dynamic analysis accounts for how a carbon charge may incentivize
investments and generation and consumption patterns that reduce carbon emissions.
In the static analysis, the carbon charge increases clearing prices for wholesale energy according
to the emissions rate of the marginal, price-setting resources in the market, which we estimate
using 2015 data. The cost of higher wholesale energy prices is partially offset by carbon revenues
collected from internal fossil generation and imported energy that we assume are returned to
customers via their LSEs.5 Customers see additional offsets from Tier 1 REC and ZEC prices
falling in response to the higher wholesale energy prices, as well as a slight increase in the value
of transmission congestion contracts (TCCs) as carbon prices translate an Upstate-Downstate
emissions differential into a greater price differential.
The dynamic analysis assumes several plausible impacts to operations and investment.
Investment in CCs may increase marginally as carbon prices reward displacing the output of
existing fossil generation that is less efficient and higher-emitting (for example, by repowering
some of the highest-emitting aging capacity). Indeed, the static analysis indicates that a $40/ton
carbon charge would increase CCs’ net energy revenues by roughly $21-34/kW-yr, depending on
the location. But if new CCs were at economic equilibrium without a carbon charge, this
additional revenue would attract more entry by CCs until wholesale energy and capacity prices
re-equilibrated at a lower level than indicated by the static analysis (static analyses generally
overstate price impacts because they do not include the effects of market responses). The
increased investment in CCs would also reduce overall emissions as it displaces generation by less
efficient fossil resources, and it does so without crowding out investment in even cleaner
renewable resources (the quantity of which is determined by the CES).
In addition, a carbon charge would further reduce emissions by attracting better-sited and more
effective types of renewable generation for offsetting carbon emissions, and by incentivizing
energy efficiency, demand response, and storage. Such carbon-price-induced emission
reductions—beyond those achieved by the CES and RGGI alone—could help New York meet its
economy-wide decarbonization goals at a lower cost to customers by reducing the quantity of
RECs needed to achieve a given amount of decarbonization. These effects are difficult to
5 Our base analysis applies New York Control Area’s (NYCA’s) marginal emission rates to all imports
and no emissions on internal generation providing exports, as discussed below. We consider
differentiated rates among neighbors in an alternative case.

viii | brattle.com
anticipate, but we made plausible assumptions about magnitudes to provide an indicative
analysis.
We estimate that the carbon price would reduce CO2 emissions by 2.6 million tons per year (8%
of today’s emissions) by incentivizing cost-effective market responses not available through the
CES and RGGI alone. This estimate of CO2 emission reduction is probably conservatively low
because it does not yet account for the potential redispatch of existing resources, nor does it
include innovative responses that the market might elicit but that we have not imagined.
However, the benefits could also be lower, as the dynamic analysis is inherently assumption-
driven and uncertain and assumes no incremental emissions leakage to other geographies or
sectors. We examine the implications of uncertainties in our sensitivity analyses.
Although the incremental emissions reductions induced by a carbon charge could be used to
produce greater environmental benefit, they could alternatively be used to meet a fixed
emissions target at lower cost by replacing costlier carbon abatement measures. For example, if
RECs were being procured beyond the CES targets in order to meet economy-wide carbon
reduction goals, the carbon-charge-induced reductions could avoid buying 6.3 TWh of RECs per
year. This could save roughly $120 million per year in total economic costs per year, assuming
the price-induced abatement measures cost $19/MWh less than the RECs.
This estimated savings expresses improved total economic efficiency of meeting New York’s
energy and environmental goals. It does not, however, express how those efficiency gains are
shared among consumers and producers. It therefore also does not address whether a carbon
price in New York could unacceptably raise costs to consumers by transferring wealth to existing
clean energy resources. Hence, we separately assessed the potential impact of a carbon charge on
customer costs.
ESTIMATED CUSTOMER COST IMPACTS
Our analysis indicates that imposing a $40/ton carbon charge has a relatively small impact on
customer costs. We estimate a change in average customer costs ranging from −$1.5/MWh to
+$4.6/MWh around a central value of +$1.7/MWh (or −0.15¢/kWh to 0.46¢/kWh with a central
value of +0.17¢/kWh). This amounts to a −1% to +2% change in total customer electric bills, a
small change compared to year-to-year changes with market conditions and customer charges.6
Small differences in net impacts across zones can be mitigated by targeted allocations of carbon
revenues to ensure similar cost impacts across zones.
The limited impact on customer costs can be explained as follows: although average wholesale
energy prices would increase, about 50% of the cost could be offset by returning carbon revenues
to customers; another 18% would be offset by reduced prices for RECs and ZECs in the presence
6 Percent change in customer bills based on a rough indicative estimate of 2025 average costs of 20
¢/kWh.

ix | brattle.com
of higher wholesale energy prices, and increased TCC revenues; finally, another 23% would be
offset by dynamic effects on investment signals.
Dynamic effects translate into customer benefits in two ways: (1) incremental investment in new
CCs reduces wholesale capacity and energy prices relative to those estimated in the static
analysis; and (2) the emissions reductions can translate to customer cost savings by relieving the
need to undertake more costly carbon abatement measures, such as additional REC purchases, to
achieve a given carbon reduction goal. As discussed above, we estimate the savings based on the
number of RECs that could be avoided, valued at the estimated price of RECs.
However, these estimates are uncertain, especially the dynamic ones, due to the unknowns
around future market conditions and how the market will respond to a carbon prices. We
evaluate the effect of several key uncertainties and find each of the uncertainties affects the
results by less than a third of a cent per kWh. The net impact on customer costs remains small,
with a range of -0.15¢/kWh to 0.46¢/kWh capturing most of the likely variation. The impact
could be substantially larger, however, if carbon revenues were not returned to customers.
MARKET DESIGN CONSIDERATIONS
We considered market design elements that would be needed to implement a carbon charge and
found no significant barriers that would make carbon pricing any less workable than RGGI or
other carbon pricing regimes around the world.
The first market design challenge is the level of the carbon price. The NYPSC could set the price
trajectory consistent with the state’s valuation of carbon abatement. Our analysis assumes a
carbon charge of $40/ton CO2 in 2025, roughly consistent with the $58/ton Social Cost of Carbon
adopted in the CES Order, minus an assumed $17/ton RGGI price.
The second basic market design challenge is how to return carbon charges to customers. We
analyze the implications of allocating charges across zones evenly on a per-kWh basis vs.
targeting charges to minimize variation in net customer cost impacts of carbon pricing among
zones. We do not fully answer this question but highlight some of the considerations.
Another significant market design challenge is how best to prevent “leakage” of emissions to and
from neighboring areas. Absent a carbon emissions charge on energy imports, in-state resources
would be disadvantaged relative to external ones, and imports would displace internal
generation, shifting emissions out-of-state for no or potentially even an adverse net impact on
overall emissions. Similarly, exports would largely cease, reducing internal carbon emissions but
shifting and possibly increasing external emissions. To avoid such outcomes associated with
wholesale electricity imports and exports, one could charge imports for embedded carbon at an
estimated emissions rate, placing them on level footing with internal New York generators.
Similarly, one could credit exporters for the carbon emissions that their sales are estimated to
avoid in the neighboring system. The details of establishing charges and credits are complex and
will not be perfect but reasonable approaches should largely prevent leakage.

x | brattle.com
One simple approach would be to charge importers and credit exporters at the marginal
emissions rate and carbon charge in the New York market. This would eliminate the carbon
charge on New York generation from the perspective of imports and exports. Importers would be
charged (or exporters would be credited) exactly the same amount as the carbon premium
embedded in the New York energy price that importers would earn (or that exporters would
pay). This solution would be simple to implement and could prevent most leakage beyond that
which may occur absent a carbon charge. However, it would provide no incentive for reducing
the carbon content of imports since it would not distinguish among imports with different
emission rates, as imports from neighboring markets with coal as the marginal resource would be
treated identically to imports from neighboring markets in which hydro units are on the margin.
Nor would this approach help identify cost-effective opportunities to reduce emissions by
exporting to more emissions-intensive neighboring markets.
A more granular border adjustment mechanism could address these issues. Imports could be
charged based on the carbon content of the supplying resources and the difference in carbon
prices between the two markets. Determining the carbon content could be straightforward for
imports from new resources whose existence depends on a contract with New York buyers, in
which case a resource-specific emissions rate could be applied. For other imports, it would be
more appropriate to apply the emissions rate of the marginal resource in the market of origin. For
exports, the credit could reflect the emissions rate of the marginal resource in the destination
market. The advantage of this more granular approach would be to distinguish between
neighboring markets that have very different marginal emissions rates (e.g., Ontario and Québec
vs. New England and PJM). A challenge with implementing this approach is determining a
reasonable estimate for marginal emissions rate in neighboring markets. NYISO currently does
not have access to the necessary information and thus would need to cooperate with neighboring
ISOs to obtain it or else make simplifying assumptions based on public data. Determining the
actual marginal emissions rate in neighboring systems can be challenging when special
conditions occur, particularly when storage resources or transactions with third systems are the
marginal resources that are affected by imports and exports.
Emissions leakage challenges are not unique to a carbon charge. The CES and RGGI themselves
may have significant leakage challenges even without a carbon charge. Extra in-state reductions
achieved through RECs can free up RGGI allowances for others if the RGGI cap is binding.
Leakage may occur if New York continues to sell all of its allocated allowances into the RGGI
auction without retiring allowances on a ton-for-ton basis to match its disproportionate
abatement efforts (i.e., those in excess of those implied by a declining RGGI cap). If New York
pursues carbon abatement more aggressively than other RGGI states, then New York should
consider reducing its sales of RGGI allowances. If the rest of the RGGI members also pursue
aggressive abatement, the overall RGGI cap could be tightened such that all states would sell
fewer allowances, resulting in even greater regional carbon abatement. As a related point, RGGI
as a whole can leak emissions to PJM by importing from non-RGGI PJM states into New York
and Maryland. Imposing a border charge on emissions as part of a New York-specific carbon
charge program could reduce leakage from RGGI to non-RGGI states.

xi | brattle.com
A related question is whether a carbon charge on electricity would cause leakage to non-electric
fuels and impede electrification of the transportation and space-heating sectors. Our analysis
indicates that net impacts on customer electricity prices would be relatively minor, so we do not
expect that cross-sectoral leakage will be a major issue. For the same reason, incremental
economic leakage of industry to states with lower electricity prices is also unlikely a significant
concern. However, these effects could be non-zero. The most elegant solution to all of these
concerns would be a uniform, national carbon charge on all sectors, such as the carbon tax
recently proposed by the Climate Leadership Council, if that were politically feasible.7
CONCLUSIONS AND NEXT STEPS
We find that a carbon charge would be a straightforward and economically efficient way to
harmonize New York’s environmental goals and the wholesale market design by pricing the
environmental externality associated with carbon emissions directly. It would send granular
price signals on carbon costs to the entire market, penalizing high-emitting resources and
rewarding low-emitting ones that generate at times and locations that displace the high-emitting
generation at the margin. It would reward activities that reduce or shift load from times when
emissions are high. A carbon charge would thus complement existing, more targeted clean
energy policies; by identifying additional sources of low-cost abatement, a carbon charge would
improve the economic efficiency of meeting the state’s energy and environmental goals.
We estimate that more of the economic gains would flow to producers than consumers, but
customer costs would not rise materially. Compared to the CES and RGGI alone, a supplemental
carbon charge would increase wholesale electric energy prices, but returning carbon revenues to
customers and other factors would offset most of the customer cost impact. The exact magnitudes
are uncertain, but the net impact on customer costs remains relatively small under all
assumptions considered.
We suggest several areas for further inquiry as NYISO, DPS, and stakeholders further develop
and evaluate ideas for harmonizing wholesale markets and state policy goals. One is to further
examine the implications of different market designs regarding carbon charges, particularly
revenue allocation, border adjustments, and potential refinements to REC and ZEC procurement
for allocating the risk of future changes in carbon prices between customers and suppliers.
Another is to solicit stakeholder feedback on the reasonableness of modeling assumptions,
especially regarding dynamic effects, and then to examine the implications of alternative
assumptions.
7 CLC (2017)

1 | brattle.com
I. Motivation and Policy Context
The NYISO retained The Brattle Group to evaluate whether and how pricing carbon emissions
into NYISO’s commitment and dispatch could help meet New York’s decarbonization goals more
effectively and at a lower cost to customers than through the CES and RGGI alone.
Our study takes as given the carbon reduction goals and policies that New York State has already
established. The state’s goals are to reduce economy-wide greenhouse gas (GHG) emissions 40%
from 1990 levels by 2030 and 80% by 2050.8 Although there is not a specific emissions reduction
target for the electricity sector, policymakers have established several policies to promote
decarbonization:
Renewable Generation Target: The New York State Energy Plan calls for 50% of
electricity to come from renewable resources by 2030,9 which the CES translates into a
set of mandates and mechanisms.
At-Risk Nuclear Support: The CES establishes financial supports for three at-risk Upstate
nuclear facilities. These facilities are currently and may continue to receive out-of-market
payments in the form of ZECs to compensate them for the value of low-carbon energy
they provide.
Regional Greenhouse Gas Initiative (RGGI): New York remains a member of RGGI, an
electric-sector-only CO2 cap-and-trade program in New England and the mid-Atlantic.
Through this program, generators must purchase centrally-traded emissions allowances to
cover any emissions from their facilities.
Reforming the Energy Vision (REV): New York’s REV policy aims to “transform New
York’s electricity industry, with the objective of creating market-based, sustainable
products and services that drive an increasingly efficient, clean, reliable, and customer-
oriented industry.”10 Distributed resources will be valued in part due to the
environmental benefits they provide.
These policies will build on New York’s success in decarbonizing the economy and power sector
over the past three decades. Since 1990, state-wide CO2 emissions have fallen 13% and power
sector emissions have fallen 40% (see Figure 1 and Figure 2).11 These declines are due to gas-fired
and renewable generation displacing coal-fired and oil-fired generation. With 50% renewable
generation by 2030, the CES is projected to reduce New York CO2 emissions by approximately 16
million tons (nearly half of 2015 electric sector emissions, or a quarter of the economy-wide
8 New York Executive Order No. 24 (2009) and Executive Order No. 2 (2011).
9 NYPSC (2016a).
10 New York DPS (2014).
11 This includes emissions associated with imported electricity. NYSERDA (2015).

2 | brattle.com
emissions reductions needed to achieve the 2030 target).12 As a result, the electric sector will
likely achieve its share of the 40% economy-wide reduction target for 2030.
Figure 1 New York CO2e Emissions by Sector, 1990–2013
Sources and Notes: CO2e expresses the warming potential of all GHGs in terms of the equivalent amount of CO2 to create the same warming effect. NYSERDA (2015)
Figure 2 Historical NYISO Fossil CO2 Emissions by Generator Type
Sources and Notes: EPA Continuous Emissions Monitoring Service (CEMS) data accessed from ABB Inc., Velocity Suite (2017). Excludes plants <25MW, plants providing steam but no net electricity, and emissions associated with imported electricity.
However, reducing electricity emissions by 40% or implementing the CES alone will be
insufficient by itself to meet the 40% economy-wide emissions reduction goal. To reach the
economy-wide goal, other sectors of the economy will need to be decarbonized. The state does
have efficiency programs and other policies addressing the transportation, commercial,
residential, and industrial sectors, but nothing as extensive as the CES. Decarbonizing enough to
accomplish economy-wide goals will likely require significant electrification of transportation
12 New York DPS (2016).

3 | brattle.com
and space heating (with heat pumps), end-use efficiency, and disproportionate emissions
reductions in the electricity sector by 2030. The electricity sector may have to decarbonize more
deeply than the CES currently contemplates, especially on a percentage-of-load basis. We
therefore assume in our study that there will be value to decarbonizing the electricity sector by
more than 40% and/or there is value to decarbonizing the electricity sector at lower cost.
A key question becomes how much to expand procurements of RECs beyond 50% and how
much to rely on other mechanisms to meet the state’s 40% economy-wide decarbonization
target. The other closely-related key question is how to achieve the state’s targets cost-
effectively. Our study takes as given the following: New York’s decarbonization goals, its
commitment to meeting those goals, and its desire to do so at the lowest possible cost.
II. Economic and Policy Framework
A. THE ENVIRONMENTAL EXTERNALITY
An important debate in energy markets is to what extent and how they should account for
externalities. Externalities occur when one’s actions impose costs (or benefits) on others without
compensating them (or charging them) for it.13 In the case of electric energy generation, burning
fossil fuels releases CO2 into the atmosphere, causing climate change and associated
environmental-economic damage and risk. This constitutes a negative externality to the extent
that emitters are not charged for the damage they cause. Conversely, generating with clean
energy avoids these negative externalities by displacing generation from fossil fuels and reducing
emissions, but is not compensated for doing so. The free market will not recognize such
externalities absent regulatory intervention and will thus tend to overproduce fossil generation
and under-produce clean energy relative to the social welfare-maximizing economic optimum.
The wholesale electricity markets operated by NYISO are designed to provide energy reliably at
lowest cost, but that cost does not include the carbon externality (except as conveyed through
the RGGI price, which is currently too low to fully attain New York’s objectives). By not
internalizing the environmental externality that New York State recognizes, the markets are
currently misaligned with the state’s carbon reduction goals. As New York’s GHG policies
become increasingly stringent, this misalignment will challenge the market’s ability to support
efficient operations and investment.
As a result, today’s power system produces more GHG emissions than is found acceptable by
New York State and other parties. A public-policy question is whether and how government and
markets can internalize the carbon externality or otherwise redirect production toward an
appropriate mix of generation resources.
13 Stiglitz (1988).

4 | brattle.com
B. SPECTRUM OF APPROACHES FOR ADDRESSING THE EXTERNALITY
New York is one of the states at the forefront of addressing carbon externalities domestically,
with a target of 40% lower economy-wide GHG emissions in 2030 as compared to a 1990
baseline. State agencies have established policies to reduce carbon emissions, including the CES
and RGGI. As discussed, the CES mandates procurement of RECs and ZECs from clean energy
that will displace fossil generation to reduce carbon emissions. REC procurements use
competitive solicitations. However, these mechanisms do not send a completely resource-neutral
price signal that invites all different supply- and demand-resource types to compete to reduce
carbon emissions, like incorporating carbon externalities directly into electricity prices would.
Below, we discuss a spectrum of approaches to address the carbon externality, as depicted in
Figure 3.
Figure 3 Spectrum of Approaches for Addressing the Carbon Externality
On the right side of the spectrum is traditional utility resource planning. This is the dominant
model in about thirty-five U.S. states that are not restructured and in many municipal utilities. In
traditional utility resource planning, utilities arrange to reliably meet load and other policy
objectives under the jurisdiction of the state regulatory authorities. The scope of traditional
planning could be expanded to include decarbonizing at the lowest possible present value of
revenue requirements (PVRR); utility resource planners would be expected to consider all
possible solutions and identify the most cost-effective ones. Possible solutions could include self-
building or competitively soliciting low-emitting generation. These solutions are usually chosen
based on the results of long-term planning models. While traditional planning has certain
advantages, a disadvantage is that planners cannot think of every possible solution and thus may
not always identify the most economic carbon abatement approaches. Furthermore, planners
cannot be expected to always plan well against uncertainties regarding future market conditions
and technological development, and ratepayers bear the risk that utilities’ decisions turn out to
be uneconomic.

5 | brattle.com
New York and the other fifteen states that have embraced restructuring are closer to the left side
of the spectrum in Figure 3.14 A core principle of restructuring was to shift investment risk from
customers (via their utilities’ and regulators’ centralized decisions) to private investors. Existing
generation was divested, and new investment was primarily undertaken by market participants
on a merchant basis, subject to the risks and rewards of competitive, technology-neutral
wholesale markets for energy, capacity, and ancillary services. Merchant investors generally do
not have long-term contracts since there are no captive customers for them to sell to in a retail
choice environment. This model has met electricity needs at prices below most estimates of long-
run-marginal costs by attracting and retaining a diverse set of resources. Capacity markets have
helped forestall retirements, support uprates to existing resources, and attract demand response
and new cleaner generation.15
In most restructured states, renewable generation has generally been procured by long-term
contracts for energy and RECs. In New York, long-term REC-only contracts place energy and
capacity market risk on investors.16 New York’s CES creates broader participation among various
types of clean energy by offering ZECs for nuclear generation as well as competitively-solicited
RECs for renewable generation and potential new hydro imports. The energy market also
incorporates a modest carbon price through RGGI.
However, CES procurement of RECs and ZECs does not invite competition as broadly as carbon
pricing would since it targets specific resource types and amounts dependent on solicitations
from New York State Energy Research and Development Authority (NYSERDA). The CES
further differs from a pure carbon price approach in that it does not price the externality
directly, but rather acts as a proxy for carbon. It is an imperfect proxy that is constructed as if all
clean generation displaced the same amount of carbon no matter when or where it is produced.
One end of the spectrum of approaches would rely entirely on a carbon price signal to expand
the range of solutions from traditional to innovative technologies to reduce carbon emissions.
Under a carbon pricing approach, carbon-emitting generation would pay a uniform price on the
amount of carbon they emit for each unit of energy they produce, raising their variable energy
costs. Carbon pricing would penalize high-emitting resources and reward low-emitting ones that
generate at times and locations that displace the high-emitting generation at the margin. It
would reward activities that reduce or shift load from times when emissions are high.
Competition in the energy market would incentivize the most economically efficient mix of
lower-emitting generation, demand side responses, and other novel approaches. The resulting
14 The demand side is essentially the same as in traditional jurisdictions, with demand for energy given
by customer usage patterns (under a variety of rate structures, mostly fixed prices) and with demand
for capacity and ancillary services determined administratively by the ISO.
15 Pfeifenberger (2011).
16 Placing energy and capacity revenue risk on investors should promote efficient tradeoffs among
competing resource types. Those with the most energy and capacity value will be able to offer RECs at
lower prices, all else equal.

6 | brattle.com
mix of resources would theoretically minimize the costs of meeting New York’s energy and
environmental goals.
C. HOW NEW YORK’S DECARBONIZATION INTERACTS WITH REGIONAL EFFORTS
New York is a member of RGGI, the U.S.’s first regional carbon cap-and-trade system, so any
state-level decarbonization efforts will interact with RGGI markets. RGGI sets a cap on regional
emissions through a multi-state process that defines the total supply of CO2 allowances available
to affected generators. The allowances are auctioned, and the proceeds from the auction are used
to fund various state and utility programs. An auction allocates scarce allowances to participants
who place the highest value on emitting CO2; therefore, the auction clearing price corresponds to
the marginal abatement cost at the point where the cap is met.
If New York opts to support carbon abatement beyond RGGI, whether through REC
procurements or carbon charges or any other mechanism, in-state generators will consume fewer
allowances. This will make those allowances available to other polluters and will lower the RGGI
allowance price. If allowances are scarce (with the RGGI cap binding), carbon abatement in New
York will merely substitute for carbon abatement elsewhere in RGGI, causing one ton of
emissions leakage for every ton of emissions reduction achieved in New York. The net reduction
would be zero. However, leakage should not occur if the RGGI price is already at the floor with
RGGI sequestering allowances to support the floor price (as it often has been) and sequestering
more as New York reduces its emissions. Likewise, leakage should not occur if the RGGI price is
at the ceiling, with RGGI printing and releasing allowances to maintain the ceiling price, and
releasing less to the extent that New York reduces its emissions.
This leakage concept is illustrated below in Figure 4, under the assumption that the RGGI cap is
binding. Without incremental abatement from New York, RGGI states emit up to the emissions
cap and the allowance price is set by the marginal abatement measure in the region. If New York
reduces its emissions further, its generators will consume fewer allowances, making those
allowances available to other polluters. Consequently, other states could emit more, and the
RGGI price could decrease. In both cases, with and without New York’s abatement, the total
emissions from the RGGI region would be the same. New York customers would have paid extra
to induce deeper state-wide carbon reductions but total regional emissions would remain the
same.17 New York customers would pay for relatively high-cost abatement measures (that would
not have occurred under RGGI alone) in place of lower-cost abatement measures available at the
margin in the RGGI allowance market.
17 This impact was noted by the Environmental Defense Fund in its comments on the CES, “Second, so
long as part of the marketplace is subject to a binding cap-and-trade scheme (RGGI), any amount of
incremental renewable or zero-carbon generation in that submarket will simply free up allowances for
use elsewhere in the RGGI market. So apparent “reductions” in carbon dioxide are illusory except to
the extent they lead directly to equivalent-magnitude reductions in the cap.” See EDF (2016).

7 | brattle.com
Figure 4 RGGI Binding with Price Less than NY Abatement Cost
In order to prevent leakage of allowances and emissions to other states, New York could match
its extra abatement efforts with a corresponding reduction in the number of allowances available
within RGGI. If New York pursues carbon abatement more aggressively than other RGGI states,
it will have to consider unilaterally reducing sales from its share of allowances.18 If the rest of the
RGGI members also want to pursue aggressive abatement, they must agree to tighten the overall
RGGI cap such that all states would sell fewer allowances. Much more abatement would be
achieved (absent major leakage to non-RGGI states). Tightening the RGGI cap has precedent in
2012 Program Review, which produced a revised RGGI cap.19 Indeed, the 2016 Program Review
considered cap reductions ranging from current levels to 5% per year.
If New York were to pursue its own in-state abatement efforts and sell fewer allowances to avoid
leakage, the economics could be illustrated by the following example: assume the RGGI price in
Figure 4 is set by a regional marginal abatement cost of $10/ton, but the marginal New York
abatement has a cost of $15/ton. New York will have to subsidize the incremental New York
abatement by the $5/ton difference through a contract payment, a carbon charge, or some other
mechanism. If New York withheld and retired one allowance for each incremental ton abated,
the price and supply of allowances to the rest of RGGI would be unchanged (there would be no
leakage). New York’s total cost of achieving its incremental emission reductions beyond RGGI
would be $15/ton, which reflects that full abatement cost of the measure.
Incidentally, this example illustrates that New York can theoretically achieve the same emissions
reductions by purchasing allowances and not subsidizing its own above-market abatements
18 New York may need to change its statute on RGGI to enable retiring allowances; however, there is
precedent through the voluntary renewable energy allowance (VRE) program. Under the VRE, states
set aside allowances to retire on behalf of renewable generators that sell their environmental qualities
to third parties. See Energy News Release (2008).
19 RGGI (2012).

8 | brattle.com
through RECs or any other in-state measure. In that case, the abatement cost would remain at
only $10/ton. This suggests that New York might best achieve its decarbonization goals by
relaxing its desire to reduce emissions in-state. New York could simply withhold and discard
RGGI allowances to let the RGGI market identify the least cost abatement region-wide. A
potential problem with this strategy, however, is that it could raise RGGI prices and tempt the
other states either to advocate for loosening the regional cap to maintain prices that are
acceptable to them or to trigger the release of additional allowances through the Cost
Containment Reserve mechanism.20 Either would re-create the leakage problem. In our example,
if New York pays $10 for an allowance to achieve 1 ton of abatement then RGGI releases an
additional allowance, RGGI would offset New York’s abatement with incremental emissions
elsewhere. The net effect would be no change in emissions, but a transfer of $10 of wealth from
New York to all the RGGI states that sell the incremental allowance (New York would be
allocated a fraction).
Leakage may also occur to outside the RGGI region, as RGGI differentially raises the cost of
internal resources. This raises wholesale prices and attracts external resources that are not
charged for their emissions. It can lead to dispatch switching within PJM (e.g., Maryland to
Pennsylvania) and energy trades from PJM into New York. Indeed, RGGI’s program review
modeling indicates that these effects may result in approximately 35–37% emissions leakage
between 2017 and 2031.21 As shown in Figure 5, RGGI modeling under a 2.5% per year reduction
in cap between 2021 and 2030 shows approximately 140 million tons of abatement across the
RGGI footprint; however, the reduction across the entire eastern interconnection is about 90
million tons. The difference between the two, 50 million tons, represents leakage to non-RGGI
states. As would be expected, if the RGGI cap is tighter and the allowance price higher, the
incentive for leakage increases. Under the 3.5% per year case, the emissions leakage increases
from 50 to 70 million tons.
Leakage to states outside RGGI could theoretically be solved by imposing border charges similar
to those if New York had its own carbon price beyond RGGI, as discussed in Section V.
However, solving this RGGI problem is beyond the scope of this study.
20 The Cost Containment Reserve releases additional allowances if allowance prices exceed a pre-defined
threshold.
21 RGGI (2016).

9 | brattle.com
Figure 5 RGGI and Eastern Interconnect (EI) CO2 Emission Reductions (2017–2031)
Source: RGGI (2016)
III. Lessons Learned from Other Jurisdictions
A number of cap-and-trade systems apart from RGGI have been in existence for some time. In
addition, there are examples of states and countries implementing other forms of carbon pricing,
sometimes at the same time as participating in a cap-and-trade program, similar to what New
York would be doing by implementing a carbon charge while being a member of RGGI.
It is therefore instructive to examine carbon pricing in similar contexts elsewhere in the United
States and the world. In this section, we take a closer look at carbon pricing in Ontario,
California’s Cap-and-Trade program, the United Kingdom’s (UK’s) carbon price layered on top of
the European Union’s Emissions Trading System (ETS), and New England Power Pool’s
(NEPOOL’s) “Integrating Markets and Public Policy” Initiative. We do not address PJM
Interconnection’s recent efforts to develop a methodology for implementing carbon pricing on a
sub-regional basis within its footprint, since those efforts are nascent.
A. ONTARIO’S DEEP DECARBONIZATION
The Canadian province of Ontario has rapidly decarbonized its electricity sector, achieving 80%
reductions in sector-wide GHG emissions over the past decade. Ontario achieved this by phasing
out coal plants and developing new clean energy resources to displace a significant share of gas-
fired generation.22 The province has used an administrative planning approach to determine the
desired resource types and used competitive solicitations or standard offer contracts to attract
22 IESO (2016a).

10 | brattle.com
incremental supply. Now, after achieving deep decarbonization, Ontario is facing and addressing
a number of significant market design and policy challenges. Many of these same challenges are
likely to affect New York and other regions that pursue similarly ambitious goals.
The most important concern facing regulators and customers in Ontario is a significant increase
in customer costs.23 A portion of this cost increase was likely unavoidable in pursuing
decarbonization policies, but there is growing concern that government-directed supply
contracts have not been cost-effective. For example, Ontario’s Minister of Energy recently stated
that “allocating the precise mix of technology types has largely been arbitrary and led to sub-
optimal siting, uncompetitive prices, and heightened community concern.” He proposed “moving
towards more ‘technology-agnostic’ procurements.”24
The significant growth in clean energy resources has fundamentally changed how Ontario’s
electricity system operates, how prices are set, and the GHG abatement value of different
resource types. These effects are illustrated in the changes over a decade of price duration curves,
as shown in Figure 6. In 2005, prices were $40/MWh or higher in almost all hours, with fossil
plants setting real-time prices in approximately 80% of all hours in 2005; this fell to only 40% of
all hours by 2015.25 Over the same period, energy prices dropped to 68% of their 2005 levels.
Hours with zero or negative pricing rose from nothing to 15% of all hours.26
Under these conditions, clean energy resources no longer provide similar GHG abatement value.
Incremental clean energy will only displace fossil emissions if the clean resource is producing
energy when fossil-fired generation is marginal, and fossil generation is marginal much less
frequently. This suggests that further reducing GHG emissions will require different types of
clean energy resources with the capability to produce energy in the subset of hours currently
served partly by fossil generation. It also suggests that the next frontier of clean “energy” may
need to come from storage, demand response, or other solutions that can shift clean energy
production from hours and locations when energy would be spilled or curtailed. Historically,
Ontario has not had any mechanism that focuses clean energy investments and operations in
ways that incentivize GHG abatement. However, Ontario’s cap-and-trade program came into
effect in 2017 and will provide incremental incentives to reduce economy-wide emissions.27
Ontario’s large reduction in energy prices partly reflects the reduction in natural gas prices. It
also reflects the move toward a system with increasing prevalence of resources with high fixed
23 Global News (2016).
24 Thibeault (2016).
25 Real time data, rather than hour ahead or day ahead, is used because it is the only data available in
2005. These are simple averages of monthly data. 2015 data are from November 2014 to October 2015.
See Ontario Energy Board (2005, 2006, and 2016).
26 Some of this reduction was driven by a lower gas prices.
27 Similar to Québec, which joined California’s Cap-and-Trade Program in 2014, Ontario will be linking
its cap-and-trade program with California’s program in 2018. See CARB (2017).

11 | brattle.com
costs but near-zero variable costs. The portion of system commodity costs paid for through
supply contracts with traditional and clean energy contracts has risen from 8% in 2006 to 77% in
2015.28 With the introduction of a GHG allowance market, energy prices will increase during
hours with fossil plants on the margin and supply contract payments will decrease by an
offsetting amount.
Figure 6 Hourly Ontario Energy Price
Source: ABB, Inc., Energy Velocity Suite (2016).
The culmination of these changes has left Ontario with a number of challenges and
opportunities. Ontario’s Independent Electricity System Operator (IESO) is concerned that the
traditional system of regulated planning, and a market designed for dispatching fossil plants, are
not cost-effectively supporting the province’s reliability needs and policy goals. To better support
these goals and accommodate a clean energy fleet, the IESO is undertaking its Market Renewal
Project that will incorporate an advanced energy market designed for a clean energy fleet, some
operations enhancements to accommodate intermittent resources, and a capacity market to
support more competitive supply mix.29
28 These contract payments in excess of energy market prices are referred to as the “global adjustment”
in Ontario. Global Adjustment compiled from IESO (2016b) and annual energy prices taken from
IESO (2016c).
29 The progress and scope of the Market Renewal Project can be reviewed at IESO (2017).

12 | brattle.com
B. CALIFORNIA CAP-AND-TRADE PROGRAM
California continues to set ambitious long-term economy-wide GHG emissions reduction goals
and to develop programs to meet those goals. California utilizes a hybrid approach to reducing
statewide GHG emissions, by enacting both a cap-and-trade program and a portfolio of sector-
specific mandates, collectively referred to as “complementary measures.” The California Cap-
and-Trade Program enacted by Assembly Bill 32 in 2006 sets a cap on 85% of GHG emissions in
California. This cap includes emissions from the industrial sector, electric power sector
(including both in-state and imported electricity), natural gas suppliers, and transportation fuel
suppliers. At the same time, GHG emissions reductions will be achieved through policy
mandates, such as the 50% RPS in 2030, energy efficiency mandates in the electric power sector,
and the Low Carbon Fuel Standard (LCFS) and vehicle efficiency standards in the transportation
sector. Based on the California Air Resources Board’s (CARB) initial Climate Change Scoping Plan, 80% of GHG emissions reductions in California are projected to be achieved through
complementary measures and 20% through the Cap-and-Trade program.30
The Cap-and-Trade Program provides a backstop mechanism to realize decarbonization goals
even if the complementary measures do not succeed as projected. The success of the
complementary measures will also have a significant impact on GHG allowance prices in
California: the greater reductions achieved through the complementary measures, the lower
GHG allowances prices, and vice versa.
While currently only 20% of California economy-wide GHG emissions come from the electric
power sector, California policymakers believe that deep decarbonization in the electric power
sector will be needed to enable decarbonization of other economic sectors (EVs, industry
30 CARB projected that 34.4 MMT-CO2e of emissions reductions would be required in 2020 beyond the
reductions from complementary policies to meet the GHG cap. A total of 174 MMT-CO2e of
reductions are required to meet the cap. See CARB (2008), p. 17.
The Ontario Experience: Takeaways for New York High levels of non-emitting (and zero-marginal-cost) supply will fundamentally
change how the system operates and how prices are set for energy. If New York faces
similar conditions absent a carbon charge, energy prices may decline and capacity,
ZEC, and/or REC prices may need to increase.
Different types of clean energy can have very different carbon abatement values.
Discrepancies are likely to increase as the system decarbonizes. When fewer hours
have carbon-emitting resources on the margin, incremental clean energy will need to
be focused in those hours to provide incremental abatement. This will change what
types, and in particular, what mix of clean energy, storage, or demand response
resources are most cost effective for reducing emissions.

13 | brattle.com
electrification, among others).31 A significant portion of these reductions are likely to be driven
by the RPS and by energy efficiency mandates, and supported by the energy storage mandate
that requires 1,300 MW to be installed by 2024.32 Additional reductions will be achieved under
the Cap-and-Trade Program by reducing the cost of lower emitting resources relative to higher
emitting resources. However, due to the lack of coal-fired generation within California, there is
limited potential for the GHG price to reduce emissions from re-dispatching in-state resources.
On the other hand, the GHG price can have a significant impact on emissions from electricity
imports through both the Energy Imbalance Market (EIM) mechanism and bilateral transactions.
Imports provide abatement opportunities but risk leaking emissions from California into
neighboring states if not managed.
From the beginning of the program, the potential for emissions leakage from imported electricity
has been a challenge for California as 25% of California demand is met through imports.33 No
other western state imposes a cap on GHG emissions or imposes a cost on GHG emissions via a
carbon tax. For this reason, California tracks the emissions from imports and charges imported
electricity for its associated emissions. Even if the western states add a GHG emissions charge in
the future, it is uncertain how those programs would interact with the California program,
especially if the goals of the programs differ significantly from California’s. The additional GHG
costs imposed on imports into California provide incentives for importers to under-report their
emissions or financially divert dirtier power to other markets, known as “resource shuffling.”34
For example, higher emitting coal units can avoid being charged at their full emissions rate if
they are imported instead as “unspecified power” or if renewable energy is scheduled into
California in its place.
Initially, CARB specified in the Cap-and-Trade regulations that the practice of resource shuffling
was prohibited and required electricity importers to attest that they have not engaged in such
activity.35 After market participants sought clarification on how resource shuffling would be
31 “Electrification in the transportation and building sectors must coincide with decarbonization of
electricity supply.” CARB (2013a).
32 California Public Utilities Commission (2013).
33 California net generation was 197,000 GWh and retail sales were 261,000 GWh in 2015. See EIA
(2017b).
34 Resource shuffling is defined in the Cap-and-Trade regulations as “any plan, scheme, or artifice
undertaken by a First Deliverer of Electricity to substitute electricity deliveries from sources with
relatively lower emissions for electricity deliveries from sources with relatively higher emissions to
reduce its emissions compliance obligation.” See CARB (2016a), p. 53. It was originally defined as “any
plan, scheme, or artifice to receive credit based on emissions reductions that have not occurred,
involving the delivery of electricity to the California grid.” See CARB (2013b), p. 50.
35 The importers had to agree to the following statements: “I certify under penalty of perjury of the laws
of the state of California that [facility or company name] for which I am an agent has not engaged in
the activity of resource shuffling to reduce compliance obligation for emissions, based on emission
reductions that have not occurred as reported under MRR.” See CARB (2013b), p. 90.

14 | brattle.com
identified, CARB removed the attestation requirement and identified circumstances in which the
substitution of delivery of less-emitting generation for more-emitting generation is not
considered resource shuffling. Such “safe harbor resource shuffling” allows for substitution
caused by RPS requirements or compliance with other state or federal laws and regulations.
Currently, electricity imports are charged for GHG emissions in different ways depending on the
source. In cases where the source of imports are clearly defined due to long-term contracts with
California, transmission reservations that schedule imports into California, or dispatch in the
EIM, the emissions charges are based on the resource-specific emissions rates.36 For generic
imports that are not associated with any particular unit (referred to as “unspecified power”),
California charges the imports at the default emissions rate of 0.430 tons/MWh, reflecting the
historical emissions rate of marginal resources in the Western Electricity Coordinating Council
(WECC).
The advent of the EIM provided additional clarity to the California ISO (CAISO) and CARB
concerning which resources are “deemed delivered” to serve California load. However, the
current least-cost dispatch algorithm of the EIM will tend to schedule less-emitting generation
into California and more-emitting generation into the non-California entities within the EIM.
This makes resource shuffling unavoidable. Recent analysis by CAISO quantified the extent to
which the GHG emissions obligations assigned to generators operating in the EIM dispatch
understate the GHG emissions attributable to load. This issue has been of particular concern as
the recent and ongoing expansion of the EIM will increase the potential for California to
understate the GHG emissions caused by its load.
To ensure the environmental integrity of the Cap-and-Trade program, CARB recently proposed
updated regulations. CARB will calculate the difference between the GHG emissions associated
with EIM imports designated to serve California load if assessed at the default emissions rate and
emissions if imports are assessed at deemed delivered resource-specific emissions rates, known as
the “EIM Outstanding Emissions.”37 CARB will calculate this difference on an annual basis and
will retire an equivalent amount of emissions allowances from the annual GHG allowance
auctions.38 This does not internalize the costs of EIM-shuffled emissions so does not prevent
distortions directly, but it does compensate for the resulting extra emissions on an annual
aggregate level, achieving the same emissions reductions as would be achieved if all potential
leakage associated with imported energy were assessed at the default emissions rate.
36 In some cases where power marketers are intending to sell significant power into California from a
fleet of resources, they may apply for an Asset Controlling Supplier (ACS) rate based on the average
emissions across their fleet intended to serve California. In 2017, there are three marketers with ACS
emissions rates: Bonneville Power Administration (BPA) (0.019 tons/MWh), Powerex (0.021
tons/MWh), and Tacoma (0.025 tons/MWh), see CARB (2016b).
37 See CARB (2016c), p. A-98.
38 See CARB (2016d), pp. 127–128.

15 | brattle.com
C. UNITED KINGDOM
The Climate Change Act 2008 commits the UK government to reducing GHG emissions by 80%
of their 1990 levels by 2050. The government is obligated to set out legally binding “carbon
budgets” caps on total emissions over a five-year period, designed to be consistent with the 2050
target.39 As part of its policies to achieve these targets, the UK electricity generation sector is
subject to the European Union’s (EU) Emission Trading System (ETS). Due to an abundance of
allowances, prices have fluctuated substantially since Phase II (2008–12). These fluctuations may
have hindered investment in low-carbon technologies. In response, for the March 2011 Budget,
the UK government committed to introducing a Carbon Price Floor (CPF) starting April 1,
2013.40 The CPF establishes a tax (the Carbon Price Support Rate, CPSR) on fuels used for
electricity generation. The CPSR is set so the combined carbon price including the ETS meets an
increasing trajectory (£16 per metric ton CO2 in 2013 rising to £70 in 2030, in 2009 prices). The
CPSR is set two years in advance and varies by fuel according to carbon content.
In 2020 the CPF was meant to reach £30/tCO2 (2009 prices), but in 2016 the UK government
froze the CPF at approximately £18/tCO2 through 2020.41 The CPF was frozen in response to
comparatively low EU ETS prices and concerns that the CPF escalation trajectory to £30/tCO2
would result in U.K. firms facing higher energy prices than competitors abroad and raise energy
bills for households.42
In practice, the CPF is implemented through the imposition of the CPSR and fuel duty on the
purchase of fossil fuels used to generate electricity. The CPSR is calculated as the difference
between the CPF target price for a particular year and an estimate of the ETS price, based on
two-year-ahead ETS futures prices. This aims to ensure that the sum of the actual ETS price and
the levy paid through the CSPR is close to the estimated price floor. By design the CPSR creates a
wedge between the carbon price faced by the UK power sector and that faced by the power
sector in the rest of Europe.
39 U.K. Government (2009)
40 See EDF (2015), p.2
41 EDF (2015), p.2
42 U.K. Government (2014), p. 1
The California Experience: Takeaways for New York California’s experience demonstrates that carbon pricing can be used in conjunction
with clean energy procurement mechanisms to pursue state decarbonization goals.
California has demonstrated the feasibility and challenges of assessing border charges
to reflect the emissions rate of imported electricity to counter leakage. CAISO charges
for emissions based on a default rate but allows resource-specific rates for resource-
specific imports.

16 | brattle.com
In the period leading up to the introduction of the CPF, numerous parties pointed out that a CPF
above the price of allowances under the EU ETS could shift electricity production from the UK
to the rest of Europe and not achieve incremental CO2 emissions reductions. For example, an
article posted on the UK Parliament website from January 2012 stated:
The threat of leakage within the EU is particularly acute for the electricity sector.
Electricity is readily transportable between the UK and mainland Europe and can
be traded instantaneously on spot market prices. DECC expects there to be as
much as 10 GW of interconnection with other countries by 2020, some 10% of
installed capacity. This makes electricity generation more susceptible to leakage
than other sectors, such as goods manufacture, which may be restricted by the
difficulties of relocating production.43
A second set of anticipated impacts was that the CPF would lead to a decrease in the price of EU
ETS allowances, a decrease in the efficiency of meeting the EU ETS GHG cap, and the reduction
of revenues from auctioning EU ETS allowances.44
Critics of the support mechanism argued that the CPF represented an undue burden for energy
users in the UK. Consumer groups pointed out that the CPF would further add to rising energy
bills and would threaten the competitiveness of energy-intensive industries.45
Since it was established in 2013, the response to the CPF has been mixed. At least one recent
study pointed out that given the relatively low average carbon intensity of the remaining UK
economy, only a small portion of energy intensive trade-exposed industries saw significant
increases in energy cost and hence faced incentive to relocate.46 On the other hand,
representatives of the coal industry have pointed to the CPF as dealing the death blow to the UK
coal industry.47 A study by KPMG commissioned by one of the largest UK electricity companies
found that removing the CPF would put in danger a significant amount of “marginal” gas-fired
generation and would remove the unintended incentive to build new transmission lines
interconnecting the UK with continental Europe (in part to take advantage of lower carbon
prices in other parts of the EU).48 KPMG’s analysis concluded that the CPF provided useful price
certainty and that the relatively small increase in electricity prices was worth the benefits.
In summary, the impact of the CPF was to hasten the retirement of coal capacity to the benefit of
gas-fired generation and shift some electricity production to areas not affected by the CPF in
continental Europe. The CPF led to a somewhat significant increase in electricity prices for a
43 DECC is the Department of Environment and Climate Change. See U.K. Parliament (2012).
44 See Sartor and Berghmans (2011), p.4-5
45 PWC (2013).
46 Grover, Shreedhar, and Zenghelis (2016).
47 World Coal (2015)
48 SSE (2016).

17 | brattle.com
small set of energy-intensive, trade-exposed industries and had a modest impact on most
customers.
D. NEPOOL’S “INTEGRATING MARKETS AND PUBLIC POLICY” INITIATIVE
Like New York, the New England states have been pursuing ambitious clean energy policies. All
of these states have either a non-binding policy target or a legislative mandate to achieve 70–80%
CO2 emissions reductions by 2050, either in the electricity sector or economy-wide.49 The states
have pursued these objectives through a combination of renewable mandates, energy efficiency
programs, participation in RGGI, and other measures. To date, the New England wholesale
market design has not been transformed to reflect these policy objectives.
Increasingly, market participants, state regulators, and ISO New England (ISO-NE) have become
concerned that the states’ decarbonization policies are not aligned with wholesale electricity
markets.50 These inconsistencies have introduced several types of concerns that are expected to
grow in importance with decarbonization. As one example, to prevent clean energy from
undermining capacity payments needed to retain resource adequacy, clean energy resources
beyond a certain quantity may not be fully accounted for in the capacity market.51 As another
example, some market participants are concerned that energy (and capacity) price suppression
from clean energy resources is degrading the financial position of non-contracted existing clean
energy resources such as nuclear and some existing hydro facilities.52 If new clean energy
resources induce the retirement of existing clean energy resources rather than displace existing
fossil generation, clean energy investments might not achieve net CO2 reductions as intended.
The New England stakeholders group initiated the Integrating Markets and Public Policy
initiative to address these concerns. The underlying disconnect is that wholesale energy,
49 See Figure 7.
50 See NEPOOL (2016).
51 More specifically, clean energy resources beyond the quantity contemplated in the Renewable
Technology Resource exemption would be subjected to an Offer Review Threshold Price (equivalent
to New York’s Minimum Offer Price Rule). See Section III.13.1.1.1.7 of ISO-NE Market Rule 1, ISO-
NE (2017).
52 See Exelon (2016) and Brookfield (2016).
The UK Experience: Takeaways for New York While increasing electricity costs in one state always carries some risk that industries
sensitive to energy prices might relocate, the relatively short track record of UK
carbon pricing does not suggest significant relocation at the current levels of pricing.
Reforms may still be needed to avoid carbon leakage through increased electricity
imports from areas with lower carbon prices.

18 | brattle.com
ancillary, and capacity markets were designed with the objective of maintaining reliability at
lowest system cost. Wholesale energy markets have not been designed to support states’
decarbonization or other policy objectives. The stakeholders group is now asking whether
markets can be reformed to better accommodate state policies, or, more proactively, whether the
markets can be designed in ways that help states express and pursue their policy objectives.
Stakeholders have introduced a range of proposals that incorporate one or both of: (a) a forward
clean energy procurement market that would be administered by ISO-NE on behalf of states; or
(b) an administrative carbon charge such as one we are evaluating for NYISO in this study.
Regarding the carbon charge option, several market participants and ISO-NE staff highlight
many favorable attributes that will support economic efficiency and integrate smoothly with
existing energy market structures.53 However, several state and customer representatives have
raised a number of concerns that would need to be addressed before they would be interested in
pursuing a carbon charge, including whether: (a) a carbon charge will achieve incremental CO2
emission reductions in New England; (b) states with less ambitious decarbonization policies
would incur costs for meeting the decarbonization policies of other states; and (c) the carbon
charge might introduce material transfer payments from customers to existing generators.54
Ongoing stakeholder efforts are evaluating and addressing these concerns. Other than cross-
subsidies, we expect that these same concerns will need to be reviewed in New York.
IV. Options for Pricing Carbon into NYISO’s Wholesale Energy Market
At a high level, there are two approaches for incorporating a carbon price into the NYISO
wholesale energy market. The first option, a carbon charge, directly sets a $/ton price on carbon
emissions, which NYISO would apply in its commitment, dispatch, and settlement. The second
option, cap-and-trade, sets a target quantity of emissions and auctions these allowances to
emitters. The cap-and-trade system could be administered by a New York State entity that
imposes an in-state cap in parallel with RGGI or by RGGI itself through a tighter effective cap.
These two approaches may produce very different results.
We do not take a position on whether one approach is superior, but we do identify the different
attributes. Later sections of this paper focus primarily on the carbon charge approach since that
could be implemented by NYISO more readily than a New York-only cap-and-trade program
53 See NEPOOL (2017)
54 NESCOE (2016).
The New England States’ Experience: Takeaways for New York If market designs do not consider policy objectives (such as decarbonization), they can
inadvertently undermine that policy. Incorporating policy objectives as part of the
market design will create better alignment with objectives.

19 | brattle.com
(which would have to involve other parties) and appears to better align with the state’s goals
than a RGGI-only approach.
A. CARBON CHARGES APPLIED TO COMMITMENT AND DISPATCH
The carbon charge approach would recognize the cost of carbon emissions from all power sector
emitters, directly internalizing the environmental externalities. NYISO would administer the
carbon charge in its commitment, dispatch, and settlement processes. NYISO would add the
charge to the commitment and dispatch cost of New York’s fossil-fired generators based on each
generator’s emissions rate, and then deduct that amount from the generator’s compensation
payment for its energy.55 Charges would also be assessed on imports based on their estimated
carbon content. NYISO would return all collected carbon charges from fossil generators to
customers via load serving entities (LSEs) or electricity distribution companies (EDCs).
Because the charge would increase the variable costs of carbon-emitting generation, it would
raise the energy clearing price when such resources are on the margin. All generators, including
clean resources, would receive the higher energy price, net of any carbon charges on their
emissions. Low emitting resources, including efficient fossil units, renewables, hydropower,
nuclear (and possibly clean imports, depending on how border charges are assessed) would
benefit through higher net revenues.
A carbon charge would allow the market to identify the lowest-cost emissions reduction
opportunities. All opportunities to reduce emissions, whether through fuel switching,
development of new low-emitting resources, energy efficiency measures, or advancements of
new technologies, would compete based on the emissions benefit they provide. In contrast, many
of New York’s current decarbonization policies focus on providing emissions reductions from a
subset of resources and thus may miss other, low-cost emissions reduction opportunities that a
carbon charge could provide.
In New York, a carbon charge could complement the existing CES policy and RGGI
participation. CES procurements could still occur, but the prices of RECs and ZECs would
decrease as clean energy producers expect to earn more in the wholesale energy markets. The
carbon charge level could be set such that the carbon charge plus the RGGI allowance price sums
to the desired price level.
B. NEW YORK-ONLY CAP-AND-TRADE
Cap-and-trade mechanisms establish a cap on emissions by issuing or auctioning a limited
number of allowances. Cap-and-trade mechanisms require emitters to procure and surrender
allowances in order to emit. The market for allowances establishes a carbon price at the marginal
cost of abatement. The price of allowances from a cap-and-trade program can be equivalent to
55 This approach is effectively the one initially proposed by Rudkevich and Ruiz (2012) and by Chang,
Weiss, and Yang (2014).

20 | brattle.com
that of a carbon charge, but unlike a carbon charge, a cap-and-trade program specifies the
quantity of allowed emissions and lets the market determine the clearing price.
New York is currently part of a regional cap-and-trade program, RGGI, but those state and
regional caps are not as tight as New York’s goals because RGGI prices are low (see Section II.C).
If New York desires a higher carbon price consistent with its ambitious decarbonization goals
and its adoption of the social cost of carbon, it could consider implementing its own cap-and-
trade program on top of RGGI. Each New York emitter would need both a RGGI allowance and a
New York allowance for each ton of carbon emitted. This would allow New York to directly
control the quantity of in-state emissions (and all abatement would occur in-state even if out-of-
state options might be cheaper). State-specific cap-and-trade is the approach that Massachusetts
has proposed to meet its sustainability goals within the power sector.56
Developing a state-specific cap-and-trade program would impose an administrative burden for
design, operation, and compliance. The state would need to designate an entity (or entities) to
design and administer the program. This entity would need to develop operating rules, including
price control mechanisms and allowance allocations. For example, cap-and-trade systems
frequently include the banking and borrowing of emissions across control periods, as well as
price floors and ceilings. There are many options for initial allowance allocation, including direct
allocation to load, direction allocation to emitters, and centralized auctions, where the proceeds
are allocated similarly to carbon charges (but not through NYISO and its settlement system). In
this regard, establishing a cap-and-trade system for New York would likely pose a greater
administrative burden than a carbon price administered by the NYISO.
C. TIGHTEN THE RGGI CAP
A third, very different approach, is to tighten the existing RGGI cap to increase carbon prices.
Because RGGI is a regional program, RGGI states would have to agree to tighten the RGGI
standard. This could be the best approach if the region shares common goals, but each state does
not share common goals, as shown in Figure 7.57 New York could try to unilaterally reduce the
availability of allowances and drive up the price beyond the amount needed to lock in emissions
reductions achieved through REC procurements by withholding allowances from auctions.
However, that might be counterproductive if it raises RGGI prices to a level that is unacceptable
to other states, leading those states to advocate for looser regional caps.
56 Massachusetts has proposed an emissions cap that reduces at 2.5%/year beginning in 2018 and
continuing through 2050, see Massachusetts OEEA (2017).
57 The New England Governors and Eastern Canadian Premiers 2001 agreement did set forth broad goals
for the region of reducing greenhouse gas emissions to: 1990 levels by 2010, 10% below 1990
emissions by 2020, and long-term reductions of 75–85%. These goals are not codified in all RGGI
states, and Maryland is not a member of the New England Governors and Eastern Canadian Premiers
group, see NESCAUM (2001).

21 | brattle.com
Figure 7 Regional Economy‐wide Carbon Reduction Goals
RGGI State 2020/2030 Goal Final Goal (2050)
Connecticut 2020: 10% below 1990 levels 2050: 75–85% below 2001 levels
Maine 2020: 10% below 1990 levels 2050: 75–80% below 2003 levels
Maryland 2020: 25% below 2006 levels
Massachusetts 2020: 10–25% below 1990 levels 2050: 80% below 1990 levels
New York 2030: 40% below 1990 levels 2050: 80% below 1990 levels
Rhode Island 2035: 45% below 1990 levels 2050: 80% below 1990 levels
New Hampshire 2025: 20% below 1990 levels 2050: 80% below 1990 levels
Vermont 2030: 40% below 1990 levels 2050: 80–95% below 1990 levels
Sources: Maryland Dept. of Environment (2015), C2ES (2017), ISO Newswire (2017). Connecticut, Maryland, Massachusetts, New York, and Rhode Island goals are legally binding, backed by legislative mandate, whereas the others are more aspirational goals.
If the rest of the RGGI members share New York’s deep decarbonization goals, they could jointly
agree to reduce the number of allowances sold by all states. This would be ideal in that it would
achieve much greater reductions with all RGGI states sharing in the burden. Moreover, as a
regional market, the cheapest abatement opportunities would be achieved first, minimizing the
total costs of abatement. New York may end up with more or less emissions within its borders
than under a comparably stringent in-state strategy. State policy goals would have to adjust to
recognize the regional nature of allowance markets.
Much as this approach offers substantial economic efficiencies, we do not focus on it in this study
since it is not aligned with the New York’s current decarbonization goals and because
substantially tightening the caps would require much work with other states.
V. Market Design Issues with a Carbon Charge
Establishing a carbon charge will create several market design issues that New York and the
NYISO will need to address. However, these market design issues are solvable. We foresee no
insurmountable barriers that would prevent a carbon charge from becoming a reality. The
NYISO markets and regulatory processes will be better aligned with state policies if they
incorporate a uniform carbon price.
We describe the main market design issues below.
A. ESTABLISHING THE APPROPRIATE CARBON PRICE AND ADJUSTMENTS OVER TIME
If NYISO were to establish a carbon charge, the first questions are: what should the price be, and
how should it change over time? Any carbon charge should reflect New York State’s
decarbonization goals. Setting the price too low may fail to incentivize some fairly low-cost
abatement measures or may fail to achieve decarbonization goals. Setting the price too high will

22 | brattle.com
spur more carbon abatement that may include relatively high-cost measures. This could reduce
emissions below the target but unnecessarily increase costs.
Determining the appropriate price is beyond the scope of this white paper. Policymakers should
define a process for determining the price and modifying it over time. This process could be led
or informed by the NYPSC and other state agencies. Once the price is set, NYISO would be
responsible for implementation via tariff reforms. The NYISO would then be responsible for
assessing carbon charges to fossil units and imports and for returning collected charges to LSEs.
However, we see two distinct options within the confines of New York’s goals. The first option is
to set the carbon charge at the value New York ascribes to carbon abatement. The New York
NYPSC has adopted using the SCC as estimated by the U.S. Interagency Working Group on the
Social Cost of Carbon.58 The SCC serves an estimate of the damages associated with an
incremental increase in carbon emissions. Specifically, the NYPSC has tied ZEC payments to the
SCC, starting at $43/ton CO2 today and rising to $65/ton by 2029.
A second option is to set the carbon charge price at the level required to achieve New York’s
decarbonization goal of 40% reduction from 1990 levels by 2030. This approach has its own
challenges. For one, a carbon price may initially be set too low or too high, resulting in carbon
emissions above or below the state’s decarbonization goals. The price could initially be set at an
acceptable price with an adjustment mechanism (ideally non-political) that reflects the amount
of abatement observed relative to goals and modeling projections. The separate challenge is that
New York’s decarbonization goals are economy-wide, while a carbon charge would only affect
power sector emissions. Any analysis on the appropriate carbon charge level would therefore
need to approximate what fraction of total state emissions reductions will come from the power
sector. It may be appropriate to set more aggressive decarbonization targets for the electric sector
as it is easier to decarbonize than other sectors. Targets should reflect that other sectors may
electrify to reduce emissions, thus increasing electric sector emissions but reducing economy-
wide emissions.
For the purposes of our analysis in this paper, we assume a price of $40/ton in 2025 (2025
dollars), roughly consistent with the 2025 SCC adopted in the CES Final Order minus projected
RGGI prices.59
B. RETURNING CHARGES TO CUSTOMERS
The deduction of a carbon charge in the NYISO’s settlement with generators would result in a
sizable carbon fund. One possible use of the fund, which we assume in this paper, is to aim to
mitigate customer cost impacts from carbon-elevated LBMPs. Exactly how refunds are allocated
58 U.S. Government (2015).
59 We calculate the 2025 SCC as the average of Tranche 4 and 5 SCC weighted by month ($54.7 and
$59.5/ton, respectively). We assume 2025 RGGI prices are $17/ton, based on our review of the 2016
RGGI Program Review. See RGGI (2016), and NYISO CARIS studies, see NYISO (2015b).

23 | brattle.com
among LSEs or EDCs, and from those entities to customers, would need to be resolved.
Presumably, both NYISO and the NYPSC would both have a role.
One consideration in designing refunds is the potential effects on energy efficiency and
electrification. Allocating revenues volumetrically in proportion to purchases could discourage
conservation, although it could encourage beneficial electrification of other sectors. Allocating
revenues non-volumetrically could encourage conservation. For example, California returns a
portion of allowance proceeds to residential customers through a twice-annual bill credit.60 An
alternative approach would be to use some of the collected funds to pay for energy efficiency
programs, other smart energy programs, or energy subsidies for low income residents.
A separate question is how to allocate carbon refunds among zones. The simplest approach would
be to allocate equally on a load ratio share basis. An alternative approach could target refunds in
a way that minimizes any variation in the carbon charge’s impact on net customer costs across
NYISO zones (with proportionally higher refunds Downstate than Upstate).61
C. PREVENTING EMISSIONS LEAKAGE TO NEIGHBORING ENERGY MARKETS
Applying a localized carbon charge introduces a risk of emissions leakage. Section II.C discussed
one type of leakage: if RGGI allowances are freed up for use in other states. We now discuss
leakage that could occur through energy imports and exports. Imposing a carbon charge on New
York generators would make them appear less economic than generators in other regions that do
not charge for carbon emissions. Elevated wholesale prices in New York would attract imports,
shifting generation and emissions out of state without necessarily achieving the intended carbon
abatement. Similar leakage threats surround exports, although this is less widely recognized. If
in-state generation is charged for carbon emissions and external resources are not, in-state
resources would become less competitive for serving external loads so exports would decline.
Costlier and perhaps higher-emitting external resources would then meet external demands.
From New York’s perspective, emissions will have decreased, but in reality emissions have only
been shifted out-of-state (and perhaps augmented if energy production is distorted to less
efficient resources).
1. Preventing Leakage from Imports
Both California and Ontario have identified the leakage concern regarding imports and address it
by imposing carbon charges on the embedded emissions within imported electricity. Importers
into Ontario are assumed to have a default marginal CO2e emissions rate, with each neighboring
region assigned different default marginal emissions rates for on-peak and off-peak periods.62
60 The twice-annual credits, known as the Residential California Climate Credit, made up 58% of
allowance values in 2013. See CARB (2015).
61 Refunds could be targeted by calculating a fourth LBMP component, the carbon component, and
refunding based on this component. See Rudkevich and Ruiz (2012).
62 Ontario Ministry of Energy (2016).

24 | brattle.com
These importers are then responsible for acquiring allowances sufficient to cover the embedded
emissions under Ontario’s CO2e cap-and-trade program. California’s approach to charging for the
carbon content of imported energy is discussed in Section III.B.Border pricing adjustments could
similarly be applied in NYISO’s day-ahead and real-time energy markets to prevent emissions
leakage. Border price adjustments would charge imports for embedded carbon at an assumed
emissions rate, placing them on level footing with internal New York generators.
One simple approach would be to charge importers and credit exporters the New York carbon
charge applied to the marginal emissions rate (MER) at the appropriate border nodes in the New
York power market.63 This would erase the effect of the carbon charge from the perspective of
imports, since importers would be charged exactly the same amount as the carbon premium
embedded in the New York energy price they would earn. This solution would be simple to
implement and could prevent the carbon charge from causing leakage. However, it would
provide no incentive for reducing the carbon content of imports since it would not distinguish
among imports with emission rates that differ from each other or from internal resources. For
example, if an external resource is cheaper than an internal one without a carbon charge, it will
still be cheaper with a New York carbon charge and a simple border adjustment, even if its
emissions rate is relatively high.
A more granular border adjustment mechanism could address these issues. Importers could be
charged based on the carbon content of the supplying resources and the difference in carbon
prices between the two markets. Determining the carbon content could be straightforward for
imports from new resources whose existence depends on a contract with New York buyers, in
which case a resource-specific emissions rate could be applied. For other imports, it would be
more appropriate to apply the emissions rate of the marginal resource in the market of origin. A
challenge with implementing this approach is determining the actual marginal emissions rate in
markets outside of NYISO’s control. NYISO currently does not have access to the necessary
information and thus would need to cooperate with neighboring ISOs to obtain it or else make
simplifying assumptions based on public data. Determining the actual marginal emissions rate in
neighboring systems can be less straightforward when special conditions occur, particularly
when storage resources or transactions with third systems are the marginal resources that are
affected by imports and exports. For example, one would have to determine whether imports
from Québec really produce near-zero emissions at the margin as one would expect from
incremental hydropower production. Marginal emissions might be higher if imports to New
York were supplied by diverting flows that could have gone to other neighbors.
A second challenge arises if the source market’s merit order intersperses gas and coal or other
fuels near the margin. In that case, even if the NYISO could learn the exact emissions rate of the
neighboring market’s marginal unit, marginal economics would not work well because the
neighbor’s supply curve would appear non-monotonic from New York’s carbon-pricing
63 The calculation of MER is described in Rudkevich and Ruiz (2012), where it is called Marginal Carbon
Intensity (MCI).

25 | brattle.com
perspective.64 No single rate would converge to a solution that avoids importing high-emitting,
coal-fired generation and also captures opportunities to import gas-fired generation when it is
lower-emitting than New York-internal marginal resources.
Given these challenges, a reasonable approach might be to apply a well-informed average
emissions rate, varying by neighbor and season and on-peak versus off-peak. Another alternative
would be the simple approach discussed above based on New York’s own marginal emissions
rates. As discussed, this does not distinguish external resources’ emissions rates from each other
or from internal resources, but it at least makes the carbon charge invisible to external markets
and thus prevents the charge from causing leakage. This is the solution we assume for the impact
analysis presented in Sections VI and VII, with the alternative solution presented as a sensitivity
analysis in Section VII.F.
2. Preventing Leakage from Exports
The export leakage problem can be solved similarly through border adjustments. To prevent
leakage, NYISO could credit exporters for the marginal carbon emissions that their exports avoid
in the destination market.65 Exporters would thus pay the full New York LBMP (including the
New York carbon adder at the export point), but they would receive the export credit and the
energy price in the destination market. For example, if the marginal emissions rate in the
destination market were the same as in New York, the exporter would earn the spread in brown
power prices, as if there were no carbon charge. This would prevent leakage by leveling the
playing field between internal generation and external generation for serving external load.
Resources would compete based on their fuel costs and emissions rates.
A simple approach is to assume the external marginal emissions rate is the same as the marginal
emissions rate faced by the exporting resource and the applicable carbon charge is the New York
carbon charge. A more elaborate approach could incorporate marginal emission rates in
neighboring systems based on what can be determined about the marginal resource in those
systems. Challenges with this more sophisticated approach include non-monotonicity effects and
having to determine the actual marginal emissions rate in neighboring markets, as discussed
above regarding imports.
We are not aware of other jurisdictions with carbon pricing that applies export charges, so it may
be difficult to convince policymakers to promote such a scheme as it might appear costly to New
York customers. However, remitting exporters the difference in regional carbon prices would not
actually impose additional costs on customers in New York. Without such an export policy in
place, internal generation would ramp down as exports are eliminated and no carbon charge
64 Supply curves are monotonic, with prices only increasing along the curve even if fuels alternate along
the curve. However, from New York’s perspective with large carbon adders applied to coal generation
and smaller adders applied to gas-fired generation, PJM’s curve would appear to jump up and down.
65 If the destination market had its own carbon price, New York’s export credit rate could be reduced to
the difference in carbon prices between the two markets.

26 | brattle.com
would be collected on the marginal generation (in addition to the economic impacts of potential
in-state plant closures). With this proposed treatment of exports, internal generation can
continue exporting and pay the carbon charge. The resulting carbon revenue can fully cover the
payment to the exporter.
With multiple solutions available to address leakage, resolving the details is beyond the scope of
this paper. These questions should be addressed by NYISO, the NYPSC, and stakeholders. There
are many solutions, at various levels of complexity, to prevent leakage.
3. Other Types of Leakage
Emissions leakage challenges are not unique to a carbon charge in the NYISO wholesale energy
market. The CES and RGGI themselves may have significant leakage challenges even without a
carbon charge, as discussed in Section II.C. Another question is whether a carbon charge on
electricity would cause leakage to non-electric fuels and impede electrification of the
transportation and space-heating sectors. Our analysis in Section VII indicates that net impacts
on customer electricity prices would be relatively minor, so we do not expect that cross-sectoral
leakage will be a major issue. For the same reason, economic leakage of industry to states with
lower electricity prices is unlikely to be a significant concern in the foreseeable future. However,
under an electric-sector, single-state carbon charge, these effects are still possible. The most
elegant solution to all of these concerns would be a uniform, national carbon charge on all
sectors, such as the carbon tax recently proposed by the Climate Leadership Council, if that were
politically feasible.66
D. DISTRIBUTED RESOURCES AND REV
One of the aims of the New York REV program is to reduce carbon emissions through distributed
energy resources (DERs). A NYISO carbon charge would support this goal by providing
additional revenues to incentivize investments in carbon-abating DERs. A carbon charge will
also incentivize efficient commitment and dispatch of DERs.
To illustrate the effect of a carbon charge on DER operations, consider storage resources.
Without a carbon charge, storage resources will dispatch according to energy prices based on
marginal fuel costs (and with renewable generation, sometimes setting negative prices based on
their REC price and production tax credit). If market prices included a carbon charge, storage
resources would be incentivized to shift load in such a way that reduces carbon emissions.
At present, New York utilities account for the positive externality of avoiding GHG emissions in
their DER benefit-cost analysis (BCA) framework. One of the three tests, the Societal Costs Test,
includes a cost of carbon alongside avoided energy costs.67 Adding a carbon charge could result in
double-counting the carbon value of DERs (once in the energy price and once with the cost of
66 CLC (2017)
67 NYPSC (2016b).

27 | brattle.com
carbon), unless the BCA framework is modified. It would be technically straightforward to do so.
If the carbon charge embedded in the energy price were less than the assumed cost of carbon, the
BCA framework could be adjusted to subtract the carbon charge, as is currently done with RGGI.
Making such modifications would require updated guidance from the NYPSC, as the framework
does not have an automatic adjustment mechanism as ZECs and RECs do.
Consistent with the idea of a carbon charge, the NYPSC has recently ordered the environmental
benefits of the subset of DERs previously eligible to participate in Net Energy Metering (NEM) to
be valued at the higher of Tier 1 REC prices or the SCC.68 The Order requires DER compensation
use the “Value Stack” approach, under which the value of DER injections must account for: (1)
energy value, based on the day-ahead hourly zonal LBMP, inclusive of losses; (2) capacity value,
based on retail capacity value ratings for intermittent technologies and/or the capacity tag
approach for dispatchable technologies based on performance during the peak hour in the
previous year; (3) environmental value, based on the higher of the latest REC price or the SCC;
and (4) demand reduction value and locational system relief value, based on the DERs’
corresponding performance during the ten peak hours and a de-averaging of utility marginal cost
of service studies. Adding a carbon charge to the energy market could result in double-counting
the carbon value of DERs (once in the energy price and once with the Value Stack), unless the
Value Stack approach is modified to recognize the presence of the carbon charge in wholesale
energy prices.
E. INTERACTIONS WITH OTHER DESIGN ELEMENTS AND PROCESSES IN NYISO The implementation of a carbon charge could affect the NYISO market in several other ways.
These include:
ICAP Market: A carbon charge will not necessarily require any changes to the NYISO
capacity market. However, there are interactions between energy markets (including
effects of carbon prices) and capacity markets. For example, carbon pricing may reduce
capacity prices, as the net cost of providing capacity decreases for new entrants with
relatively low emission rates and enhanced net energy revenues.
Transmission Planning: Introducing a carbon charge will not necessitate changing the NY
transmission planning process, although transmission planning will be important for
enabling a low-carbon future. We suggest that future transmission planning account for a
carbon abatement value even if a carbon charge is not incorporated into the actual energy
commitment and dispatch. However, adding a carbon charge to the commitment and
dispatch is ideal because it will signal where transmission upgrades provide the greatest
carbon abatement value through increased LBMPs.
Flexibility Incentives: Flexibility incentives will become important in a low carbon
future, whether carbon is priced into the commitment and dispatch or not. Having more
intermittent wind and solar will require the rest of the system to become more flexible.
68 See NYPSC (2017), p. 15.

28 | brattle.com
The key market design questions will be: are any new types of services needed? How
much of each type of service is needed? How do needs vary with system conditions?
What is the best way to attract and retain the needed services? CAISO has imposed
planning requirements for 3-hour ramping and has added a ramping product to its suite of
ancillary services in its daily/hourly unit commitment, dispatch, and settlement processes
since the end of 2014.69 MISO added a similar ramp product to its real-time market in
2016, but did not add a planning requirement for flexible capacity.70 Electric Reliability
Council of Texas (ERCOT) recently examined whether to redesign its ancillary services
but decided on only minor changes.71
F. INTERACTIONS WITH RENEWABLE ENERGY CREDITS
A carbon charge would increase LBMPs and thus increase energy revenues for clean resources,
including new Tier 1 renewable resources supported by RECs. All else equal, expectations for
increased energy revenues would allow Tier 1 renewables to enter the market at lower REC
prices. Thus, any new REC contracts could be signed at lower prices as soon as a carbon charge
and a schedule of future prices are agreed upon. We assume prices for fixed-price REC contracts
that are already in place or signed before a carbon charge is planned would not be affected.
In our static analysis (Section VII.B.4), we assume that each dollar of expected increase in
wholesale energy prices would reduce REC prices for new resources by a dollar. In reality, the
actual offset in REC prices resulting from a carbon charge could be somewhat lower due to
differences in risk. A REC price is guaranteed for the duration of a REC contract (such as 10
years), whereas future carbon charges are not guaranteed.72
However, there are ways to insulate investors from the regulatory risk surrounding future carbon
pricing policies and to assure customers that future REC prices will fall dollar-for-dollar as
carbon charges raise energy prices. One could redefine the REC product so that the price adjusts
automatically with changes in carbon prices through a long-term contract for differences. Over
time, a resource’s payments would adjust with changes in the price that the rest of the market
sees for carbon:
REC Payment per MWh = (contract carbon abatement price – carbon price facing the rest of the market) * MER, where
Tier 1 renewable energy resources would compete with each other to provide the lowest
long-term contract price of carbon abatement.
69 CAISO (2017b).
70 MISO (2017).
71 See Newell, Carroll, Ruiz, and Gorman (2015a).
72 We are not aware of a definitive way to estimate the effect of this risk on the cost of capital. There
have been some attempts to quantify increased revenue risks for renewable resources more broadly.
For example, see Varadarajan et al. (2011).

29 | brattle.com
The market carbon price is the sum of the NYISO carbon charge and RGGI or any other
applicable carbon allowance prices affecting wholesale energy prices. The market price
could be updated annually or monthly.
The MER is the marginal emissions rate at the times and locations where the Tier 1
resource actually generates; NYISO would have to provide the MER data for settlement
purposes.
In addition to managing carbon price risk, this approach provides efficient incentives. It favors
resources with lower capital costs, higher capacity factors, and higher energy and capacity value,
just like traditional REC contracting does. But unlike the REC approach, the MER factor in this
approach rewards resources that displace the most carbon at the margin. This idea was developed
by The Brattle Group and others in the Integrating Markets and Public Policy (IMAPP) process
in New England.73
G. WHETHER TO INCLUDE UPSTREAM EMISSIONS
Carbon pricing would assess a charge on the CO2 products of combustion. Carbon pricing could
also be applied to GHGs other than CO2 and to non-combustion related emissions produced over
the lifecycle of each fuel and generation technology. Other GHGs, such as fugitive methane, are
emitted during upstream processes such as extraction and transportation. Hydropower can emit
methane over its lifecycle due to the flooding of vegetated land. Even some renewable generation
may involve relatively small amounts of emissions during mining, refining, manufacturing, and
transportation activities. However, such emissions are beyond the current scope since New
York’s executive orders establishing decarbonization objectives do not address upstream
emissions. A NYISO carbon charge would presumably follow this and address only direct
emissions of CO2 from combustion. We adopt this assumption in our analysis in the next
sections.
If that changes in the future, methods must be developed to incorporate lifecycle emissions. One
substantial challenge would be to track emissions accurately. There are no generally accepted
methodologies. For example, the lifecycle emissions of natural gas vary widely across studies and
production facilities.74 Another challenge would be to determine whether some emissions are
already included in commodity prices, which may be possible in a future with more widespread
regulation of greenhouse gases.
73 See Spees and Chang (2017).
74 Weber and Clavin (2012).

30 | brattle.com
VI. Benefits of Pricing Carbon into the Wholesale Energy Market
A NYISO carbon charge would directly price carbon emissions and encourage the competitive
market to find the widest possible set of low-cost, innovative carbon abatement measures. This
should reduce the total economic cost of meeting decarbonization goals relative to reducing
emissions only through REC procurements and other existing policies.
A carbon charge would likely incentivize the following types of operational and investment
changes to abate emissions at a cost at or below the price of carbon:
Shifting unit commitment and dispatch toward lower-emitting existing resources.
Tilting investment in renewable resources (procured under CES using Tier 1 RECs)
toward those that generate at the times and places that displace the most carbon.
Supporting investment in new, efficient gas-fired combined cycle generation that can
displace higher-emitting existing generation and imports.
Supporting investment and operation of distributed energy resources, including storage
and demand response.
Promoting energy efficiency through higher per-kWh charges, even if demand charges,
customer charges, or overall customer costs decrease.
Encouraging other innovative solutions and idiosyncratic decarbonization opportunities
that are difficult to imagine today.
Some types of benefits that might apply to other regions might not apply to New York, given its
generation fleet and existing policies to decarbonize. In New York, a carbon charge is unlikely to
induce coal-to-gas dispatch switching—emissions from coal-fired generation have already
decreased more than 90% (from 22.4 to 2.1 million tons) since 2000.75 Now, only three coal-fired
units remain in operation, and Governor Cuomo proposes to eliminate the remaining coal
generation through retirement or repowering to natural gas.76 Nor is a carbon charge likely to
attract major additional new renewable energy imports, since the CES supports such projects
under long-term REC contracts.77
Nevertheless, considering the six types of operational and investment effects noted above, we
estimate that a carbon charge could reduce CO2 emissions by 2.6 million tons per year (8% of
today’s emissions) by incentivizing cost-effective market responses not available through the CES
75 ABB Inc.,Velocity Suite (2017).
76 Three coal plants are currently operational in New York: Cayuga, Kintigh (Somerset), and Kodak Park.
In February 2016, the NYPSC rejected a proposal to repower the Cayuga plant as a natural gas plant,
and instead selected a transmission line to replace the unit. See WSKG (2015). See Governor Cuomo
(2016) for announcement of retirements.
77 The exception is new hydro impoundments, which are not eligible for RECs. See CES Final Order, p.
106, NYPSC (2016a).

31 | brattle.com
and RGGI alone. Below we describe the impacts of a carbon charge and develop approximations
of how much additional carbon could plausibly be avoided.
A. SHIFTING COMMITMENT AND DISPATCH
A carbon charge could reduce NYISO emissions by influencing the commitment and dispatch
within the gas- and oil-fired fleet. This effect may be more limited because the merit order
among New York resources is highly correlated with emissions rates, even without a carbon
charge, due to the relative prices of gas and oil. The merit order is as follows: clean resources, low
heat-rate gas-fired combined cycles, higher heat-rate gas-fired steam, gas-fired combustion
turbines and oil-fired steam, then oil-fired combustion turbines. A carbon charge would likely
not change the merit order very much except for three effects: (1) wherever oil and gas-fired
generation compete, a carbon charge will favor the gas-fired generation, since its emissions rate
is about 30% lower than that of oil; (2) where tradeoffs exist between gas-fired generation paying
different fuel prices, a carbon charge will favor the one with a lower heat-rate—a substantial
issue in New York, given the diversity of fuel prices across the state; and (3) a carbon charge
might induce different commitment tradeoffs between startup costs and incremental heat rates,
such as favoring a relatively efficient gas-fired steam generator over an inefficient oil-fired
peaker with lower startup costs. These effects are subtle and would require a production cost
simulation to estimate them, which is outside the scope of our study. Our estimated emissions
reductions therefore do not account for these effects.
As discussed in Section V.C, we assume the NYISO would establish border charges to make
existing importers and exporters unaffected by the imposition of a carbon charge in New York;
under this assumption, imports and exports would remain unchanged. Later, in Section VII.F, we
discuss an alternative case with differentiated border pricing to attract additional clean resources.
B. TILTING INVESTMENT IN RENEWABLE RESOURCES TOWARD THOSE WITH GREATER ABATEMENT RATES
The REC program in the CES compensates generators for producing clean electricity, but not
necessarily in a way that maximizes carbon abatement. RECs are paid to Tier 1 resources based
on their total volume of generation, with one megawatt hour equal to one REC regardless of
whether that generation offsets high-emitting fossil generation, lower-emitting fossil generation,
or other clean generation.
Even without carbon pricing, LBMPs signal for renewable resources to locate where energy
prices are higher. LBMPs are highest when and where market heat rates are highest and over-
generation by renewable resources is least prevalent, generally corresponding to the locations
with the highest marginal emission rates (and greatest abatement potential per MWh of clean
generation). A carbon charge would amplify this signal to account for the value of carbon, not
just the marginal cost of fuel, and thus provide a more appropriate investment signal aligned with
New York’s decarbonization objectives. For example, if the MER difference between the
locations (and time profiles) of two different resources is 0.2 tons/MWh on average, a $40/ton
carbon charge would increase the rewards for the higher one by $8/MWh more than the other.

32 | brattle.com
We estimate differences in applicable marginal emissions rates among resources based on two
different analyses: modeled 2015 hourly marginal emissions rates (see Section VII.A.3) and New
York’s 2010 Wind Study.78 Based on 2015 hourly marginal emissions rate data, Downstate solar
PV generation in 2015 would offset 0.12 tons/MWh more CO2 than Upstate wind generation.
Variation in avoided marginal emission rates across individual renewable resources may be
greater at the local level due to transmission constraints. Furthermore, variation may grow as
more renewables are built. The 2010 NYISO Wind Study finds marginal Upstate wind
curtailments could increase significantly as installed wind approaches 6,000 MW. At the levels of
marginal curtailment implied by the NYISO Wind Study, variation in avoided MERs could rise
above 0.3 tons/MWh.
Based on these observations, we posit the following plausible effect of a $40/ton carbon charge:
2,000 MW of onshore wind generation investment (with a 31% capacity factor) shifts to types
and locations that avoid 0.15 tons/MWh more CO2 than absent a carbon charge. Under these
assumptions, we estimate annual carbon savings of 0.8 million tons/year.79 We recognize that this
estimate is highly uncertain and we examine the implications of alternative assumptions in
Section VII.F.
We did not count the avoided costs of transmission investment that might be obviated by
shifting generation from constrained locations to improved locations, as doing so would double-
count the benefits of a carbon charge.
C. SUPPORTING INVESTMENT IN COMBINED-CYCLE GENERATION (CCS)
With carbon pricing, lower-emitting generation such as CCs would benefit from higher
electricity prices when higher-emitting generation is on the margin. If this attracts investment in
CCs, the new entrants will displace higher-emitting generation whenever they operate. The key
questions are:
1. Will new CCs be economic in 2025?
2. How much incremental CC investment will a carbon charge attract?
3. How much carbon emissions will that displace?
Will new CCs be economic in 2025? Based on investment activity in the NYISO market, new
CCs appear to be economic now, as evidenced by CPV Valley under construction and Cricket
Valley having just closed on financing even prior to the Governor’s agreement with Entergy to
shutter Indian Point.80 We assume that CCs are likely economic in 2025 even before a carbon
charge. We assume new CCs would be just earning their cost of new entry (CONE) in each
capacity zone from the combination of energy and capacity prices in our Base Case.
78 NYISO (2010).
79 31% capacity factor, derived from NREL (2010a) wind generation profile for Upstate New York.
80 See SNL (2017).

33 | brattle.com
We recognize the possibility, however, that new CCs may not be economic in 2025. One reason
could be if the market remains in surplus and capacity prices remain as low as they are today.
Another could be that new CCs become dominated by other technologies. In the very long run,
we expect energy supply to be composed primarily of clean resources for energy, supported by
storage and demand response for shifting energy and for providing capacity and ancillary
services. To account for this possibility, we assume a 33% chance that CCs will not be economic
in 2025 and that a carbon charge would not attract any CCs to enter. We also test the impacts of
smaller and larger probabilities.
How much incremental CC investment will a $40/ton carbon charge induce? A carbon charge
will increase net energy revenues to inframarginal resources with relatively low emission rates,
such as CCs. In turn, higher net energy revenues from a carbon charge will attract incremental
CC entry until market prices equilibrate with CCs earning CONE. We conducted an indicative
analysis of these effects.
To estimate CCs’ increased net energy revenues with a $40/ton carbon charge, we rely on the
static analysis. We conduct a virtual dispatch of a new CC (with a heat rate of 6,800 Btu/kWh)
against synthesized hourly prices for 2025 as discussed in Section VII.A below, both with and
without a carbon charge. We estimate that the carbon charge would increase new CCs’ net
energy revenues $21-34/kW-yr, depending on the zone. The increase is greatest in Zone K,
where marginal emissions rates (MERs) are highest and CCs earn money on the spread between
their emissions rate of 0.40 ton/MWh and an average MER of 0.52 while they are running (vs.
only 0.48 while running in Upstate zones).
To estimate how much entry this revenue enhancement could support before prices equilibrate,
we consider the rate at which both energy and capacity prices decrease with incremental entry.
Estimating the energy price impact of new CC entry requires simulation analyses; we relied on
the results of a prior study that Brattle conducted in 2015 as part of the NYPSC’s AC
Transmission Proceeding.81 That study included two 2024 cases, with and without a new 720
MW CC in Zone G, and with all else equal. The difference between those two cases showed an
energy price impact of about 1% on a load-weighted average basis. Here, we assume the same
percentage reduction in energy prices per MW of CC added, applied to our estimated 2025
energy prices. We assume adding a CC in one zone reduces prices in all zones, but slightly less so
in zones that are electrically distant.
At the same time, we estimate the decline in capacity prices according to the slopes of the
capacity demand curves,82 with one complication: as prices decline, competing resources might
exit or decide not to enter. Lacking detailed data on competing resources’ reservation prices, we
assume half of a MW of peaking capacity is displaced by each MW of CC entry. This reduces the
81 See Newell, et al. (2015b)
82 We use the 2017/2018 zonal demand curves, scaled to 2025 consistent with the 2016 Gold Book’s load
forecast and 2.5% inflation of prices.

34 | brattle.com
rate of change of capacity price decline by half. Section VII.F tests the sensitivity to alternative
assumptions with no displacement or perfect displacement.
Given these assumptions, we add different amounts of capacity in zones K, J, Lower Hudson
Valley (focusing on G) and the rest of NYCA (focusing on C) until the market fully re-
equilibrates.83 The result is 370 MW in zone C, 140 MW in zone G, 270 MW in zone J, and 280
MW in zone K, for a total of 1,060 MW. This estimate does not account for lumpiness of plant
investments or the many siting factors that may result in more capacity in added in some zones
or less in others.
Finally, we reduce these estimates by 33% to account for the assumed probability noted above
that CCs will not be economic in 2025 and that a carbon charge would not attract any
incremental entry. That results in probability-weighted expected entry of 250 MW in zone C, 90
MW in zone G, 180 MW in zone J, and 190 MW in zone K, for a total of 710 MW.
How much will 710 MW of new CCs reduce emissions? We estimate avoided emissions based on
an assumed marginal emissions rate of the resources the CCs would displace, compared to the
CCs themselves. We estimate that the 710 MW of new CCs would generate 5.1 TWh, reducing
emissions by 0.08 to 0.12 tons/MWh when running (average market emissions rate of 0.48 – 0.52
tons/MWh across zones when running minus new CC emissions rate of 0.40 tons/MWh),
reducing total CO2 emissions by 0.5 million tons annually.
We also considered whether a carbon charge might incentivize some high-emitting existing
generation stations to repower, converting old gas and oil-fired steam generation or combustion
turbines into combined cycle generation. Those located in New York City and Long Island are
particularly interesting possibilities, where space is scarce and where the existing units affect air
quality. However, it seems unlikely that a carbon charge would cause these sites to repower if
repowering sacrifices capacity revenues for existing generators. The net gain in capacity revenues
could be zero, in which case incremental net energy revenues would have to be high enough to
pay for the entire powering investment. An exorbitantly high carbon charge would be needed to
justify such an investment. Therefore, we consider such a possibility unlikely unless the existing
capacity becomes inoperable or requires very expensive capital expenditure.
D. INCORPORATING STORAGE AND DEMAND RESPONSE
Carbon pricing would send pricing signals to demand response (DR) and storage to operate in
ways that account for carbon. DR and storage can displace inefficient fossil generation by
arbitraging between hours with varying carbon emissions rates. A particularly attractive concept
is building and operating DR or storage in dense, high-load areas, such as New York City, where
83 The solution involves four equations: CCs in each location must earn CONE, with the energy and
capacity prices declining as capacity enters until the declines fully compensate for the CCs’ static gain
in carbon value. There are four unknowns: the amounts of CC capacity added to each zone. Excel
solver finds the solution, recognizing the nesting of zones.

35 | brattle.com
fossil-fired generation is often on the margin and utility-scale resources are less attractive due to
siting concerns. In this type of setting, distributed storage or DR could directly displace higher
emitting units and would be incentivized to operate in these areas based on increased electricity
prices. Storage and DR would be incentivized to reduce emissions by dis-charging (or shifting
load) at times when high-emitting resources are marginal in the energy market and re-charging
when low-emitting resources are marginal.84 Flexible storage and DR could further avoid carbon
emissions by providing peaking services and ancillary services, thus reducing the number of
traditional generators that must be synchronized (and generating at minimum load) to provide
similar services.85
A substantial carbon charge could potentially spur investment in Downstate demand response
and storage to eliminate some of the dirtiest in-city generation. For example, 500 MW of storage
in New York City could offset 0.1 million tons of CO2 if operated to discharge in 10% of the
highest priced hours and charge in the 10% of lowest priced hours (assuming 20% roundtrip
losses). Emissions savings come by arbitraging between an average marginal emissions rate of
0.26 tons/MWh when charging and 0.64 tons/MWh when discharging (derived from the lowest
10% and highest 10% of hours, respectively, in NYISO’s 2015 marginal emissions data).
Displacing less efficient oil- and natural gas-fired generation in Zones J and K could provide
other benefits. Based on 2015 generation patterns, replacing natural gas steam generation with
combined-cycle generation would reduce NOx emissions by 37%. This reduction would largely
occur in the densely populated areas of New York City and Long Island, as shown in Figure 8.
Figure 8 Share of 2015 Emissions Avoided If All NY Steam & CT Generation Replaced with Gas CCs
Sources and Notes: EPA Continuous Emissions Monitoring Service data accessed from ABB Inc., Velocity Suite (2017). Excludes plants <25MW, and plants providing steam but no electricity.
84 The NYISO Emergency Demand Response Program has a minimum price of $500/MWh or the LBMP;
carbon pricing would increase the LBMP.
85 Generating units require time to start-up and respond to requirements to increase output. To avoid
this lag and respond to signals more quickly, units are left running at minimum load. In this situation,
DERs could become less expensive than emergency demand response programs.
CO₂ SO₂ NOx
Coal 4% 56% 14%
Oil/Gas CT 3% 3% 11%
Oil/Gas ST 7% 38% 37%
Total 14% 97% 62%
36 | brattle.com
E. INCENTIVIZING ENERGY EFFICIENCY AND CONSERVATION
Low electricity rates can encourage consumption while high electricity rates can encourage
efficiency and conservation. We assume carbon charges would be refunded to customers, and
this could potentially discourage conservation if distributed on a per-kWh basis. However, it is
possible to structure carbon charge refunds in such a way to encourage conservation. Carbon
charges could be returned non-volumetrically through a per-customer refund.86 Then the
volumetric per-kWh rate would increase, more fully reflecting the marginal cost of energy
including externalities. This would give customers an incentive to reduce energy consumption.
(The downside to this approach is that it might discourage electrification from other sectors that
do not face carbon pricing.)
We conservatively assume that only large customers would be attuned to an increase in
volumetric rates and thereby incentivized to reduce their energy consumption. Such customers
represent approximately 52 TWh per year, a third of total New York load. For such customers, a
$40/ton carbon charge could increase energy rates by 1.5¢/kWh (increase in wholesale prices due
to carbon charge, net of savings from lower REC and ZEC prices) while reducing capacity
demand charges and providing non-volumetric payments for their share of carbon revenues (see
Section VII). If their base energy rates are 9.4¢/kWh, this amounts to a 16% increase on the
energy portion of their rate.87
We then estimate the customer response to such a change in rates using the long run elasticity of
demand. The long run elasticity of demand represents the change in customer usage for an
increase in customer bills; the elasticity of demand for electricity is often estimated in the range
of −0.3 to −0.8 for residential and commercial customers (i.e., as the electricity price increases by
one percent, customer usage decreases by between 0.3 and 0.8 percent).88 In New York, other
state efforts, such as tightening building codes, will partially reduce the potential for additional
price-driven customer response, suggesting an elasticity of demand at the low end of the range, at
−0.3. We apply this elasticity to our estimated 16% increase in volumetric rates. The result is a
2.5 TWh reduction in load (approximately 5% of large customer load). Assuming this load offsets
the load-weighted average MER of 0.47 tons/MWh, this translates to 1.2 million tons of annual
CO2 reductions in 2025.
We did not estimate the effect of a carbon charge on utility energy efficiency programs since
such programs already (or could) consider the social cost of carbon in their benefit-cost analyses.
86 The PSC may be able to mandate such a rate structure if it returns carbon charges through the electric
distribution companies, but probably not if through LSEs. Competitive LSEs can structure their rates
as they wish.
87 A 9.4¢/kWh base rate is estimated based on 2025 all-hours-average LBMPs (see Section VII.A.2) plus
30% for ancillary services, ISO charges, and other charges.
88 Based on Brattle survey of price elasticities.

37 | brattle.com
F. SPURRING OTHER INNOVATIVE AND IDIOSYNCRATIC OPPORTUNITIES
Perhaps the greatest benefit of pricing carbon in the wholesale markets is that it will spur the
market to innovate and find solutions that we cannot imagine today. We have seen this in
capacity markets. Few observers anticipated so much unconventional capacity in demand
response, uprates, retained imports, and life extensions of existing resources.89 We have tried to
include such diversity in our prior categories, but we could not possibly have accounted for all
possibilities. New technologies may emerge, and existing resources may find idiosyncratic
opportunities we cannot anticipate. Our estimates do not account for these possibilities.
G. RESULTING IMPACTS ON ECONOMIC EFFICIENCY
Considering the six types of cost-effective operational and investment effects described above,
we estimate that a carbon charge could reduce CO2 emissions by 2.6 million tons per year (8% of
today’s emissions). This estimate is probably conservatively low because it does not yet account
for the potential redispatch of existing resources, nor does it include innovative responses that
the market might elicit but that we have not imagined. However, the benefits could also be
lower, as the dynamic analysis is inherently assumption-driven, uncertain, and assumes no
incremental emissions leakage to other geographies or sectors. We examine the implications of
uncertainties in our sensitivity analyses in Section VII.F.
The incremental emissions reductions induced by a carbon charge could be used to produce
greater environmental benefit; economic efficiency would improve to the extent that emissions
reductions are valued at their social cost. Additionally, carbon-price-induced emissions
reductions could be used to meet a fixed emissions target at lower cost by replacing costlier
measures. For example, if RECs were being procured beyond the CES targets in order to meet
economy-wide carbon reduction goals, the carbon-charge-induced reductions could enable
meeting New York’s emissions reduction target without buying as many RECs. Assuming RECs
avoid emissions at wind’s average avoided marginal emissions rate of 0.42 tons/MWh, 6.3 TWh
of RECs would need to be procured to achieve the same level of emissions reduction of 2.6
million tons per year.
Replacing 6.3 TWh of RECs with a carbon-equivalent amount of carbon-price-induced
abatement could save roughly $120 million per year in total economic costs per year, assuming
the price-induced abatement measures cost $19/MWh less than the RECs (based on a $19/MWh
estimated REC price in the presence of a carbon charge, as discussed in Section VII.B.4). This
assumes the Tier 1 resources are just earning enough revenues to justify investment with REC,
energy, and capacity payments. It similarly assumes that all of the carbon-price-induced
abatement needs the full carbon price to be economic. Total economic savings could be greater
under the realistic assumption that some of the price-induced abatement measures cost less than
the carbon price.
89 Pfeifenberger, et al. (2011).

38 | brattle.com
This estimate expresses economic efficiencies of meeting New York’s energy and environmental
goals. It does not, however, express how those efficiency gains are shared among consumers and
producers. It therefore also does not address whether a carbon price in New York could
unacceptably raise costs to consumers by transferring wealth to existing clean energy resources.
We separately assessed the potential impact of a carbon charge on customer costs in the
following section.
VII. Impact on Customer Costs
We analyze the effect of a $40/ton carbon charge in 2025 on customer costs and emissions as
compared to a scenario with the CES and RGGI alone. The $40/ton charge represents the
difference between the CES’s 2025 Social Cost of Carbon of $58.0/ton less the $17.4/ton RGGI
price.90
Our analysis has two parts: a static analysis of how prices and customer costs change assuming no
adjustments to operations or investment, and a dynamic analysis of how a carbon charge may
incentivize changes to dispatch and investment that reduce carbon emissions and affect prices.
In the static analysis, the carbon charge increases energy clearing prices according to the
emissions rate of the marginal, price-setting resources in the market, which we estimate using
2015 data. 2015 provides a good proxy for 2025 since the amount of fossil generation is similar,
with new renewable generation just compensating for the retirement of Indian Point.
The cost of higher energy prices is partially offset by returned carbon revenues collected on
internal fossil generation and imports.91 Customers are further insulated by reduced REC and
ZEC contract costs, whose prices fall in response to higher energy prices, and a slight increase in
the value of transmission congestion contracts (TCCs).
The dynamic analysis assumes several plausible impacts. Investment in gas-fired CC generation
entry may increase as carbon prices reward CCs for their relative efficiency. If new CCs were at
economic equilibrium without a carbon charge, this additional revenue would attract more entry
by CCs until wholesale energy and capacity prices re-equilibrate at a lower level than indicated
by the static analysis. The increased investment in CCs would also reduce overall emissions as it
displaces generation by less efficient fossil resources. Additional emissions reductions derive from
90 The CES Final Order assigns an SCC of $54.66/ton to tranche 4 (April 1, 2013 to March 31, 2025) and
$59.54/ton to tranche 5 (April 1, 2025 to March 31, 2027). We calculate an average 2025 SCC of
$58/ton by weighing tranche 4 and 5 prices by each tranche’s number of months in 2025. Our
estimated RGGI price is the average of the $16.3/ton price assumed by the RGGI program review, see
RGGI (2016), and $18.5/ton assumed by CARIS 2024 (2025 dollars), see NYISO (2015b).
91 Our base analysis applies New York’s marginal emission rates to all imports and no emissions on
internal generation providing exports, as discussed below. We consider differentiated rates among
neighbors in an alternative case.

39 | brattle.com
attracting better-sited and more effective types of renewable generation for offsetting carbon
emissions and from incentivizing energy efficiency, demand response, and storage. Such carbon-
price-induced abatements—beyond those achieved by the CES alone—can lower customer costs
by reducing the amount of RECs needed to meet a given decarbonization target. We value these
abatements as the number of RECs avoided times the price of RECs.
Considering both static and dynamic effects, we find that imposing a $40/ton carbon charge
would have approximately zero net impact on customer costs as compared to the CES and RGGI
alone. We estimate a change in average costs of −$1.5/MWh to +$4.6/MWh around a central
value of $1.7/MWh (or equivalently −0.15 to 0.46¢/kWh with a central value of 0.17¢/kWh),
amounting to a −1% to +2% change in customer costs.92 This somewhat surprising finding can be
explained as follows: although average wholesale energy prices would increase, about 50% of the
cost could be offset by returning carbon revenues to customers; another 18% would be offset by
reduced prices for RECs and ZECs in the presence of higher wholesale energy prices, and
increased TCC revenues; finally, another 23% would be offset by dynamic effects on investment
signals. Each effect is estimated in 2025 dollar terms divided by 157 TWh annual New York load
in 2025. Figure 9 below shows the components of customer costs.
Figure 9 Estimated Customer Cost Impact of a $40/ton Carbon Charge in 2025 under the Assumptions Made, Compared to Existing Policies Alone
92 Percent change in customer bills based on a rough indicative estimate of 2025 average costs of
20 ¢/kWh.

40 | brattle.com
A. KEY ASSUMPTIONS ABOUT 2025
Our analysis is based on numerous assumptions about market conditions in 2025 and about how
a carbon charge would affect investment and the operation of the electric system. As in any
study, our assumptions are subject to uncertainty and change over time. Different assumptions
will lead to different results; the sensitivity of some, but not all, of our assumptions are tested in
Section VII.F.
1. Supply and Demand
Consistent with the 2016 Gold Book, we assume load will fall from 162 TWh in 2015 to 157
TWh in 2025 (−3%).93 We assume net imports, hydro generation, and “other” generation will be
the same as in 2015, at 19, 26, and 3 TWh respectively.94 We assume nuclear generation declines
by 16 TWh (to 28 TWh) due to Indian Point’s planned retirement, but that 18 TWh of new
renewable generation enters (on top of about 4 TWh existing) to offset this loss of nuclear
energy. We assume remaining coal units retire, and that 1,750 MW of planned CCs enter the
market.95 These assumptions imply fossil generation of 59 TWh in 2025, an 8% decrease from
2015.
2. Wholesale Electricity Prices
Our assumptions on energy prices in the 2025 Base Case (absent a carbon charge) are based on
2015 data with adjustments for projected changes in natural gas prices, RGGI prices, and variable
O&M costs. We assume the fuel component rises 85% from 2015 to 2025 along with forecasted
changes in gas prices.96 We assume RGGI prices rise from $6/ton in 2015 to $17/ton in 2025.97
With these changes and similar market heat rates, LBMPs would increase. For example, the
NYCA-wide load-weighted average LBMP rises from $38.4/MWh in 2015 to $72.2/MWh in 2025
(in nominal terms).98 These prices affect the base ZEC and REC prices, as discussed below.
93 See New York ISO (2016a) and EIA (2016).
94 Other generation includes methane, refuse, and wood. See 2016 Gold Book, New York ISO (2016a).
95 We assume the announced CPV Valley and Cricket Valley CCs are completed, totaling 1,750 MW.
96 Upstate New York gas price of $2.91/MMBtu in 2015 and $5.38/MMBtu in 2025, ratio of 1.85. See EIA
(2017a), Table 55.8.
97 2015 RGGI prices are the average of clearing prices from Auctions 27–30, see RGGI (2015). Our
estimated 2025 RGGI price is the average of the $16.3/ton price assumed by the RGGI program
review, see RGGI (2016), and $18.5/ton assumed by CARIS 2024 (2025 dollars), see NYISO (2015b).
98 2025 LBMP calculated as ($38.6/MWh − $6/ton × 0.47 tons/MWh − $3.0/MWh assumed 2015 VOM) ×
($5.38/MMBtu / $2.91/MMBtu) + $17/ton × 0.47 tons/MWh + $3.7 assumed 2025 VOM).

41 | brattle.com
For capacity prices, which affect ZEC and REC prices in our analysis, we adopt the DPS’s forecast
from its CES study: NYCA capacity prices rise from $35/kW-yr in 2015 to $105/kW-yr in 2025.99
We assess the implications of alternative capacity prices in Section F.
3. Annual Carbon Emissions and Marginal Emissions Rates
Our assumptions on supply and demand imply 29 million tons per year of internal New York
carbon emissions, a 14% decrease from 2015 levels (34 million tons).100 We scale 2015 emissions
downward because of anticipated changes in generation resource mix and load, including:
Fossil generation falls to 59 TWh from 64 TWh in 2015 due to increased Tier 1 renewable
generation and lower load (the retirement of Indian Point is an offsetting effect)
Cleaner fossil generation due to planned new CCs that generate roughly 11.5 TWh of
energy, replacing 2 TWh of coal generation and 9.5 TWh of other fossil generation (at a
marginal emissions rate of 0.47 tons/MWh)
Imported emissions remain constant at 11.3 million tons/yr between 2015 and 2025.
A critical component of this study is the emissions rate of the marginal, price-setting resource in
New York’s energy market—more precisely the marginal emissions rates in each hour and each
location, since they will affect the LBMPs customers pay and generators earn. To estimate
marginal emissions rates, we conducted a detailed analysis of five-minute 2015 marginal unit
data provided by NYISO and unit-level emissions rates to estimate MERs in each zone every
hour.101 For simplicity, we assume hourly MERs in 2025 are the same as in 2015, except that
when coal is marginal, we assume it is replaced by a new gas CC.102 In reality, marginal emissions
rates would likely be somewhat lower on average as total fossil generation and total emissions in
2025 will be lower than in 2015; however, marginal emission rates may be higher at times when
new renewable generation is producing less energy than Indian Point at the corresponding time
in 2015. Section F will examine the sensitivity of customer costs to lower (or higher) marginal
emissions rates.
99 Capacity prices in ICAP terms. 2015 prices calculated as average of NYCA price for Winter 2014/15
and Summer 2015, $38.4/kW-year in UCAP terms, and then converted to ICAP terms using the
seasonal translation factors. 2025 UCAP price of $114.7/kW-year from DPS forecast, converted to
ICAP terms using average of Summer 2015 and Winter 2015/16 translation factors. See New York DPS
(2016).
100 34 million tons represents 2015 emissions from NYISO fossil fuel, excluding emissions from units
providing steam but no zero electricity. EPA CEMS, accessed through ABB Inc, Velocity Suite (2017).
101 5-minute marginal unit data from NYISO. Unit-level emissions rates calculated from EPA CEMS
database, accessed via ABB Inc, Velocity Suite (2017).
102 We assume a new gas CC has a heat rate of 6.8 MMBtu/MWh and emissions rate of 0.4 tons/MWh.
This heat rate is consistent with new gas CCs evaluated in the 2016 NYISO Demand Curve Reset
study. See New York ISO (2016b).

42 | brattle.com
For each five-minute interval, we assign a marginal emissions rate to each zone without an
internal marginal supplier. In intervals when a zone has multiple marginal units, we use the
average rate of those marginal units. When a zone does not have any marginal units, we assume
prices are set by marginal units in adjacent zones. For Upstate Zones A–E, we assume imports
from the adjacent Upstate zone are the marginal supply.103 For example, Zone C would be
assigned Zone B’s marginal unit. If no unit is marginal in Zone B, Zone C would be assigned
Zone A’s marginal unit, and so on. If no units are marginal Upstate of a zone, we assign from the
neighboring Downstate zone. For Downstate Zones F–K, we assume imports from the adjacent
Downstate zone are the marginal supplier. For example, Zone H would be assigned Zone J’s
marginal unit. If, for example, a given interval has two marginal units, one in Zone A and one in
Zone J, we assign Zone A’s marginal unit to Zones A–E and Zone J’s marginal unit to Zones F–
K.104
We approximate the implied MER for the 20% of intervals when hydropower is on the margin in
a zone, most commonly the Niagara facility. Although hydro generation itself has no emissions,
flexible hydro with either storage or daily take limits can schedule its generation to occur when
the marginal emissions rate is high. For these units, offsetting one MWh of generation in an off-
peak period can allow the unit to generate an extra MWh on-peak, displacing high-emitting
generation. Due to this flexibility, we assign a marginal emissions rate when hydro is marginal
based on the average marginal emissions rate of periods with similar LBMPs in which hydro is
not on the margin. This approach assumes hydro’s offer curve reflects its opportunity cost,
specifically its ability to generate in later, higher-priced hours in which marginal emissions rates
would be higher. The exception is that we assume a zero MER when hydro is marginal in very
low priced hours (LBMP <$10/MWh), reflecting that hydro may have limits on its storage
flexibility and may have to spill water.
B. STATIC ANALYSIS OF ENERGY-RELATED COST IMPACTS OF A CARBON CHARGE
The first part of our analysis is static in that it assumes no changes in load, commitment,
dispatch, imports/exports, or investment from the 2025 market conditions described above.
While a carbon charge would increase wholesale energy prices when carbon-emitting resources
are on the margin, offsetting factors reduce the effect on customer costs. These offsetting factors
include refunded carbon charges, lower ZEC and REC costs, and increased TCC value. Thus,
although we find that a $40/ton carbon charge would raise energy prices by approximately
$19/MWh on a load-weighted average basis, accounting for these effects results in a net increase
of only $6/MWh, as discussed below in sections VII.B.1 to VII.B.6.
103 An exception is made for Zone D, which is left out of the initial Upstate MER logic due to constraints
to Zone E. Zone D is assigned Zone E’s MER in hours a unit is not marginal within Zone D.
104 If there is no marginal unit in any zone Upstate of a given zone, the logic is then reversed.

43 | brattle.com
1. Increase in Wholesale Energy Prices
A carbon charge would increase wholesale energy prices when carbon-emitting resources are on
the margin. The extent to which prices would rise depends on the carbon charge and on the
load-weighted MER. We estimate the NYCA-wide, load-weighted MER as 0.47 tons/MWh, from
the 2015 hourly zonal marginal emissions rates described in Section VII.A.3 above; the range of
MERs across zones results in different increases in wholesale energy prices by location. We
estimate that a $40/ton carbon charge would, on average, increase the wholesale energy prices
paid by customers by $18.8/MWh (ranging from $16.7 to $20.1/MWh across zones).
Sources and Notes: [1] Hourly MER weighted across hours by hourly load and across zones by average annual zonal load; zonal MERs range from 0.42 to 0.50 tons/MWh.
2. Refund of Carbon Revenues to Customers
The $18.8/MWh average increase in energy prices would be partially offset by NYISO returning
to customers all carbon charges ($40/ton) collected from fossil generation and imports, which are
estimated as follows:
In-state emissions. We estimate in-state emissions will be 29 million tons in 2025, which
is 14% lower than in 2015, as described in Section VII.A.3.
Imported emissions. As discussed in Section V.C, our base analysis assumes the simpler
approach to charging imports. Imports from PJM, ISO-NE, Hydro Québec, and Ontario
are each assessed a carbon charge based on the MER of the New York zone into which
they import, with the exception of flow-throughs from PJM to ISO-NE. As an alternative
case (described in Section F), we assign different MERs and carbon charges to each
external area based on an estimate of the carbon content of their marginal imports.
Imports are charged at the New York carbon price (including RGGI) minus the assumed
carbon price, if any, in the market of origin.
Exported emissions. Our base analysis assumes the simpler approach to crediting exports
discussed in Section V.C., based on the MER and carbon charge in the New York market.
As an alternative case (described in Sections V.C and F), we assume exports to
neighboring regions are refunded based on the emissions rate of the marginal resource in
the destination market. Exports are credited at the New York carbon price (including
RGGI) minus the assumed carbon price, if any, in the destination market.
We estimate carbon charge revenues of $1.5 billion per year. Returning all of those revenues to
customers would reduce their average costs of energy by $9.4/MWh. Returned carbon revenues
would thus offset approximately 50% of the increase in wholesale energy prices. Our base
analysis assumes carbon charges are allocated equally to all load zones on a per-MWh basis.
Equations Load‐Weighted Carbon Adder = MERLoadWtdAvg x Carbon Charge
Where,
MERLoadWtdAvg is 0.47 tons/MWh [1]
Carbon Charge is $40/ton
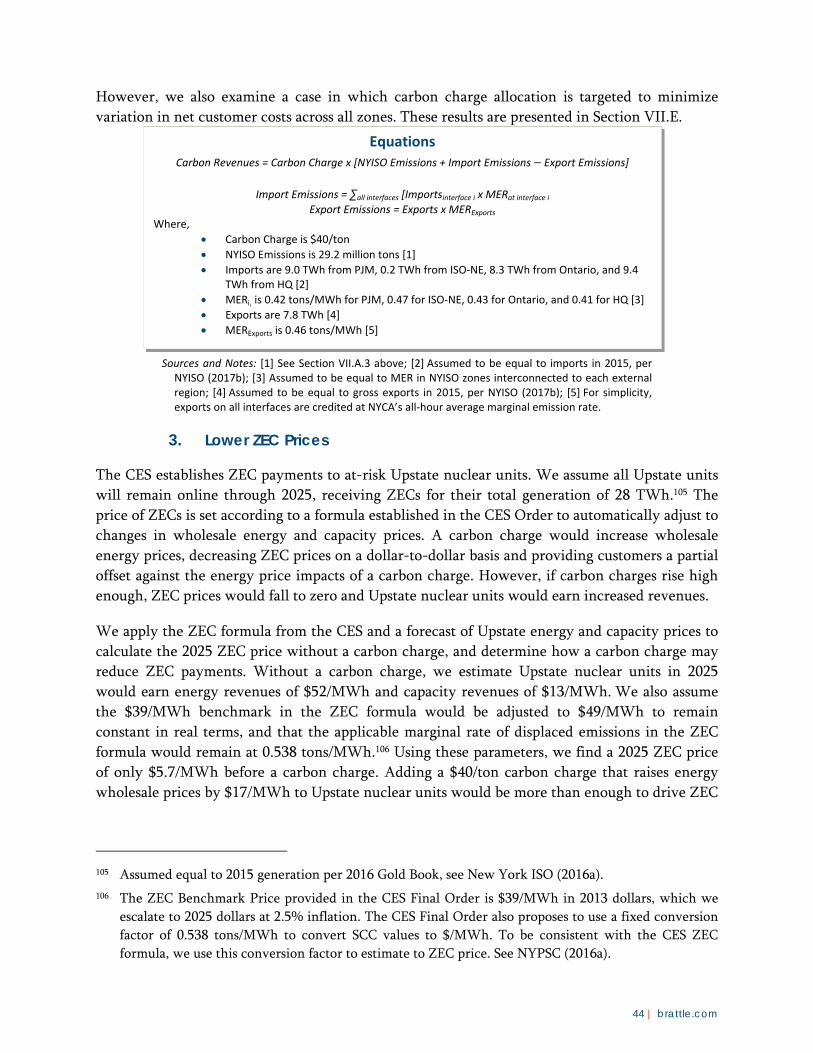
44 | brattle.com
However, we also examine a case in which carbon charge allocation is targeted to minimize
variation in net customer costs across all zones. These results are presented in Section VII.E.
Sources and Notes: [1] See Section VII.A.3 above; [2] Assumed to be equal to imports in 2015, per
NYISO (2017b); [3] Assumed to be equal to MER in NYISO zones interconnected to each external region; [4] Assumed to be equal to gross exports in 2015, per NYISO (2017b); [5] For simplicity, exports on all interfaces are credited at NYCA’s all‐hour average marginal emission rate.
3. Lower ZEC Prices
The CES establishes ZEC payments to at-risk Upstate nuclear units. We assume all Upstate units
will remain online through 2025, receiving ZECs for their total generation of 28 TWh.105 The
price of ZECs is set according to a formula established in the CES Order to automatically adjust to
changes in wholesale energy and capacity prices. A carbon charge would increase wholesale
energy prices, decreasing ZEC prices on a dollar-to-dollar basis and providing customers a partial
offset against the energy price impacts of a carbon charge. However, if carbon charges rise high
enough, ZEC prices would fall to zero and Upstate nuclear units would earn increased revenues.
We apply the ZEC formula from the CES and a forecast of Upstate energy and capacity prices to
calculate the 2025 ZEC price without a carbon charge, and determine how a carbon charge may
reduce ZEC payments. Without a carbon charge, we estimate Upstate nuclear units in 2025
would earn energy revenues of $52/MWh and capacity revenues of $13/MWh. We also assume
the $39/MWh benchmark in the ZEC formula would be adjusted to $49/MWh to remain
constant in real terms, and that the applicable marginal rate of displaced emissions in the ZEC
formula would remain at 0.538 tons/MWh.106 Using these parameters, we find a 2025 ZEC price
of only $5.7/MWh before a carbon charge. Adding a $40/ton carbon charge that raises energy
wholesale prices by $17/MWh to Upstate nuclear units would be more than enough to drive ZEC
105 Assumed equal to 2015 generation per 2016 Gold Book, see New York ISO (2016a).
106 The ZEC Benchmark Price provided in the CES Final Order is $39/MWh in 2013 dollars, which we
escalate to 2025 dollars at 2.5% inflation. The CES Final Order also proposes to use a fixed conversion
factor of 0.538 tons/MWh to convert SCC values to $/MWh. To be consistent with the CES ZEC
formula, we use this conversion factor to estimate to ZEC price. See NYPSC (2016a).
Equations Carbon Revenues = Carbon Charge x [NYISO Emissions + Import Emissions − Export Emissions]
Import Emissions = ∑all interfaces [Importsinterface i x MERat interface i
Export Emissions = Exports x MERExports Where,
Carbon Charge is $40/ton
NYISO Emissions is 29.2 million tons [1]
Imports are 9.0 TWh from PJM, 0.2 TWh from ISO‐NE, 8.3 TWh from Ontario, and 9.4 TWh from HQ [2]
MERi, is 0.42 tons/MWh for PJM, 0.47 for ISO‐NE, 0.43 for Ontario, and 0.41 for HQ [3]
Exports are 7.8 TWh [4]
MERExports is 0.46 tons/MWh [5]

45 | brattle.com
prices to zero and increase nuclear generators’ net revenues by $9.7/MWh.107 Customers would
save $160 million, or $1.0/MWh in lower ZEC costs, and revenues to Upstate nuclear generators
would rise by $270 million per year. Because all load will purchase ZECs on a load-ratio share
basis, the $/MWh impact of lower ZEC costs is the same across zones.
Sources and Notes: [1] Calculated all‐hours average MER for Zones B & C; [2] Assumed same as 2015 per 2016 Gold Book, see NYISO (2016a); [3] CES Final Order, see NYPSC (2016a); [4] Calculated based on average 2015 Zone B & C energy prices, accounting for 85% increase in gas prices, $3 VOM rising with inflation, and rising RGGI prices, as discussed in Section VII.A.2; [5] DPS Cost Study, converted to $/MWh assuming 95% capacity factor. See New York DPS (2016); [6] 2013 Benchmark Price of $39/MWh escalated at 2.5% inflation per CES Final Order, see NYPSC (2016a).
4. Lower REC Prices
A carbon charge would increase energy revenues for clean resources, including new Tier 1
renewable resources supported by RECs. We assume prices would not be reduced for fixed-price
REC contracts that are already in place or signed before a carbon charge is planned.108
To estimate the impact on future Tier 1 REC prices, we assume each dollar of expected increase
in wholesale energy prices would reduce REC prices by a dollar, although the actual offset could
be somewhat lower due to differences in risk.109 Future REC contracts could be structured so that
107 We use the all-hours average carbon adder instead of the load-weighted average, as nuclear typically
runs at full capacity in all hours. The $9.7/MWh increase in nuclear net revenues derives from the
$17/MWh Upstate carbon adder to energy prices, less $5.7/MWh from ZEC prices declining to zero,
less $1.6/MWh from reductions in energy and capacity revenues due to carbon-charge-induced CC
entry (see Sections VII.C and VII.G).
108 Section VII.F includes results for a scenario in which 5 TWh of existing Tier 2 renewables receive
REC payments.
109 A REC price is guaranteed for the duration of a REC contract (such as 10 years), whereas future
carbon charges cannot be guaranteed.
Equations Reduced ZEC Payments = Carbon Charge x MERZonesBC x
Nuclear Generation (cannot exceed ZEC Price)
ZEC Price = Carbon Charge x CES Emission Rate −
{Energy Revenue + Capacity Revenue − ZEC Benchmark Price (cannot fall below $0)}
Where,
Carbon Charge is $40/ton
MERUpstateNuclear is 0.43 tons/MWh [1]
Nuclear Generation is 28.2 TWh [2]
ZEC Price is $5.7/MWh (calculated)
CES Emission Rate is 0.538 tons/MMBtu [3]
Energy Revenue is $52/MWh [4]
Capacity Revenue is $13/MWh [5]
ZEC Benchmark Price in 2025 is $49/MWh [6]

46 | brattle.com
the price adjusts automatically with changes in carbon prices, mitigating regulatory uncertainty
associated with a carbon charge.110
To estimate the price of RECs before and after a carbon charge, we assume onshore wind
generation provides marginal RECs in 2025. We estimate REC prices as the levelized cost of
energy (LCOE), less energy market revenues, capacity market revenues, and revenues from the
carbon charge. We estimate onshore wind’s LCOE as $95/MWh based on the CES Cost Study by
DPS.111 We assume wind power offers into the energy market at zero marginal cost and earns
energy revenues of $77/kW-yr (or $28/MWh) based on the hourly 2015 LBMPs averaged across
Zones A, C, D, and E and on hourly wind profiles.112 We then escalate these 2015 revenues to
$145/kW-yr (or $53/MWh) of 2025 revenues, assuming energy prices rise to reflect increasing
gas prices and increasing RGGI prices, as described in Section VII.A.2. In addition, we assume
wind would earn $21/kW-yr (or $7/MWh) in capacity revenues due to a capacity price of
$105/kW-yr and an unforced capacity (UCAP) value of 20%.113 Putting these components
together, we estimate an onshore wind REC price of $34.0/MWh before a carbon charge.
Using applicable avoided marginal emission rates for wind and an indicative wind generation
profile, we estimate that onshore wind would receive $15.4/MWh in additional energy revenues
due to a $40/ton carbon charge. This reduces the REC price to $18.6/MWh.114,115
Reduced REC prices due to a carbon charge’s impact on wholesale energy prices helps offset the
effects of a carbon charge on customers. The size of this effect depends upon both the quantity of
Tier 1 RECs and the amount their revenues increase. Based on the DPS Cost Study, we estimate
Tier 1 renewables will generate 17.7 TWh in 2025, of which 9.1 TWh will come from wind, 4.7
TWh from solar, and the remaining 3.9 TWh from bioenergy, hydro, and eligible imports.116
The effect of a carbon charge on Tier 1 resources’ energy revenues depends on the marginal
emissions rates when and where they generate. We calculate applicable rates for wind, solar, and
other Tier 1 resources with location-specific hourly emissions rates and each resource’s hourly
110 See Section V.F for a qualitative discussion of such a structure.
111 New York DPS (2016).
112 Hourly LBMPs from ABB Inc., Velocity Suite (2017). Hourly wind profile from NREL (2010a).
113 2025 capacity price from CES Cost Study, New York DPS (2016). Assumes wind has unforced capacity
(UCAP) value of 20% per NYISO ICAP Manual, New York ISO (2016c).
114 Hourly wind profile from (NREL 2010a). We assume new wind is sited evenly across Zones A, C, D,
and E and avoids marginal emissions in those zones.
115 If a carbon charge is large enough, REC prices could fall to zero. While we do not find this to be the
case, we analyze the impact of higher or lower REC prices in Section VII.F.
116 New York DPS (2016), p. 281. Includes solar PV developed through the NY Sun initiative.

47 | brattle.com
generation profile.117 We estimate that with a carbon charge, total Tier 1 resource revenues
would rise by $311 million per year, decreasing customer REC payments by an equivalent
amount and saving customers $2.0/MWh. Because all load will purchase RECs on a load-ratio
share basis, the $/MWh impact of lower REC costs is the same across zones.
Sources and Notes: [1] New York DPS (2016); [2] Calculated with locational and time varying MER profiles and resource generation profiles.
5. Increased TCC Value
A carbon charge may increase transmission congestion costs. This is implicitly accounted for in
the load-weighted average LBMPs used to calculate wholesale energy price impacts above.
Specifically, LBMPs increase more Downstate than Upstate since the marginal emission rates are
higher Downstate. This widens the Upstate-Downstate energy price differential, which manifests
as increased transmission congestion costs as energy flows from Upstate to Downstate.
But higher congestion costs also means greater value of TCCs, given by the price spreads across
binding constraints. Congestion and price spreads will likely increase the most across the Central
East interface between Zones E and F; that single interface accounted for approximately 50% of
all NYISO congestion in 2015.118 We estimate a carbon charge may increase total congestion
across the Central East interface by $44 million annually, based on the 0.05 ton/MWh difference
in annual average marginal emissions rates between Zones E and F. Assuming correspondingly
higher TCC values are reflected in TCC auctions and returned to customers, this would lower the
customer cost impact of a carbon charge by $0.3/MWh. This estimate is conservative in that it
does not account for increased TCC value on constraints other than the Central East interface.
We assume that TCC value is allocated across zones on a load-ratio share basis, so $/MWh impact
is the same across zones.
117 Hourly wind profile from (NREL 2010a), solar profile from NREL (2010b) model, and other Tier 1
assumed to generate evenly all hours. We assume new wind is sited evenly across Zones A, C, D, and
E; solar is sited evenly across New York except in Zone J; other Tier 1 is sited evenly across Zones A–I.
118 2015 State of the Market Report, see Potomac Economics (2016).
Equations Reduced REC Payments = Carbon Charge x ∑GenType [GenerationGenType x MERGenType]
Where,
Carbon charge is $40/ton
Generation is 9.1 TWh wind, 4.7 TWh solar, 3.9 TWh other [1]
MER is 0.41 tons/MWh wind, 0.48 tons/MWh solar, 0.44 tons/MWh other [2]

48 | brattle.com
Sources and Notes: [1] Assumed based on NYISO (2016d); [2] Calculated all‐hours average.
6. Energy Revenue Flow Schematic
We estimate that a $40/ton carbon charge would result in $19/MWh higher average energy
prices, but after accounting for static energy price offsets, net customer costs would rise only
$6/MWh, or about a third of the carbon adder. Figure 10 illustrates how carbon charges affect
costs and revenues and illuminates why the net increase in customer costs is such a small fraction
of total costs. The supply curve, in red, illustrates the carbon component of resource variable
costs. For clean resources this is zero. For fossil resources, the carbon cost depends on the plants’
emission rates. For imported energy, the ascribed emissions rate is the same as for the marginal
fossil generator in the importing zone, as discussed in Sections V.C and VII.B.2. Neither
remittances to exporters nor the carbon charges received from the marginal generation supplying
exporters are shown in the diagram, since they cancel each other out. The diagram is a
schematic, but it is drawn approximately to scale to reflect the annual average price impacts.
The energy wholesale price impact is set by the marginal, highest-emitting fossil generator. If
that price impact is applied to all load, the total cost would be the full rectangle outlined in
purple. However, total customer costs are lower due to offsets from RECs, ZECs, and returned
carbon charges, illustrated as shaded areas. After accounting for these offsets, the remaining costs
to customers are represented by the dark blue area. (Note: this single diagram does not represent
differences across hours or the fact that a $40/ton carbon charge will increase revenues to the
fossil fleet by more than $19/MWh since fossil generation is the highest in the merit order and
operates disproportionately in high load hours; conversely, the nuclear fleet’s revenues will
increase by less than $19/MWh.)
Equations Increased TCC Value = Carbon Charge x Central East Capacity x (MERZoneF − MERZoneE) x 8760
Where,
Carbon Charge is $40/ton
Central East Capacity is 2,500 MW [1]
MERZoneF is 0.47 tons/MWh; MERZoneE is 0.42 [2]

49 | brattle.com
Figure 10 Illustration of Revenue Flows among Suppliers and Customers
C. ADJUSTMENTS TO STATIC COST ANALYSIS DUE TO THE ENTRY OF CCS
A carbon charge would reward the relative efficiency of CCs and could attract investment in
CCs. Additional CCs can be expected to enter until wholesale energy and capacity prices adjust
such that the all-in prices earned by CCs provide no more than normal returns. Section VI.C
presents our indicative analysis showing that a $40/ton carbon charge can be expected to induce
710 MW of incremental CC entry spread among zones. With that much entry, capacity prices
fall by $17/kW-yr in Zone K, $14/kW-yr in Zone J, $13/kW-yr in the Lower Hudson Valley
Zone, and $10/kW-yr in Rest-of-State; load-weighted average energy prices adjust downward by
$0.62/MWh in Zone K, by $0.58/MWh in Zone J, by $0.57/MWh in Zones F, G, H, and I, and by
$0.44/MWh Upstate. These expected energy and capacity price adjustments offset 67% of the
CCs’ $21-34/kW-yr revenue enhancement from the static analysis—not 100% because of our
assumed one-third chance that CCs are not economic in 2025 and that a carbon charge induces
no entry, as discussed in Section VI.C.
These dynamic adjustments can attenuate other components of the static analysis as well: with
slightly lower wholesale energy and capacity prices, REC prices would not decline as much as the
static analysis suggests. However, ZEC prices would be unaffected by the adjustment since ZEC
prices remain zero both before and after the adjustment.
Sources and Notes: Our implementation of this equation accounts for LSEs in nested zones
having to buy some capacity at the local price and some at outside prices.
Equations Adjustment to Static Customer Cost Analysis = Change in Capacity Price x Peak Load x (1 +
Reserve Margin) / Load + Change in Energy Price – Offsetting REC Price Effects

50 | brattle.com
The combined effects of these capacity price and energy price adjustments would save customers
$550 million annually, or $3.5/MWh on average (net of offsetting REC price impacts). Across
zones, savings vary from $2.4/MWh to $5.2/MWh, with greater savings in Downstate zones due
to the relatively larger reductions in capacity and energy prices.
D. CARBON-PRICE-INDUCED ABATEMENT
A carbon charge would incentivize low-cost abatement opportunities not subsidized by the CES.
These dynamics are not captured in the static analyses in Section VII.B. In Section VI, we
estimated that a carbon charge could provide a range of abatement opportunities that in total
could plausibly reduce 2025 NYISO carbon dioxide emissions by 2.6 million tons (8% of electric-
sector emissions in 2015).119
The incremental emissions reductions induced by a carbon charge could be used to produce
greater environmental benefit, or they could be used to meet a fixed emissions target at lower
customer cost by replacing costlier measures. For example, if RECs were being procured beyond
the CES targets in order to meet economy-wide carbon reduction goals, the carbon-charge-
induced reductions could enable meeting New York’s decarbonization goal without buying as
many RECs. As discussed in Section VI, the 2.6 million tons of carbon-price-induced savings
could avoid buying 6.3 TWh of RECs. In Section VII.B.4, we estimate an onshore wind REC
price of $18.6/MWh in the presence of a $40/ton carbon charge. At this REC price, the 6.3 TWh
of avoided RECs provides customers with savings of $120 million per year, or $0.8/MWh.
Sources and Notes: [1] Calculated, see above; [2] Calculated as wind generation‐weighted average; [3] Total carbon‐price‐induced abatements quantified in Section VI.
Note that the $120 million per year and $0.8/MWh may appear small for valuing emissions
reductions amounting to 9% of 2025 baseline NY-internal emissions. This is an artifact of the
way in which we presented the savings after having counted savings from reducing prices on the
original volume of RECs in the first part of the analysis; we are now valuing the avoided RECs at
the reduced REC price. If instead, we had valued the avoided RECs at their original price absent
a carbon charge ($34.0/MWh), we would have calculated nearly twice the savings ($220 million
per year) in this step. Because we previously considered the customer savings from lower REC
prices, we must value carbon-price-induced abatements at the lower REC price with a carbon
charge.
119 See Section VI for a detailed discussion of these benefits.
Equations Value of Low‐Cost Abatement = Avoided RECs x REC Price
Avoided RECs = Emissions Savings / MERWind Where,
REC Price is $18.6/MWh [1]
MERWind is 0.42 tons/MWh [2]
Emissions Savings is 2.6 million tons [3]

51 | brattle.com
E. NET IMPACTS ON CUSTOMER COSTS
Accounting for all factors above, we estimate that a $40/ton carbon charge would slightly
increase New York customer costs by $1.7 MWh, as shown in Figure 9. Accounting solely for the
static effects on the energy market, customer costs would rise by $6.0/MWh, but a carbon charge
would trigger market adjustments that we estimate would reduce customer costs by $3.5/MWh
and induce 2.6 million tons of additional carbon abatement. The incremental abatement could
save customers money if it reduces the amount of other measures they have to pay for to meet a
fixed emissions target; valuing that savings at the price of RECs (divided by total load) suggests a
$0.8/MWh savings.
Three components of the customer cost impact differ across zones:
The increase in wholesale energy prices (discussed in Section VII.B.1);
Adjustments to static analysis due to CC entry (discussed in Section VI.C and VII.C); and
Refunded carbon revenues, depending on how they are returned to customers. We
evaluate two allocations of carbon refunds: one based on load-ratio share, and one
targeted to eliminate differences in customer cost impacts across zones.
The other components (lower ZEC and REC prices, increased TCC value, and state-wide carbon-
price-induced abatement) are distributed across zones by load-ratio share, and are therefore
constant across zones.
Figure 11 below shows each component of the customer cost impact across zones. We find that if
carbon refunds are allocated by load share, net customer cost impacts vary from $0.8 to
$3.3/MWh across zones.120 With targeted allocation of carbon refunds, variation across zones can
be eliminated, equalizing the net impact to $1.7/MWh – the same as the NYCA average.
120 $3.3/MWh is the net impact to Zone F, which experiences an increase in wholesale energy prices
similar to that of Downstate zones, but receives proportionately less capacity savings from CC entry
because it is outside of the G-J locality. Excluding Zone F, the net impact ranges from $0.8 to
$2.2/MWh.

52 | brattle.com
Figure 11 Estimated Customer Cost Impact of $40/ton Carbon Charge in 2025, by Zone ($/MWh)
F. UNCERTAINTY ANALYSIS
Although we estimate a $40/ton carbon charge would increase customer costs by $1.7/MWh on
average, our estimates are uncertain, both because of the limitations of our high-level analysis
and, more so, because of unknowns about future market conditions. We therefore evaluated the
effect of several key uncertainties. Figure 12 below shows the variables we tested, the primary
category of customer cost or savings they affect, and the net impact on customer costs (including
any second-order effects, which are further explained below).
In addition to these specific uncertainties, we also evaluated the effect of changing the $40/ton
carbon charge by +/- $20/ton. By maintaining the same analytical approach but using different
carbon charge values, we estimate that the net change in customer costs rises from $1.7/MWh at
$40/ton to $3.7/MWh at $60/ton and falls to $0.03/MWh at $20/ton. The effects we analyzed
mostly scale linearly.121
121 Two components of customer costs do not scale linearly for the full range of possible carbon charges:
ZEC savings and carbon-price-induced abatements. ZEC savings go to zero if the ZEC price without a
carbon charge is already zero, and are capped at the full value of the ZEC payments if the carbon
charge drives the ZEC price to zero. Carbon-price-induced abatements do not scale linearly because
the value is a product of two terms that change linearly with a carbon charge (the REC price and
avoided emissions due to a carbon charge). However, these nonlinearities do not have a sizable effect
on the +/- $20/ton range considered.
NYCA
Average Zone A Zone B Zone C Zone D Zone E Zone F Zone G Zone H Zone I Zone J Zone K
STATIC ANALYSIS
I. Increase in Wholesale Energy Prices 18.8 17.4 17.5 17.2 16.7 17.3 19.2 19.3 19.3 19.2 19.4 20.1
II. CO2 Revenue ‐ (A) Allocate by Load Share ‐9.4 ‐9.4 ‐9.4 ‐9.4 ‐9.4 ‐9.4 ‐9.4 ‐9.4 ‐9.4 ‐9.4 ‐9.4 ‐9.4
II. CO2 Revenue ‐ (B) Allocate to Equalize Zonal Impact ‐9.4 ‐9.2 ‐9.3 ‐9.0 ‐8.5 ‐9.1 ‐11.0 ‐8.5 ‐8.5 ‐8.5 ‐9.9 ‐9.1
III. Lower ZEC Prices ‐1.0 ‐1.0 ‐1.0 ‐1.0 ‐1.0 ‐1.0 ‐1.0 ‐1.0 ‐1.0 ‐1.0 ‐1.0 ‐1.0
IV. Lower REC Prices ‐2.0 ‐2.0 ‐2.0 ‐2.0 ‐2.0 ‐2.0 ‐2.0 ‐2.0 ‐2.0 ‐2.0 ‐2.0 ‐2.0
V. Increased TCC Value ‐0.3 ‐0.3 ‐0.3 ‐0.3 ‐0.3 ‐0.3 ‐0.3 ‐0.3 ‐0.3 ‐0.3 ‐0.3 ‐0.3
Subtotal (A) 6.0 4.7 4.8 4.5 4.0 4.6 6.5 6.6 6.6 6.5 6.7 7.4
Subtotal (B) 6.0 4.9 4.9 4.9 4.9 4.9 4.9 7.5 7.5 7.5 6.2 7.7
DYNAMIC ANALYSIS
VI. Adjustments to Static Analysis due to Entry of CCs ‐3.5 ‐2.4 ‐2.4 ‐2.4 ‐2.4 ‐2.4 ‐2.4 ‐5.0 ‐5.0 ‐5.0 ‐3.7 ‐5.2
VII. Carbon Price‐Induced Abatement ‐0.8 ‐0.8 ‐0.8 ‐0.8 ‐0.8 ‐0.8 ‐0.8 ‐0.8 ‐0.8 ‐0.8 ‐0.8 ‐0.8
Total Net Change in Customer Costs (A) 1.7 1.5 1.6 1.4 0.8 1.4 3.3 0.8 0.9 0.8 2.2 1.4
Total Net Change in Customer Costs (B) 1.7 1.7 1.7 1.7 1.7 1.7 1.7 1.7 1.7 1.7 1.7 1.7

53 | brattle.com
Figure 12 Impact of a $40/ton Carbon Charge on Customer Costs (¢/kWh)
Effect of Major Sources of Uncertainty
Bottled Upstate Renewables: By 2025, Upstate MERs may fall with the addition of 18 TWh of
new renewables statewide, particularly if these additions are concentrated solely Upstate. We
examine an extreme lower-bound scenario if Upstate MERs/MHRs fall 80% from 2015 levels.
Our analysis suggests Upstate long-term equilibrium MERs are unlikely to fall far below 0.35
tons/MWh before renewable additions shift Downstate and/or transmission is built (see Section 0
for further discussion). Our 80% lower Upstate MER and MHR scenario reflects wind on the
margin for a majority of hours Upstate and does not adjust the MERs Downstate. We also assume
the REC-price-setting resource switches from Upstate onshore wind to Downstate offshore wind.
The increase in wholesale energy costs due to a carbon charge is lessened due to lower MERs, but
with offsetting effects on REC price impacts. Customer ZEC savings change minimally due to
offsetting factors: although lower Upstate MERs reduce the energy price impact of a carbon
charge, there is more room for ZEC prices to fall before reaching zero, due to low market heat
rates causing high Base ZEC prices. TCC values rise dramatically due to increased
Upstate/Downstate price separation. The value of carbon-charge-induced abatement rises due to
the higher REC costs associated with offshore wind. Overall, we find the curtailments would
change the impact of a carbon charge on customer bills from $1.7/MWh to -$2.0/MWh.

54 | brattle.com
While the average NYCA customer will see net savings of $2.0/MWh, a simple load-ratio share
allocation of carbon revenues would result in most Downstate customers paying $2–3/MWh
more while Upstate customers save about $10/MWh. To minimize differences in zonal impacts,
carbon revenues could be targeted to Downstate zones. While zonal variations cannot be
completely eliminated, reallocation could result in net savings to all customers of $1.2 to
$3.0/MWh.
CC Entry: The dynamic “adjustments to static analysis due to the entry of CCs” apply only if new
CCs are economic and thus likely to enter in greater volumes with a carbon charge. Our base
analysis applies a 67% probability to this outcome and a 33% probability that CCs are not
economic and not entering. The latter could occur because surplus capacity conditions persist or
because CCs become less economic than other technologies, as discussed in Section VI.C. Since
the probabilities are uncertain, however, we test the impact of alternative assumptions: one with
a 100% chance that CCs will be economic and entering in 2025, and one with a 0% chance that
CCs will be economic in 2025 due to low capacity prices (maintained at 2015 levels of $35/kW-
year). The latter worsens the customer impact of a carbon charge more than any other scenario
considered, from a $1.7/MWh in our base analysis to $3.8/MWh. Alternatively, assuming a 100%
chance of CC entry changes the net customer cost impact to -$0.1/MWh.
Peaker Displacement by CCs: Our base assumption is that half of a MW of peaking capacity is
displaced by each MW of CC entry. Due to the uncertainty in this rate of displacement, we vary
this assumption from no displacement to 100%. Lower rates of displacement results in relatively
larger capacity market price effects and smaller energy market price effects, providing greater net
customer savings overall. Assuming no displacement slightly reduces the net customer impact of
a carbon charge from $1.7 to $1.5/MWh, and 100% displacement (perfect substitution) increases
the net customer cost impact to $2.9/MWh. The perfect substitution case disproportionately
increases customer costs by minimizing capacity market price effects (which apply to peak load
plus reserve margin) and maximizing energy market price effects (which apply to average load).
Gas Prices: Our base analysis assumed a gas price of $5.4/MMBtu in 2025. Lower gas prices would
increase the base ZEC price, providing more room for ZEC price relief from a carbon charge.
Secondarily, lower gas prices would also increase REC prices. Assuming gas prices stayed at 2015
levels ($3.8/MMBtu, or 30% lower) would increase base ZEC prices from $5.7/MWh to
$17.6/MWh, and would change the net customer cost impact of a carbon charge from $1.7/MWh
to −$1.0/MWh. Alternatively, assuming 25% higher gas prices would decrease base ZEC prices to
zero and change the net customer cost impact from $1.7/MWh to $3.3/MWh.
Base ZEC Price (before a carbon charge): The ZEC price is sensitive to changes in energy and
capacity prices, as well as to the NYPSC’s terms for calculating ZEC prices. Our base ZEC price is
$5.7/MWh without a carbon charge, falling to $0 with a carbon charge, leading to $1/MWh
customer savings. The customer savings would be less if the base ZEC price were lower for any
reason and more if the base ZEC price were higher. For example, a $0 base ZEC price would
change the net customer impact of a carbon charge from $1.7/MWh to $2.7/MWh. Alternatively,
a ZEC price of $17.5/MWh (today’s level, without escalation) would change the net customer
impact from $1.7/MWh to −$0.2/MWh.

55 | brattle.com
REC Price (with carbon charge): Customer savings increase if the price of avoided RECs is higher
than our base value of $19/MWh (with a carbon charge). For an upper-bound, we assume that
the REC price is set at $41/MWh by offshore wind in 2025 with a carbon charge.122 At this REC
price, the net customer impact of a carbon charge changes from $1.7/MWh to $1.1/MWh. For a
lower-bound, a $0 REC price would change the net customer impact from $1.7/MWh to
$2.5/MWh.
Carbon-Price-Induced Abatement: As discussed in Section VII.D, 2.6 million tons of carbon-
price-induced abatement can enable the state to meet its economy-wide decarbonization goals at
lower cost by replacing costlier measures. However, the amount of abatement a carbon charge
will induce is uncertain. Assuming a carbon charge induces half as much abatement changes the
net customer impact of a carbon charge from $1.7/MWh to $2.1/MWh. Conversely, assuming
twice as much abatement changes the net customer impact from $1.7/MWh to $1.0 /MWh.
Differentiated Border Charges: Our base estimate assumes all imports are charged at a rate of
$40/ton, which takes away the energy price premium they would earn and makes importers
financially unaffected by the carbon charge, as discussed in Section V.C. Differentiating border
charges by region could decrease carbon revenues on Canadian imports (increasing New York
customer costs) but could encourage incremental clean imports and discourage high-emitting
ones. We considered the effects of applying differentiated border charges on imports and credits
to exports. We assume emissions rate of: zero for Québec, 0.16 tons/MWh for Ontario, 0.45
tons/MWh for ISO-NE, and 0.66 tons/MWh for PJM.123 Further, we assume applicable border
charge rates of $41/ton for ISO-NE, $58/ton for PJM, and $9/ton for Ontario and Québec.124 With
this treatment of imports and no change in the quantity of imported energy, carbon revenues are
122 Offshore wind REC price calculated as $155/MWh LCOE from DPS’s CES Cost Study, less net energy
revenues, capacity revenues, and carbon charge revenues (similar to the onshore wind REC price
calculation described in Section VII.D). Using a 40% capacity factor offshore wind profile for Zone K
from NREL (2010a), 2015 Zone K LBMPs, and 38% capacity value from New York ISO (2016c), we
estimate 2025 net energy revenues of $84/MWh and capacity revenues of $10/MWh. Offshore wind
avoids carbon emissions at the generation-weighted average MER of 0.49 tons/MWh, resulting in
carbon charge revenues of $20/MWh.
123 We assume that Québec imports are zero-emitting, but Ontario imports are zero-emitting 60% of the
time and a 0.4 tons/MWh-emitting gas CC is on the margin in the other 40% of time, resulting in an
emissions rate of 0.16 tons/MWh. For PJM imports, we assume that coal is on the margin 33% of the
time and gas is on the margin 67% of the time, resulting in an emission rate of 0.67 tons/MWh. We
assume that ISO-NE imports, which are very small relative to other imports, have an emissions rate of
0.45 tons/MWh, comparable to that of a gas plant.
124 We assume that all imports (and exports) are charged (or credited) a carbon price at the border equal
to New York’s SCC, less the carbon price, if any, in the other region. Thus transactions with PJM are
assessed the full SCC at $58/ton. For ISO-NE, we assume the RGGI carbon price of $17/ton (see
beginning of Section VI.G), resulting in a border charge of $41/ton. For Ontario and Québec, we
assume a Canadian carbon price of $49/ton, resulting in a border charge of $9/ton. CBC News (2016). See Section V.C for further discussion of border charges approaches.

56 | brattle.com
reduced by $200 million. However, we also estimate that differentiated border charges would
incentivize 1.8 TWh of additional clean energy from Canada, either in the form of new
impoundments or avoided spillage, and deter 4.4 TWh of high-emitting generation from PJM.125
In total, these adjustments would induce an incremental 1.6 million tons per year of emission
reductions.126 Altogether, the net customer cost impact of a carbon charge would change from
$1.7/MWh to $2.6/MWh.
Marginal Emission Rates (MERs): While we adjust 2025 MERs from 2015 data to account for coal
retirements, MERs and market heat rates may fall further as fossil generation decreases (our base
estimate is a 8% reduction in fossil generation from 2015). We evaluated the possibility that
MERs decrease by 15% from our base estimate and that market heat rates decrease by 10% while
total emissions remain at our base estimate, since we already adjusted those for reduced fossil
generation as well as coal retirements. We find that this leaves our base net cost impact
unchanged, due to several offsetting effects: REC price savings would fall from $2.0/MWh to
$1.7/MWh; base ZEC prices would rise with lower MHRs assuming the NYPSC’s ZEC price
formula is adjusted to reflect lower MERs and reduced LBMPs) and ZEC savings would rise from
$1.0/MWh to $1.4/MWh. The largest delta is from reducing CCs’ net energy margin benefits and
new entry, reducing the CC entry benefit from $3.5/MWh to $0.6/MWh. However, savings from
avoided RECs would increase slightly from $0.8/MWh to $0.9/MWh as REC prices would be
slightly higher with lower MERs and market heat rates. Overall, the customer impact of a carbon
charge rises slightly from $1.7/MWh to $1.8/MWh.
Tier 2 Resources Paid RECs: While only Tier 1 resources are eligible to earn RECs through the
CES, we also evaluate a scenario where 5 TWh of generation from Tier 2 resources are eligible to
earn RECs, consistent with the DPS forecast of energy from Tier 2 resources.127 This increases
REC savings from -$2.0/MWh to -$2.5/MWh as the carbon charge reduces REC payments to an
additional 5 TWh of generation, changing the customer cost impact from $1.7/MWh to
$1.2/MWh.
Combined Effects: The net impact of a carbon charge remains small with each individual
uncertainty considered. A combination of the largest uncertainties could result in a larger range
of outcomes. For example, if simultaneously no 33% reduction is applied to new CC entry and
gas prices are low, the customer cost impact of a carbon charge would be more negative than
with either change taken in isolation. The opposite would be true if capacity prices remain at
today’s value with no new CC entry and high gas prices. However, we do not consider these
125 1.8 TWh of Canadian imports is equivalent to 200 MW of imports each hour. 4.4 TWh of avoided PJM
imports is 1/3 of all PJM imports, approximately the frequency that coal is marginal.
126 1.6 million tons of reductions includes 0.8 million tons avoided from PJM and 0.8 million tons due to
additional clean Québec/Ontario imports. We do not correspondingly reduce carbon revenues,
assuming total emissions remain constant as carbon-charge-induced abatement is balanced by
reductions in RECs procured.
127 See New York DPS (2016), p. 86.

57 | brattle.com
combinations highly likely since new CCs tend to be more economic when gas prices are high.
We therefore construct an overall range that likely encompasses the uncertainties as follows: for
the lower bound, assume no cut on CC capacity entry and half of the gas price effect (12.5%
lower gas prices); for the upper bound, assume today’s capacity prices, no CC entry, and half of
the gas price effect (12.5% higher gas prices). This range rounds to -$1.5/MWh to +$4.6/MWh.
This range is shown as the right-most section in Figure 9.
G. EFFECT ON GENERATOR REVENUES
A carbon charge would increase net energy revenues to those resources that generate in locations
and at times with MERs higher than their emissions rate. Figure 13 illustrates these effects for a
$40/ton carbon charge. Capacity revenues would fall due to entry of new CCs. The effect on net
revenues depends on offsetting charges for fossil generation and reduced REC and ZEC payments
to clean resources. Net revenues to new Tier 1 renewables would not rise, as changes in net
energy and capacity revenues would be directly offset by reductions in REC payments. Nuclear
generators would earn higher energy market revenues and ZEC payments would fall to $0.
Existing CCs would earn higher net energy revenues due to running in hours with MERs above
their own emissions rate, but these revenues would be offset by the dynamic re-equilibration of
energy and capacity prices. Downstate peaking units that receive capacity payments but rarely
run for energy would see their revenues fall.
Figure 13 Effect of a $40/ton Carbon Charge on Generator Revenues
Generation Type Energy Revenue Net Change ($/kW‐yr)
Capacity Revenue Change ($/kW‐yr)
Other Offsetting Factors ($/kW‐yr)
Total Change in Net Revenues ($/kW‐yr)
Existing Renewables (Wind) +$44 ‐$2 $0 +$42
New Tier 1 Renewables (Wind) +$44 ‐$2 ‐$42 $0
Upstate Nuclear +$138 ‐$10 ‐$48 +$80
Existing CC +$23 ‐$13 $0 +$9
Hypothetical Downstate Peaker $0 ‐$14 $0 ‐$14
Note: Existing CC assumed to be in zone G; peaker assumed to be in zone J. Impacts reflect the changes in prices estimated in the static and dynamic analyses above.
H. UPSTATE EQUILIBRIUM MARGINAL EMISSIONS RATE
As New York continues to contract for new renewable energy, much of the new generation is
likely to locate Upstate, where wind quality is strongest and where land and construction are
cheapest. However, Upstate generation is already largely clean. In 2016, clean energy accounted
for 88% of total Upstate generation. Fossil fuel-fired generation was on the margin in 54% of
intervals (see Figure 14), but the amount of fossil in the stack was thin. Adding modest additional
amounts of clean generation Upstate will displace fossil generation, but adding much larger
amounts could displace other clean energy and have limited economic and environmental value.

58 | brattle.com
To prevent that, it will be important to have mechanisms to direct an efficient amount of clean
energy investment Downstate and/or to develop transmission. Imposing a carbon price will help
by internalizing the greater value of clean energy where marginal emission rates are highest,
incentivizing development of Downstate resources and improving the net benefits of
transmission enhancements.
Even with such measures in place, it is likely that clean energy will become bottled Upstate, with
lower energy prices and lower marginal emissions rates than exist today. We examined how that
might affect our analysis of a carbon charge’s impact on customer costs (relative to the CES and
other existing policies alone).
As discussed in Section VII.F, we analyzed an extreme case in which Upstate MERs fall 80%
from Base Case levels and Downstate MERs remain unchanged. We found that in this case a
carbon charge would result in net savings to Upstate customers and net costs to Downstate
customers if collected carbon charges were allocated evenly across all load, but customers in all
zones would benefit if charges were targeted Downstate.
Figure 14 2016 Upstate Average vs. Marginal Fuel Mix
Average Fuel Mix Marginal Fuel Mix
Sources and Notes: Average fuel mix data from NYISO (2017c); marginal fuel data provided by NYISO.
However, that is an unrealistically extreme case of bottled Upstate generation, useful only for
establishing bookends. Our analysis indicates that Upstate energy prices and MERs are unlikely
to fall so far due to (1) economically balancing Upstate entry with Downstate entry, even with
higher costs of clean energy Downstate; and (2) building new transmission when economic.
Overall, we do not expect Upstate MERs to fall much more than 25-35% below Downstate MERs
(and they are already 10% lower today), as discussed below.
1. Long-Run Equilibrium between Upstate and Downstate Additions
Currently, adding Upstate onshore wind reduces carbon emissions more cost effectively than
adding Downstate offshore wind due to the substantial difference in capital costs. But as more

59 | brattle.com
onshore wind is added Upstate and MERs decrease there, the cost-effectiveness of reducing
carbon emissions in this manner will fall. Downstate offshore wind would eventually become
more cost effective if Upstate MERs were to fall enough. We would expect renewable additions
to shift Downstate at that point. With a carbon charge in place, market prices would send the
appropriate signal; absent a carbon charge, energy prices would provide some of the signal, but
NYSERDA would have to recognize the differences in carbon abatement value in its
procurement of RECs.
Figure 15 shows an indicative analysis of how far Upstate MERs may fall before Downstate
offshore wind additions become a more cost effective. As shown by the red line, as Upstate MERs
fall from 2015 levels of 0.42 tons/MWh, Upstate wind becomes less cost effective.128 At DPS’s
forecast offshore wind LCOE of $150/MWh, Upstate MERs can only fall 13% to 0.36 tons/MWh
before offshore wind becomes more cost effective.129 Even at a much higher offshore wind LCOE
of $250/MWh, Upstate MERs could only fall 54% to 0.19 tons/MWh before offshore wind
becomes more cost effective. The bottled Upstate renewables case described in Section VII.F
with 80% lower Upstate MERs is therefore extremely unlikely.
128 We calculate cost effectiveness in terms of REC cost divided by tons of carbon abated. We calculate
REC cost as LCOE minus energy and capacity revenues. Energy revenues vary with MER due the
dependence of market heat rates and carbon charge revenues on the MER. All other components of
REC cost (e.g., LCOE, gas price, VOM, RGGI price) are held constant at assumed 2025 values.
Downstate offshore wind REC costs are similarly held constant at assumed 2025 levels.
129 New York DPS (2016)

60 | brattle.com
Figure 15 Relative Cost of Reducing Emissions with Upstate and Downstate Wind
2. Long-Run Equilibrium Considering Transmission Upgrades
As Upstate MERs fall, the Upstate/Downstate price spread will widen, increasing congestion
across the Central East interface and improving the business case for adding Upstate/Downstate
transmission. If Upstate MERs were to fall enough, adding new Upstate/Downstate transmission
would become economical, placing a lower bound on Upstate MERs and prices.
We conduct an indicative analysis of how the economics for new transmission improve as
Upstate MERs fall and the Upstate/Downstate price spread widens by comparing the resulting
production cost savings to the costs of previously proposed transmission enhancements. Previous
estimates of the cost of transmission across the Central East interface indicate $573 million in
construction costs and $805 million in PVRR for an incremental 325 MW of transmission
capacity.130 We annualize the PVRR assuming an 8% cost of capital and 40-year time horizon.
130 The cost of new transmission across the Central-East interface is from a 2015 analysis of the benefits
and costs of proposed New York AC transmission upgrades; we compare projects 11 to 6 and 14 to 9 to
derive an estimate of the cost of new transmission across the Central-East interface. See Newell et al. (2015b), pp. 7 and 14.

61 | brattle.com
If production cost savings had to provide the entire revenue requirement without recognizing
any other sources of transmission benefits,131 the energy price spread across the interface would
have to be $28/MWh on average over the entire year.132 That is, if the price difference between
zones E and F were $28/MWh or greater, it would be economic to build more transmission,
preventing the spread from increasing (assuming further transmission would cost the same as the
indicative project considered here).
A simple analysis yields an estimate of the difference in MER between Upstate and Downstate
that corresponds to this price differential. In 2015, average LBMPs differed by $11/MWh (from
$37/MWh in Upstate zone E to $48/MWh in Downstate zone F, on either side of the binding
constraint across the Central East interface), while MERs differed by 0.05 tons/MWh (from 0.42
in zone E to 0.47 in zone F).133 As the equilibrium $28/MWh price spread is 150% higher than
the price spread observed in 2015, an indicative estimate of the MER spread in the transmission
equilibrium is also 150% higher than the 2015 MER spread, equal to a differential of 0.12
tons/MWh between Upstate and Downstate. As the Downstate (zone E) MER was 0.47
tons/MWh in 2015, this puts a lower bound on the Upstate (zone F) MER at 0.35 tons/MWh.134
(Or MERs could be lower in both regions in tandem, with implications indicated by the
“Marginal Emissions Rates” sensitivity shown in Section VII.F).
As a result, we expect new transmission to be built when Upstate MERs fall to 0.35 tons/MWh,
and potentially before, as we do not include other likely transmission co-benefits in our analysis,
or if gas prices rise. On the other hand, if transmission costs are higher than we estimated based
on one indicative project, the equilibrium Upstate MERs may fall somewhat more before
transmission is built.
VIII. Conclusions and Next Steps
We find that a carbon charge would be a straightforward and economically efficient way to
harmonize New York’s environmental goals and the wholesale market design by pricing the
environmental externality associated with carbon emissions directly. It would send granular
price signals on carbon costs to the entire market, penalizing high-emitting resources and
rewarding low-emitting ones that generate at times and locations that displace the high-emitting
131 Other benefits (or offsets to the revenue requirement) can include capacity resource cost savings,
avoided transmission refurbishment costs, tax receipts, resiliency, etc. Other benefits were estimated
to provide a substantial portion of the revenue requirement of several projects evaluated in the AC
Transmission Study. See Newell et al. (2015b).
132 Calculated based on 2015 construction costs, escalated to 2025 dollars assuming 2.5% inflation.
133 All 2015 prices were escalated to 2025 dollars assuming 2.5% inflation.
134 We also conduct more sophisticated analysis taking into account differences in MER and marginal
heat rate (MHR) between Upstate and Downstate resources to estimate average LBMPs, MERs, and
MHRs in zones E and F in the 2025 transmission equilibrium. This analysis yields an estimated MER
spread of 0.11 tons/MWh, very similar to that estimated with the simple analysis described above.

62 | brattle.com
generation at the margin. It would reward activities that reduce or shift load from times when
emissions are high. A carbon charge would thus complement existing, more targeted clean
energy policies; by identifying additional sources of low-cost abatement, a carbon charge would
improve the economic efficiency of meeting the state’s energy and environmental goals.
We estimate that more of the economic gains would flow to producers than consumers, but
customer costs would not rise materially. Compared to the CES and RGGI alone, a supplemental
carbon charge would increase wholesale electric energy prices, but returning carbon revenues to
customers and other factors would offset most of the customer cost impact. The exact magnitudes
are uncertain, but the net impact on customer costs remains relatively small under all
assumptions considered.
We suggest several areas for further inquiry as NYISO, DPS, and stakeholders further develop
and evaluate ideas for harmonizing wholesale markets and state policy goals. One is to further
examine the implications of different market designs regarding carbon charges, particularly
revenue allocation, border adjustments, and potential refinements to REC and ZEC procurement
for allocating the risk of future changes in carbon prices between customers and suppliers.
Another is to solicit stakeholder feedback on the reasonableness of modeling assumptions,
especially regarding dynamic effects, and then to examine the implications of alternative
assumptions.

63 | brattle.com
List of Acronyms BCA Benefit-Cost Analysis
CAISO California Independent System Operator
CARB California Air Resources Board
CC Gas-Fired Combined-Cycle Generator
CEMS Continuous Emissions Monitoring Service
CES Clean Energy Standard
CO2 Carbon Dioxide
CO2e Carbon Dioxide Equivalent
CONE Cost of New Entry
CPF Carbon Price Floor
CPSR Carbon Price Support Rate
CT Gas-Fired Combustion Turbine
DER Distributed Energy Resource
DPS Department of Public Service
DR Demand Response
EDC Electricity Distribution Company
EIM Energy Imbalance Market
EPA Environmental Protection Agency
ERCOT Electric Reliability Council of Texas
ETS Emissions Trading System
EU European Union
GHG Greenhouse Gas
ICAP Installed Capacity
IESO Independent Electricity System Operator of Ontario
ISO Independent System Operator
ISO-NE Independent System Operator of New England
kWh Kilowatt Hour
LBMP Locational Based Marginal Price
LCFS Low Carbon Fuel Standard
LCOE Levelized Cost of Energy
LMP Locational Marginal Price
LSE Load-Serving Entity
MER Marginal Emissions Rate
MHR Marginal Heat Rate

64 | brattle.com
MISO Midcontinent Independent System Operator
MMBtu Million British Thermal Units
MMT Million Metric Ton
MRR Mandatory Reporting Regulation
MW Megawatt
MWh Megawatt Hour
NEM Net Energy Metering
NEPOOL New England Power Pool
NOx Nitrogen Oxide
NYCA New York Control Area
NYISO New York Independent System Operator
NYPA New York Power Authority
NYPSC New York Public Service Commission
NYSERDA New York State Energy Research and Development Authority
PJM PJM Interconnection
PV Photovoltaic
REC Renewable Energy Credit
REV Reforming the Energy Vision
RGGI Regional Greenhouse Gas Initiative
SCC Social Cost of Carbon
SEP State Energy Plan
SO2 Sulfur Dioxide
ST Steam Turbine
TCC Transmission Congestion Contract
tCO2 Tons of Carbon Dioxide
TWh Terrawatt Hour
UCAP Unforced Capacity
VOM Variable Operations & Maintenance
WECC Western Electricity Coordinating Council
ZEC Zero-Emissions Credit

65 | brattle.com
Bibliography ABB, Inc. (2015). Energy Velocity Suite. Data downloaded in October 2016–February 2017.
Brookfield (2016). Carbon Adder and Cost Allocation from NEPOOL IMAPP stakeholder process.
November 10, 2016. Posted at
http://nepool.com/uploads/IMAPP_20161110_Carbon_Adder.pdf
California Air Resources Board (2008). Climate Change Scoping Plan. December 2008 Posted at
https://www.arb.ca.gov/cc/scopingplan/document/adopted_scoping_plan.pdf
California Air Resources Board (2013a). First Update to Climate Change Scoping Plan. Posted at
https://www.arb.ca.gov/cc/scopingplan/2013_update/first_update_climate_change_scoping_pla
n.pdf
California Air Resources Board (2013b). Final Regulation Order: California Cap on Greenhouse Gas
Emissions and Market-Based Compliance Mechanisms. Posted at
https://www.arb.ca.gov/regact/2013/capandtrade13/ctreg.pdf
California Air Resources Board (2015). EDU Use of Allocated Allowance Value Summary Report.
August 13, 2015. Posted at
https://www.arb.ca.gov/cc/capandtrade/allowanceallocation/edu-v2013-allowance-value-
report.pdf
California Air Resources Board (2016a). Final Regulation Order Article 5: California Cap on
Greenhouse Gas Emissions and Market-based Compliance Mechanisms. March 2016. Posted at
https://www.arb.ca.gov/cc/capandtrade/capandtrade/unofficial_ct_030116.pdf
California Air Resources Board (2016b). Mandatory GHG Reporting—Asset Controlling Supplier.
Accessed February 2017. Posted at https://www.arb.ca.gov/cc/reporting/ghg-rep/ghg-rep-
power/acs-power.htm
California Air Resources Board (2016c). Proposed Amendments to the Regulation for the Mandatory
Reporting of Greenhouse Gas Emissions. Posted at
https://www.arb.ca.gov/regact/2016/ghg2016/attacha.pdf
California Air Resources Board (2016d). Proposed Amendments to the California Cap on Greenhouse
Gas Emissions and Market-Based Compliance Mechanisms Regulation. Posted at
https://www.arb.ca.gov/regact/2016/capandtrade16/attacha.pdf
California Air Resources Board (2016e). California’s 2000–2014 Greenhouse Gas Inventory Technical
Support Document. September 2016. Posted at
https://www.arb.ca.gov/cc/inventory/doc/methods_00-14/ghg_inventory_00-
14_technical_support_document.pdf
California Air Resources Board (2017). Response to Request for Findings under SB 1018. March 16,
2017. Posted at
https://www.arb.ca.gov/cc/capandtrade/linkage/response_to_sb_1018_request.pdf
California ISO (2016). Regional Integration California Greenhouse Gas Compliance and EIM
Greenhouse Gas Enhancement Straw Proposal. November 17, 2016. Posted at

66 | brattle.com
https://www.caiso.com/Documents/StrawProposal-RegionalIntegration-
EIMGreenhouseGasCompliance.pdf
California ISO (2017a). Business Practice Manuals. Accessed February 2017. Posted at
https://www.caiso.com/rules/Pages/BusinessPracticeManuals/Default.aspx
California ISO (2017b). Flexible resource adequacy criteria and must offer obligations. Accessed
February 2017. Posted at
https://www.caiso.com/informed/Pages/StakeholderProcesses/FlexibleResourceAdequacyCriteri
a-MustOfferObligations.aspx
California Public Utilities Commission (2013). CPUC Sets Energy Storage Goals for Utilities. October
17, 2013. Posted at
http://docs.cpuc.ca.gov/PublishedDocs/Published/G000/M079/K171/79171502.PDF
CBC News (2016). “Justin Trudeau gives provinces until 2018 to adopt carbon price plan”. October 3,
2016. Posted at http://www.cbc.ca/news/politics/canada-trudeau-climate-change-1.3788825
Center for Climate and Energy Solutions (C2ES) (2017). A Look at Emissions Targets. Accessed
February 2017. Posted at https://www.c2es.org/what_s_being_done/targets
Chang, Judy, Jurgen Weiss, and Yingxia Yang (2014). A Market-based Regional Approach to Valuing
and Reducing GHG Emissions from Power Sector. Prepared for Great River Energy. April 2014.
Posted at
http://www.brattle.com/system/news/pdfs/000/000/616/original/A_Market-
based_Regional_Approach_to_Valuing_and_Reducing_GHG_Emissions_from_Power_Sector.p
df?1397501081
Climate Leadership Council (2017). The Conservative Case for Carbon Dividends. February 2017.
Posted at
https://www.clcouncil.org/wp-
content/uploads/2017/02/TheConservativeCaseforCarbonDividends.pdf
Cunningham, Greg (2016). Integrating Markets and Public Policy: Using Competitive Markets to
Achieve New England’s Public Policy Goals. Posted at https://www.iso-ne.com/static-
assets/documents/2016/11/2016_12_01_clg_meeting_greg_cunningham_panelist_presentation.p
df
U.S. Energy Information Agency (2017a). Annual Energy Outlook 2017. Posted at
http://www.eia.gov/outlooks/aeo/data/browser/#/?id=62-AEO2017®ion=3-8&cases=ref2017
U.S. Energy Information Agency (2017b). California Electricity Profile 2015. Release Date: January
17, 2017. Posted at https://www.eia.gov/electricity/state/california/
U.S. Energy Information Agency (2016). Electric power sales, revenue, and energy efficiency Form
EIA-861 detailed data files. Posted at https://www.eia.gov/electricity/data/eia861/
Energy News Release (2008). Green-e Energy Policy Update: RGGI state Set-Aside Provisions for
Voluntary Renewable Energy Sales and Green-e Energy Eligibility. December 5, 2008. Accessed
February 2017. Posted at
https://resource-solutions.org/pressreleases/2008/120508-2.htm

67 | brattle.com
Environmental Defense Fund (2015). United Kingdom: an Emissions Trading Case Study. May 2015.
Posted at
https://ieta.wildapricot.org/resources/Resources/Case_Studies_Worlds_Carbon_Markets/uk_cas
e_study_may2015.pdf
Environmental Defense Fund (2016). Case 15-E-0302 – Proceeding on Motion of the Commission to
Implement a Large-Scale Renewable Program and a Clean Energy Standard. April 22, 2016.
Posted at http://documents.dps.ny.gov/public/Common/ViewDoc.aspx?DocRefId=%7B6D00EDC7-03BB-44FB-
897A-C76F19CD7995%7D
Exelon (2016). Update on Carbon Price Proposal from NEPOOL IMAPP stakeholder process.
November 10, 2016. Posted at
http://nepool.com/uploads/IMAPP_20161110_Exelon_Carbon_Price_Proposal_Update.pdf
Global News (2016). “Premier Kathleen Wynne calls high electricity prices her ‘mistake’”. November
19, 2016. Posted at http://globalnews.ca/news/3076892/premier-kathleen-wynne-calls-high-
electricity-prices-her-mistake/
Governor Cuomo (2016). 2016 state of the state. Posted at
https://www.governor.ny.gov/sites/governor.ny.gov/files/atoms/files/2016_state_of_the_state_B
ook.pdf
Grover, David, Ganga Shreedhar, and Dimitri Zenghelis. The competitiveness impact of a UK carbon
price: what do the data say? January 2016. Posted at
http://www.lse.ac.uk/GranthamInstitute/publication/competitiveness-impact-of-a-uk-carbon-
price/
Independent Electricity System Operator (IESO) (2016a), Ontario Planning Outlook: A technical report on the Electricity system prepared by the IESO, September 1, 2016. Posted at
http://www.ieso.ca/Documents/OPO/Ontario-Planning-Outlook-September2016.pdf
Independent Electricity System Operator (IESO) (2016b), Global Adjustment, accessed 2016. Posted
at http://www.ieso.ca/Pages/Ontario%27s-Power-System/Electricity-Pricing-in-
Ontario/Global-Adjustment.aspx
Independent Electricity System Operator (IESO) (2016c), Price Overview, accessed 2016. Posted at
http://www.ieso.ca/Pages/Power-Data/Price.aspx
Independent Electricity System Operator (IESO) (2017), Market Renewal, accessed 2017. Posted at
http://www.ieso.ca/Pages/Participate/Stakeholder-Engagement/Market-Renewal.aspx
Independent System Operator of New England (ISO-NE) (2017). Market Rule 1, Section 13—Forward
Capacity Market. February 24, 2017. Posted at https://www.iso-ne.com/static-
assets/documents/regulatory/tariff/sect_3/mr1_sec_13_14.pdf
ISO Newswire (2017). “The New England states have an ongoing framework for reducing greenhouse
gas emissions.” March 1, 2017. Posted at: http://isonewswire.com/updates/2017/3/1/the-new-
england-states-have-an-ongoing-framework-for-reducin.html
68 | brattle.com
Maryland Department of the Environment (2015). The 2015 Greenhouse Gas Emissions Reduction
Act Plan Update. October 2015. Posted at http://news.maryland.gov/mde/wp-
content/uploads/sites/6/2015/10/GGRA_Report_FINAL_10-29-15.pdf
Massachusetts Executive Office of Energy and Environmental Affairs (2017). Reducing GHG
Emissions under Section 3(d) of the Global Warming Solutions Act (GWSA). Accessed February
2017. Posted at
http://www.mass.gov/eea/agencies/massdep/air/climate/section3d-comments.html
Midcontinent ISO (2017). Ramp Management. Accessed February 2017. Posted at
https://www.misoenergy.org/WhatWeDo/MarketEnhancements/Pages/RampManagement.aspx
National Renewable Energy Laboratory (2010a). Eastern Wind Integration and Transmission Study.
Posted at http://www.nrel.gov/docs/fy09osti/46505.pdf
National Renewable Energy Laboratory (2010b). System Advisor Model. Posted at
https://sam.nrel.gov/
NEPOOL (2016). Policies and Markets Problem statement. Posted at
http://nepool.com/uploads/IMAP_20160517_Problem_statement.pdf
NEPOOL (2017). NEPOOL 2016 IMAPP Proposals: Observations, Issues, and Next Steps. January
2017. Posted at
http://nepool.com/uploads/IMAPP_20170125_ISO-NE_Discussion_Paper.pdf
NESCAUM (2001). Climate Change Action Plan 2001. August 2001. Posted at
http://www.nescaum.org/projects/greenhouse-gas-early-action-demonstration-
project/negecpactionplancc.pdf/view
NESCOE (2016). State IMAPP Objectives. September 30, 2016. Posted at
http://nepool.com/uploads/IMAPP_20161006_IMAPP_Objectives_to_NEPOOL_9_30_16.pdf
NYISO (2017a). NYISO Installed Capacity Strip Auction Summary. Accessed February 2017. Posted
at http://icap.nyiso.com/ucap/public/auc_view_strip_detail.do
NYISO (2017b). Interface Limits and Flows. Accessed February 2017. Posted at
http://www.nyiso.com/public/markets_operations/market_data/custom_report/index.jsp?report
=interface_limitshttp://www.nyiso.com/public/markets_operations/market_data/custom_report
/index.jsp?report=interface_limits
NYISO (2017c). Power Trends 2017. May 19, 2017. Posted at
http://www.nyiso.com/public/webdocs/markets_operations/committees/environmental_advisor
y_council/meeting_materials/2017-05-19/Power_Trends_2017_presentation.pdf
NYISO (2017d). Re: Docket No. ER17-386-000, New York Independent System Operator, Inc. –
Compliance Filing. Filed before FERC February 15, 2017.
NYISO (2017e). Local Minimum Installed Capacity Requirements Study: Covering the New York
Balancing Authority Area for the 2017 – 2018 Capability Year. January 13, 2017. Posted at
http://www.nyiso.com/public/webdocs/markets_operations/services/planning/Documents_and_
Resources/Resource_Adequacy/Resource_Adequacy_Documents/LCR2017_Report.pdf

69 | brattle.com
NYISO (2016a). 2016 Load and Capacity Report: “Gold Book”. April 2016. Posted at
http://www.nyiso.com/public/webdocs/markets_operations/services/planning/Documents_and_
Resources/Planning_Data_and_Reference_Docs/Data_and_Reference_Docs/2016_Load__Capac
ity_Data_Report.pdf
NYISO (2016b). Demand Curve Reset NYISO Staff Recommendations Initial Draft. August 17, 2016.
Posted at
http://www.nyiso.com/public/webdocs/markets_operations/committees/bic_icapwg/meeting_m
aterials/2016-08-19/Initial%20Draft%20NYISO%20DCR%20Recommendation%20Final.pdf
NYISO (2016c). Installed Capacity Manual. December 2016. Posted at
http://www.nyiso.com/public/webdocs/markets_operations/documents/Manuals_and_Guides/
Manuals/Operations/icap_mnl.pdf
NYISO (2016d). Central-East Voltage Collapse Transfer Limits. April 20, 2016. Posted at
http://www.nyiso.com/public/webdocs/markets_operations/market_data/power_grid_info/CE_
VC_Static_limit_posting.pdf
NYISO (2016e). Proposed NYISO Installed Capacity Demand Curves For Capability Year 2017/2018
and Annual Update Methodology and Inputs For Capability Years 2018/2019, 2019/2020, and
2020/2021. August 17, 2016. Posted at
http://www.nyiso.com/public/webdocs/markets_operations/committees/bic_icapwg/meeting_m
aterials/2016-08-
19/Initial%20Draft%20NYISO%20DCR%20Recommendation%20Final.pdf#page=45
NYISO (2015a). Hourly Marginal Generator Data. Provided to Brattle by NYISO.
NYISO (2015b). 2015 Congestion Assessment and Resource Integration Study. November 17, 2015.
NYISO (2014). 2014-2017 Demand Curve Parameters and Demand Curves. Posted at
http://www.nyiso.com/public/webdocs/markets_operations/market_data/icap/Reference_Docu
ments/2014-2017%20Demand%20Curve%20Reset/Demand_Curve_Reset/2014-
2017%20Demand%20Curve%20Parameters%20and%20Demand%20Curves.pdf
NYISO (2010). Growing Wind: Final Report for the NYISO 2010 Wind Generation Study. September
2010. Posted at http://www.uwig.org/growing_wind_-
_final_report_of_the_nyiso_2010_wind_generation_study.pdf
New York Power Authority (2016). 2015 NYPA Annual Report. Posted at
http://www.nypa.gov/NYPA-2015-AnnualReport.pdf
New York Public Service Commission (2016a). Order Adopting a Clean Energy Standard. Issued and
Effective August 1, 2016. Posted at
http://documents.dps.ny.gov/public/Common/ViewDoc.aspx?DocRefId=%7B1A8C4DCA-
E2CC-449C-AA0D-7F9C3125F8A5%7D
New York Public Service Commission (2016b). Order Adopting the Benefit Cost Analysis
Framework. Issued and Effective January 21, 2016.

70 | brattle.com
New York Public Service Commission (2017). Order on Net Energy Metering Transition, Phase One
of Value of Distributed Energy Resources, and Related Matters. Issued and Effective March 9,
2017.
New York Department of Public Service (2016). Clean Energy Standard White Paper – Cost Study.
April 8, 2016. Posted at
http://documents.dps.ny.gov/public/Common/ViewDoc.aspx?DocRefId=%7B7B564AD9-E6E9-
4FA9-93B6-1AA85B1719E2%7D
New York Governor Press Office (2017). Governor Cuomo Announces 10th Proposal of the 2017
state of the state: Closure of the Indian Point Nuclear Power Plant by 2021. January 9, 2017.
Posted at https://www.governor.ny.gov/news/governor-cuomo-announces-10th-proposal-2017-
state-state-closure-indian-point-nuclear-power
New York Executive Order No. 24 (2009). Establishing a Goal to Reduce Greenhouse Gas Emissions
Eighty Percent by the Year 2050 and Preparing a Climate Action Plan. 9 N.Y.C.R.R. 7.24.
Posted at http://www.dec.ny.gov/energy/71394.html
New York Executive Order No. 2 (2011). Review, Continuation and Expiration of Prior Executive
Orders. 9 CRR-NY 8.2. January 1, 2011. Posted at
https://govt.westlaw.com/nycrr/Document/Id01f77a2820711e0be360000845b8d3e?viewType=F
ullText&originationContext=documenttoc&transitionType=CategoryPageItem&contextData=(s
c.Default)
New York Department of Public Service (2014). Case 14-M-0101: Proceeding on Motion of the
Commission in Regard to Reforming the Energy Vision, Order Instituting Proceeding. Issued
April 25, 2014. Posted at
http://documents.dps.ny.gov/public/Common/ViewDoc.aspx?DocRefId={9CF883CB-E8F1-
4887-B218-99DC329DB311}
New York State Energy Research and Development Authority (2015). Patterns and Trends New York
State Energy Profiles: 1999–2013. October 2015. Posted at
https://www.nyserda.ny.gov/-/media/Files/Publications/Energy-Analysis/1999-2013-Patterns-
Trends.pdf
Newell, Samuel A., Rebecca Carroll, Pablo Ruiz, and Will Gorman (2015a). Cost-Benefit Analysis of ERCOT’s Future of Ancillary Services (FAS) Proposal. December 21, 2015. Posted at
http://www.ercot.com/content/wcm/key_documents_lists/30517/667NPRR_12a_Cost_Benefit_
Analysis_122115.pdf
Newell, Samuel A., Bruce Tsuchida, J. Michael Hagerty, Akarsh Sheilendranath, Nicole Irwin, and
Lauren Regan (2015b). Benefit-Cost Analysis of Proposed New York AC Transmission Upgrades. September 15, 2015. Posted at
http://www.brattle.com/system/publications/pdfs/000/005/391/original/Benefit-
Cost_Analysis_of_Proposed_New_York_AC_Transmission_Upgrades.pdf?1484245022
Newell, Samuel A., J. Michael Hagerty, Kathleen Spees, Johannes P. Pfeifenberger, and Quincy Liao
(2014). Cost of New Entry Estimates for Combustion Turbine and Combined Cycle Plants in PJM with June 1, 2018 Online Date. Prepared for PJM. May 15, 2014. Posted at

71 | brattle.com
http://www.brattle.com/system/publications/pdfs/000/005/010/original/Cost_of_New_Entry_Es
timates_for_Combustion_Turbine_and_Combined_Cycle_Plants_in_PJM.pdf
Ontario Energy Board (2005), Market Surveillance Panel: Monitoring Report on the IESO-
Administered Electricity Markets for the period from May 2005–October 2005, December 2005.
Posted at
http://www.ontarioenergyboard.ca/documents/msp/msp_report%20final_131205.pdf
Ontario Energy Board (2006), Market Surveillance Panel: Monitoring Report on the IESO-
Administered Electricity Markets for the period from November 2005–April 2006, June 14,
2006. Posted at
http://www.ontarioenergyboard.ca/documents/msp/msp_report_final_130606.pdf
Ontario Energy Board (2016), Monitoring Report on the IESO-Administered Electricity Markets for
the period from May 2015–October 2015, November 2016. Posted at
http://www.ontarioenergyboard.ca/oeb/_Documents/MSP/MSP_Report_May2015-
Oct2015_20161117.pdf
Ontario Ministry of Energy (2016). Climate Change. Accessed February 2017. Posted at
http://www.energy.gov.on.ca/en/ontarios-electricity-system/climate-change/
Pfeifenberger, Johannes, Samuel A. Newell, Kathleen Spees, Attila Hajos, and Kamen Madjarov
(2011). Second Performance Assessment of PJM's Reliability Pricing Model: Market Results 2007/08 through 2014/15, August 26, 2011.
Potomac Economics (2016). 2015 State of the Market Report for the NYISO Markets. May 2016.
Posted at
http://www.nyiso.com/public/webdocs/markets_operations/documents/Studies_and_Reports/R
eports/Market_Monitoring_Unit_Reports/2015/NYISO%202015%20SOM%20Report_5-23-
2016-CORRECTED.pdf
PWC (2013). UK Carbon pricing: A taxing issue, Climate and Sustainability Blog. April 3, 2013.
Accessed February 2017. Posted at http://pwc.blogs.com/sustainability/2013/04/uk-carbon-
pricing-a-taxing-issue.html
Regional Greenhouse Gas Initiative (2012). RGGI 2012 Program Review: Summary of
Recommendations to Accompany Model Rule Amendments. Posted at
https://www.rggi.org/docs/ProgramReview/_FinalProgramReviewMaterials/Recommendations
_Summary.pdf
Regional Greenhouse Gas Initiative (2015). Auction Results. Posted at
http://rggi.org/market/co2_auctions/results
Regional Greenhouse Gas Initiative (2016). RGGI Public Stakeholder Meetings, June 17, 2016 and
November 21, 2016 Meeting Materials. Posted at http://rggi.org/design/2016-program-
review/rggi-meetings
Rudkevich, Aleksandr, and Pablo A. Ruiz (2012). Locational Carbon Footprint of the Power Industry:
Implications for Operations, Planning and Policy Making. In Q.P. Zheng et al. (eds.), Handbook of CO2 in Power Systems, pp. 131-165. Springer-Verlag, Berlin, 2012.

72 | brattle.com
Sartor, O., and N. Berghmans (2011). Carbon price flaw? The impact of the UK’s CO2 price support
on the EU ETS. (No. 6), Climate Brief. CDC Climate Research. Posted at
http://www.i4ce.org/download/climate-brief-n6-carbon-price-flaw-the-impact-of-the-uks-co2-
price-support-on-the-eu-ets/
SNL (2017). Indian Point shutdown ‘icing on the cake’ for Cricket Valley’s global investors. January
24, 2017.
Spees, Kathleen, and Judy Chang (2017). A Dynamic Clean Energy Market: Straw Proposal for a
Long-Term IMAPP Design. Presented at NEPOOL Integrating Markets and Public Policy
Forum, May 17, 2017. Posted at
http://www.nepool.com/uploads/IMAPP_20170517_LT_Straw_Dynam_Clean_Energy_Market.
SSE (2016). What did the Carbon Price Floor Ever Do for Us? Accessed February 2017. Posted at
http://sse.com/newsandviews/allarticles/2016/03/what-did-the-carbon-price-floor-ever-do-for-
us/http://sse.com/newsandviews/allarticles/2016/03/what-did-the-carbon-price-floor-ever-do-
for-us/
Stiglitz, Joseph E. (1988) Economics of the Public Sector. 1988.
Hon. Thibeault, Glenn, Minister of Energy (2016). Remarks at Empire Club of Canada November 28,
2016.
U.K. Government (2009). The UK Low Carbon Transition Plan. July 20, 2009. Posted at
https://www.gov.uk/government/uploads/system/uploads/attachment_data/file/228752/9780108
508394.pdf
U.K. Government (2014). Carbon price floor: reform and other technical amendments. March 19,
2014. Posted at
https://www.gov.uk/government/uploads/system/uploads/attachment_data/file/293849/TIIN_60
02_7047_carbon_price_floor_and_other_technical_amendments.pdf
U.K. Parliament (2012). Go-it-alone UK Carbon Price Floor could harm industry and consumers.
January 26, 2012. Posted at
http://www.parliament.uk/business/committees/committees-a-z/commons-select/energy-and-
climate-change-committee/news/eu-ets-publication1/ (accessed November 11, 2016)
U.S. Government (2015). Technical Support Document: Technical Update of the Social Cost of
Carbon for Regulatory Impact Analysis Under Executive Order 12866. May 2013, revised July
2015.
Varadarajan, Uday, David Nelson, Brendan Pierpont, and Morgan Hervé-Mignucci (2011). The
Impacts of Policy on the Financing of Renewable Projects: A Case Study Analysis. October 3,
2011. Posted at https://climatepolicyinitiative.org/wp-content/uploads/2011/12/Policy-Impacts-
on-Financing-of-Renewables.pdf
Weber, Chris and Chris Clavin. Life Cycle Carbon Footprint of Shale Gas: Review of Evidence and
Implications. Environmental science & technology 46.11 (2012): 5688-5695. Posted at
http://pubs.acs.org/doi/abs/10.1021/es300375n

73 | brattle.com
World Coal (2015). Britain’s war on coal: the fallout. November 6, 2015. Posted at
https://www.worldcoal.com/special-reports/06112015/britains-war-on-coal-the-fallout-3122/
WSKG News (2015). Cayuga Power Plant and NYSEG Fail to Agree on Plant’s Future. February 9,
2015. Posted at http://wskgnews.org/post/cayuga-power-plant-and-nyseg-fail-agree-plants-
future

Recommended