t
Changes in the Electric Power SectorChanges in the Electric Power Sector
Presented to Sustainable Energy –
ChChoosiing AAmong OOptiions
St F irfaxSteve Fai f
September 30, 2010September 30, 2010

•
OutlineOutline
• Who is Steve Fairfax? • Introduction to the grid • Bulk electric power marketplaceBulk electric power marketplace • Distributed generation
Steve Fairfax
MIT • Course VIII 1978 • Course VI, VIII 1984 • 1988-94 Head of engineering Alcator tokamak
• Consultant, guest lectures 1994-present
1984-1986 Principal Engineer Cyborg, Newton MA 1986 1988 Principal Engineer KSI Beverly MA1986-1988 Principal Engineer KSI, Beverly MA 1994-1997 Failure Analysis Associates Inc. 1997-present President, MTechnology, Inc. 1997 present President, MTechnology, Inc.
i
MTechnology, Inc.MTechnology, Inc.
•• Founded 1996Founded 1996 • Applied quantitative risk assessment to 7x24 industries
• Leverage techniques, tools from nuclear power • E l te missi iti l systems from 30 kW t 180 MWEvaluat ion-critical t 30 kW t o 180 MW
• Power electronic systems development • 1200 kVA power plant for Rolls-Royce Fuel Cell Systems • 2 kA magnet protection system for proton beam therapy
cyclotron

• •
Selected ClientsSelected Clients
OEMs • Active PowerActive Power• APC-MGE • Cummins • Emerson / Liebert • Power One • Rolls Royce Fuel Cell • S&C Electric Company • Siemens • Still River Systems • SustainXSustainX
Utilities • First Energy • Progress Energy • Salt River Project • NorthEast Utilities • Detroit Edison
End Users • Clean Energy Group Clean Energy Group • Fidelity Investments • First Solar • Goldman Sachs • Harvard Medical School • Jones Day • JP Morgan Chase • Merck & Co. • MIT
Consultants/Engineers • CH2M HILL Industrial Design &
Construction • EPRI PEAC • HDRHDR • EYP Mission Critical Facilities • Jones Lang LaSalle • Tishman Speyer

t t t t
Introduction to the gridIntroduction to the grid
Role of electric power issi di strib PPower pllants, transmi ion, di ibutiion
As-built summary -power, plants, lines, miles, substations, etc.power, plants, lines, miles, substations, etc.
Transmission system design requirements Transmission voltages, stability limits

•
•
Role of Electric PowerRole of Electric Power
National Academy of Engineering: Greatest Engineering Achievements of the 20Greatest Engineering Achievements of the 20 th Centuryth Century
#1 - Electrification
Electric power is essential to modern society
Critical infrastructure relying on electric power: • Information and communications • Banking finance commerceBanking, finance, commerce • Oil and gas production and transport • Rail and air transport • WaterWater • Sewage

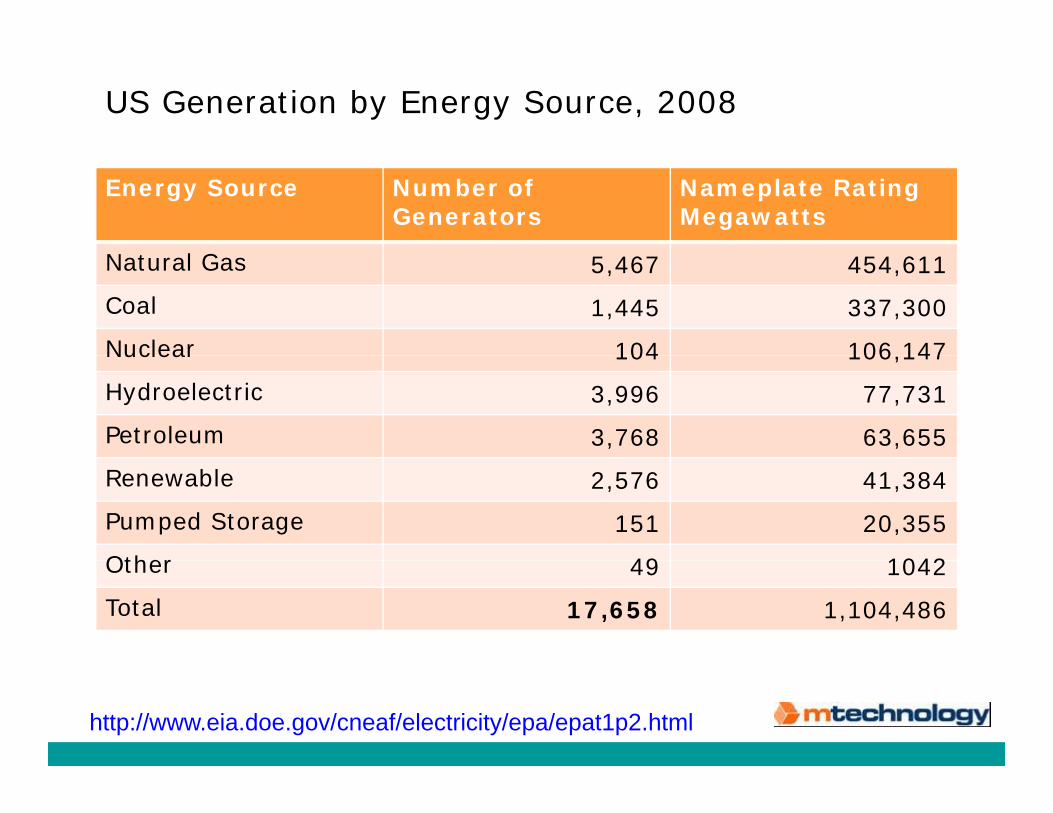
US Generation by Energy Source, 2008
Energy Source Number of Generators
Nameplate Rating Megawatts
l GNatural Gas 5,467 454,611
Coal 1,445 337,300
Nuclear 104 106 147Nuclear 104 106,147
Hydroelectric 3,996 77,731
Petroleum 3,768 63,655
Renewable 2,576 41,384
Pumped Storage 151 20,355
Other 49 1042 Other 49 1042
Total 17,658 1,104,486
http://www.eia.doe.gov/cneaf/electricity/epa/epat1p2.html

US Generation, Change 2006-2008
Energy Source Number of Generators
Nameplate Rating Megawatts
l GNatural Gas -3 +11,666
Coal -48 +1,470
Nuclear 0 +562Nuclear 0 +562
Hydroelectric +8 +312
Petroleum 24 -663
Renewable +753 +14,914
Pumped Storage +1 +786
Other 103 2 497 Other -103 -2,497
Total +734 +28,809
http://www.eia.doe.gov/cneaf/electricity/epa/epat1p2.html

t
Transmission Voltages
• 765 kV – 2,426 miles • 500 kV – 25,000 miles • 345 kV – 51,025 miles • 230 kV – 76,437 miles • 230-450 kV DC (+/-) 1,351 miles • 500 kV DC (+/-) 1,333 miles
T l 157 314 il• Total: 157,314 miles • Including 115 and 138 kV circuits:
680,000 miles680,000 miles • Interstate highways: 46,677 miles Source: North American Electric Reliability Council (NERC) 2001

Image by Rolypolyman on Wikimedia Commons.
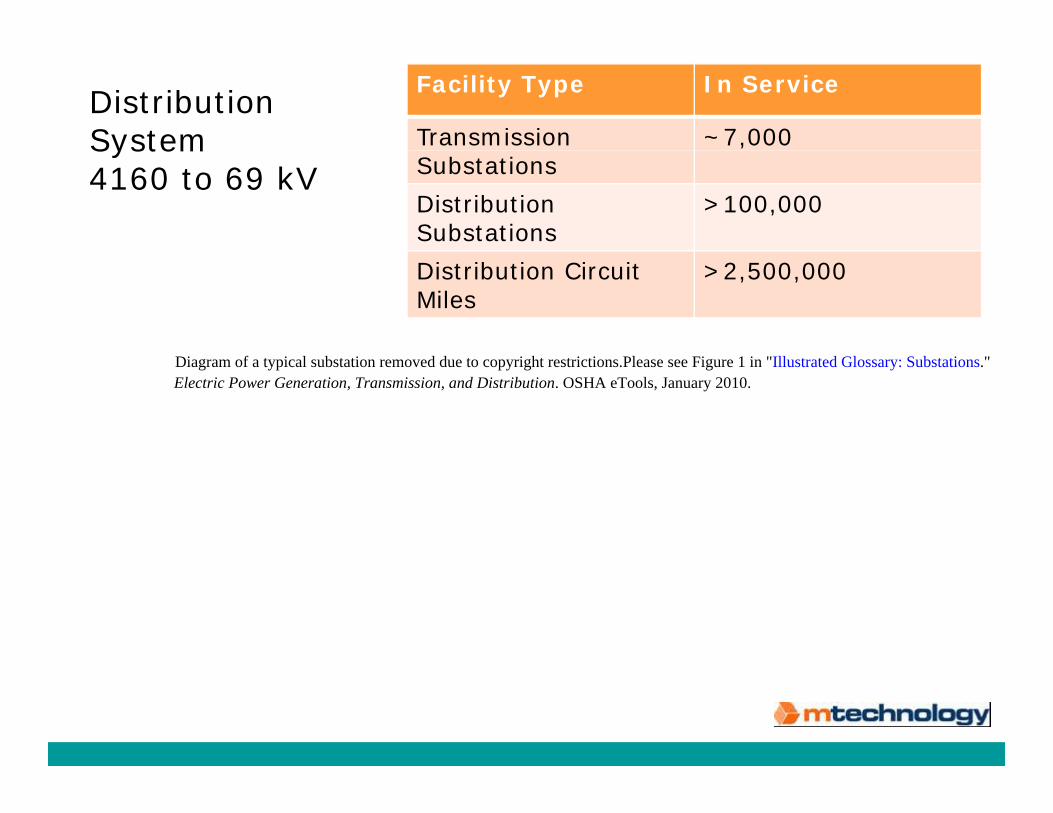
Distribution SystemSystem 4160 to 69 kV
Facility Type In Service
Transmission ~7,000 Substations
Distribution Substations
>100,000
Diagram of a typical substation removed due to copyright restrictions.Please see Figure 1 in " Illustrated Glossary: Substations."Electric Power Generation, Transmission, and Distribution. OSHA eTools, January 2010.
Distribution Circuit Miles
>2,500,000

Purpose of HV Transmission System (as built)
• Transmit ppower from hyydroelectric pplants • Often long lines, subsidized by governments
• James Bay to Montreal: 1,000 km, 11,000 MW • James Bay to Boston: 1,500 km, 2,200 MW
• Bulk supply of power to load centers • Cities, large factories • Lines typically short, <100 miles, essentially dedicatedLines typically short, <100 miles, essentially dedicated
• Interconnection between utility networks • Emergencies such as station or line failures •• Share spinning reservesShare spinning reserves • Reduce required capacity margins
Fundamental Requirements of AC Transmission Stability: Generators must remain in synchronismStability: Generators must remain in synchronism
• Stability decreases as lines are more heavily loaded
• Static Stability: Slowly increasing power will eventually cause generators to pull out of synchronizationsynchronization
• Dynamic Stability: System must return to stable operation after minor disturbance such as step load
• Transient Stability: System must recover after major fault generator trip transformer failuremajor fault, generator trip, transformer failure

Fundamental Requirements of AC Transmission Voltages must be kept near rated valuesVoltages must be kept near rated values
• Undervoltage can damage equipment • Induction motor current increases sharply - Rotor heatinggp y
proportional to square of current • Electronic loads increase current to maintain constant
power •• Line and system losses increase as square of Line and system losses increase as square of
current • Negative resistance characteristic
• Overvoltage can damage equipmentOvervoltage can damage equipment • Insulation failure on HV, EHV, UHV equipment • Transformer saturation causes
• Increased losses • Harmonics • Potential ferroresonance
• Relatively small (5-7%) changes in transmission voltages cause large, unpredictable changes in power flow

= =
Transmission Lines are Transmission Lines!
Image by MIT OpenCourseWare.
Typical values: R = 0.06 ohm per mile Z = 300 ohms
XL = 0 8 ohm per mile XC = 0 2 megohm per mile XL 0.8 ohm per mile XC 0.2 megohm per mile
Sending End Receiving End
ES
IS IR
ER
R + jXL
-jXC
Diagram Representing Long Transmission Lines

Capacity Limits for Transmission Lines
Graph removed due to copyright restrictions. Please see Fig. 7 in Hurst, Eric, and Brendan Kirby. "Transmission Planning for a Restructuring U.S. Electricity Industry." Edison Electric Institute, June 2001.
Source: Transmission Planningg for a Restructuringg U.S. Electricityy Industry, Eric Hurst and Brendan Kirby, prepared for Edison Electric Institute, 2001

Changes in the Electric Grid
DemandDemand
Regulation
Generation Mix
Transmission
Technology

*
Changes in the Electric Grid - Demand
Electric utilities forecast demand to increase 2008-2017 by 17 t (128 GW) i th U it d St 17 percent (128 GW) in the United Stattes 8 percent (6 GW) in Canada,
Generation resources Generation resources are forecast to increase by only are forecast to increase by only 4.6 percent (42 GW) in the U.S. and by 1.1 percent (1 GW) in Canada.
Electric capacity margins will decline over the 2008–2017 period in most regions.
North American Electric Reliability Council. 2008 Long-Term Reliability Assessment.
*Net generating capacity resources (existing, under construction, or planned) considered available (net operable), deliverable, and committed to serve demand, plus the net of capacity purchases and sales.

Demand for Electric Power Continues to Grow
Electric Generation 1949Electric Generation 1949-2008-2008 3.E+9
sMM
eg
aww
att
--
Ho
urs
2.E+9
1.E+9
0.E+0
1940 1950 1960 1970 1980 1990 2000 2010 20201940 1950 1960 1970 1980 1990 2000 2010 2020
Year http://www.eia.doe.gov/emeu/aer/elect.html

Changes in the Electric Grid - Regulation
• Federal intervention accelerating in pace and scope • 1978 – PURPA, Public Utility Regulatory Policies Act – aka
“deregulation” aka “re-regulation”deregulation aka re regulation • 1992 – Energy Policy Act – Federal Energy Regulatory
Commission given broad powers over wholesale generation and transmission network
• 1996 – FERC orders 888 and 889 – open access transmission • 2005 and 2007 Energy Acts - mandates on
• Renewable energy • Demand management • Smart metering • Financial incentives
•• 2008 Energy legislation in the bailout bill(s)2008 - Energy legislation in the bailout bill(s) • 2009 and 2010 – lost track
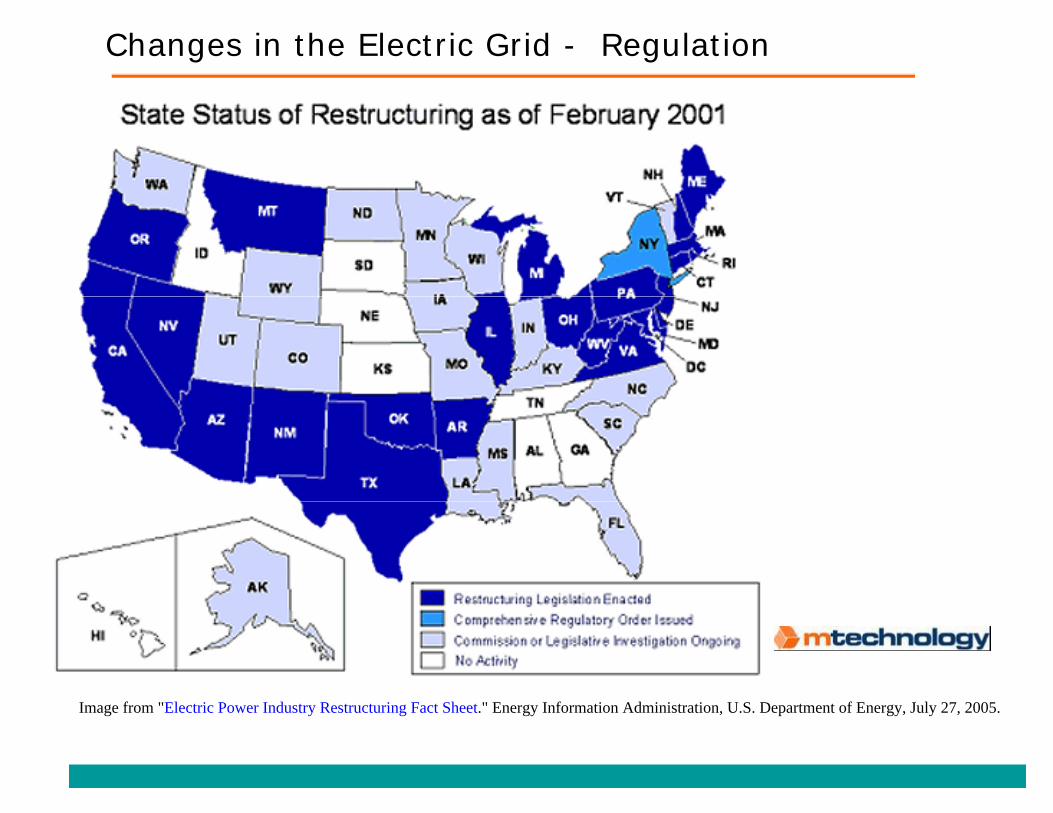
Changes in the Electric Grid - Regulation
Image from "Electric Power Industry Restructuring Fact Sheet." Energy Information Administration, U.S. Department of Energy, July 27, 2005.

Changes in the Electric Grid - Regulation
Image from "Electric Power Industry Restructuring Fact Sheet." Energy Information Administration, U.S. Department of Energy, July 27, 2005.
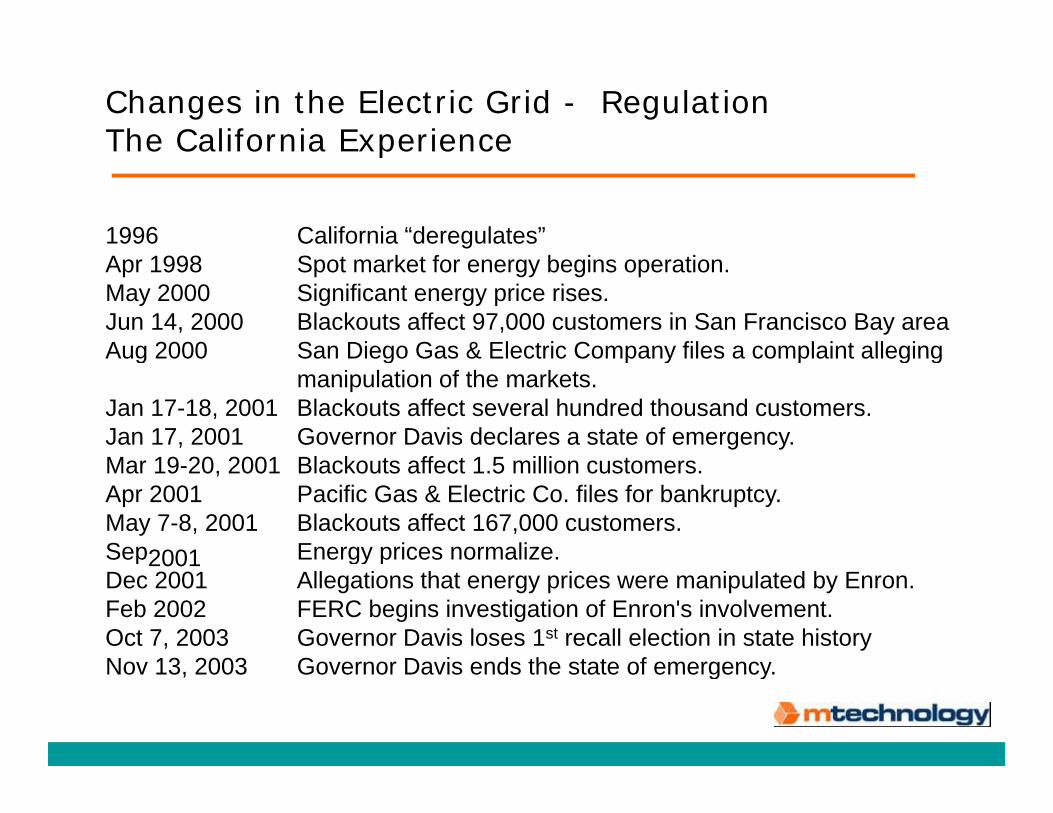
Changes in the Electric Grid - Regulation The California ExperienceThe California Experience
1996 Apr 1998 May 2000 Jun 14, 2000 AugAug 20002000
Jan 17-18, 2001 Jan 17, 2001 M 19 20 2001Mar 19-20, 2001 Apr 2001 May 7-8, 2001 Sepp2001 Dec 2001 Feb 2002 Oct 7, 2003 Nov 13 2003Nov 13, 2003
California “deregulates” Spot market for energy begins operation. Significant energy price rises. Blackouts affect 97,000 customers in San Francisco Bay area San Diego Gas & Electric Company files a complaint allegingSan Diego Gas & Electric Company files a complaint alleging manipulation of the markets. Blackouts affect several hundred thousand customers. Governor Davis declares a state of emergency. Bl koutts aff t 1 5 illion custtomers.Black ffect 1.5 milliPacific Gas & Electric Co. files for bankruptcy. Blackouts affect 167,000 customers. Energygy p prices normalize.Allegations that energy prices were manipulated by Enron. FERC begins investigation of Enron's involvement. Governor Davis loses 1st recall election in state history Governor Davis ends the state of emergency Governor Davis ends the state of emergency.

Lesson for Aspiring PoliticiansLesson for Aspiring Politicians
Keep the lights on!Keep the lights on!

•
Changges in the Electric Grid - Generation Mix
• Natural Gas is the only large-scale generating technology that can be permitted in much of technology that can be permitted in much of the US today
• States have begun denying permits for new coal plant construction by characterizing CO2 as a “pollutant.”
• Renewable Energy Portfolio Standards Renewable Energy Portfolio Standards mandate the use of certain generation technologies in 30 states
• 16 Combined Construction and Operating License applications to build 24 new reactors filed with NRC; 2-4 anticipated online by 2018 filed with NRC; 2 4 anticipated online by 2018
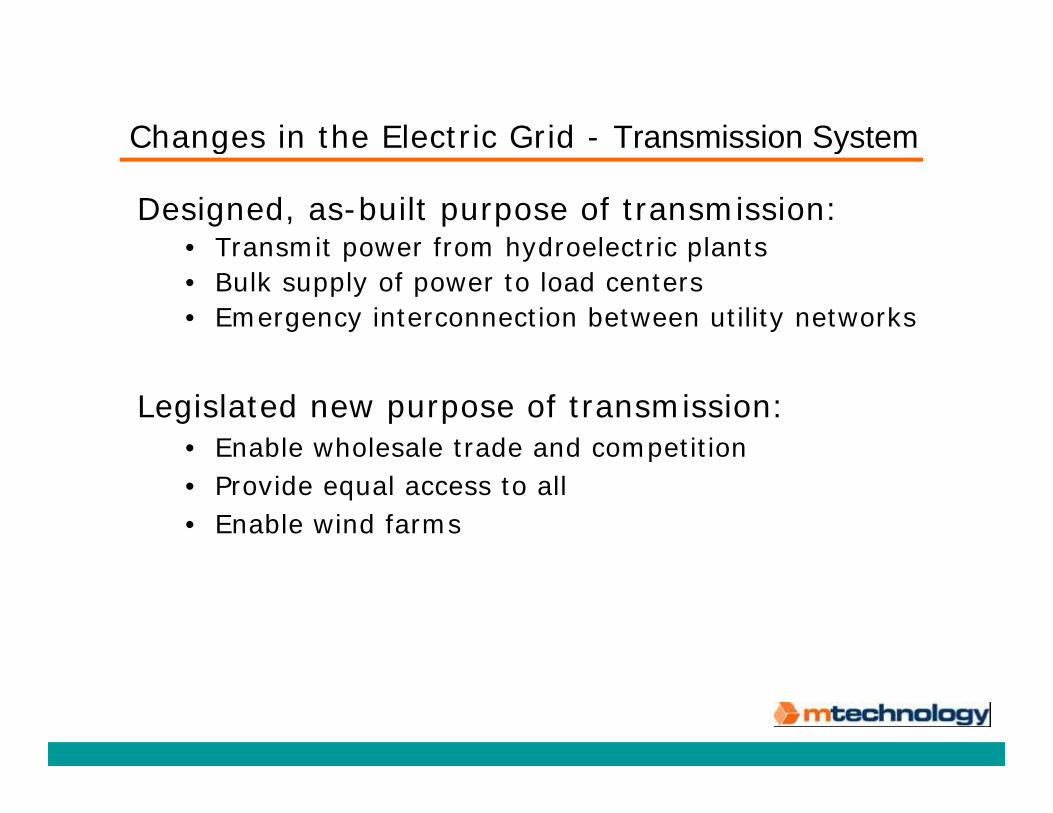
Changges in the Electric Grid - Transmission Syystem
Designed, as-built purpose of transmission: • Transmit power from hydroelectric plantsTransmit power from hydroelectric plants • Bulk supply of power to load centers • Emergency interconnection between utility networks
Legislated new purpose of transmission: • Enable wholesale trade and comppetition • Provide equal access to all • Enable wind farms

Changges in the Electric Grid - Transmission Syystem
• 680,000 miles in service • 7 100 il l d dditi th h 20157,100 miles planned additions through 2015
• Effective nationalization of transmission assets by FERC discourages private investmentby FERC discourages private investment
• 330 MW 25-mile (small, short) Cross Sound Cable • lay dormant for 2 years after completion – activated
via FERC emergency order after August 2003 blackout

Changges in the Electric Grid - Transmission Syystem
The lack of adequate transmission emergency transfer capability or transmission service agreements could limit the ability to deliveragreements could limit the ability to deliver available resources from areas of surplus to areas of need.”
- North American Electric Reliability Council. 2006 Long-Term Reliability Assessment.

Changges in the Electric Grid - Transmission Syystem
Public opposition to new transmission facilities is deep and effectivedeep and effective.
DOE announced in 2007 the draft designation of DOE announced in 2007 the draft designation of two National Interest Electric Transmission Corridors. The federal government has concluded that a significant regional concluded that a significant regional transmission constraint or congestion problem exists – one that is adversely affecting consumers and that has advanced to the point where there is national interest in alleviating it.it. http://nietc.anl.gov/index.cfmhttp://nietc.anl.gov/index.cfm

Image by Office of Electricity Delivery & Energy Reliability, U.S. Department of Energy.

Image by Office of Electricity Delivery & Energy Reliability, U.S. Department of Energy.

Changges in the Electric Grid - Transmission Syystem
Electricity follows the path of least resistance.

Changges in the Electric Grid - Transmission Syystem
Electricity follows the path of least resistance.
Electricity follows all available paths in inverse proportionElectricity follows all available paths, in inverse proportion to the impedance of each path.

Power flow obeys physics, not contracts
Power follows multiple paths Loop flow consumes line capacity without delivering capacity without delivering power
Image removed due to copyright restrictions. Pleases see Fig. 2 in Lerner, Eric J. "What's Wrong with the Electric Grid?" The Industrial Physicist 9 (October/November 2003): 8-13.
Source: What’s Wrong with the Electric Grid, Eric Lerner, The Industrial Physicist, October 2003

Changges in the Electric Grid - Technologygy
• Demand (customer) side • Growing dependency on computers and communicationsGrowing dependency on computers and communications • Growing sensitivity to power quality, interruptions
• Generation side • Shrinking capacity margins and redundancy in
generation, transmission • Growing dependence on unreliable, non-dispatchable renewable
energy sources • February 2008 – drop in West Texas wind power caused
• Interruptible customers to be curtailed • High probability of rolling “Davis recall” blackouts
Must run cogeneration plants in Denmark requires much of • Must-run cogeneration plants in Denmark requires much of winter wind energy to be sold to Sweden at bargain prices • Nellis Solar Plant in Nevada – 30 MW to 2 MW as clouds pass overpass over•European ISOs increasingly limit wind power capacity that may be bid

Power requirements historically determined by demanddemand
Predictable, correlated with calendar weathercalendar, weather
Typical Summer Load Curve for PJMTypical Summer Load Curve for PJM
0 Time
Loa
d
28000
33000
38000
43000
48000
53000 Off-peak hours 23:00 - 7:00 On peak hours 7:00 - 23:00
00:00
01:00
02:00
03:00
04:00
05:00
06:00
07:00
08:00
09:00
10:00
11:00
12:00
13:00
14:00
15:00
16:00
17:00
18:00
19:00
20:00
21:00
22:00
23:00
24:00
Image by MIT OpenCourseWare. Data from www.pjm.com.

New mix results in rappid changges in ggeneration
• Wind power can start or stop in minutes • Solar power changes in seconds• Solar power changes in seconds• Large gas turbines take several minutes to ramp up or down
• Reduced life expectancy from rapid cycling • New market for frequency stabilization
• Formerlyysu pp y excess sp g cappacityypp lied by pinning• Transmission operators generally limited to 4-second response time • Technologies that are too expensive for wholesale• Technologies that are too expensive for wholesale competition find a niche in frequency stabilization
• Flywheel energy storage • Advanced battery energy storage

Demand Respponse
• Central planning vision: reduce demand when load is high, capacity is low.high, capacity is low.
• Requires detailed metering and remote control of millions of appliancesappliances
• Consumer’s perception: Turn off my air conditioner during a heat wavheat wavee.
• Subject matter expert: Former California Governor Gray Davis

Distributed Generation
Generation connected at the distribution system level
Generally more expensive, less safe, higher polluting but
Only possibility to meet growing demand without new transmission and large central generation facilities

Distributed Generation
Results in very large (10-100x) increase in number of sources connected to networksources connected to network
Violates basic design assumptions regarding the direction of power flow
Siggnificant technical pproblems remain unsolved Safety of linemen Coordination during faults Interaction with existing voltage regulation infrastructure Stability Reliability Reactive power supply - andd many more

Changes in the Electric Grid
Demand – strong and growing. Recession/depression will reduce rate of growth. Projected 1% decrease in MWh generation 2008-2009 is only the third decrease since 1949. Some areas (e.g. Detroit) are experiienciing siignifi ificantt redductitions iin lloadd.
Regulation – strong and growing. Increasing intervention into markets, ppolitical selection of favored technologgies,
Generation Mix – Less fuel diversity (more reliance on natural gas) plus new “plants” that cannot be dispatched and fail frequently with little warninglittle warning.
Transmission – Extremely sophisticated system built in 1950s-70s being used for unforeseen purposes. Operating outside design assumptions and limits. Nationalization of assets have drastically reduced incentives for private investment. Nimby, Banana and Nope.
Technology – Consumer and commercial power requirements Technology Consumer and commercial power requirements trending towards higher quality and reliability, while grid systemic trends are opposite.

Tremendous business and employment opportunities
Sustainable Energy – no opinion.
Sustainable profits – impossible in free markets.
Profit and loss are generated by success or failure in adjusting the course of production activities to the most urgent demand of the consumers. Once this adjustment is achieved, they disappear. - Ludwig von Mises, Profit and Loss
http://mises.org/books/profitloss.pdf
Transient profits, quantity unknown – almost certain.

t t
ConclusionsConclusions
• Electric power has not been a major career choice for th t 3 dthe past 3 decaddes.
• Aging of the electric power industry workforce is a growing concern and recognized by NERC as a potential th th li bilit f th idthreat to the reliability of the grid.
• Financial engineering is unlikely to be hiring again soon. • The demand for electric power remains strong. • The present supply system is being stressed by
age, legislation, re-purposing, and new generation sources with new and different characteristics.
• New technology, new rules, new consumer requirements are creating major new opportunities.

Thank you.
MIT OpenCourseWare http://ocw.mit.edu
22.081J / 2.650J / 10.291J / 1.818J / 2.65J / 10.391J / 11.371J / 22.811J / ESD.166J Introduction to Sustainable EnergyFall 2010
For information about citing these materials or our Terms of Use, visit: http://ocw.mit.edu/terms.
Recommended