PREQIN AND NEVCA UPDATE:NEW ENGLAND VENTURE CAPITAL IN H1 2018
In association with
© Preqin Ltd. 2018 / www.preqin.com2
PREQIN AND NEVCA UPDATE: NEW ENGLAND VENTURE CAPITAL IN H1 2018
FOREWORD
The New England Venture Capital Association (NEVCA) is pleased to share this first-half overview of New England’s venture capital activity, the second instalment in our partnership with leading industry data and insights provider Preqin.
Given the recent news that the region’s venture capital investment activity is on pace to surpass New York’s for the first time since 2012, there is no better time to dive into the data from a fund perspective. With this report, we offer multi-year comparisons of fundraising activity, investment focus and performance – as well as deeper dives into activity in specific sectors.
Below are some highlights to whet your whistle: ■ Managers are raising aggressively: 33% of funds closed in H1 2018 secured in the range of $250-499mn (up from 19% in 2017). ■ Managers are also spending aggressively: Q2 2018 saw by far the highest aggregate capital invested of any quarter in the past
decade. ■ The few still rule: while total deal count has begun to pick up alongside the increase in total dollars invested, average deal size has
remained close to the record high. ■ New England and then the rest: horizon IRRs for New England-based funds are significantly higher than US averages across one-,
three- and five-year periods to December 2017.
That last bullet is perhaps the most encouraging, but the report as a whole contains a number of other compelling tidbits, and we encourage you to dive all the way in. And once again, let us know what you think. What additional data would be useful? Is anything extraneous? What components should be further developed?
We’ll see you next quarter, Jody RosePresident, New England Venture Capital Association
PREQIN’S VENTURE CAPITAL DATA AND INTELLIGENCE
Preqin tracks all aspects of the venture capital industry, with comprehensive data on institutional investors, fundraising, fundmanagers, fund terms and conditions, fund performance, deals and exits, service providers and more.
Our dedicated teams of analysts are strategically placed in key industry centres across the globe, ensuring our venture capitaldata is up to date and of the highest quality.
Preqin’s platform can be used to: ■ Identify potential LPs for funds and as a powerful investor relations and fund marketing tool. ■ Conduct market analysis and track industry trends. ■ Carry out competitor analysis. ■ Conduct due diligence, with net-to-LP returns showing how well individual fund managers have performed over time.
Get in touch today to find out how Preqin’s venture capital data can help you:
www.preqin.com/venturecapital
All rights reserved. The entire contents of Preqin and NEVCA Update: New England Venture Capital in H1 2018 are the Copyright of Preqin Ltd. No part of this publication or any information contained in it may be copied, transmitted by any electronic means, or stored in any electronic or other data storage medium, or printed or published in any document, report or publication, without the express prior written approval of Preqin Ltd. The information presented in Preqin and NEVCA Update: New England Venture Capital in H1 2018 is for information purposes only and does not constitute and should not be construed as a solicitation or other offer, or recommendation to acquire or dispose of any investment or to engage in any other transaction, or as advice of any nature whatsoever. If the reader seeks advice rather than information then he should seek an independent financial advisor and hereby agrees that he will not hold Preqin Ltd. responsible in law or Debt for any decisions of whatever nature the reader makes or refrains from making following its use of Preqin and NEVCA Update: New England Venture Capital in H1 2018. While reasonable efforts have been made to obtain information from sources that are believed to be accurate, and to confirm the accuracy of such information wherever possible, Preqin Ltd. does not make any representation or warranty that the information or opinions contained in Preqin and NEVCA Update: New England Venture Capital in H1 2018 are accurate, reliable, up-to-date or complete. Although every reasonable effort has been made to ensure the accuracy of this publication Preqin Ltd. does not accept any responsibility for any errors or omissions within Preqin and NEVCA Update: New England Venture Capital in H1 2018 or for any expense or other loss alleged to have arisen in any way with a reader’s use of this publication.

3
DOWNLOAD DATA PACK: www.preqin.com/NEVCAH118
CONTENTSp4 Fundraising
p6 Funds in Market
p8 Fund Managers
p10 Deals and Exits
p12 In Focus: Healthcare
p14 Performance
p15 Investors
KEY FACTS
$5.7bnwas raised by New England-
based venture capital managers in H1 2018.
77New England-based venture capital funds are currently in
market (as at July 2018).
$5.9bnwas invested in New England-based portfolio companies in
H1 2018.
105New England-based firms have at least one female investment
partner.
DEFINITIONSHEALTHCAREPreqin’s healthcare universe includes: biotechnology, pharmaceuticals, medical devices, healthcare, healthcare IT and medical technologies.
TECHNOLOGYPreqin’s technology universe includes: software & related, internet, telecoms, other IT and cleantech sectors.
NEW ENGLAND-BASEDIndicates a New England-based office, including both headquarters and satellite offices.
NEW ENGLAND-HEADQUARTEREDIndicates a New England-based headquarters.
EARLY STAGE: SEEDAllows a business concept to be developed, perhaps involving the production of a business plan, prototypes and additional research, prior to bringing a product to market and commencing large-scale manufacturing.
EARLY STAGE: START-UPSupports a non-commercial company’s product development and marketing.
EXPANSION/LATE STAGEInvests in companies towards the end of the venture stage cycle. Provides capital injections for expansion into a position of stable profit streams.
VENTURE CAPITAL (GENERAL)Provides capital to new or growing businesses with perceived long-term growth potential.

© Preqin Ltd. 2018 / www.preqin.com4
PREQIN AND NEVCA UPDATE: NEW ENGLAND VENTURE CAPITAL IN H1 2018
H1 2018 saw 19 New England-based venture capital funds reach a final close, securing $5.7bn in aggregate capital (Fig. 1). Eleven funds closed in the first quarter, raising an aggregate $3.3bn, while in Q2 eight funds reached a final close for a total of $2.4bn. New England-based fundraising in the first half of 2018 accounted for 11% of all US venture capital funds closed and 26% of total capital raised, notably smaller proportions than the average of 19% and 31% respectively for the 2009-2017 period.
The largest proportion of funds closed by New England-based managers have typically fallen into the micro VC (sub-$100mn) category, accounting for an average of 53% of all vehicles closed each year from 2009 to 2017 (Fig. 2). Yet, micro VC funds in H1 2018 accounted for 28% of New England-based vehicles closed, while the largest proportion (33%) of funds closed were sized between $250mn and $499mn. Moreover, the proportion of New England-based vehicles sized $1bn or more has doubled from 3% of funds closed in 2017 to 6% in H1 2018.
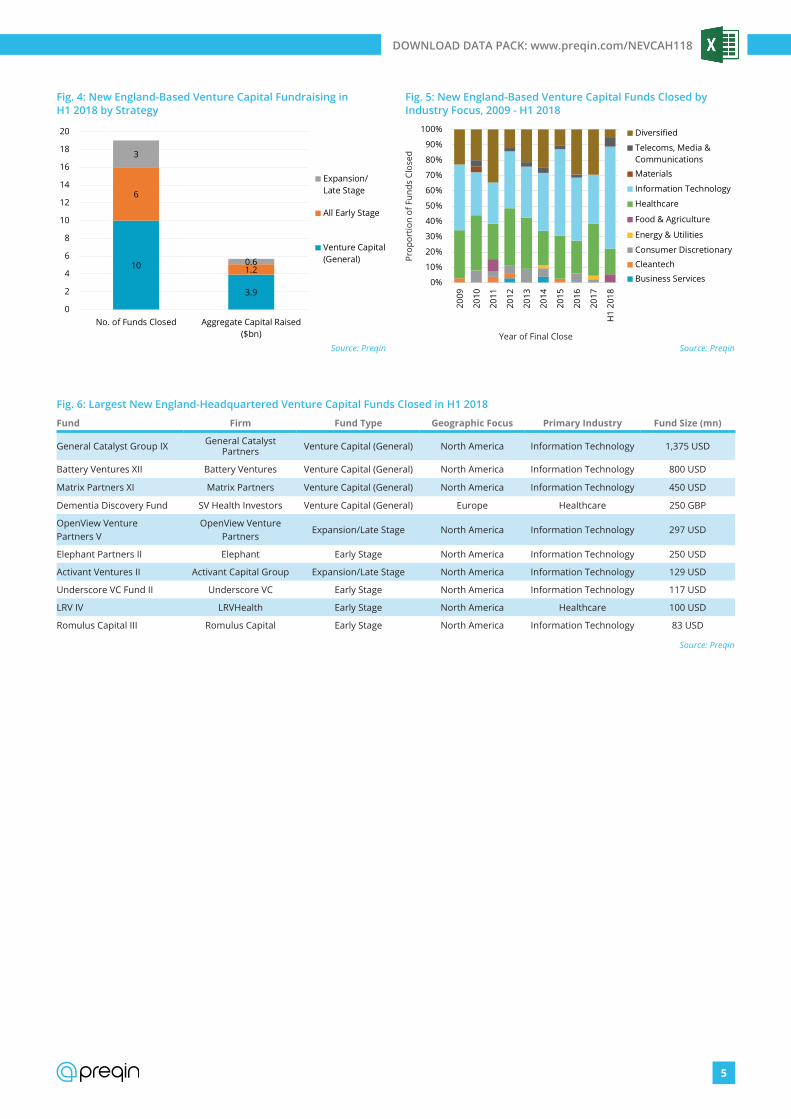
Massachusetts-based General Catalyst Partners closed the largest US-based venture capital fund in H1 2018: General Catalyst Group IX concentrates on investments in technology, software and internet companies in the US (Fig. 6). The
fund secured nearly $1.4bn at its final close in March 2018, achieving 135% of its initial $1bn target. Headline commitments included $100mn from Tennessee Consolidated Retirement System and $70mn from University of Michigan Endowment.
New England-based venture capital funds have, on average, exceeded their target size for the past two years, and funds closed in H1 2018 secured a record 113% of their initial target (Fig. 3). Early indications suggest a quicker fundraising pace for funds closed in H1 2018; however,
this number will likely revert back towards the mean as more data becomes available.
General venture capital vehicles have dominated the New England-based fundraising market: 10 funds secured a total of $3.9bn in H1 2018, 3x more capital than early-stage funds (Fig. 4). In regards to sector, information technology-focused funds accounted for the largest proportion (63%) of funds closed in the first half of 2018, equating to 86% of the total number of funds raised for the industry in 2017 (Fig. 5).
FUNDRAISING
05101520253035404550
0
50
100
150
200
250
300
350
2009 2010 2011 2012 2013 2014 2015 2016 2017 H12018
All US: No. of Funds Closed New England: No. of Funds Closed
All US: Aggregate Capital Raised ($bn) New England: Aggregate Capital Raised ($bn)Source: Preqin
No.
of F
unds
Clo
sed
Year of Final Close
Fig. 1: Venture Capital Fundraising: All US- vs. New England-Based Firms, 2009 - H1 2018
Aggregate Capital Raised ($bn)
0%
10%
20%
30%
40%
50%
60%
70%
80%
90%
100%
2009 2010 2011 2012 2013 2014 2015 2016 2017 H12018
$1bn or More
$500-999mn
$250-499mn
$100-249mn
$50-99mn
Less than$50mn
Source: Preqin
Prop
ortio
n of
Fun
ds C
lose
d
Fig. 2: New England-Based Venture Capital Fundraising by Fund Size, 2009 - H1 2018
Year of Final Close
12
23
149
21 1922
31
18
5
96% 92%
79%
102% 105%98% 97%
90%
110% 113%
0%
20%
40%
60%
80%
100%
120%
0
5
10
15
20
25
30
35
2009
2010
2011
2012
2013
2014
2015
2016
2017
H1
2018
*
Average Time Spent in Market (Months)Average Proportion of Target Size Achieved
Source: Preqin
Tim
e Sp
ent i
n M
arke
t (M
onth
s)
Fig. 3: New England-Based Venture Capital Fundraising Success, 2009 - H1 2018
Year of Final Close
Average Proportion of Target Size Achieved
*As more information becomes available, these figures will likely revert towards the mean.
5
DOWNLOAD DATA PACK: www.preqin.com/NEVCAH118
Fig. 6: Largest New England-Headquartered Venture Capital Funds Closed in H1 2018
Fund Firm Fund Type Geographic Focus Primary Industry Fund Size (mn)
General Catalyst Group IX General Catalyst Partners Venture Capital (General) North America Information Technology 1,375 USD
Battery Ventures XII Battery Ventures Venture Capital (General) North America Information Technology 800 USD
Matrix Partners XI Matrix Partners Venture Capital (General) North America Information Technology 450 USD
Dementia Discovery Fund SV Health Investors Venture Capital (General) Europe Healthcare 250 GBP
OpenView Venture Partners V
OpenView Venture Partners
Expansion/Late Stage North America Information Technology 297 USD
Elephant Partners II Elephant Early Stage North America Information Technology 250 USD
Activant Ventures II Activant Capital Group Expansion/Late Stage North America Information Technology 129 USD
Underscore VC Fund II Underscore VC Early Stage North America Information Technology 117 USD
LRV IV LRVHealth Early Stage North America Healthcare 100 USD
Romulus Capital III Romulus Capital Early Stage North America Information Technology 83 USD
Source: Preqin
0%
10%
20%
30%
40%
50%
60%
70%
80%
90%
100%
2009
2010
2011
2012
2013
2014
2015
2016
2017
H1
2018
Diversified
Telecoms, Media &Communications
Materials
Information Technology
Healthcare
Food & Agriculture
Energy & Utilities
Consumer Discretionary
Cleantech
Business Services
Source: Preqin
Prop
ortio
n of
Fun
ds C
lose
d
Fig. 5: New England-Based Venture Capital Funds Closed by Industry Focus, 2009 - H1 2018
Year of Final Close
10
3.9
6
1.2
3
0.6
0
2
4
6
8
10
12
14
16
18
20
No. of Funds Closed Aggregate Capital Raised($bn)
Expansion/Late Stage
All Early Stage
Venture Capital(General)
Source: Preqin
Fig. 4: New England-Based Venture Capital Fundraising in H1 2018 by Strategy

© Preqin Ltd. 2018 / www.preqin.com6
PREQIN AND NEVCA UPDATE: NEW ENGLAND VENTURE CAPITAL IN H1 2018
There has been a new record number of New England-based venture
capital funds in market at the beginning of each year since 2014 (Fig. 7). As at July 2018, there are 77 funds on the road, an increase of seven from January, seeking an aggregate $7.6bn in capital. Massachusetts-based MPM Capital’s seventh fund is the largest on the road: MPM BioVentures 2018 is a general venture vehicle targeting $400mn (Fig. 10).
There are 34 general venture capital funds in market targeting a total of $4.0bn and 23 early-stage funds targeting $1.5bn (Fig. 8). Information technology- and healthcare-focused vehicles dominate the fundraising space, accounting for 35% and 27% of funds raising respectively (Fig. 9).
FUNDS IN MARKET
27
21
42 2 1 1 1 1
17
0
5
10
15
20
25
30
Info
rmat
ion
Tech
nolo
gy
Hea
lthca
re
Tele
com
s, M
edia
& C
omm
unic
atio
ns
Clea
ntec
h
Cons
umer
Dis
cret
iona
ry
Bus
ines
s Se
rvic
es
Indu
stri
als
Infr
astr
uctu
re
Mat
eria
ls
Div
ersi
fied
Source: Preqin
No.
of F
unds
Rai
sing
Fig. 9: New England-Based Venture Capital Funds in Market by Industry Focus (As at July 2018)
Fig. 10: Largest New England-Headquartered Venture Capital Funds in Market (As at July 2018)
Fund Firm Fund Type Geographic Focus Target Size (mn)
MPM BioVentures 2018 MPM Capital Venture Capital (General) North America 400 USD
Media / Communications Partners VIII M/C Partners Venture Capital (General) North America 350 USD
Highland Capital Partners X Highland Capital Partners Venture Capital (General) North America 300 USD
Altimeter Private Partners Fund III Altimeter Capital Management Expansion/Late Stage North America 250 USD
Biomark Capital Fund II Biomark Capital Venture Capital (General) North America 250 USD
New Technology Ventures I New Technology Ventures Venture Capital (General) North America 250 USD
Galen Partners VI Galen Partners Venture Capital (General) North America 200 USD
MPM Oncology Innovations Fund MPM Capital Venture Capital (General) North America 200 USD
MedCap Fund I MedCap Advisors Venture Capital (General) North America 150 USD
HLM Venture Partners IV HLM Venture Partners Venture Capital (General) North America 125 USD
Source: Preqin
23
106
4
34
1.5 0.9 0.3 1.04.0
0
5
10
15
20
25
30
35
Earl
y St
age
Earl
y St
age:
Seed
Earl
y St
age:
Star
t-up
Expa
nsio
n/La
te S
tage
Vent
ure
Capi
tal
(Gen
eral
)
No. of Funds Raising Aggregate Capital Targeted ($bn)
Source: Preqin
Fig. 8: New England-Based Venture Capital Funds in Market by Fund Type (As at July 2018)
35 34 34 36 3544 49 53 57
7077
8.9 8.9
6.7 6.7
5.55.1
6.4
11.0
9.08.6
7.6
0
2
4
6
8
10
12
0
10
20
30
40
50
60
70
80
Jan-
09
Jan-
10
Jan-
11
Jan-
12
Jan-
13
Jan-
14
Jan-
15
Jan-
16
Jan-
17
Jan-
18
Jul-1
8
No. of Funds Raising Aggregate Capital Targeted ($bn)Source: Preqin
No.
of F
unds
Rai
sing
Fig. 7: New England-Based Venture Capital Funds in Market over Time, 2009 - 2018 (As at July 2018)
Aggregate Capital Targeted ($bn)
BE SEENby thousands of investors and decision-makers around the world
CONTRIBUTEto industry benchmarks and help further research into this area
ENSUREthat the data we hold for your firm and funds is correct
REASONS TOCONTRIBUTE DATA
Contributing data is free and simple. For more information, please visit:
www.preqin.com/sharedata
GENERATEincoming leads from industry professionals seeing your profile

© Preqin Ltd. 2018 / www.preqin.com8
PREQIN AND NEVCA UPDATE: NEW ENGLAND VENTURE CAPITAL IN H1 2018
FUND MANAGERS
Fig. 11: Largest New England-Headquartered Venture Capital Fund Managers by Aggregate Capital Raised in the Last 10 Years
Firm Headquarters Total Capital Raised Last 10 Years (bn)
General Catalyst Partners Cambridge, MA 3.4 USD
Healthcare Royalty Partners Stamford, CT 3.3 USD
Battery Ventures Boston, MA 2.9 USD
Bain Capital Ventures Boston, MA 2.3 USD
Spark Capital Boston, MA 2.2 USD
Flagship Pioneering Cambridge, MA 1.9 USD
Third Rock Ventures Boston, MA 1.6 USD
Matrix Partners Cambridge, MA 1.5 USD
Clarus Ventures Cambridge, MA 1.4 USD
SV Health Investors Boston, MA 1.3 USD
Source: Preqin
Fig. 12: Largest New England-Headquartered Venture Capital Fund Managers by Estimated Dry Powder
Firm Headquarters Estimated Dry Powder (bn)
General Catalyst Partners Cambridge, MA 1.5 USD
Flagship Pioneering Cambridge, MA 1.0 USD
Battery Ventures Boston, MA 1.0 USD
Clarus Ventures Cambridge, MA 0.9 USD
Spark Capital Boston, MA 0.8 USD
Healthcare Royalty Partners
Stamford, CT 0.7 USD
6 Dimensions Capital Boston, MA 0.6 USD
Oak HC/FT Partners Greenwich, CT 0.6 USD
MPM Capital Cambridge, MA 0.5 USD
Matrix Partners Cambridge, MA 0.5 USD
Source: Preqin
The 10 largest New England-headquartered venture capital
managers have collectively raised nearly $22bn in capital over the past 10 years, and have over $8bn in available capital (Figs. 11 and 12). The majority of the top New England-headquartered managers in terms of capital raised (90%) and capital available (80%) are located in Massachusetts.
New England-based venture capital firms contributed more than a quarter (29%) of the total capital raised by US firms over
the past 10 years, including 39% of general venture capital and 28% of early stage: start-up capital (Fig. 13).
The top women-owned firms in the region have raised a small portion (8%) of capital compared to the top New England-headquartered managers, led by Oak HC/FT Partners, with $1.1bn raised in the past decade.
Fig. 14: Largest New England-Headquartered Women-Owned Venture Capital Firms by Aggregate Capital Raised in the Last 10 Years
Firm HeadquartersTotal Capital
Raised in Last 10 Years (mn)
Female Founder(s)
Oak HC/FT Partners Greenwich, CT 1,100 USD Annie Lamont & Patricia Kemp
.406 Ventures Boston, MA 392 USD Maria Cirino
Glasswing Ventures Boston, MA 112 USD Rudina Seseri
Fletcher Spaght Ventures
Boston, MA 101 USD Linda Tufts
Agent Capital Cambridge, MA 58 USD Geeta Vemuri
InTeahouse Cambridge, MA 30 USD Xin Liu
One Way Ventures Boston, MA 16 USDEveline
Buchatskiy
First Star Ventures Boston, MA 10 USD Millie Liu
1843 Capital Greenwich, CT 7 USD Tracy Chadwell
Source: Preqin
71
9 11
40
141
132 3 4
56
0
20
40
60
80
100
120
140
160
Early Stage Early Stage:Seed
Early Stage:Start-up
Expansion/Late Stage
VentureCapital
(General)All US New England
Source: Preqin
Aggr
egat
e Ca
pita
l Rai
sed
($bn
)
Fig. 13: Aggregate Capital Raised in the Last 10 Years by Fund Type: All US- vs. New England-Based Venture Capital Firms
Women-owned firms in New
England have secured $1.8bn in the past decade
© Preqin Ltd. 2018 / www.preqin.com9
PREQIN AND NEVCA UPDATE: NEW ENGLAND VENTURE CAPITAL IN H1 2018
DEALS AND EXITS
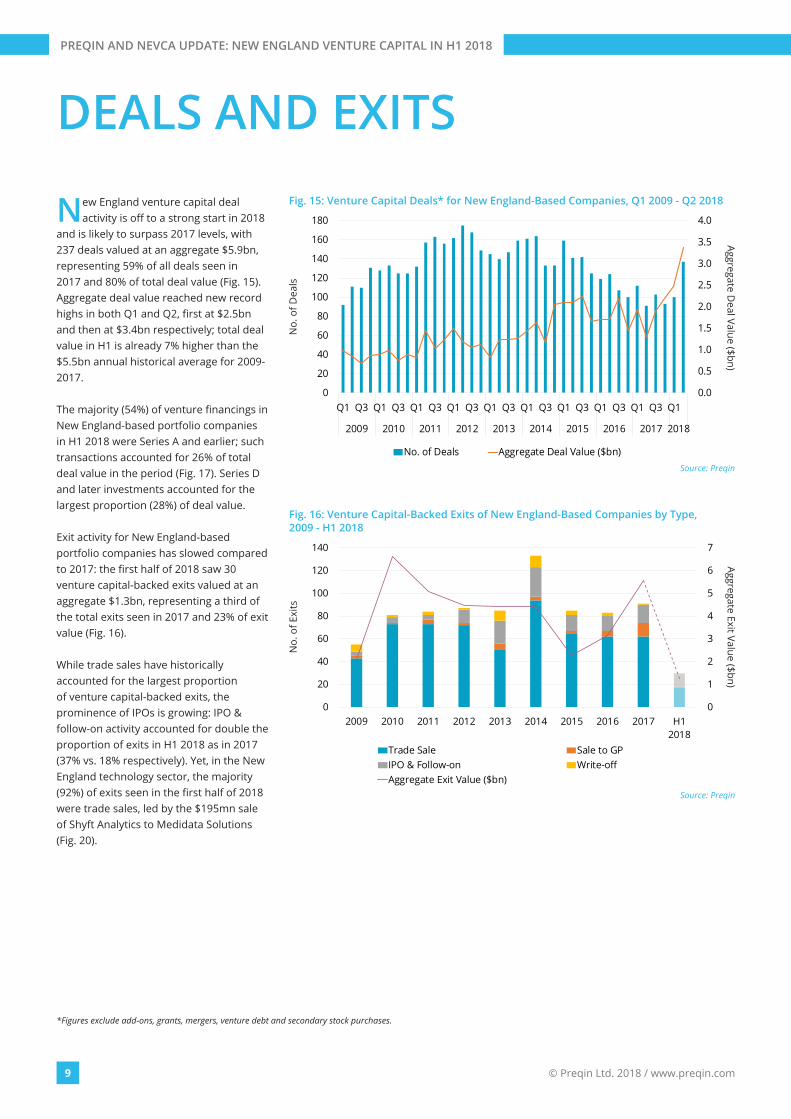
New England venture capital deal activity is off to a strong start in 2018
and is likely to surpass 2017 levels, with 237 deals valued at an aggregate $5.9bn, representing 59% of all deals seen in 2017 and 80% of total deal value (Fig. 15). Aggregate deal value reached new record highs in both Q1 and Q2, first at $2.5bn and then at $3.4bn respectively; total deal value in H1 is already 7% higher than the $5.5bn annual historical average for 2009-2017.
The majority (54%) of venture financings in New England-based portfolio companies in H1 2018 were Series A and earlier; such transactions accounted for 26% of total deal value in the period (Fig. 17). Series D and later investments accounted for the largest proportion (28%) of deal value.
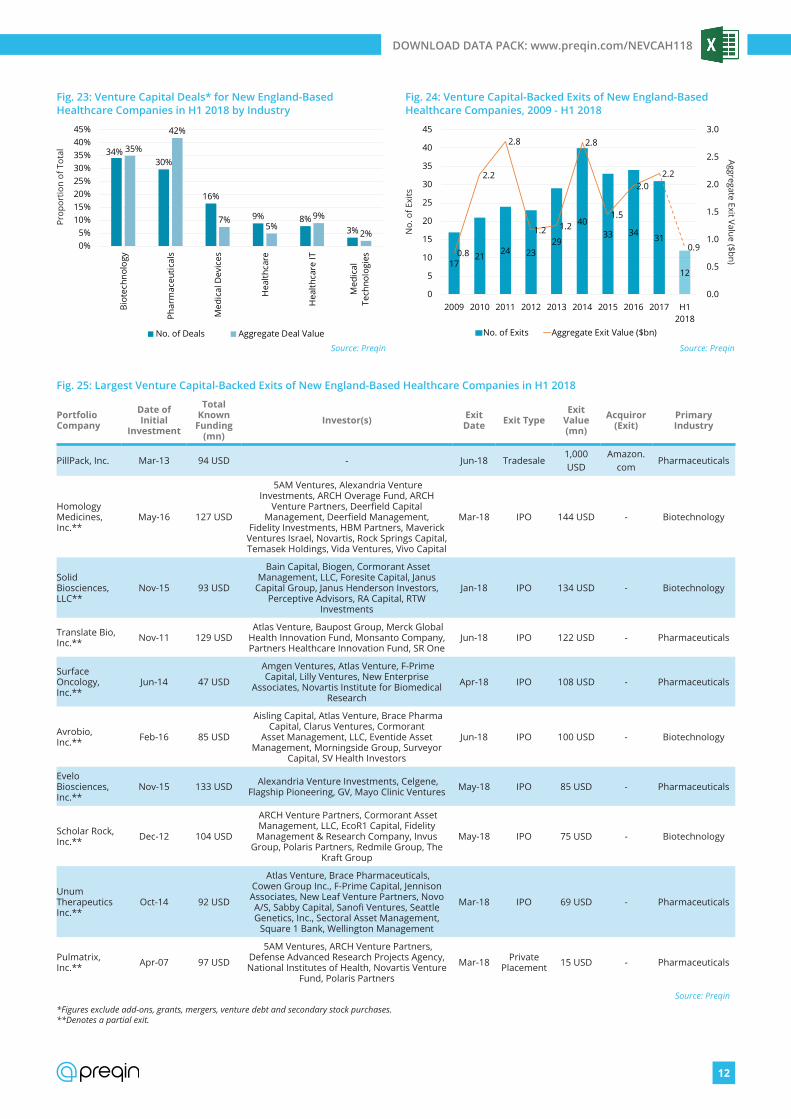
Exit activity for New England-based portfolio companies has slowed compared to 2017: the first half of 2018 saw 30 venture capital-backed exits valued at an aggregate $1.3bn, representing a third of the total exits seen in 2017 and 23% of exit value (Fig. 16).
While trade sales have historically accounted for the largest proportion of venture capital-backed exits, the prominence of IPOs is growing: IPO & follow-on activity accounted for double the proportion of exits in H1 2018 as in 2017 (37% vs. 18% respectively). Yet, in the New England technology sector, the majority (92%) of exits seen in the first half of 2018 were trade sales, led by the $195mn sale of Shyft Analytics to Medidata Solutions (Fig. 20).
*Figures exclude add-ons, grants, mergers, venture debt and secondary stock purchases.
0.0
0.5
1.0
1.5
2.0
2.5
3.0
3.5
4.0
0
20
40
60
80
100
120
140
160
180
Q1 Q3 Q1 Q3 Q1 Q3 Q1 Q3 Q1 Q3 Q1 Q3 Q1 Q3 Q1 Q3 Q1 Q3 Q1
2009 2010 2011 2012 2013 2014 2015 2016 2017 2018
No. of Deals Aggregate Deal Value ($bn)Source: Preqin
No.
of D
eals
Fig. 15: Venture Capital Deals* for New England-Based Companies, Q1 2009 - Q2 2018
Aggregate Deal Value ($bn)
0
1
2
3
4
5
6
7
0
20
40
60
80
100
120
140
2009 2010 2011 2012 2013 2014 2015 2016 2017 H12018
Trade Sale Sale to GPIPO & Follow-on Write-offAggregate Exit Value ($bn)
Source: Preqin
No.
of E
xits
Fig. 16: Venture Capital-Backed Exits of New England-Based Companies by Type, 2009 - H1 2018
Aggregate Exit Value ($bn)

10
DOWNLOAD DATA PACK: www.preqin.com/NEVCAH118
Fig. 19: Largest Venture Capital Deals* for New England-Based Technology Companies in H1 2018
Portfolio Company Stage Deal Date Deal Size (mn) Investor(s) Primary
Industry
Fuze, Inc. Unspecified Round May-18 150 USD Bessemer Venture Partners, Summit Partners Software
Toast, Inc. Series D/Round 4 Jul-18 115 USD T Rowe Price, Tiger Global Management Software
Circle Internet Financial, Inc. Series E/Round 5 May-18 110 USD
Accel, Bitmain Technologies Inc, Blockchain Capital, Breyer Capital, Digital Currency Group, General
Catalyst Partners, IDG Capital, Pantera Capital, Tusk Ventures
Internet
Flywire Payments Corporation
Series D/Round 4 Jul-18 100 USDBain Capital Ventures, F-Prime Capital, Temasek
HoldingsInternet
Scout Exchange LLC Unspecified Round Mar-18 100 USD TRI Ventures Software
Starry, Inc. Series C/Round 3 Jul-18 100 USD FirstMark Capital, Tiger Global Management, KKR Internet
XebiaLabs, Inc. Series B/Round 2 Feb-18 100 USD Accel, Susquehanna Growth Equity Software
B-Stock Solutions, Inc. Growth Capital/
ExpansionJun-18 65 USD Spectrum Equity Internet
Desktop Metal, Inc. Unspecified Round Mar-18 65 USD Ford Motor Company, Future Fund Technology
Ionic Materials, Inc. Series C/Round 3 Feb-18 65 USD Alliance Ventures Cleantech
Source: Preqin
*Figures exclude add-ons, grants, mergers, venture debt and secondary stock purchases.**Denotes a partial exit.
Fig. 20: Largest Venture Capital-Backed Exits of New England-Based Technology Companies in H1 2018
Portfolio Company
Date of Initial
Investment
Total Known Funding
(mn)Investor(s) Exit
DateExit Type
Exit Value (mn) Acquiror (Exit) Primary
Industry
Shyft Analytics, Inc. Dec-13 39 USD
Activate Venture Partners, Health Enterprise Partners, McKesson
Ventures, Medidata Solutions, Inc., Optum Ventures
Jun-18 Trade Sale 195 USD Medidata
Solutions, Inc. Software
WordStream, Inc. Jun-08 28 USD
Baird Capital Partners, City National Corporation, Egan
Managed Capital, Sigma Prime Ventures
May-18 Trade Sale 130 USD Gannett Co.,
Inc. Software
EverQuote, Inc.** Apr-15 38 USD
Alumni Ventures Group, Link Ventures, Oceania Capital Partners,
Oceanic Partners, Savano Capital Partners, Second Alpha Partners, Stratim Capital, T Capital Partners
Jun-18 IPO 84 USD - Internet
Source: Preqin
26%28%
15%11%
7%
3%5%
3%1% 1%
3%
23%20% 20%
28%
5%
1% 0.3%0%
5%
10%
15%
20%
25%
30%
Ange
l/See
d
Seri
es A
/Rou
nd 1
Seri
es B
/Rou
nd 2
Seri
es C
/Rou
nd 3
Seri
es D
/Rou
nd 4
and
Late
r
Gro
wth
Cap
ital/
Expa
nsio
n
Vent
ure
Deb
t
Add-
on &
Oth
er
Gra
nt
PIPE
No. of Deals Aggregate Deal Value
Source: Preqin
Prop
ortio
n of
Tot
al
Fig. 17: Venture Capital Deals for New England-Based Companies in H1 2018 by Stage
38%
26%
11%7% 6%
3% 3% 2% 2% 2%
63%
16%
6%2% 4% 2% 2% 1% 1% 2%
0%
10%
20%
30%
40%
50%
60%
70%
Hea
lthca
re
Soft
war
e &
Rela
ted
Inte
rnet
Tele
com
s
Oth
er IT
Food
&Ag
ricu
lture
Clea
ntec
h
Bus
ines
sSe
rvic
es
Indu
stri
als
Oth
er
No. of Deals Aggregate Deal Value
Source: Preqin
Fig. 18: Venture Capital Deals* for New England-Based Companies in H1 2018 by Industry
Prop
ortio
n of
Tot
al

© Preqin Ltd. 2018 / www.preqin.com11
PREQIN AND NEVCA UPDATE: NEW ENGLAND VENTURE CAPITAL IN H1 2018
The healthcare industry dominates venture capital deal activity in New
England, accounting for 38% of total deals and 63% of deal value in H1 2018 (Fig. 18). There were 91 healthcare venture financings valued at an aggregate $3.7bn in the first half of the year, with the number and value already at 60% and 86% of the final figures seen in 2017 respectively (Fig. 21). Q2 2018 alone recorded the most deals (54) since Q2 2014, valued at a record $2.1bn. Average deal size has nearly quadrupled since 2009, and is 45% higher than in 2017, at an average of $41mn for H1 2018.
The biotechnology sector accounted for the largest proportion (34%) of healthcare deals in New England in H1 2018, while the pharmaceuticals sector accounted for the largest proportion (42%) of deal value, led by the $500mn Series G financing of Massachusetts-based Moderna Therapeutics, with known investments from Abu Dhabi Investment Authority, Alexandria Venture Investments, BB Biotech Ventures, Fidelity Investments,
Pictet Group and Sequoia Capital, among others (Fig. 22).
While the number and value of healthcare exits in New England has declined since 2016, exit activity in 2018 is expected to be close to the historical average of 28 exits
valued at $1.8bn for 2009-2017. Of the 10 largest New England-based healthcare exits in H1 2018, eight were IPOs, led by Homology Medicines ($144mn) in March (Fig. 25).
IN FOCUS: HEALTHCARE
0.0
0.5
1.0
1.5
2.0
2.5
0
10
20
30
40
50
60
Q1 Q3 Q1 Q3 Q1 Q3 Q1 Q3 Q1 Q3 Q1 Q3 Q1 Q3 Q1 Q3 Q1 Q3 Q1
2009 2010 2011 2012 2013 2014 2015 2016 2017 2018
No. of Deals Aggregate Deal Value ($bn)Source: Preqin
No.
of D
eals
Fig. 21: Venture Capital Deals* for New England-Based Healthcare Companies, Q1 2009 - Q2 2018
Aggregate Deal Value ($bn)
*Figures exclude add-ons, grants, mergers, venture debt and secondary stock purchases.
Fig. 22: Largest Venture Capital Deals* for New England-Based Healthcare Companies in H1 2018
Portfolio Company Stage Deal Date Deal Size (mn) Investor(s) Primary
Industry
Moderna Therapeutics, Inc. Series G/Round 7 Feb-18 500 USD
Abu Dhabi Investment Authority, Alexandria Venture Investments, ArrowMark Partners, BB
Biotech Ventures, EDBI, Fidelity Investments, Julius Baer Trust and Bank, Pictet Group, Sequoia Capital,
Viking Global Investors
Pharmaceuticals
American Well Corporation Unspecified Round Jun-18 291 USD Allianz X, Royal Philips Healthcare IT
Mevion Medical Systems, Inc. Growth Capital/Expansion Jun-18 150 USD
Everbright Private Equity, Henan Maisheng Medical Technology Co., Ltd, Hopu Investment
Management, YuanMing CapitalMedical Devices
Moderna Therapeutics, Inc. Series H/Round 8 May-18 125 USD Merck Pharmaceuticals
TCR2 Therapeutics Inc. Series B/Round 2 Mar-18 125 USD
6 Dimensions Capital, Alexandria Venture Investments, ArrowMark Partners, Cathay Fortune
Corporation, Curative Ventures, F2 Ventures, Haitong International Securities Group, Hillhouse
Capital Management, Leerink Partners, Lucion Venture Capital Group, Mirae Asset Venture
Investment, MPM Capital, Redmile Group, Sirona Capital, Syno Capital
Biotechnology
Source: Preqin
12
DOWNLOAD DATA PACK: www.preqin.com/NEVCAH118
34%30%
16%
9% 8%3%
35%
42%
7%5%
9%
2%0%5%
10%15%20%25%30%35%40%45%
Bio
tech
nolo
gy
Phar
mac
eutic
als
Med
ical
Dev
ices
Hea
lthca
re
Hea
lthca
re IT
Med
ical
Tech
nolo
gies
No. of Deals Aggregate Deal Value
Source: Preqin
Fig. 23: Venture Capital Deals* for New England-Based Healthcare Companies in H1 2018 by Industry
1721 24 23
29
4033 34 31
12
0.8
2.2
2.8
1.2 1.2
2.8
1.5
2.02.2
0.9
0.0
0.5
1.0
1.5
2.0
2.5
3.0
0
5
10
15
20
25
30
35
40
45
2009 2010 2011 2012 2013 2014 2015 2016 2017 H12018
No. of Exits Aggregate Exit Value ($bn)
Source: Preqin
No.
of E
xits
Fig. 24: Venture Capital-Backed Exits of New England-Based Healthcare Companies, 2009 - H1 2018
Aggregate Exit Value ($bn)Pr
opor
tion
of T
otal
*Figures exclude add-ons, grants, mergers, venture debt and secondary stock purchases.**Denotes a partial exit.
Fig. 25: Largest Venture Capital-Backed Exits of New England-Based Healthcare Companies in H1 2018
Portfolio Company
Date of Initial
Investment
Total Known
Funding (mn)
Investor(s) Exit Date Exit Type
Exit Value (mn)
Acquiror (Exit)
Primary Industry
PillPack, Inc. Mar-13 94 USD - Jun-18 Tradesale1,000 USD
Amazon.com
Pharmaceuticals
Homology Medicines, Inc.**
May-16 127 USD
5AM Ventures, Alexandria Venture Investments, ARCH Overage Fund, ARCH
Venture Partners, Deerfield Capital Management, Deerfield Management,
Fidelity Investments, HBM Partners, Maverick Ventures Israel, Novartis, Rock Springs Capital, Temasek Holdings, Vida Ventures, Vivo Capital
Mar-18 IPO 144 USD - Biotechnology
Solid Biosciences, LLC**
Nov-15 93 USD
Bain Capital, Biogen, Cormorant Asset Management, LLC, Foresite Capital, Janus
Capital Group, Janus Henderson Investors, Perceptive Advisors, RA Capital, RTW
Investments
Jan-18 IPO 134 USD - Biotechnology
Translate Bio, Inc.** Nov-11 129 USD
Atlas Venture, Baupost Group, Merck Global Health Innovation Fund, Monsanto Company, Partners Healthcare Innovation Fund, SR One
Jun-18 IPO 122 USD - Pharmaceuticals
Surface Oncology, Inc.**
Jun-14 47 USD
Amgen Ventures, Atlas Venture, F-Prime Capital, Lilly Ventures, New Enterprise
Associates, Novartis Institute for Biomedical Research
Apr-18 IPO 108 USD - Pharmaceuticals
Avrobio, Inc.** Feb-16 85 USD
Aisling Capital, Atlas Venture, Brace Pharma Capital, Clarus Ventures, Cormorant
Asset Management, LLC, Eventide Asset Management, Morningside Group, Surveyor
Capital, SV Health Investors
Jun-18 IPO 100 USD - Biotechnology
Evelo Biosciences, Inc.**
Nov-15 133 USD Alexandria Venture Investments, Celgene, Flagship Pioneering, GV, Mayo Clinic Ventures May-18 IPO 85 USD - Pharmaceuticals
Scholar Rock, Inc.** Dec-12 104 USD
ARCH Venture Partners, Cormorant Asset Management, LLC, EcoR1 Capital, Fidelity Management & Research Company, Invus
Group, Polaris Partners, Redmile Group, The Kraft Group
May-18 IPO 75 USD - Biotechnology
Unum Therapeutics Inc.**
Oct-14 92 USD
Atlas Venture, Brace Pharmaceuticals, Cowen Group Inc., F-Prime Capital, Jennison Associates, New Leaf Venture Partners, Novo A/S, Sabby Capital, Sanofi Ventures, Seattle Genetics, Inc., Sectoral Asset Management,
Square 1 Bank, Wellington Management
Mar-18 IPO 69 USD - Pharmaceuticals
Pulmatrix, Inc.** Apr-07 97 USD
5AM Ventures, ARCH Venture Partners, Defense Advanced Research Projects Agency, National Institutes of Health, Novartis Venture
Fund, Polaris Partners
Mar-18 Private Placement 15 USD - Pharmaceuticals
Source: Preqin

© Preqin Ltd. 2018 / www.preqin.com13
PREQIN AND NEVCA UPDATE: NEW ENGLAND VENTURE CAPITAL IN H1 2018
PERFORMANCE
New England-based venture capital funds have outperformed all US-
based venture capital vehicles across one- (+15.6%), three- (+14.8%) and five- (+17.4%) year horizons to December 2017 (the most recent performance data available, Fig. 26).
New England-based 2011 vintage funds have posted the strongest returns among 2007-2015 vintage funds, with a median net IRR of 23.6% (Fig. 28). Massachusetts-based Spark Capital II is the top performing fund of this group, with a net IRR of 51.4% (Fig. 29).
0%
2%
4%
6%
8%
10%
12%
14%
16%
18%
20%
1 Year to Dec-17 3 Years to Dec-17 5 Years to Dec-17
New England
All US
Source: Preqin
Annu
aliz
ed R
etur
n
Fig. 26: Horizon IRRs: All US- vs. New England-Based Venture Capital Funds (All Vintages)
-8
-6
-4
-2
0
2
4
6
8
10
12
2008
2009
2010
2011
2012
2013
2014
2015
2016
2017
Capital Called up ($bn) Capital Distributed ($bn) Net Cash Flow ($bn)
Source: Preqin
Fig. 27: New England-Based Venture Capital Funds: Annual Capital Called up, Distributed and Net Cash Flow, 2008 - 2017
11.9%
10.1%
14.8%14.3%
23.6%
11.9%
15.2%
3.9%
13.4%
-10%
-5%
0%
5%
10%
15%
20%
25%
30%
2007
2008
2009
2010
2011
2012
2013
2014
2015
Source: Preqin
Fig. 28: New England-Based Venture Capital Funds: Median Net IRRs by Vintage Year
Fig. 29: Top Performing New England-Headquarted Venture Capital Funds (Vintage 2007-2015 Funds)
Fund Firm Vintage Fund Size (mn) Type Geographic
FocusNet IRR
(%)Date
Reported
Spark Capital II Spark Capital 2007 360 USD Early Stage: Start-up N. America 51.4 31-Dec-17
Third Rock Ventures II Third Rock Ventures 2010 426 USD Early Stage N. America 42.9 30-Sep-17
Third Rock Ventures Third Rock Ventures 2007 378 USD Early Stage N. America 32.3 31-Dec-17
Spark Capital III Spark Capital 2011 360 USD Early Stage: Start-up N. America 30.9 31-Dec-17
MPM BioVentures V MPM Capital 2010 173 USD Venture Capital (General) N. America 29.4 31-Mar-16
Omega Fund IV Omega Funds 2012 183 USD Venture Capital (General) N. America 28.0 31-Dec-17
Battery Ventures IX Battery Ventures 2011 750 USD Venture Capital (General) N. America 25.7 31-Dec-17
Polaris Venture Partners VI Polaris Partners 2011 364 USD Venture Capital (General) N. America 23.6 31-Mar-18
Oak HC/FT Partners Fund I Oak HC/FT Partners 2015 500 USD Venture Capital (General) N. America 20.6 31-Dec-17
Highland Capital Partners IX Highland Capital Partners 2013 400 USD Venture Capital (General) N. America 20.2 31-Dec-17
Source: Preqin
Vintage Year
Med
ian
Net
IRR
sinc
e In
cept
ion

14
DOWNLOAD DATA PACK: www.preqin.com/NEVCAH118
INVESTORS
Public and private sector pension funds each account for 21% of known
investors in New England-based venture capital funds (vintage 2009-2018, Fig. 31). The venture capital industry in New England typically attracts larger, more sophisticated investors, with the majority (77%) managing over $1bn in assets, including 13% that manage over $50bn (Fig. 32).
While the Northeast US is home to the largest proportion (39%) of investors by region with past commitments to New England-based venture capital, California-based investors are the most active by state, with 137 known commitments to New England-based 2009-2018 vintage funds. Massachusetts follows closely with 118 known commitments (Fig. 33).
Fig. 33: Top Investor Locations by Number of Known Commitments to New England-Based Venture Capital Funds (Vintage 2009-2018 Funds)
California Massachusetts New York Texas
137 past commitments(13% of US commitments)
118 past commitments(11% of US commitments)
105 past commitments(10% of US commitments)
70 past commitments(6% of US commitments)
3%1%1%1%2%2%
3%7%
9%12%
17%21%21%
0% 5% 10% 15% 20% 25%
OtherInvestment Company
Sovereign Wealth FundBank
Asset ManagerGovernment Agency
Corporate InvestorInsurance Company
Endowment PlanFund of Funds Manager
FoundationPublic Pension Fund
Private Sector Pension Fund
Source: PreqinProportion of Investors
Fig. 31: Investors in New England-Based Venture Capital by Investor Type (Vintage 2009-2018 Funds)
3%
13%8%
64%
13%
0%
10%
20%
30%
40%
50%
60%
70%
Less than$100mn
$100-499mn $500-999mn $1-49bn $50bn orMore
Source: Preqin
Prop
ortio
n of
Inve
stor
s
Assets under Management
Fig. 32: Investors in New England-Based Venture Capital by Assets under Management (Vintage 2009-2018 Funds)
Northeast39%
West22%
Southwest8% Southeast
7%
Midwest24%
Fig. 30: US-Based Investor Commitments to New England-Based Venture Capital Funds by Investor Location (Vintage 2009-2018 Funds)

Gaining full access is easy. To register for free please visit:
www.preqin.com/research
BENCHMARK
EXPLORE
TRACK
DOWNLOAD
alternative assets funds and assess the relative performance of private capital asset classes with our index
industry reports and newsletters looking at key trends
the latest stats on fundraising, deals, dry powder, industry AUM, investors and more
charts, league tables and slide decks from Preqin presentations at conferences
INDUSTRY-LEADING ALTERNATIVE ASSETS INSIGHTS. FOR FREE.

New York ■ London ■ Singapore ■ San Francisco ■ Hong Kong ■ Manila ■ Guangzhou
PREQIN AND NEVCA UPDATE
NEW ENGLAND VENTURE CAPITAL IN H1 2018
PREQIN
More than 60,000 alternative assets professionals rely on our global data, tools, insights and intelligence to achieve their objectives:
■ Investors: asset allocation, manager selection and portfolio management ■ Fund managers: fundraising, portfolio monitoring and investor relations ■ Service providers and advisors: business development and in-depth market knowledge ■ The wider alternative assets industry: insight, understanding and information
Recommended