Poverty and Inequality Among Rural Households in Nigeria
Presented at the AERC Dissemination workshop held at UNECA Conference Centre, Addis Ababa
19 September 2006

2
Outline of the Presentation
Background Methodology Findings
Rural poverty profile Determinants of rural Poverty Social Capital and Poverty Inequality profile Poverty Response
Policies and programmes of government Summary and Recommendations

3
Background
Poverty is increasingly being recognised as both a policy and economic problem in Nigeria.
This is stressed by the Nigerian Poverty Reduction Strategy Paper
called NEEDS document Poverty and Vulnerability Assessment of the
country Voices of the Poor in Nigeria

4
Why Rural Poverty?
Consensus in the literature on poverty is that, Poverty is a rural phenomenon (World Bank, 1990; Fields, 2000).
The rural sector is the predominant sector in the Nigerian economy. More households are in the rural sector Most people are employed in rural sector
It plays some fundamental roles, which include job creation at relatively low unit costs, and thus remains the most important for economic growth
The importance of the rural poor is not always understood, partly because the urban poor are more visible and more vocal than their rural counterparts.

5
Objective of the Study
objective of our research is to examine the determinants of poverty and factors of inequality in rural Nigeria.

6
Collaborative II Poverty Research
Output of our component of the research includes four research reports Inequality in the Distribution of Household
Expenditure in Rural Nigeria: A Decomposition Analysis
Policies and programmes for poverty reduction in rural Nigeria
Social capital and poverty reduction in Nigeria Human Capital, Capabilities and Poverty in
Rural Nigeria

7
Methodology
Methodology and analysis are hinged on the following procedure. The definition of an indicator of welfare so
as to identify the poor. Choice of poverty (and inequality) indices The econometric procedure to better
understand the effects of human capital, social capital and local level institutions on rural poverty in Nigeria

8
Indicator of Welfare
We utilised per capita expenditure as our measure of household economic welfare.
Four main reasons that are identified in the literature why consumption or expenditure is preferred to income income is only a measure of welfare opportunity and not
welfare achievement Expenditure fluctuates less than income and thus
provides more accurate and stable measure of welfare. respondents to survey instrument are more willing to
give their expenditure information than income information,
where there is a large proportion of self employed and own consumption, measurement of income is often fraught with difficulties.

9
Choice of poverty index
FGT indices that we intend to use are P0, which is the headcount ratio,
proportion of the total population of a given group that is poor, based on a given poverty line.
P1, which is the poverty gap index poverty gap refers to the difference between a given
poverty line and the mean income or expenditure of the poor, expressed as a ratio of the poverty line.
the poverty severity index, P2. the squared gap takes the square of that distance into
account. These indices shall thereafter be decomposed
according to the characteristics of the household including human capital and capabilities variables.

10
The econometric procedure The approach in this study is to combine
different approaches in achieving our objectives.
We model the determinants of the indicator of welfare usually income, consumption or expenditure Estimation techniques
Probit (for determinants of probability of being poor) OLS (for examining determinants of poverty) Tobit (for investigating determinants of social
capital on poverty)

11
Inequality Inequality Index must satisfy some basic
properties Pigou-Dalton transfer sensitivity Symmetry mean independence population homogeneity decomposability statistical testability.
12
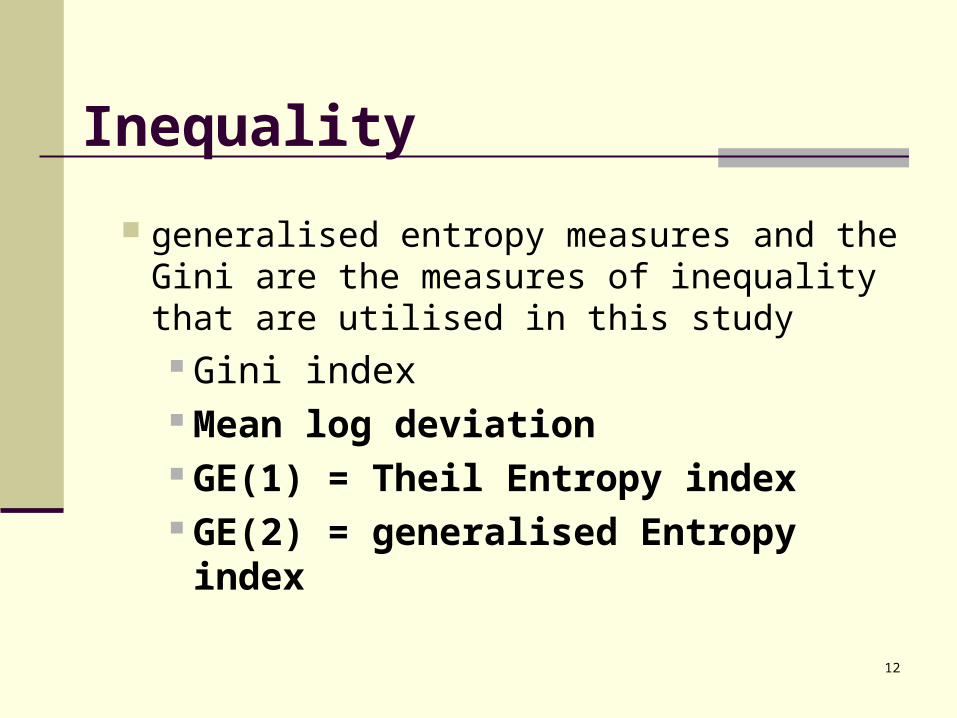
Inequality
generalised entropy measures and the Gini are the measures of inequality that are utilised in this study
Gini index Mean log deviation GE(1) = Theil Entropy index GE(2) = generalised Entropy index

13
Decomposition of Inequality The degree of measured inequality of the
distribution of an income variable can be decomposed into a component of inequality between the population groups Ib and the remaining within-group inequality Iw.
The decomposition by population subgroups of the GE class is defined as: Inequality = within-group inequality +
between-group inequality

14
Data
Merged data from the 1996 General Household Survey (GHS) and the National consumer survey (NCS) conducted by the Federal Office of Statistics as supplemental modules under the National Integrated Survey of Households (NISH).
Complemented by private survey in six states to collect additional data collected by the researchers especially for the social capital variables

15
Poverty profile of rural Households
0.58
0.59
0.6
0.61
0.62
0.63
Male Female
Poverty Headcount by gender

16
Poverty profile of rural Households
0
0.1
0.2
0.3
0.4
0.5
0.6
0.7
No Educ Pry Sec Beyond Sec
Poverty Headcount by Educational Attainment of household head

17
Poverty profile of rural Households
0.59
0.6
0.61
0.62
0.63
0.64
Below25
25-34 35-44 45-54 55-64 65 andabove
Poverty Headcount by Age group of household head

18
Poverty profile of rural Households
0
0.2
0.4
0.6
0.8
1
0 1 2 3 4 and above
Poverty Headcount by Number of Spouses of household head
56
57
58
59
60
61
62
63
64
65
Small Households MediumHouseholds
Large Households
Poverty Headcount By Household Size

19
Poverty profile of rural Households
0.618
0.62
0.622
0.624
0.626
0.628
0.63
Safe water unsafe water
Poverty Headcount by Access to safe water
0.59
0.6
0.61
0.62
0.63
0.64
Good sanitation Bad sanitation
Poverty Headcount

20
Determinants of Rural Poverty Age of household head
Quadratic relationship Poverty initially reduces as age of household
head increases and after a certain threshold, poverty starts increasing as the household head grows older.
reflects the situation where there is higher earning capacity with greater experience and age thereby leading to consumption smoothing over the life cycle. The magnitude of the quadratic parameter is however very low.

21
Determinants of Rural Poverty
Gender female headed household has a higher
probability of being poor than the male headed households
Farming Households In addition, households whose head are
engaged in farming activity have a higher probability of being poor and the marginal effect shows that this is as about 4 percent.

22
Determinants of Rural Poverty
Demographic variables (household size and structure Household size has a significant negative effect on
welfare indicating that the larger the household size, the lower the per capita expenditure.
Household composition matters An that an increase in either the number of children
or old people in the household will reduce the overall welfare level of the household
Presence of extra adult has higher depressing effect than that of a child

23
Educational Attainment
The educational attainment of the household head is a major factor in the determinant of welfare in the households. education attainment has a strong positive
effect on the welfare status of the households.
education reduces the probability of being poor in a household
the largest impact is for those who have up to post-secondary education, followed by those with primary education.
24
0
10
20
30
40
50
60
70
%
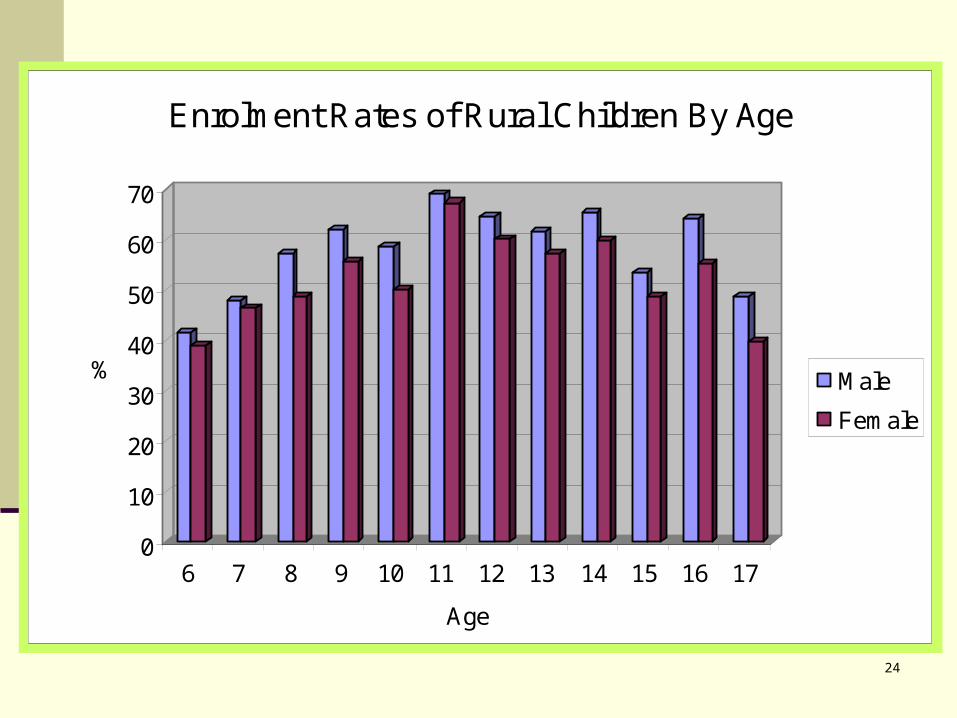
6 7 8 9 10 11 12 13 14 15 16 17
Age
Enrolment Rates of Rural Children By Age
Male
Female

25
Education
0
5
10
15
20
25
30
%
10 11 12 13 14 15 16 17
Age
Proportion of Rural Children Who Dropped out of School By Age
Male
Female
05
101520253035404550
%
10 11 12 13 14 15 16 17
Age
Proportion of Rural Children Who Have NeverAttended Formal Schools By Age
Male
Female

26
0
5
10
15
20
25
30
35
40
%
Stunting Wasting Underweight
Nutrition Status of Children In Nigeria
National
Rural
Urban
27
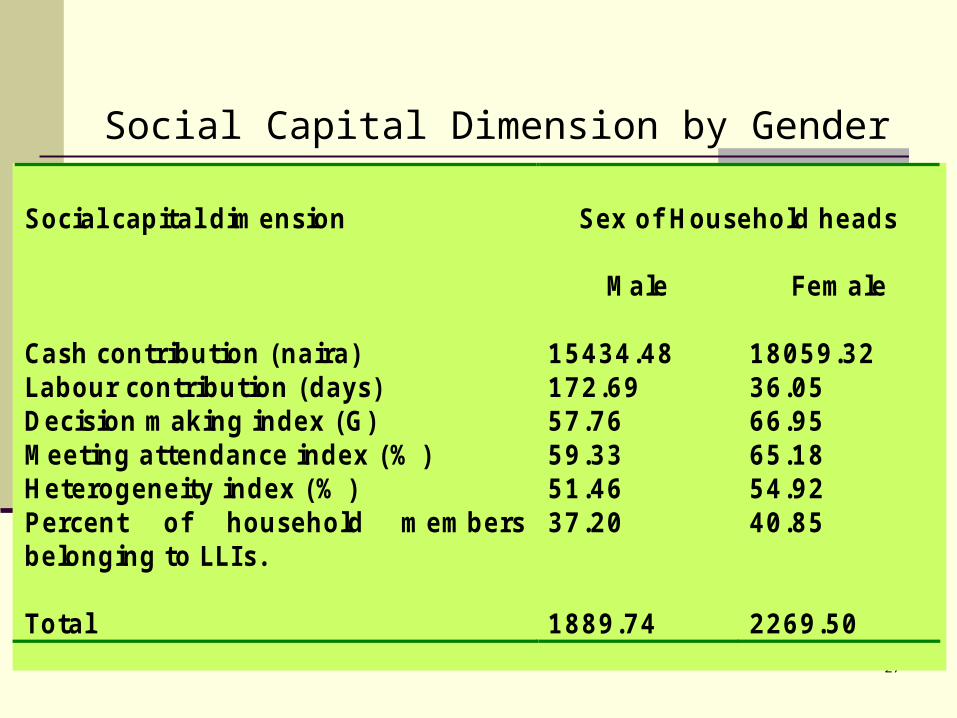
Social Capital Dimension by Gender
Sex of Household heads Social capital dimension
Male
Female
Cash contribution (naira) Labour contribution (days) Decision making index (G) Meeting attendance index (% ) Heterogeneity index (% ) Percent of household members belonging to LLI s.
15434.48 172.69 57.76 59.33 51.46 37.20
18059.32 36.05 66.95 65.18 54.92 40.85
Total
1889.74
2269.50

28
0%10%20%30%40%50%60%70%80%90%
100%
%
gender age rural-urban educ Zones
Decomposition of Inequality Among Rural Households
Betw een group(%)
Within group (%)

29
Poverty Alleviation Policies and Programmes
Agricultural development programmes Promotion of small-scale irrigation (Fadama Farming) Agricultural Development Programmes National Agricultural Land Development Authority The Strategic Grains Reserves Programmes etc
Non-Farming Programmes Establishment of the Small and Medium Enterprises
development Agencies (SMEDAN) for the development of small and medium scale enterprises in the country.
National Directorate of Employment

30
Poverty Alleviation Policies and Programmes Micro-Credit
Community Banks Nigerian Agricultural, Cooperative and
Rural Development Bank (NACRDB) have as its main thrusts, the establishment of its presence in rural Nigeria to offer commercial and development Banking services
Agricultural Credit Scheme Funds (ACGF)

31
Poverty Alleviation Policies and Programmes Health Sector Programmes
Primary Health Care (PHC) Scheme, National Programme on Immunisation Guinea-worm Eradication Programme
Education Sector, Universal Basic Education Nomadic Education Programme, etc.

32
Poverty Alleviation Policies and Programmes Coordination of Poverty Alleviation
agencies Establishment of National Poverty
Eradication Programme (NAPEP ) to serve as a coordinating and monitoring institution for all poverty eradication agencies in the country

33
Summary
Poverty is widespread in rural Nigeria and those engaged in farm activities are poorer than those engaged in non-farming activities.
Human capital and capabilities have significant effects in determining poverty status of rural households in Nigeria.
Households with higher social capital are less poor using different dimensions of poverty.
The social capital dimensions of meeting attendance, heterogeneity index and labour contribution in LLIs significantly reduce the probability of being poor.

34
Summary
The level of diversity among members of LLIs, meeting attendance and labour contribution score have positive influence on the per capita expenditure of households.
The test of reverse causality between social capital and household expenditure indicates that the direct effect of social capital on welfare outweighs the reverse effect in the explanation of the correlation between the two variables.
Social capital can complement human capital endowment in enhancing welfare and reducing poverty.

35
Summary
We however found that most of the inequality exists within group and not much of differences in groups explain appreciable levels of inequality in Nigeria except for educational attainment of household head and the geopolitical zones that the household belong.
Poverty reduction measures have had minimal impact in addressing the problems of poverty and also had insignificant impact on the living conditions of the poor.
36
Summary
Most poverty alleviation strategies were badly implemented and even had no particular focus on the poor in terms of design and implementation.
The strategies try as much as possible to create the opportunity and empower the poor, but they are found wanting in the areas of pro-poor growth and resource redistribution.
Coordination and monitoring of poverty alleviation efforts in the country are found wanting

37
Recommendations
Human capital and capabilities in rural households should be addressed through provision of adequate education and health to individuals especially in rural areas.
There is the need for better provision of social services, infrastructure and public goods.
The effort of poverty alleviation strategies should also be geared to empowerment. Through political and legal basis for inclusive development
Public administration that fosters growth and equity and promotion of inclusive decentralization and community development is required.

38
Recommendations Promotion of gender equity, tackling of social
barriers and support of poor people’s social capital needs to be done to enhance empowerment of the poor.
This calls for a need to formulate an approach to helping poor people to manage risk. This calls for designing national systems for social risk management and addressing civil conflicts.
Policies adopted should be consistent and sustainable. There is the need for an articulated policy document for poverty alleviation in Nigeria.

39
Thanks
Recommended


![Aerc%20 Presentation[1]](https://img.dokumen.tips/doc/110x75/558650dcd8b42a1b498b4704/aerc20-presentation1.jpg)


