Diploma Thesis
Population Genetics and Mating Strategies
of the Loggerhead Sea Turtle
(Caretta caretta) in Cape Verde
by
Victor Alexander Stiebens
28.4.2011
Supervisors:
Dr. Christophe Eizaguirre
Prof. Thorsten B.H. Reusch

2

The magnificent Loggerhead Sea Turtle (Caretta caretta)

4

Summary
Summary
The maintenance of natural population structure and of genetic diversity are the
cornerstones of evolutionary conservation genetics. They represent the adaptive and
evolutionary potential of endangered populations to survive. One of the most
charismatic endangered marine species is the Loggerhead Sea Turtle (Caretta caretta).
Despite being the second largest rookery in the Atlantic, the Cape Verde population has
received little scientific attention. During the 2010 nesting season, nesting females were
sampled on four different islands (N=111). Using various molecular methods such as
sequencing the mtDNA control region and genotyping at 8 microsatellite loci, we
determined several elements of the population functioning. First of all, demographic
history results suggest the colonization of the archipelago in two distinct waves. High
haplotypic and nucleotide diversities reveal that Cape Verde may have served as a
stepping stone towards the colonization of Mediterranean Sea. Furthermore, significant
genetic differentiation based on mtDNA haplotypes found on one beach indicates the
coexistence of two distinct philopatric strategies: one very accurate, where females
return to their natal beach (Lazareto beach in S. Vicente) and one more diverse strategy
where females seem to spread their clutches over different beaches and islands.
Microsatellite data revealed that the same Lazareto beach, also showed genetic
differentiation from the rest of the archipelago’s populations. Interestingly, even within
an island, beaches only separated by a couple of tens of kilometres showed reproductive
isolation. Hence, our study proposes that increasing geographic resolution may reveal
complex population functioning and we suggest the consideration of at least two
evolutionary significant units in Cape Verde. Because variation at neutral loci cannot
provide direct information on selective processes in the interactions between
individuals and their environment, nor the possibility of future adaptive changes,
genetic diversity at relevant genes should be investigated. To this end, the highly
polymorphic genes of the major histocompatibility complex (MHC) class I was chosen
and successfully characterized. MHC genes are at the root of the adaptive immune
system and have crucial function in specific recognition of parasite-derived antigens.
The outstanding polymorphism of those genes has been proposed as important marker
of genetic diversity for endangered populations. We found that beside at least one
duplication event, three lineages of MHC alleles persist in the population and probably
explain the signature of trans-species polymorphism seen among several species of

Summary
6
reptiles. Further, we discovered suggestive evidence for female turtles to not mate
randomly with regards to MHC, implying MHC-dependent mate choice. With the
characterization of this important adaptive marker, both for conservation and evolution,
the isolation of the MHC opens many new research directions such as the evolution of
mating strategy in large migratory marine species or the role of local adaptation in
female philopatric behavior.

Zusammenfassung
7
Zusammenfassung
Die Erhaltung natürlicher Populationsstrukturen und genetischer Vielfalt sind die
Grundbausteine von evolutiver Naturschutzbiologie. Sie repräsentieren das adaptive
und evolutionäre Potenzial für das Überleben von gefährdeten Populationen. Eine der
charismatischsten und gefährdetsten Arten ist die Unechte Karettschildkröte (Caretta
caretta). Obwohl die zweitgrößte Kolonie im Atlantik auf den Kapverdischen Inseln zu
finden ist, hat diese Population bisher relativ wenig wissenschaftliche Aufmerksamkeit
genossen. Während der Brutsaison 2010 wurden weiblichen Schildkröten von vier
verschiedenen Inseln auf den Kapverden DNS-Proben entnommen (N=111). Durch die
Benutzung verschiedener molekulargenetischer Hilfsmittel, wie die Kontrollregion in
der mitochondrialen DNS und acht polymorphen Mikrosatelliten, wurden verschiedene
Elemente der Populationsfunktion analysiert. Die Ergebnisse der demographischen
Geschichte haben gezeigt, dass die Inseln in zwei separaten Wellen kolonisiert wurden.
Hohe haplotypische und nukleotide Diversität deuten darauf hin, dass die
Kapverdischen Inseln auch als „stepping stone“ in der Kolonisation des Mittelmeers
gedient haben könnten. Weiterhin wurde signifikante genetische Differenzierung in
mitochondrialer DNS an einem Strand gefunden. Dies deutet auf die Koexistenz zweier
verschiedener philopatrischer Strategien auf dem Archipel: Eine sehr präzise Strategie,
in der die Weibchen an den Geburtsstrand zurückkehren (Lazareto Strand auf der Insel
von S. Vicente) und eine weniger präzise philopatrische Strategie in der die Weibchen
ihre Nester auf mehrere Strände oder sogar Inseln verteilen. Der gleiche Strand
(Lazareto) hat auch eine signifikante Differenzierung von dem Rest des Archipels durch
Mikrosatelliten gezeigt. Interessanterweise war diese reproduktive Isolation sogar
zwischen nahe gelegenen Stränden auf der Insel von S. Vicente zu beobachten.
Demzufolge schlägt unsere Studie vor, dass die Erhöhung von geographischer Auflösung
komplexe Populationsstrukturen offenbaren kann und dass zwei eigenständige
Evolutionseinheiten auf den Kapverden bestehen. Da Variation in neutralen Teilen des
Genoms weder direkte Auskunft über selektive Prozesse in der Interaktion zwischen
Organismen und ihrer Umwelt noch über möglichen Anpassungen zu zukünftigen
Veränderungen geben kann, sollten auch adaptive Gene betrachtet werden. Zu diesem
Zweck wurden die hoch polymorphen Gene des Haupthistokompatibilitätskomplex
(MHC) Klasse I in der Unechten Karettschildkröte ausgewählt, erfolgreich isoliert und
charakterisiert. MHC Gene sind ein Hauptbestandteil des adaptiven Immunsystems und

8
spielen eine entscheidende Rolle in der spezifischen Erkennung von Parasiten-Antigene.
Der hohe Polymorphismus dieser Gene hat dazu beigetragen, dass sie als wichtige
Markergene der genetischen Vielfalt für bedrohte Arten gelten. Ihre Charakterisierung
hat ergeben, dass es neben einem Gen-Duplikations-Ereignis drei Hauptstränge von
MHC-Allelen in der Population gibt, was den Trans-Spezies-Polymorphismus, den wir in
verschiedenen Reptilienarten beobachtet haben, erklären könnte. Weiterhin wurde
gezeigt, dass sich Schildkrötenweibchen, hinsichtlich des MHC, nicht zufällig paaren.
Dies könnte bedeuten, dass MHC Gene bei der Partnerwahl von Schildkröten eine Rolle
spielen. Mit der erfolgreichen Charakterisierung dieses, sowohl für Naturschutz- als
auch für Evolutionsforschung wichtigen adaptiven Markergens in der Unechten
Karettschildkröte, stehen viele Türen für zukünftige Forschungsrichtungen offen. Als
Beispiel kann hier die Evolution von Paarungsstrategien in einer großen migratorischen
marinen Spezies oder die Rolle von lokaler Anpassung in philopatrischem Verhalten
erwähnt werden.

Table of Contents
9
Table of Contents
General introduction .......................................................................................................................... 1
Global Phylogeography ........................................................................................................................ 1
A Multifaceted Life Cycle ..................................................................................................................... 1
Female Philopatry .................................................................................................................................. 2
Male mediated gene flow and philopatry ..................................................................................... 3
The Cape Verde Loggerhead population ....................................................................................... 4
Conservation threats ............................................................................................................................ 5
Neutral and adaptive genetic diversity ......................................................................................... 6
Study objectives ...................................................................................................................................... 7
Chapter I ...................................................................................................................................................... 8
Introduction .............................................................................................................................................. 8
Materials and methods .................................................................................................................... 10
Sample collection ................................................................................................................................ 10
DNA extraction ..................................................................................................................................... 11
Laboratory procedures - Mitochondrial DNA (mtDNA) marker ...................................... 12
Laboratory procedures - Microsatellite marker ..................................................................... 12
Data and statistical analysis ............................................................................................................ 13
Mitochondrial marker ................................................................................................................... 13
Microsatellite marker .................................................................................................................... 14
Biometrics ......................................................................................................................................... 15
Results ...................................................................................................................................................... 17
Mitochondrial DNA ............................................................................................................................. 17
Island level ........................................................................................................................................ 17
Signal reduced to a beach level .................................................................................................. 23
Signal over different nesting seasons ....................................................................................... 25
Microsatellite Markers ...................................................................................................................... 25
Island level ........................................................................................................................................ 25
Patterns scaled down to the beach level ................................................................................. 32
Biometrics .............................................................................................................................................. 34
Discussion ............................................................................................................................................... 37
Demographic history ......................................................................................................................... 37
Philopatry and genetic structure .................................................................................................. 39

Table of Contents
10
Reproductive isolation ...................................................................................................................... 40
Biometrics and hatchling dispersal.............................................................................................. 41
Implications for conservation ........................................................................................................ 45
Chapter II .................................................................................................................................................. 46
Introduction ........................................................................................................................................... 46
Material and Method ......................................................................................................................... 49
Sampling and DNA extraction ........................................................................................................ 49
Primer design ....................................................................................................................................... 49
Amplification, Cloning, and Sequencing ..................................................................................... 49
454 genotyping of all individuals ................................................................................................. 50
Genotyping ............................................................................................................................................ 51
Data analyses ........................................................................................................................................ 52
Results ...................................................................................................................................................... 53
Descriptive sequencing ..................................................................................................................... 53
Turtles description - Allelic pools ................................................................................................. 53
Turtles description - Individual allele variation ..................................................................... 55
Comparison with other reptiles .................................................................................................... 55
Discussion ............................................................................................................................................... 57
Final Conclusions ............................................................................................................................... 60
References .............................................................................................................................................. 63
Appendix .................................................................................................................................................. 74
Acknowledgements .......................................................................................................................... 75
Statement ................................................................................................................................................ 76

General Introduction
1
General Introduction
Global Phylogeography
The loggerhead sea turtle (Caretta caretta) is one of seven sea turtle species worldwide.
Four families of sea turtles were present during the Cretaceous Period, but nowadays
only two families remain: the Dermochelyidae, represented solely by the leatherback
turtle (Dermochelys coriacea) and the Cheloniidae, represented by six species including
the loggerhead sea turtle (Bowen 2003). Cheloniid turtles are primarily distributed in
tropical regions and southern extensions of continents, such as South Africa and South
America, represent barriers to population dispersal between the major oceans (Bowen
et al. 1994). But contrary to other Cheloniids, the loggerhead is more temperate in its
distribution, encompassing a rookery in Natal, South Africa (Hughes 1974) and nesting
almost exclusively in temperate regions (Pritchard & Trebbau, 1984).
A phylogenetic study revealed two primary mitochondrial (mtDNA) lineages for sea
turtles across the world (Bowen et al. 1994). The two lineages indicate a deep
separation between the Indian-Pacific and the Atlantic basins, possibly created by the
onset of the cold water upwelling system in Southern Africa roughly three million years
ago (Bowen et al. 1994; Shannon 1985).
In the colonization history of the loggerhead turtle there have been two more recent
events of gene flow between these oceanic basins in both directions, presumably also
through South African waters and the warm water Agulhas current (Bowen et al. 1994).
Nowadays, it seems that loggerhead populations are effectively geographically and
genetically isolated between basins, but occasional dispersal from the Tongaland
rookery in the Indian Ocean into the South Atlantic might occur via the Agulhas current
(Bowen et al. 1994).
A Multifaceted Life Cycle
The complex life cycle of the loggerhead sea turtle comprises various ontogenetic
habitat shifts and for long remained a mystery. New born turtles were seen hatching on
beaches and entering the ocean, but only seen again as subadults or adults years later; in
between were the “lost years” (Carr 1986). With the development of genetic markers
and the improvement of biotelemetry, the complete life cycle was successfully

General Introduction
2
characterized for some populations. One of these populations is the nesting aggregation
along the coast of Florida. This population will be used as an example to explain the life
cycle of the loggerhead sea turtle.
The life cycle begins on the beach where hatchlings emerge from their nests at night,
actively orient themselves and move towards the ocean (Lohmann and Lohmann 2003).
Once in the water, they undergo an active swimming period known as the “swim frenzy”
(Wyneken and Salomon 1992). This behavior is thought to take the hatchlings into the
main offshore currents (in this example the golf stream). The following transitional
stage can last between days and months, depending upon winds and surface currents
which facilitate the entering of the hatchlings into the oceanic zone (North Atlantic
Subtropical Gyre, Witherington 2002). At this stage juveniles are epipelagic, omnivorous
and spend ~75% of their time in the top 5 m of the water column (Bolten 2003). In the
vicinity of seamounts or islands the juvenile loggerheads may become epibenthic or
demersal (eg, Azores, Madeira or Canary islands). This oceanic stage, which lasts for 6 -
12 years (Bjorndal et al. 2000), is followed by an ontogenetic shift where the turtles
move to a more neritic habitat and feed mainly on the benthos community. This neritic
habitat is usually closer to the nesting grounds. In the case of the Florida loggerheads,
the juveniles travel back into the western Atlantic basin (Musick & Limpus, 1997). This
behavior is termed “juvenile natal homing” (Bolten, 2003). While juvenile foraging
grounds can coincide with those of the adults (usually neritic), subadults generally move
to the adult foraging grounds at sexual maturity and undergo breeding migrations to the
nesting habitats in Florida (Bolten, 2003).
Female Philopatry
The migration routes of the loggerhead turtle often span entire oceanic basins (Bolten et
al. 1998). Despite these long migratory movements and the mixing of populations in
juvenile feeding grounds (Monzón-Argüello et al. 2009), the loggerhead displays high
levels of genetic isolation among nesting aggregations (Bowen et al. 1994). Tagging
studies have demonstrated that the majority of nesting females return to the same beach
in successive years and that both sexes return to their resident foraging grounds
(Limpus et al., 1992). Evolutionary pressures selecting for this behavior are still rather
elusive, but the mechanism can be as simple as young females following experienced

General Introduction
3
females to a nesting site (“social facilitation”) or more complex as females returning to
the area they were born using various cues (“philopatry”, Meylan et al. 1990).
The rather recent emergence of genetic tools helped to better understand female nesting
behavior. Mainly two types of neutral genetic markers are used in sea turtle biology, the
mitochondrial control region (mtDNA) and microsatellite tandem repeats located in the
nuclear genome. The mitochondrial genome is haploid, evolves only through mutations
and is only maternally inherited, which makes it an ideal tool to test philopatric
behavior in sea turtles (Bowen et al. 1994). Nuclear microsatellite markers are inherited
from both parents and evolve through both point mutations and recombination.
Therefore, they are frequently used to address question of reproductive isolation and
male-mediated gene flow among sea turtle colonies (Karl et al. 1992).
Under social facilitation, nesting beaches in a region would be well connected by gene
flow (female mediated mtDNA gene flow), if the females overlap in their feeding
grounds. Philopatric behavior, on the other hand, would lead to genetically isolated
nesting beaches (Bowen, 2003). Significant regional population structure, based on
mtDNA, was found in 10 nesting colonies in the Atlantic and the Mediterranean
(Encalada et al. 1998). This was one of many studies that showed significant population
structure on mtDNA in various worldwide rookeries (e.g. Carreras et al., 2006;
FitzSimmons et al., 1996). The independent finding of genetic differentiation of regional
nesting colonies in the Atlantic, Mediterranean and Indo Pacific provides strong
evidence for philopatric behavior in the loggerhead sea turtle (Bowen et al. 1993).
Male mediated gene flow and philopatry
Contrary to females, males seldom reach the shore and direct observations are scarce.
Once more, indirect genetic markers allow obtaining information. The Southeastern
United States are not only among the largest nesting populations of the world (Conant et
al. 2009), but also do populations overlap in their feeding grounds enabling the test for
philopatric behavior (Bowen 2003). Pearce (2001) found high genetic structure of
mtDNA, but very low structure of microsatellites in nesting females of different nesting
colonies. This indicates that females show site fidelity to a particular region and males
provide avenues of gene flow between nesting locations within a rookery. It is not yet
certain whether males provide this gene flow by mating in the feeding grounds or on the

General Introduction
4
migratory pathways. If males do go back to the natal beach, they probably also mate
opportunistically in the feeding grounds or during migrations (Bowen 2003).
The Cape Verde Loggerhead population
The second largest rookery of the loggerhead sea turtle in the Atlantic is found in the
Cape Verde Archipelago (Figure 1, Monzón-Argüello et al., 2010) with around 15000
nests laid every year (Varo-Cruz 2010). Only the nesting aggregations in South Eastern
Florida (53000- 92000 nests per year, TEWG, 2000) and Masirah Island, Oman (20000-
40000 nesting females per year, Ross 1997) are larger. Despite the size of the Cape
Verde population, its need for conservation was recognized very early (Schleich 1979,
Lopez-Jurado et al. 2000), while it has only recently received scientific attention (for
instance: Cejudo et al., 2000; Santos Loureiro, 2008; L. F. Lopez-Jurado et al., 2003; Varo-
Cruz, 2010; Hawkes et al., 2006; Monzón-Argüello et al., 2010; Abella et al., 2007; Abella,
2010). The first genetic study, based on mtDNA haplotypes, revealed significant
differences between the Cape Verde and other Atlantic and Mediterranean rookeries,
identifying it as an independent rookery (Monzón-Argüello et al. 2010).
The majority of the nesting happens on the islands of Boavista (around 90%) and Sal
(Marco et al. 2008, Figure 1). In S. Nicolau, S. Vicente, Santa Luzia and Maio Islands the
number of females are much lower (Marco et al. 2008). Sporadic nests can be found on S.
Antao and Fogo (Sonia Merino and Jeff Kutz respectively, personal communication). It is
important to note that there are no major nesting aggregations either on mainland
Africa (Arvy et al. 2000; Brongersma 1982; Fretey 2001), or on other Macronesiean
islands (Azores, Madeira Archipelago, The Selvagens Islands, and the Canary Islands,
Brongersma 1982).
Large gaps in the knowledge of the life cycle of the Cape Verde Loggerhead population
still remain. Two distinct feeding grounds have been determined off the west coast of
Africa, by satellite logging ten postnesting female loggerheads (Hawkes et al., 2006).
Interestingly a size dichotomy was observed. The three bigger females traveled towards
Guinea and Sierra Leona whereas the seven smaller nesting females stayed in the
oceanic habitat between the Cape Verde and Gambia/Guinea/Guinea Bissau. Frequent
deep dives also suggest a more oceanic lifestyle of the smaller turtles (Hawkes et al.
2006). The breeding migrations of female loggerheads to Cape Verde seem to have a 2 or

General Introduction
5
3 year cycle (range 1-6) based on capture-recapture data (Varo-Cruz 2010). For males,
no such information is available for Cape Verde, but studies from other populations
suggest that males might return on a yearly basis to mate (Henwood 1987). The mating
is presumed to occur along the way to the nesting beaches several weeks prior to the
onset of nesting and sometimes occurs in specific aggregation areas (Caldwell et al.
1959). Nesting occurs on the beach and follows a ritualized process (Dodd 1988).
Loggerhead turtles in Cape Verde lay multiple nests (range 1-6; average 1.4) in one
season (Varo-Cruz 2010). After about sixty days (depending upon temperature, Dodd
1988) the offspring hatch, enter the ocean and are not seen before they return as mature
loggerheads to Cape Verde. Where they remain as post hatchlings is still a mystery, but
Monzón-Argüello et al. (2010) suggest that the juveniles distribute in Atlantic and
Mediterranean waters (including Gimnesies, Madeira, Andalusia, Pitiüses, Azores and
the Canary Islands), thus frequenting the same waters as populations from the Western
Atlantic and the Mediterranean. Before reaching maturity, the juveniles then probably
move to the West African mainland coast where they were described to swim after
nesting (Hawkes et al. 2006) and undergo their breeding migrations to the Cape Verde.
Conservation threats
The endangered loggerhead turtle (IUCN 2007) faces various anthropogenic threats. In
Cape Verde, these include the destruction of nesting beaches, due to increasing
urbanization (Taylor & Cozens, 2010) and massive sand mining in specific areas (Sonia
Merino, personal communication). A major threat also comes from the illegal harvest of
eggs and adult females on the beaches. In 2007, an estimated 1150 turtles (of 3194
turtles that came to nest that year) were poached on the beaches of Boavista Island
alone, representing 1/3 of the nesting population that season (Christian Roeder,
personal communication). On the island of Sal, numbers of dead turtles are equally high.
In the 2009 nesting season, 91 out of 293 tagged turtles were killed (Cozens 2009). Both
males and females are also harvested in the surrounding waters of Cape Verde (personal
communication with local fisherman). While bycatch of loggerheads in the intense local
fisheries has been reported (Lopez-Jurado et al., 2003), its impact on the population
remains to be investigated. Finally, the effects of climate change on sea turtles can be
manifold: skewed sex ratio towards females, due to temperature dependent sex

General Introduction
6
determination, or the alteration of key marine habitats on which the turtles depend, are
just two examples (Hawkes et al., 2009).
In summary, many factors could contribute to the extinction of the loggerhead turtle in
Cape Verde. However, before any adequate conservation programs can be designed,
major gaps in the understanding of the Cape Verde loggerhead population must be filled.
Neutral and adaptive genetic diversity
In this context, the next frontier in turtle biology is the understanding of the impact of
the numerous threats on relevant genetic diversity. It is thought that standing genetic
variation is crucial for the survival of populations (Soule 1980). In the short term,
inbreeding and genetic drift leads to lower fitness of individuals and an increased risk of
population extinction. In the longer term, populations that loose genetic variation (for
example through demographic events or selection), have a lower potential to adapt to
changing conditions (Spielman et al. 2004). Standing genetic variation can be
investigated using selectively neutral markers such as the control region of the mtDNA
and the microsatellite loci in the nuclear genome. Thus, removing the effect of selection,
these markers provide valuable information on the strength and importance of
recombination, mutations, genetic drifts and migrations in the process of shaping
genetic variation among populations (Hoeglund 2009). However, variation at neutral
loci cannot provide direct information on selective processes and the interactions
between individuals and their environment, nor the possibility of future adaptive
changes (Meyers and Bull 2002). Such adaptive genes should therefore be under known
selective pressure of ecological relevance and display high degree of polymorphism to
adapt to local/changing conditions (Barton et al. 2007). Among the best candidates for
studying adaptive genetic diversity relevant in conservation are the genes of the Major
Histocompatibility Complex (MHC, Hoeglund, 2009; Sommer, 2005). MHC diversity
influences many important biological traits, such as immune recognition, susceptibility
to infection, autoimmune diseases, individual odors, mating preferences, kin recognition,
cooperation and pregnancy outcome (Sommer 2005). These genes are a central
component of the jawed vertebrate (gnathostome) immune system (Janeway et al.
2001) and encode for T cell antigen presenting molecules (Trowsdale 1993). They play a
major role in self and non-self recognition and in the acivation of the adaptive immune

General Introduction
7
respone (Klein 1986). MHC class I molecules confer resitance against intracellular
pathogens (such as viruses) and are expressed on nearly all cell types, whereas MHC
class II genes are only found on specialized immune cells (e.g macrophages) that bind
antigens derived from extracellular parasites (Janeway et al. 2001). As a fact, these are
the most polymorphic genes ever recorded. For instance, in humans, over 500 alleles
have been described at a single locus (Robinson et al. 2003). The mechanism
maintaining this polymorphism is thought to be parasite-mediated selection (Klein
1986; Piertney and Oliver 2006) and the exceptional allelic diversity usually observed in
natural populations, provides the unique potential to adapt to a given local parasite
spectrum by natural selection (Eizaguirre and Lenz 2010; Spurgin and Richardson
2010).
Study objectives
In the first chapter of this study, we investigated the population structure of the
loggerhead sea turtle in Cape Verde based on neutral markers. We inferred reproductive
behavior (based on gene flow) among islands, signs of philopatric behavior and possible
demographic events shaping population structure. Since neutral and adaptive diversity
are usually either weakly correlated (Hedrick 2001) or not correlated at all (Madsen et
al. 2000), in chapter II we describe the characterization of the MHC class I of the
loggerhead turtle. Using next generation sequencing technology, we set up a working
protocol for high throughput genotyping in loggerhead turtles. We also investigated the
evolution of loggerhead turtle MHC genes in the reptile phylum. All these efforts were
also put in a context of conservation to address efforts needed for sustainable
conservation programs on Cape Verde.

Chapter I - Introduction
8
Chapter I
Population Structure of the Loggerhead Sea Turtle at the
Northern Islands of Cape Verde
Introduction
The loggerhead sea turtle (Caretta caretta) is widely distributed in all tropical and
subtropical waters in the world (Dodd 1988). It is a highly migratory species with
possible trans-oceanic migrations observed during early stages of the life cycle (Bolten
et al. 1998). Although only discovered in the last two decades, the second largest nesting
aggregation in the Atlantic Ocean is found in Cape Verde (Monzón-Argüello et al. 2010),
with approximately 15000 nests are laid per season (Varo-Cruz 2010). Cape Verde
nesting turtles are genetically different from their counterparts in the Western Atlantic,
Mediterranean and Brazilian populations (Monzón-Argüello et al. 2010).
The whereabouts of post hatchlings loggerheads originated in Cape Verde is still a
mystery. However, juvenile loggerheads have been described feeding in waters of
Madeira, Andalusia, Pitiüses, Azores, the Gimnesies, and the Canary Islands (Monzón-
Argüello et al. 2010). A size-dependent adult foraging strategy has been described for
post-nesting females, with bigger turtles going to a neritic feeding habitat off the coast of
Gambia and Sierra Leone and smaller females feeding in a pelagic habitat off the coasts
of Senegal (Hawkes et al. 2006).
This complex life cycle with ontogenetic habitat shifts provides many possibilities of
interference with anthropogenic threats, which has led to enlisting the loggerhead turtle
as endangered in the red list of threatened species (IUCN 2007). The Cape Verde
population is no exception to this rule and the turtles there face many threats, such as
habitat destruction of nesting beaches, poaching of both eggs and adult turtles or
accidental captures in bycatch (Lopez-Jurado et al. 2003; Marco et al. 2008; Taylor and
Cozens 2010).
The colonization history of Cape Verde by the loggerhead is not yet certain. The
Mediterranean population, the closest to the Cape Verde, was colonized after the last
glacial maximum, by the Western Atlantic population about 12.000 years ago (Bowen et
al. 1993). The Cape Verde could have been colonized in the same wave or served as a
possible stepping stone towards the Mediterranean.

Chapter I - Introduction
9
Population genetic studies with marine turtles using maternally inherited mitochondrial
DNA (mtDNA) have shown high levels of genetic structuring, providing strong evidence
that female turtles are highly philopatric to the region they were born (Meylan et al.
1990). In the western North Atlantic loggerhead population, this pattern holds true and
with no structure found on the biparentally inherited microsatellite makers, the gene
flow between the rookeries seems to be maintained through males (Bowen et al. 2005).
Male mediated gene flow would prevent genetic isolation in the western Atlantic despite
female philopatry. In other words, metapopulation functioning predicts that the loss of
nesting beaches corresponds to the loss of haplotype diversity, whereas nuclear
diversity will only be reduced if a large number of beaches are lost (Bowen et al. 2005).
In this context it is important to mention the concept of a conservation management unit
(evolutionary significant unit). It is usually characterized by significant divergence at
mitochondrial or nuclear loci and key demographic features (Moritz 1994). Since, these
units are characterized by reproductive isolation, each of these units has a potential set
of genetic diversity in the population that could be different to the ones in the other
population.
In this context, it becomes crucial to address presence of genetic diversity and
reproductive isolation at various geographical scales. We analyzed the genetic structure
among islands of the Cape Verde Archipelago, but also within those islands, among
beaches. This was possible by large sampling effort focusing on collecting genetic
material from at least two beaches per island. We searched for possible reproductive
isolations and signs of female philopatric behavior. We also tested demographic events
which might have occurred in the past, both on mtDNA and microsatellites. Additionally,
we used previous genetic data to test for genetic structure between different nesting
seasons. Combining our results with previously published data, we refine the
colonization pattern of the species in the Atlantic and the Mediterranean Sea. Eventually,
using the observed size distributions, information from satellite tagging and the major
ocean currents, we propose different scenarios of dispersal, which could explain how the
loggerhead migrate during their early life to reach the potential different feeding
habitats. All the results are discussed in both an evolutionary and conservation
perspective of sustainability of the loggerhead population in Cape Verde.
Chapter I - Materials and methods
10
Materials and methods
Sample collection
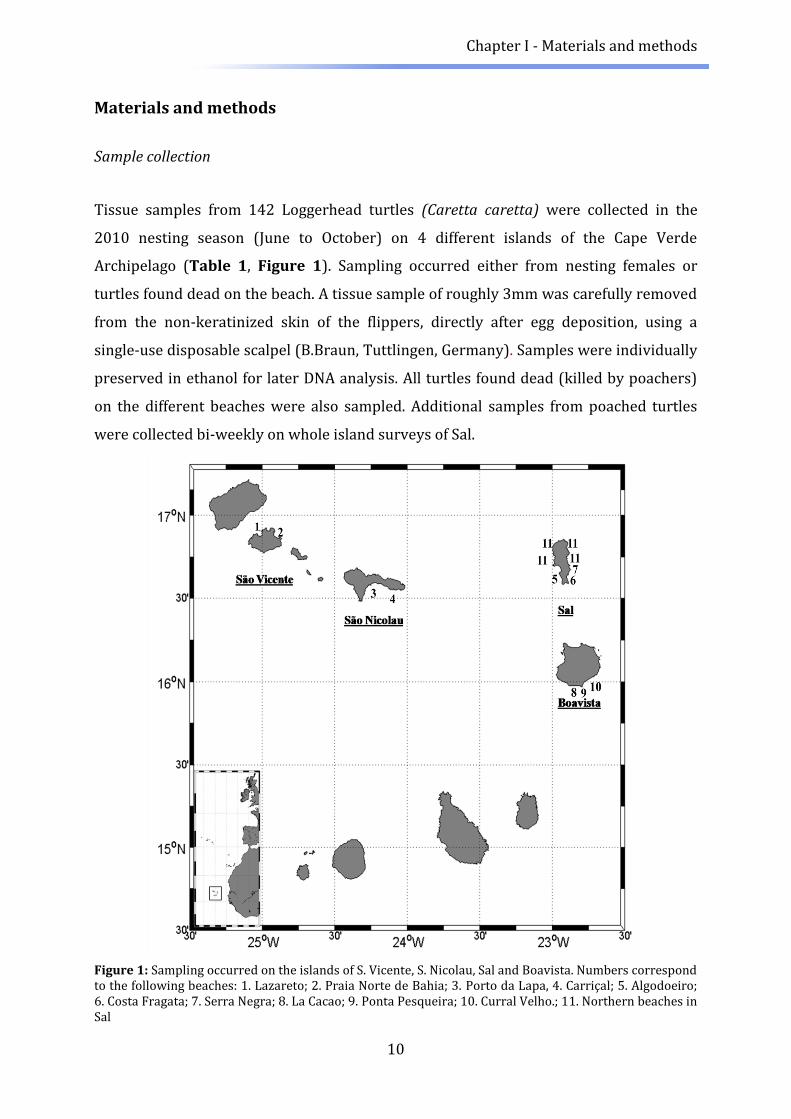
Tissue samples from 142 Loggerhead turtles (Caretta caretta) were collected in the
2010 nesting season (June to October) on 4 different islands of the Cape Verde
Archipelago (Table 1, Figure 1). Sampling occurred either from nesting females or
turtles found dead on the beach. A tissue sample of roughly 3mm was carefully removed
from the non-keratinized skin of the flippers, directly after egg deposition, using a
single-use disposable scalpel (B.Braun, Tuttlingen, Germany). Samples were individually
preserved in ethanol for later DNA analysis. All turtles found dead (killed by poachers)
on the different beaches were also sampled. Additional samples from poached turtles
were collected bi-weekly on whole island surveys of Sal.
Figure 1: Sampling occurred on the islands of S. Vicente, S. Nicolau, Sal and Boavista. Numbers correspond to the following beaches: 1. Lazareto; 2. Praia Norte de Bahia; 3. Porto da Lapa, 4. Carriçal; 5. Algodoeiro; 6. Costa Fragata; 7. Serra Negra; 8. La Cacao; 9. Ponta Pesqueira; 10. Curral Velho.; 11. Northern beaches in Sal
Chapter I - Materials and methods
11
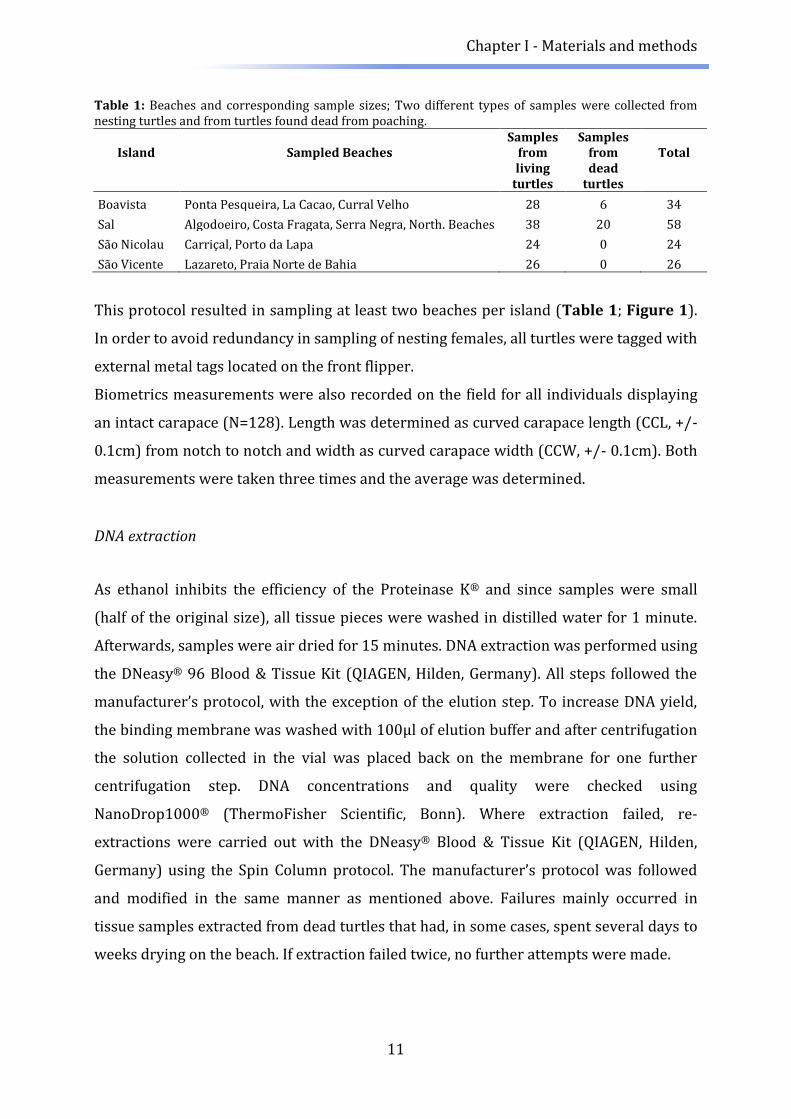
Table 1: Beaches and corresponding sample sizes; Two different types of samples were collected from nesting turtles and from turtles found dead from poaching.
Island Sampled Beaches Samples
from Samples
from Total
living
turtles dead
turtles
Boavista Ponta Pesqueira, La Cacao, Curral Velho 28 6 34
Sal Algodoeiro, Costa Fragata, Serra Negra, North. Beaches 38 20 58
São Nicolau Carriçal, Porto da Lapa 24 0 24
São Vicente Lazareto, Praia Norte de Bahia 26 0 26
This protocol resulted in sampling at least two beaches per island (Table 1; Figure 1).
In order to avoid redundancy in sampling of nesting females, all turtles were tagged with
external metal tags located on the front flipper.
Biometrics measurements were also recorded on the field for all individuals displaying
an intact carapace (N=128). Length was determined as curved carapace length (CCL, +/-
0.1cm) from notch to notch and width as curved carapace width (CCW, +/- 0.1cm). Both
measurements were taken three times and the average was determined.
DNA extraction
As ethanol inhibits the efficiency of the Proteinase K® and since samples were small
(half of the original size), all tissue pieces were washed in distilled water for 1 minute.
Afterwards, samples were air dried for 15 minutes. DNA extraction was performed using
the DNeasy® 96 Blood & Tissue Kit (QIAGEN, Hilden, Germany). All steps followed the
manufacturer’s protocol, with the exception of the elution step. To increase DNA yield,
the binding membrane was washed with 100µl of elution buffer and after centrifugation
the solution collected in the vial was placed back on the membrane for one further
centrifugation step. DNA concentrations and quality were checked using
NanoDrop1000® (ThermoFisher Scientific, Bonn). Where extraction failed, re-
extractions were carried out with the DNeasy® Blood & Tissue Kit (QIAGEN, Hilden,
Germany) using the Spin Column protocol. The manufacturer’s protocol was followed
and modified in the same manner as mentioned above. Failures mainly occurred in
tissue samples extracted from dead turtles that had, in some cases, spent several days to
weeks drying on the beach. If extraction failed twice, no further attempts were made.
Chapter I - Materials and methods
12
Laboratory procedures - Mitochondrial DNA (mtDNA) marker
All individuals (N=142) were amplified for a ~ 720 base pair (bp) fragment in the
control region of the mtDNA using the recently developed LCM15382 and H950 primers
(Abreu-Grobois et al. 2006; see appendix for primer sequences). 10µl PCR reactions
consisted of 1µl 10x Buffer (InvitekR), 1 µl dNTP’s (10 mM), 1µl 1% BSA, 0.3 µl MgCl22,
3.6µl HPLC water, 0.1 Taq Polymerase (Invitek®), 1µl template DNA and 1µl of each
primer (5pmol/µl). The reactions were carried out under the following thermo-cycling
conditions: first denaturation step of 94°C for 2 minutes, followed by 40 cycles at 94°C
for 1 minute, 55°C for 1 minute and 72°C for 1 minute. The final elongation lasted 5
minutes at 72 °C. PCR products were purified with ExoSAP-IT® according to the
manufacturer’s protocol. Cycle sequencing reactions were performed with Big Dye®
Terminator v3.1 Cycle Sequencing Kit (Applied Biosystems, Darmstadt, Germany).
Sequences were obtained from the forward direction (primer LCM15382) and covered
the entire DNA fragment range. The sequences were loaded on the ABI 3730 Genetic
Analyzer (Applied Biosystems, Darmstadt, Germany).
Laboratory procedures - Microsatellite marker
After testing 16 microsatellite primer pairs, only the eight most polymorphic, which
were under Hardy Weinberg equilibrium and could be multiplexed, were used to
genotype all individuals. The primers Cc-10, Cc-17, Cc-22, Cc-16, Cc2 (Monzón-Argüello
et al. 2008), 7C04, 2H12, 2G10 (Shamblin et al. 2007) were grouped into three
multiplexes using 10 µl PCR reactions (Table 2). The same thermal cycling program was
used for all multiplexes: initial denaturation at 94°C for 3 minutes, 28 cycles of 30
seconds at 94°C, 30 seconds at 61°C and 30 seconds at 72°C and a final elongation at
72°C for 10 minutes. The GeneScan™ 350 ROX™ (Applied Biosystems, Darmstadt,
Germany) was used to standardize the peaks and the products were analyzed on an ABI
3130 Genetic Analyzer (Applied Biosystems, Darmstadt, Germany).

Chapter I - Materials and methods
13
Table 2: Composition of the three multiplexes
Multiplex 1 Multiplex 2 Multiplex 3
Cc-10, 7C04, 2H12 Cc-17, 2G10 Cc-22, Cc-16, Cc-2
10x Dreamtaq® Buffer 1µl 1µl 1µl
dNTP’s (10 mM) 0.5µl 0.5µl 0.5µl
HPLC water 1.4µl 5.4µl 2.4µl
Dreamtaq® Taq polymerase 0.1µl 0.1µl 0.1µl
Primer 1 Forward (5pmol/µl) 1µl Cc-10 0.5µl Cc-17 0.5µl Cc-22
Primer 1 Reverse (5pmol/µl) 1µl Cc-10 0.5µl Cc-17 0.5µl Cc-22
Primer 2 Forward (5pmol/µl) 1µl 7C04 0.5µl 2G10 1µl Cc-16
Primer 2 Reverse (5pmol/µl) 1µl 7C04 0.5µl 2G10 1µl Cc-16
Primer 3 Forward (5pmol/µl) 1µl 2H12 - 1µl Cc-2
Primer 3 Reverse (5pmol/µl) 1µl 2H12 - 1µl Cc-2
Template DNA 1µl 1µl 1µl
Data and statistical analysis
All statistical analyses were performed using the software package R version 2.12.2 (The
R foundation for statistical Computing).
Data and statistical analysis - Mitochondrial marker
All obtained electropherograms were aligned in CodonCode Aligner v3.5
(codoncode.com) in one assembly. All sequences (~720bp) were corrected for
sequencing errors by hand and classified according to the standardized nomenclature of
the Archie Carr Center for Sea turtle Research (http://accstr.ufl.edu/.; ACCSTR). Two
haplotypes (2 presents in two individuals and one in a single turtle) were found to not
have been previously described. A haplotype data file was created in the software
DNASP v. 5.10.01 (Librado and Rozas 2009) and was used to test for haplotype diversity
and nucleotide diversity (Nei 1987). To understand the evolutionary relationship among
the different haplotypes, a haplotype network was generated in the software NETWORK
version 4.6.0.0. Population differentiations were estimated using Wright’s fixation index
(Fst) implemented in Arlequin version 3.1.5.2 (Excoffier et al. 2005). Statistical
significance was tested over 100 permutations. As population’s expansion or contraction
leave recognizable signatures in the pattern of molecular diversity, Arlequin was used
threefold to predict demographic changes based on mtDNA. First, Tajimas D (Tajima
1989) and Fu’s Fs (Fu 1997) estimators of neutrality were computed with 1000
coalescent simulations. These indices test whether the data is conform to expectations of

Chapter I - Materials and methods
14
neutrality or depart from it, due to effects such as bottlenecks or population’s expansion.
Expectations are near zero in a population with constant size. Significant negative values
indicate an expansion in population size, whereas significant positive values indicate a
past bottleneck. Secondly, demographic population expansion events were tested using
the model of Sum of Squared Deviations (SSD) of a mismatch distribution with 100
replicates in a parametric bootstrap approach (Schneider and Excoffier 1999). We tested
the goodness-of-fit of the observed distribution of pairwise nucleotide differences
(mismatch distribution) to that expected from the demographic expansion model using
the SSD (Schneider and Excoffier 1999). The model presumes that expanding population
will show a genetic signature (unimodal distribution) that is different from that
observed with a constant population size (multimodal distribution). Statistical
significance is taken as proof of departure from the expansion model and thus an
indication for constant population size in the past. Thirdly, demographic changes were
also predicted using the Raggedness index r (Harpending 1994) of the observed
mismatch distribution. Small values indicate that a population has experienced sudden
expansion, while higher values suggest stationary or bottleneck populations
(Harpending 1994).
After the initiation of this current work, the first population genetic study of the
loggerhead turtle at the Cape Verde archipelago was released. Since our sampling was
partly similar to those of Monzón-Argüello et al. (2010), we tested for population
differentiation based on mtDNA over different reproductive periods for those islands
that overlapped.
Data and statistical analysis - Microsatellite marker
Microsatellite alleles were called in the software GeneMarker 1.91 (Softgenetics LLC,
State College, PA, USA), converted with Genetix 4.05.2 (Belkhir et al. 1999) and loaded
into Arlequin version 3.1.5.2. There, departure from Hardy-Weinberg equilibrium,
observed (Ho) and expected heterozygosity (He) as well as Fst were calculated. Because
locus based heterozygosity and individual based heterozygosity may not always
correlate positively, an individual heterozygosity index was estimated (Coulson Index,
CI, Coulson et al. 1998). To estimate the total number of alleles per population we
performed a rarefaction analysis over the mean number of alleles with the lowest

Chapter I - Materials and methods
15
number of genes for each sample in the given test. For this, we used the software
package HP-Rare version June-6-2006 (Kalinowski 2005).
To relate Fst values to geographic distances a mantel test was conducted using the
software Genetix 4.05.2. Geographic distances were estimated as the shortest possible
swimming distance between sampling points using GoogleEarth (version 5.2.1.1588).
Genetix 4.05.2 was also used to visualize three dimensional factorial component
analyzes (AFC plot).
Additionally, an unrooted phylogenetic tree using Cavalli-Sforza distances based on
microsatellites was calculated with the program PHYLIP (Felsenstein 1989). In this
software package the programs “Seqboot”, “Genedist”, “Neighbor”, “Consense” and
“Drawtree” were used to compute the phylogenetic tree. Because nesting population
may not represent best genetic structure, to identify the most likely number of
populations (K), with no a priori assumption on population structure, the data was
loaded into STRUCTURE version 2.3.3 (Pritchard et al. 2000). Both the length of the
burn-in period and the MCMC were set to 100000. Detection of the most likely number
of K groups followed using the logarithmic likelihood approach (ΔK ad hoc statistics,
Evanno et al. 2005).
To detect potential confounding demographical events (with regards to population
structuring), the microsatellite data was also loaded into the program Bottleneck
(Cornuet and Luikart 1997). In order to detect potential recent bottlenecks, we used the
two phase model (TPM) with 90% stepwise, 10% infinite allele mutations and 1000
iterations as recommended for microsatellites (Di Rienzo et al. 1994). Eventually, the
same software was also used to test for a modal shift in allele frequency classes expected
from past population reductions.
Data and statistical analysis - Biometrics
After visual inspection for normal distribution, variation of Curved Carapace Length
(CCL) was tested using an analysis of variance with either island or nesting beach as
predictor (ANOVA). In order to compare the length of the turtles to other rookeries, CCL
was converted to Straight Carapace Length (SCL) after (Frazer and Ehrhart 1983). The
conversion formula was established for adult Loggerhead turtles from the southern
Florida population, so errors due to local deviations may occur. Further, a size

Chapter I - Materials and methods
16
comparison of the Cape Verde rookery to other loggerhead rookeries across the world
was elaborated. Symbolically, only some of these rookeries were shown on the bar plot,
illustrating two rookeries with bigger nesting females, two of intermediate sizes and two
of small sizes.
Chapter I - Results
17
Results
Mitochondrial DNA
Mitochondrial DNA - Island level
Out of the 142 sampled turtles, 132 could be sequenced for a 720 bp mtDNA control
region. To directly compare mtDNA markers to microsatellite markers, 111 mtDNA
sequences were used, for which the 8 microsatellite markers could also be scored. In
most cases, the cause for no amplification of the markers was degraded DNA originating
from dead turtles.
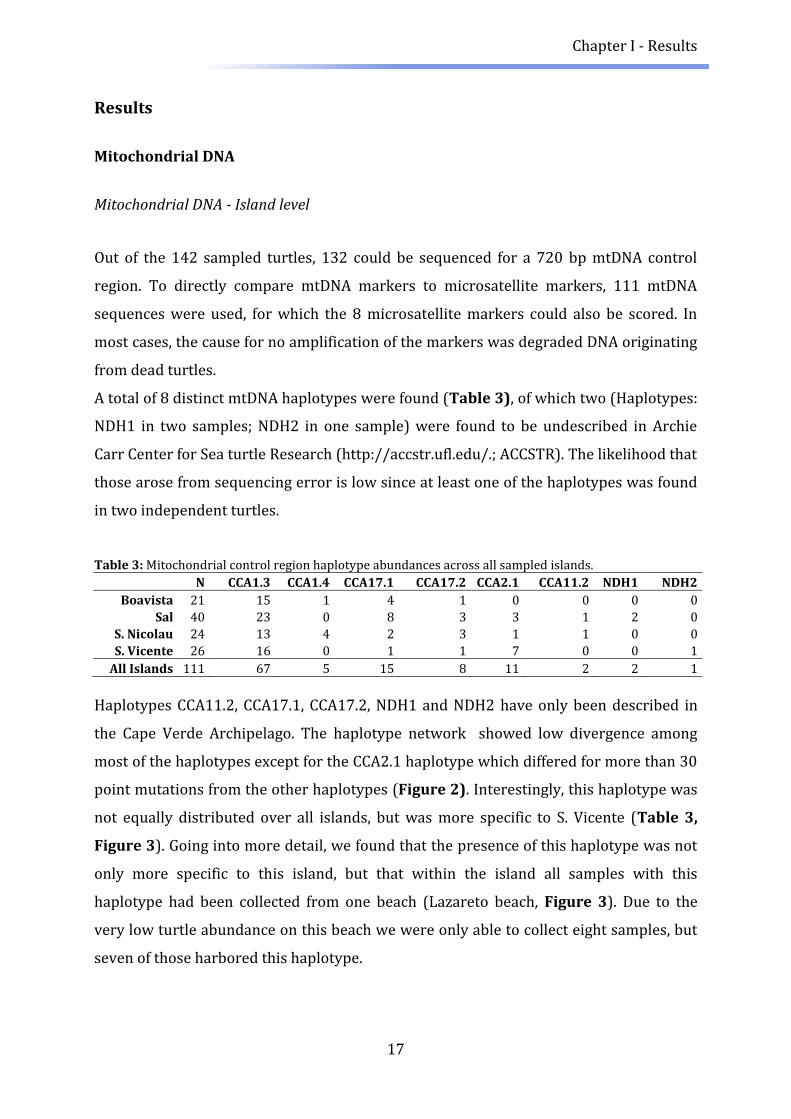
A total of 8 distinct mtDNA haplotypes were found (Table 3), of which two (Haplotypes:
NDH1 in two samples; NDH2 in one sample) were found to be undescribed in Archie
Carr Center for Sea turtle Research (http://accstr.ufl.edu/.; ACCSTR). The likelihood that
those arose from sequencing error is low since at least one of the haplotypes was found
in two independent turtles.
Table 3: Mitochondrial control region haplotype abundances across all sampled islands.
N CCA1.3 CCA1.4 CCA17.1 CCA17.2 CCA2.1 CCA11.2 NDH1 NDH2
Boavista 21 15 1 4 1 0 0 0 0
Sal 40 23 0 8 3 3 1 2 0
S. Nicolau 24 13 4 2 3 1 1 0 0
S. Vicente 26 16 0 1 1 7 0 0 1
All Islands 111 67 5 15 8 11 2 2 1
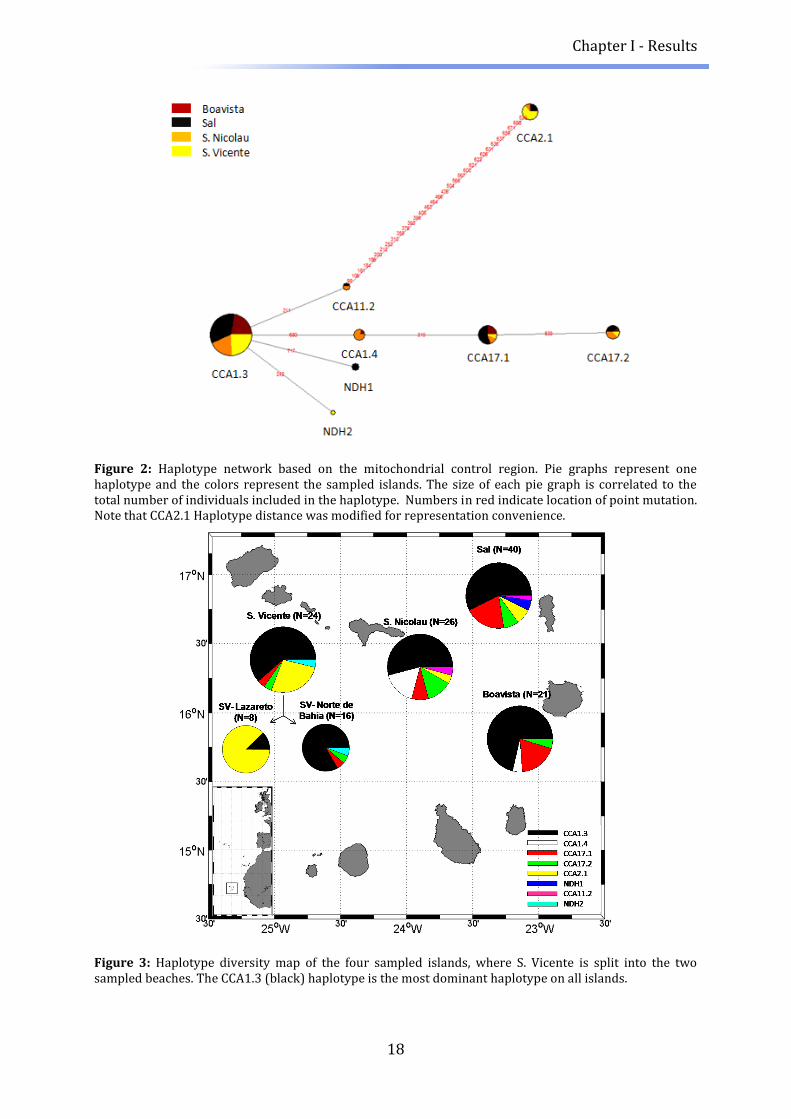
Haplotypes CCA11.2, CCA17.1, CCA17.2, NDH1 and NDH2 have only been described in
the Cape Verde Archipelago. The haplotype network showed low divergence among
most of the haplotypes except for the CCA2.1 haplotype which differed for more than 30
point mutations from the other haplotypes (Figure 2). Interestingly, this haplotype was
not equally distributed over all islands, but was more specific to S. Vicente (Table 3,
Figure 3). Going into more detail, we found that the presence of this haplotype was not
only more specific to this island, but that within the island all samples with this
haplotype had been collected from one beach (Lazareto beach, Figure 3). Due to the
very low turtle abundance on this beach we were only able to collect eight samples, but
seven of those harbored this haplotype.
Chapter I - Results
18
Figure 2: Haplotype network based on the mitochondrial control region. Pie graphs represent one haplotype and the colors represent the sampled islands. The size of each pie graph is correlated to the total number of individuals included in the haplotype. Numbers in red indicate location of point mutation. Note that CCA2.1 Haplotype distance was modified for representation convenience.
Figure 3: Haplotype diversity map of the four sampled islands, where S. Vicente is split into the two sampled beaches. The CCA1.3 (black) haplotype is the most dominant haplotype on all islands.

Chapter I - Results
19
Although all populations shared the CCA1.3 haplotype (Figure 3), pairwise genetic
distances (Fst) showed significant differences between the islands that were
geographically furthest away (Table 4).
Table 4: Pairwise Fst values (above diagonal) and the corresponding p values (below diagonal) across the islands (*indicates statistical significance after Bonferroni correction for multiple testing).
p\FST Boavista Sal S. Nicolau S. Vicente
Boavista - 0.011 0.000 0.205
Sal 0.297 - 0.000 0.102
S. Nicolau 0.648 0.819 - 0.133
S. Vicente 0.009* 0.009* 0.0180 -
To account for potential over-representation of the CC2.1 haplotype in S. Vicente, we
split the populations from this island into the sampled beaches and found that the
observed structure arose solely from the turtles that had nested on Lazareto beach
(Table 5). Here, Fst values were very high and, interestingly, high genetic differentiation
was observed even between the two nearest beaches on S. Vicente. Additionally, a
mantel test conducted on 5 populations (with S. Vicente split into the two beaches)
confirmed that there was no correlation between genetic distance (Fst) and geographic
distance based on mtDNA.
Table 5: Pairwise Fst values (above diagonal) and the corresponding p values (below diagonal) across the islands, with S. Vicente split into the two sampled beaches (*indicates statistical significance after Bonferroni correction for multiple testing).
p\FST Boavista Sal S. Nicolau SV- N. de Bahia SV - Lazareto
Boavista - 0.011 0.000 0.011 0.899
Sal 0.288 - 0.000 0.019 0.770
S. Nicolau 0.693 0.765 - 0.013 0.821
SV- N. de Bahia 0.333 0.261 0.117 - 0.897
SV - Lazareto 0.000* 0.000* 0.000* 0.000* -
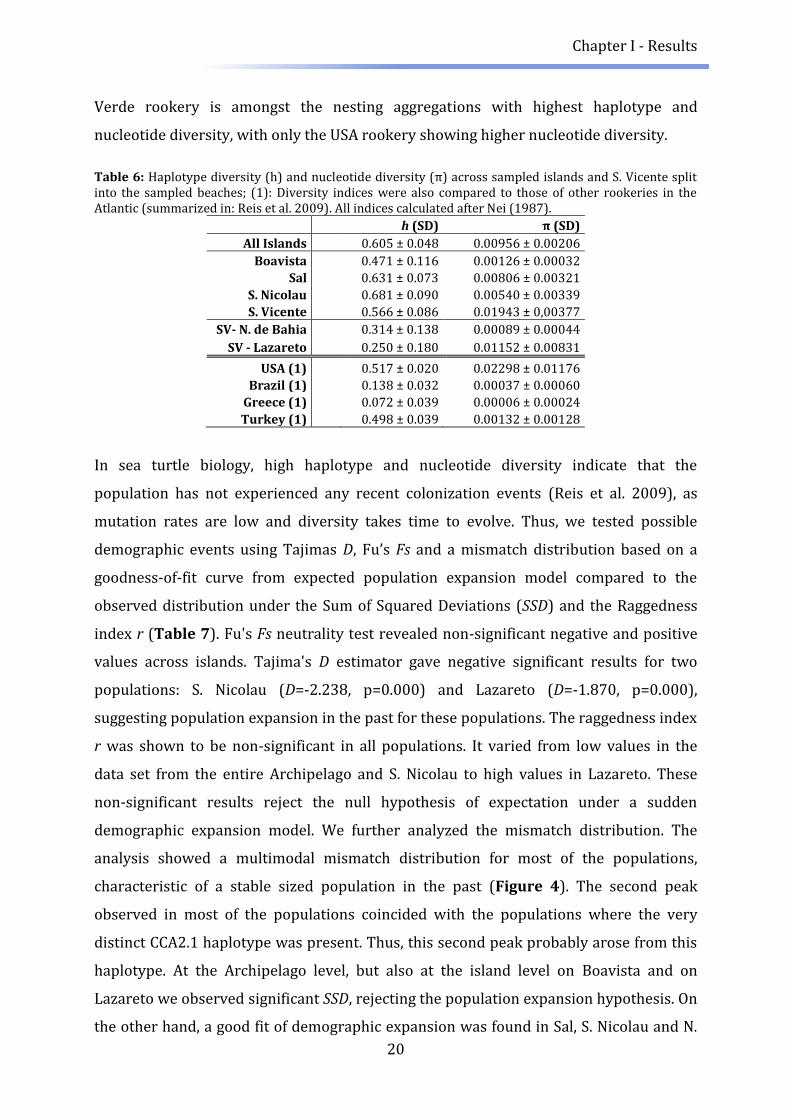
Both haplotype diversity (h) and nucleotide diversity (π) showed large variation with
the lowest haplotype diversity h and nucleotide diversity π observed on the islands with
the largest nesting colony (Boavista) (Table 6). When splitting the island of S. Vicente
both beaches showed low haplotype diversity, however, sample size was low in Lazareto
(N=8), but rather high in Praia Norte de Bahia (N=16). Nucleotide diversity seemed low
in P. Norte de Bahia, while Lazareto showed very high nuclear diversity, probably due to
the presence of the very divergent haplotype CCA2.1. Comparing these standard
diversity indices with those from other Atlantic populations revealed that the Cape
Chapter I - Results
20
Verde rookery is amongst the nesting aggregations with highest haplotype and
nucleotide diversity, with only the USA rookery showing higher nucleotide diversity.
Table 6: Haplotype diversity (h) and nucleotide diversity (π) across sampled islands and S. Vicente split into the sampled beaches; (1): Diversity indices were also compared to those of other rookeries in the Atlantic (summarized in: Reis et al. 2009). All indices calculated after Nei (1987).
h (SD) π (SD)
All Islands 0.605 ± 0.048 0.00956 ± 0.00206
Boavista 0.471 ± 0.116 0.00126 ± 0.00032
Sal 0.631 ± 0.073 0.00806 ± 0.00321
S. Nicolau 0.681 ± 0.090 0.00540 ± 0.00339
S. Vicente 0.566 ± 0.086 0.01943 ± 0,00377
SV- N. de Bahia 0.314 ± 0.138 0.00089 ± 0.00044
SV - Lazareto 0.250 ± 0.180 0.01152 ± 0.00831
USA (1) 0.517 ± 0.020 0.02298 ± 0.01176
Brazil (1) 0.138 ± 0.032 0.00037 ± 0.00060
Greece (1) 0.072 ± 0.039 0.00006 ± 0.00024
Turkey (1) 0.498 ± 0.039 0.00132 ± 0.00128
In sea turtle biology, high haplotype and nucleotide diversity indicate that the
population has not experienced any recent colonization events (Reis et al. 2009), as
mutation rates are low and diversity takes time to evolve. Thus, we tested possible
demographic events using Tajimas D, Fu’s Fs and a mismatch distribution based on a
goodness-of-fit curve from expected population expansion model compared to the
observed distribution under the Sum of Squared Deviations (SSD) and the Raggedness
index r (Table 7). Fu's Fs neutrality test revealed non-significant negative and positive
values across islands. Tajima's D estimator gave negative significant results for two
populations: S. Nicolau (D=-2.238, p=0.000) and Lazareto (D=-1.870, p=0.000),
suggesting population expansion in the past for these populations. The raggedness index
r was shown to be non-significant in all populations. It varied from low values in the
data set from the entire Archipelago and S. Nicolau to high values in Lazareto. These
non-significant results reject the null hypothesis of expectation under a sudden
demographic expansion model. We further analyzed the mismatch distribution. The
analysis showed a multimodal mismatch distribution for most of the populations,
characteristic of a stable sized population in the past (Figure 4). The second peak
observed in most of the populations coincided with the populations where the very
distinct CCA2.1 haplotype was present. Thus, this second peak probably arose from this
haplotype. At the Archipelago level, but also at the island level on Boavista and on
Lazareto we observed significant SSD, rejecting the population expansion hypothesis. On
the other hand, a good fit of demographic expansion was found in Sal, S. Nicolau and N.

Chapter I - Results
21
de Bahia. This was shown by non-significant SSD values, even though the distinct second
peak was observed in Sal and S. Nicolau.
Table 7: Tajimas D, Fu’s Fs, the Raggedness index r and SSD with the corresponding p-values. Values in bold denote statistical significance.
Fu's Fs p Tajima's D p r p SSD p
All Islands 4.213 0.900 -1.350 0.051 0.073 1.000 0.458 0.000
Boavista -0.187 0.400 0.223 0.620 0.261 0.96 0.032 0.000
Sal 6.147 0.980 -1.110 0.110 0.116 0.63 0.034 0.460
S. Nicolau 2.204 0.850 -2.238 0.000 0.041 0.88 0.086 0.710
S. Vicente 13.492 1.000 1.782 0.910 0.359 0.17 0.169 0.090
SV- N. de Bahia -1.116 0.086 -1.347 0.090 0.348 0.54 0.019 0.038
SV - Lazareto 8.918 0.990 -1.870 0.000 0.688 0.69 0.089 0.040

Chapter I - Results
22
Figure 4: Mismatch distribution for mtDNA; S. Vicente is split in the two sampled islands; * denotes rejection of population expansion model by significant SSD value; Scales are not uniform across all graphs.
All Islands * Boavista *
Sal S. Nicolau
S. Vicente - N. de Bahia -
S. Vicente - Lazareto -*

Chapter I - Results
23
Mitochondrial DNA signal reduced to a beach level
As shown by the population of Lazareto, significant evolutionary units can be found at
the beach level. Therefore, we conducted identical tests reducing the geographical scale.
We conducted pairwise Fst tests for all beaches from which more than four turtles were
sampled (Table 9). After Bonferroni correction for multiple testing, the results showed
that the turtles from Lazareto beach were almost exclusively genetically differentiated
from the other turtles nesting on different beaches. The only other significant difference
was found between the northern beaches of Sal and the turtles sampled in Ponta
Pesqueira (Boavista).
In order to get a better understanding of past demographical events within one island,
we computed Tajimas D, Fu’s Fs, the Raggedness index r and SSD on a beach level (Table
8). In most cases, the indices did not give significant values or provide uniform
conclusions. In the case of Carrical beach (on S. Nicolau Island), a significant negative D
value, low r and a no rejection of the SSD population expansion model gave strong
indications of a population expansion.
Table 8: Tajimas D, Fu’s Fs, the Raggedness index r and SSD with the corresponding p-values. Values in bold denote statistical significance. BV: Boavista; SL: Sal; SN: S. Nicolau; SV: S. Vicente.
N Fu's Fs p Tajima's D p r p SSD p
Algodoeiro (SL) 7 0.668 0.809 0.750 0.820 0.210 0.520 0.050 0.240
Carrical (SN) 18 3.430 0.930 -2.113 0.003 0.042 0.920 0.013 0.660
Costa Fragata (SL) 15 -0.579 0.320 0.009 0.520 0.035 0.980 0.007 0.700
La Cacao (BV) 4 1.761 0.753 -0.754 0.235 0.750 0.410 0.256 0.130
Lazareto (SV) 8 8.918 0.99 -1.870 0.000 0.688 0.690 0.089 0.040
Ponta Pesqueira (BV) 16 0.325 0.491 0.519 0.716 0.322 0.970 0.286 0.000
Porto da Lapa (SN) 5 -0.829 0.089 -0.972 0.181 0.350 0.470 0.065 0.220
Norte de Bahia (SV) 18 -1.116 0.086 -1.347 0.090 0.348 0.540 0.019 0.038
Sal north. beaches (SL) 4 7.740 0.999 2.300 0.970 1.000 0.240 0.487 0.000
Serra Negra (SL) 14 4.546 0.976 -2.270 0.000 0.230 0.960 0.318 0.000
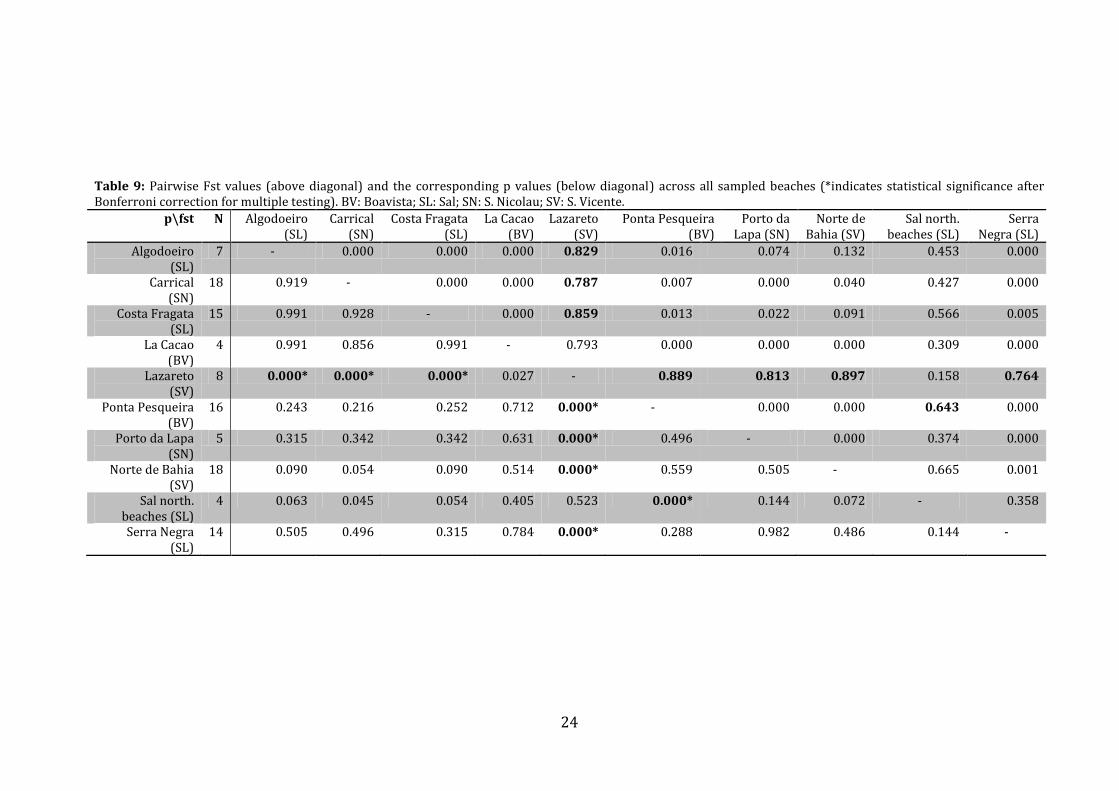
24
Table 9: Pairwise Fst values (above diagonal) and the corresponding p values (below diagonal) across all sampled beaches (*indicates statistical significance after Bonferroni correction for multiple testing). BV: Boavista; SL: Sal; SN: S. Nicolau; SV: S. Vicente.
p\fst N Algodoeiro (SL)
Carrical (SN)
Costa Fragata (SL)
La Cacao (BV)
Lazareto (SV)
Ponta Pesqueira (BV)
Porto da Lapa (SN)
Norte de Bahia (SV)
Sal north. beaches (SL)
Serra Negra (SL)
Algodoeiro (SL)
7 - 0.000 0.000 0.000 0.829 0.016 0.074 0.132 0.453 0.000
Carrical (SN)
18 0.919 - 0.000 0.000 0.787 0.007 0.000 0.040 0.427 0.000
Costa Fragata (SL)
15 0.991 0.928 - 0.000 0.859 0.013 0.022 0.091 0.566 0.005
La Cacao (BV)
4 0.991 0.856 0.991 - 0.793 0.000 0.000 0.000 0.309 0.000
Lazareto (SV)
8 0.000* 0.000* 0.000* 0.027 - 0.889 0.813 0.897 0.158 0.764
Ponta Pesqueira (BV)
16 0.243 0.216 0.252 0.712 0.000* - 0.000 0.000 0.643 0.000
Porto da Lapa (SN)
5 0.315 0.342 0.342 0.631 0.000* 0.496 - 0.000 0.374 0.000
Norte de Bahia (SV)
18 0.090 0.054 0.090 0.514 0.000* 0.559 0.505 - 0.665 0.001
Sal north. beaches (SL)
4 0.063 0.045 0.054 0.405 0.523 0.000* 0.144 0.072 - 0.358
Serra Negra (SL)
14 0.505 0.496 0.315 0.784 0.000* 0.288 0.982 0.486 0.144 -

Chapter I - Results
25
Mitochondrial DNA - Signal over different nesting seasons
The first study published using neutral DNA markers to address population structure of
the loggerhead turtle in Cape Verde was from the 2004 and 2005 nesting season
(Monzón-Argüello et al. 2010). Two of the islands sampled in those seasons (Boavista
and Sal), were also sampled in our study. We tested for significant genetic differentiation
based on mtDNA haplotypes in the overlapping sampled islands, but found no significant
differences (Table 10), confirming the Cape Verde rookery as a philopatric unit.
Table 10: Pairwise Fst values (above diagonal) and the corresponding p values (below diagonal) comparing two nesting seasons on two different islands (* indicates statistical significance after Bonferroni correction for multiple testing). (1): present study; (2): Monzón-Argüello et al., 2010. The samples collected in the 2004 and 2005 nesting season were pooled by the authors and are entitled 2005 in the table.
p\Fst N Sal 2010 (1) Sal 2005 (2) Boavista 2010 (1) Boavista 2005 (2)
Sal 2010 (1) 50 - 0.000 0.000 0.041
Sal 2005 (2) 47 0.693 - 0.000 0.012
Boavista 2010 (1) 33 0.955 0.918 - 0.024
Boavista 2005 (2) 50 0.108 0.153 0.135 -
Microsatellite Markers
Microsatellite Markers - Island level
We successfully amplified 8 loci from 111 turtles and none of the microsatellites across
populations deviated consistently from the Hardy-Weinberg-Equilibrium (HWE). Failed
genotyping arose mainly from degraded DNA of dead turtles. Individual heterozygosity
(Coulson Index, CI), observed heterozygosity (Ho) and expected heterozygosity (He) are
given in (Table 11). All of them showed identical levels across the islands (Coulson
Index, Kruskal-Wallis chi-squared = 0.5225, p= 0.914).
Table 11: Sample sizes, observed heterozygosity (Ho), expected heterozygosity (He) and the Coulson Index (CI) over the four sampled islands with S. Vicente split into two sampled beaches. Standard deviations are given between parentheses.
N Ho He CI
All samples 111 0.744 (0.170) 0.746 (0.140) 0.735 (0.136)
Boavista 21 0.779 (0.118) 0.749 (0.135) 0.767 (0.144)
Sal 40 0.722 (0.161) 0.737 (0.147) 0.725 (0.146)
S. Nicolau 24 0.739 (0.209) 0.736 (0.147) 0.736 (0.151)
S. Vicente 26 0.738 (0.198) 0.766 (0.114) 0.728 (0.136)
SV- N. de Bahia 18 0.737 (0.198) 0.766 (0.114) 0.729 (0.098)
SV- Lazareto 8 0.763 (0.215) 0.671 (0.140) 0.734 (0.104)

Chapter I - Results
26
Genetic distances were visualized through a 3-D factorial component analysis (AFC,
Figure 5). The turtles sampled on the different islands do overlap, but interestingly, the
pattern observed on microsatellites is similar to the geographic map of the sampled
islands (compare to map: Figure 1). The turtles from Sal were located towards the top
half (north), the Boavista turtles towards the right corner (east), S. Nicolau in the middle
and S. Vicente towards to the left (west).
Figure 5: AFC plot of microsatellite data. Each dot represents one turtle and the colors the different islands. Circles illustrate main clustering of the different islands. Values between parentheses represent the variance explained by each axis.
This pattern suggests reproductive isolation, which was tested statistically by pairwise
Fst values (Table12). In general, the Fst values were very low and after Bonferroni
correction only the islands furthest away, S. Vicente and Boavista, remained significantly
different. To correlate the geographic distance between each island and the Fst’s, a
mantel test was performed and proved to be highly significant (p=0.000), suggesting
reproductive isolation by distance. To further understand this pattern, we split the
island of S. Vicente into the two sampled beaches and conducted further pairwise Fst
tests (Table 12). As with the mtDNA differentiation, the microsatellite genetic
divergence seemed to come solely from the Lazareto beach and not from the entire

Chapter I - Results
27
island. The mantel test was repeated with the five populations and no significant
correlation could be found anymore (p=0.09).
Table 12: Pairwise Fst values (above diagonal) and the corresponding p values (below diagonal) across the islands, with S. Vicente split into the two sampled beaches (*indicates statistical significance after Bonferroni correction for multiple testing).
p\FST Boavista Sal S. Nicolau S. Vicente SV- N. de Bahia SV - Lazareto
Boavista - 0.0000 0.0036 0.0249 0.0034 0.1185
Sal 0.7658 - 0.0000 0.0095 0.0000 0.0898
S. Nicolau 0.1802 0.7838 - 0.0090 0.0000 0.0858
S. Vicente 0.0000 0.0270 0.0270 -
SV- N. de Bahia 0.2342 0.6036 0.6126 - 0.0694
SV - Lazareto 0.0000* 0.0000* 0.000* 0.000* -
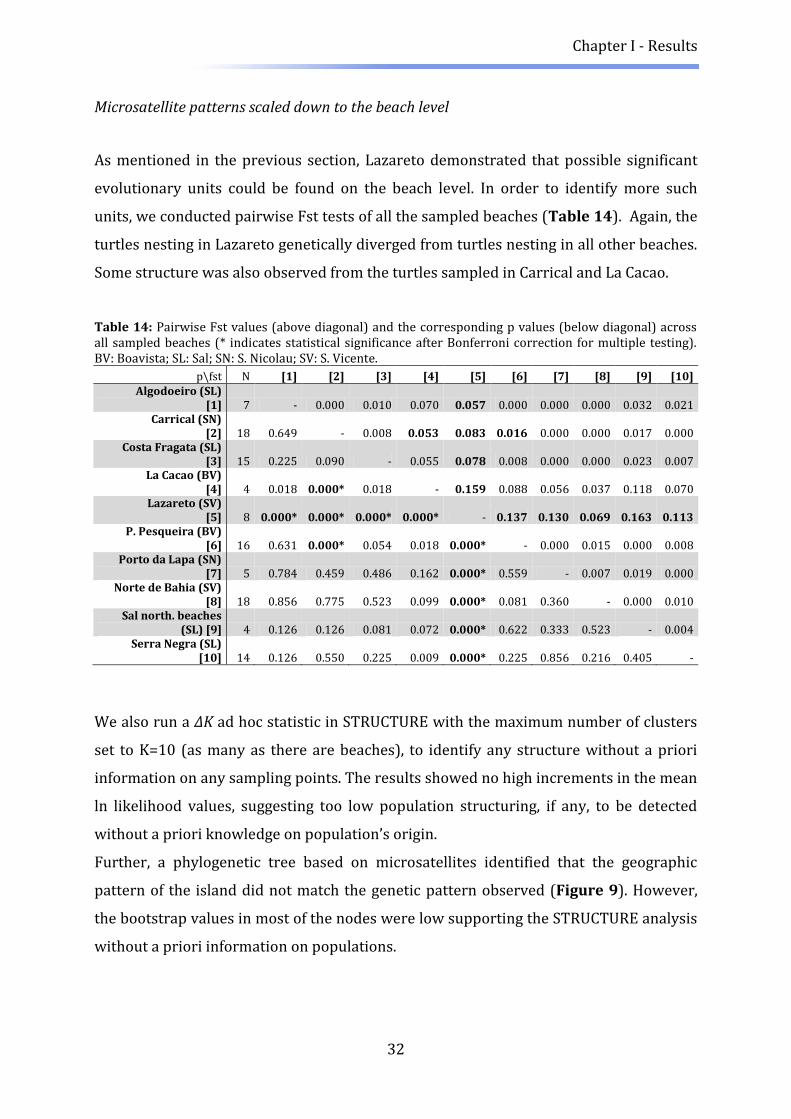
The ΔK ad hoc statistic of the STRUCTURE analysis revealed no obvious grouping. The
increment was very low in all clusters (K=1, mean ln likelihood= -3008.61, SD= 1.03;
K=2, mean ln likelihood= -2989.68, SD= 9.71; K=3, mean ln likelihood= -3038.68, SD=
111.71; K=4, mean ln likelihood= -3010.25, SD= 123.03; K=5, mean ln likelihood= -
2974.46, SD= 55.04). The highest increment was for K=2, but still very low and no
conclusions on genetic structure based on islands, beaches or haplotypes could be
drawn.
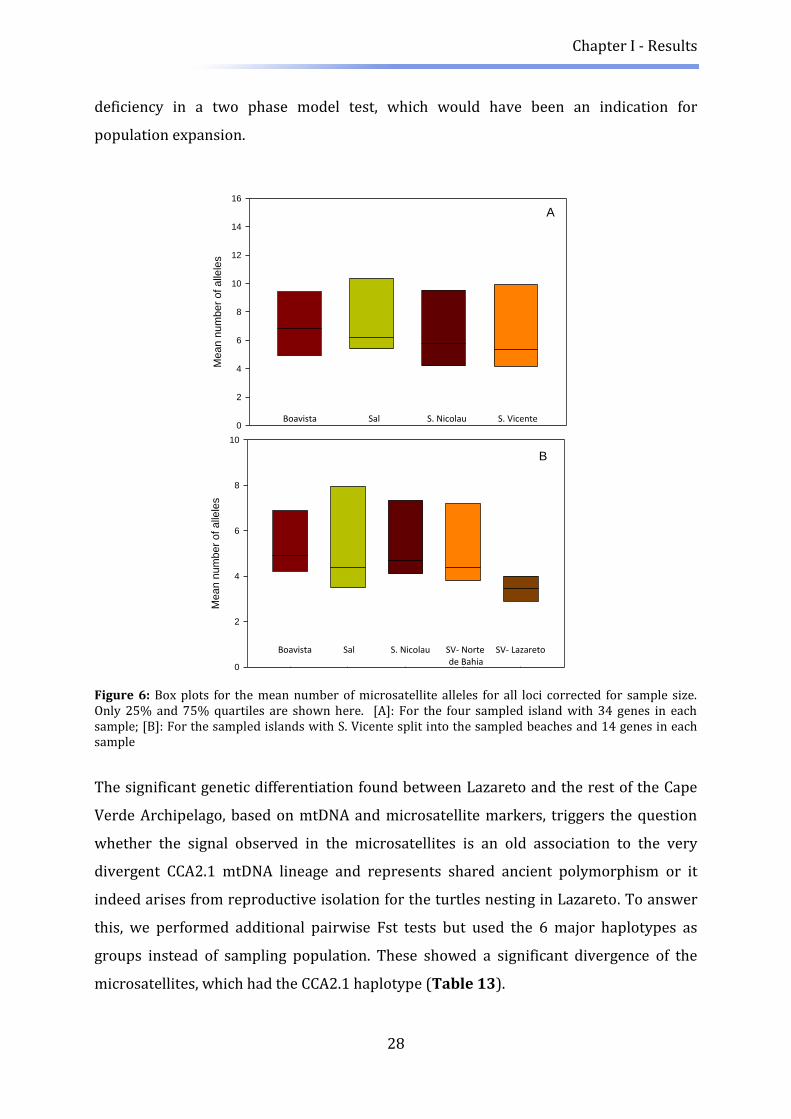
Variation in mean number of alleles per microsatellite locus across the four sampled
islands was small after correction for unequal sample sizes (Figure 6, A). When splitting
S. Vicente into the sampled beaches, a decrease, though not significant (Kruskal-Wallis
chi-squared = 7.3324, p-value = 0.1193), was observed in the mean number of alleles in
the box plot (Figure 6, B). This apparent reduced number of alleles from the Lazareto
beach could be a sign of a recent bottleneck effect. This was tested in a two phase model
Wilcoxon test for heterozygote excess based on mutation-drift equilibrium. All sampled
islands together showed no signs of heterozygote excess (p=0.67). At a smaller scale,
the islands of Boavista (p=0.769), Sal (p=0.902) and S. Nicolau (p=0.156) showed no
possible recent bottlenecks, whereas S. Vicente (p=0.003) was highly significant after
Bonferroni correction. When testing in S. Vicente on a beach scale, both nesting beaches
showed significant results (Lazareto p=0.019, Norte de Bahia p=0.001). The modal shift
in allele frequency classes expected from past population reductions was neither
present in the whole island of S. Vicente, nor on the N. de Bahia beach. While it was
present the in Lazareto beach, the results should be interpreted carefully as sample size
was relatively low (N=8). None of the islands showed any signs of heterozygote
Chapter I - Results
28
deficiency in a two phase model test, which would have been an indication for
population expansion.
A
Mea
n n
um
be
r o
f a
llele
s
0
2
4
6
8
10
12
14
16
Boavista Sal S. Nicolau S. Vicente
AM
ea
n n
um
be
r o
f a
llele
s
0
2
4
6
8
10
B
Boavista Sal S. Nicolau SV- Norte SV- Lazareto de Bahia
Figure 6: Box plots for the mean number of microsatellite alleles for all loci corrected for sample size. Only 25% and 75% quartiles are shown here. [A]: For the four sampled island with 34 genes in each sample; [B]: For the sampled islands with S. Vicente split into the sampled beaches and 14 genes in each sample
The significant genetic differentiation found between Lazareto and the rest of the Cape
Verde Archipelago, based on mtDNA and microsatellite markers, triggers the question
whether the signal observed in the microsatellites is an old association to the very
divergent CCA2.1 mtDNA lineage and represents shared ancient polymorphism or it
indeed arises from reproductive isolation for the turtles nesting in Lazareto. To answer
this, we performed additional pairwise Fst tests but used the 6 major haplotypes as
groups instead of sampling population. These showed a significant divergence of the
microsatellites, which had the CCA2.1 haplotype (Table 13).

Chapter I - Results
29
Table 13: Pairwise Fst values (above diagonal) and the corresponding p values (below diagonal) based on the six major haplotypes (*indicates statistical significance after Bonferroni correction for multiple testing).
p\Fst CCA1.3 CCA1.4 CCA11.2 CCA17.1 CCA17.2 CCA2.1
CCA1.3 - 0.000 0.027 0.008 0.003 0.049
CCA1.4 0.892 - 0.041 0.000 0.000 0.051
CCA11.2 0.063 0.018 - 0.018 0.000 0.086
CCA17.1 0.063 0.441 0.306 - 0.000 0.053
CCA17.2 0.315 0.514 0.568 0.874 - 0.042
CCA2.1 0.000* 0.027 0.126 0.000* 0.027 -
Further, an AFC microsatellite plot based on the different haplotypes was created
(Figure 7). Almost all of the microsatellites from the CCA2.1 haplotype grouped into one
big cluster. In this cluster all turtles from Lazareto with this haplotype and one turtle
from Sal (also with CCA2.1 haplotype) were found. The other turtles with this haplotype,
not clustering within the main group, came from turtles sampled on other islands. The
only turtle from Lazareto beach missing the CCA2.1 haplotype did not cluster with the
other Lazareto turtles, either.
Figure 7: AFC plot of microsatellite markers based mtDNA haplotypes. Values between parentheses represent the variance explained by each axis. Green circles: Haplotype CCA2.1 turtles; Yellow circle: Turtle with CCA2.1 haplotype but sampled in Sal, not in Lazareto like all other turtles in this grouping; Red circle: Only other turtle sampled in Lazareto, with different haplotype though.

Chapter I - Results
30
For better characterization of the pattern observed in the AFC haplotype plot (Figure 7),
the STRUCTURE software was used in an unconventional way, so that the results have to
be interpreted carefully but may provide relevant information. We ran a STRUCTURE
analysis with the same number of K as there are haplotypes (eight) and let the software
sort the microsatellites by these haplotypes (Figure 8). At K= 8, one group seemed to
always cluster apart: This group was always found within the CCA2.1 haplotype and is
graphically illustrated by yellow bars (group5 in Figure 8). Seven of the eight yellow
bars accounted for the beach on Lazareto and the other yellow bar came from one
sample on Sal. The other three turtles with this haplotype (5), coming from the islands of
Sal and S. Nicolau, did not cluster into this group and seem to have had a very different
set of microsatellites. As already observed in the AFC plot, the one turtle from Lazareto
(43(1)) seemed to have a very different set of microsatellites than the other turtles from
this beach.

31
Figure 8: Structure plot computed with eight clusters and sorted after haplotypes. Numbers represent each individual and the numbers between parentheses stand for the Haplotype: (1): CCA1.3; (2): CCA1.4; (3): CCA17.1; (4): CCA17.2; (5): CCA2.1; (6): NDH1; (7): CCA11.2; (8): NDH2
Chapter I - Results
32
Microsatellite patterns scaled down to the beach level
As mentioned in the previous section, Lazareto demonstrated that possible significant
evolutionary units could be found on the beach level. In order to identify more such
units, we conducted pairwise Fst tests of all the sampled beaches (Table 14). Again, the
turtles nesting in Lazareto genetically diverged from turtles nesting in all other beaches.
Some structure was also observed from the turtles sampled in Carrical and La Cacao.
Table 14: Pairwise Fst values (above diagonal) and the corresponding p values (below diagonal) across all sampled beaches (* indicates statistical significance after Bonferroni correction for multiple testing). BV: Boavista; SL: Sal; SN: S. Nicolau; SV: S. Vicente.
p\fst N [1] [2] [3] [4] [5] [6] [7] [8] [9] [10] Algodoeiro (SL)
[1] 7 - 0.000 0.010 0.070 0.057 0.000 0.000 0.000 0.032 0.021 Carrical (SN)
[2] 18 0.649 - 0.008 0.053 0.083 0.016 0.000 0.000 0.017 0.000 Costa Fragata (SL)
[3] 15 0.225 0.090 - 0.055 0.078 0.008 0.000 0.000 0.023 0.007 La Cacao (BV)
[4] 4 0.018 0.000* 0.018 - 0.159 0.088 0.056 0.037 0.118 0.070 Lazareto (SV)
[5] 8 0.000* 0.000* 0.000* 0.000* - 0.137 0.130 0.069 0.163 0.113 P. Pesqueira (BV)
[6] 16 0.631 0.000* 0.054 0.018 0.000* - 0.000 0.015 0.000 0.008 Porto da Lapa (SN)
[7] 5 0.784 0.459 0.486 0.162 0.000* 0.559 - 0.007 0.019 0.000 Norte de Bahia (SV)
[8] 18 0.856 0.775 0.523 0.099 0.000* 0.081 0.360 - 0.000 0.010 Sal north. beaches
(SL) [9] 4 0.126 0.126 0.081 0.072 0.000* 0.622 0.333 0.523 - 0.004 Serra Negra (SL)
[10] 14 0.126 0.550 0.225 0.009 0.000* 0.225 0.856 0.216 0.405 -
We also run a ΔK ad hoc statistic in STRUCTURE with the maximum number of clusters
set to K=10 (as many as there are beaches), to identify any structure without a priori
information on any sampling points. The results showed no high increments in the mean
ln likelihood values, suggesting too low population structuring, if any, to be detected
without a priori knowledge on population’s origin.
Further, a phylogenetic tree based on microsatellites identified that the geographic
pattern of the island did not match the genetic pattern observed (Figure 9). However,
the bootstrap values in most of the nodes were low supporting the STRUCTURE analysis
without a priori information on populations.

Chapter I - Results
33
Figure 9: Microsatellite phylogenetic tree (based on Scorza-Cavalli distance) of the turtles nesting on the different beaches. Numbers on nodes represent bootstrap values in percent. BV: Boavista; SL: Sal; SN: S. Nicolau; SV: S. Vicente.
A two phase model Wilcoxon test for heterozygote excess based on mutation-drift
equilibrium revealed indications of population expansion on the beach of Ponta
Pesqueira in Boavista (p=0.019), which has very high nesting frequencies, nowadays. On
the other hand, recent bottleneck events were found as already mentioned in the
beaches of Lazareto and N. de Bahia in S. Vicente. Additionally, a possible bottleneck
event was found on the beach of Algodoeiro in Sal, showing a significant heterozygote
excess (p=0.003) and a modal shift in allele frequencies. However, sample size on that
beach (N=7) was lower than the suggested 10 samples by the software bottleneck,
suggesting caution be taken in interpretation.
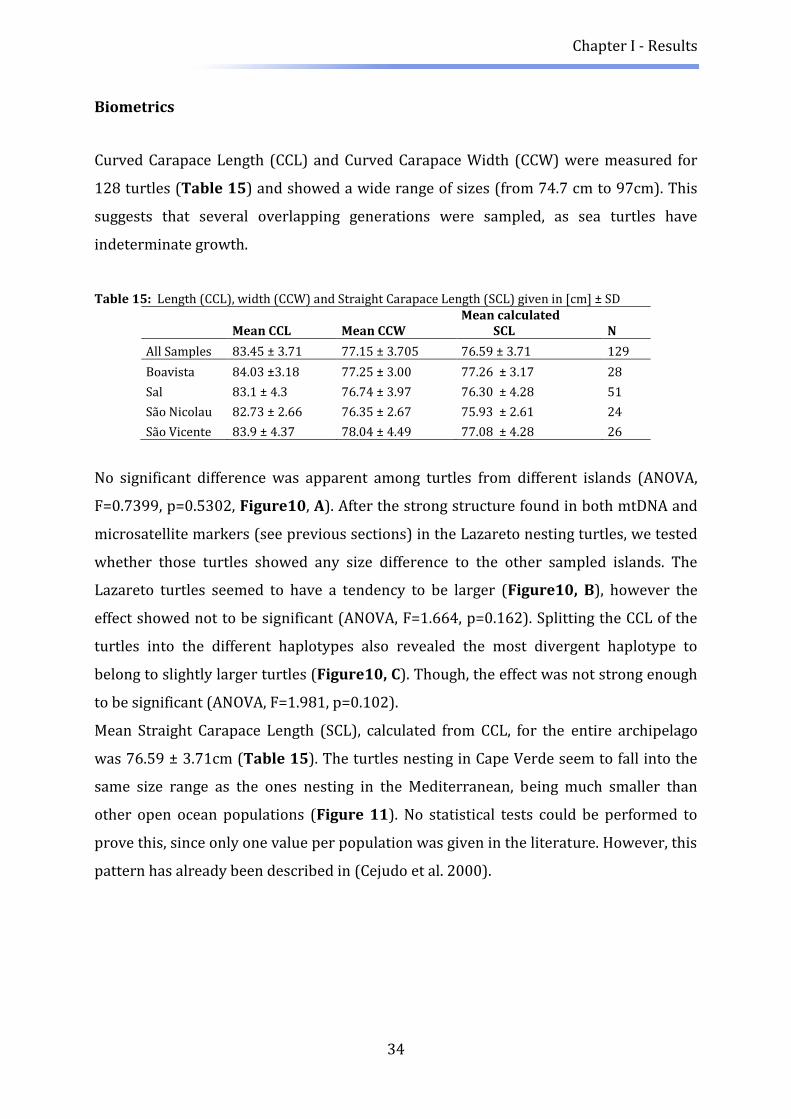
Chapter I - Results
34
Biometrics
Curved Carapace Length (CCL) and Curved Carapace Width (CCW) were measured for
128 turtles (Table 15) and showed a wide range of sizes (from 74.7 cm to 97cm). This
suggests that several overlapping generations were sampled, as sea turtles have
indeterminate growth.
Table 15: Length (CCL), width (CCW) and Straight Carapace Length (SCL) given in [cm] ± SD
Mean CCL Mean CCW Mean calculated SCL N
All Samples 83.45 ± 3.71 77.15 ± 3.705 76.59 ± 3.71 129
Boavista 84.03 ±3.18 77.25 ± 3.00 77.26 ± 3.17 28
Sal 83.1 ± 4.3 76.74 ± 3.97 76.30 ± 4.28 51
São Nicolau 82.73 ± 2.66 76.35 ± 2.67 75.93 ± 2.61 24
São Vicente 83.9 ± 4.37 78.04 ± 4.49 77.08 ± 4.28 26
No significant difference was apparent among turtles from different islands (ANOVA,
F=0.7399, p=0.5302, Figure10, A). After the strong structure found in both mtDNA and
microsatellite markers (see previous sections) in the Lazareto nesting turtles, we tested
whether those turtles showed any size difference to the other sampled islands. The
Lazareto turtles seemed to have a tendency to be larger (Figure10, B), however the
effect showed not to be significant (ANOVA, F=1.664, p=0.162). Splitting the CCL of the
turtles into the different haplotypes also revealed the most divergent haplotype to
belong to slightly larger turtles (Figure10, C). Though, the effect was not strong enough
to be significant (ANOVA, F=1.981, p=0.102).
Mean Straight Carapace Length (SCL), calculated from CCL, for the entire archipelago
was 76.59 ± 3.71cm (Table 15). The turtles nesting in Cape Verde seem to fall into the
same size range as the ones nesting in the Mediterranean, being much smaller than
other open ocean populations (Figure 11). No statistical tests could be performed to
prove this, since only one value per population was given in the literature. However, this
pattern has already been described in (Cejudo et al. 2000).
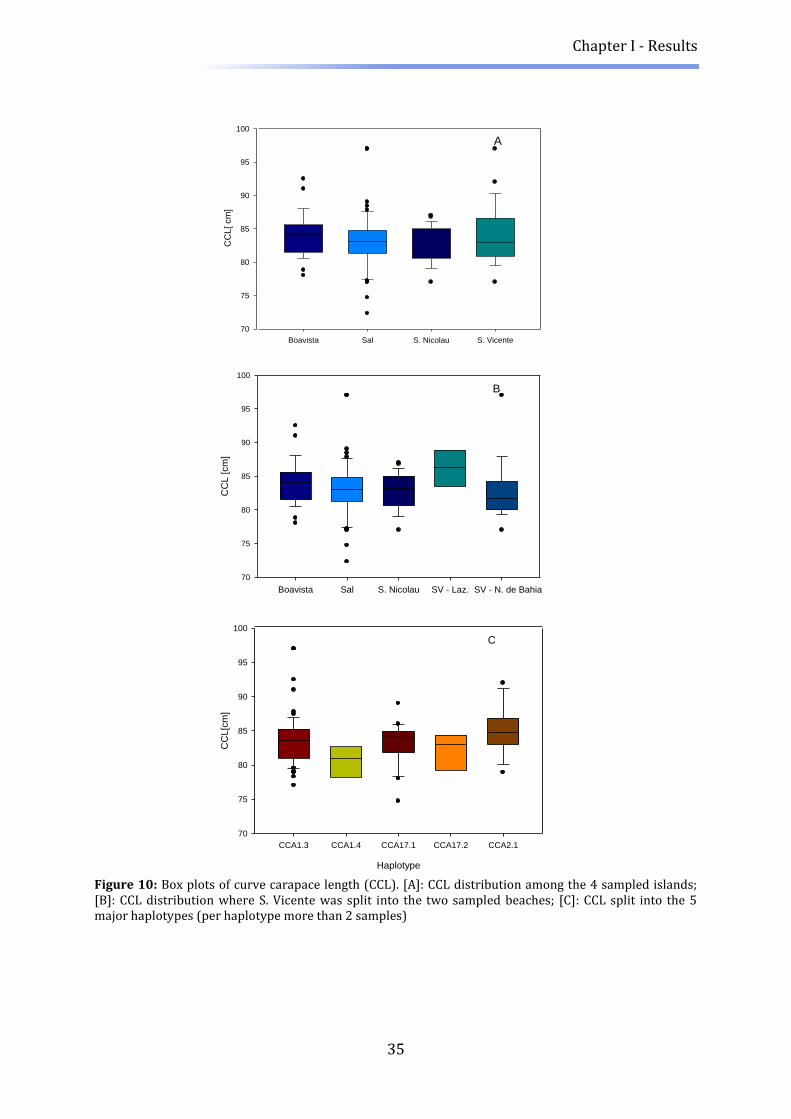
Chapter I - Results
35
A
Boavista Sal S. Nicolau S. Vicente
CC
L[
cm
]
70
75
80
85
90
95
100
B
Boavista Sal S. Nicolau SV - Laz. SV - N. de Bahia
CC
L [
cm
]
70
75
80
85
90
95
100
C
Haplotype
CCA1.3 CCA1.4 CCA17.1 CCA17.2 CCA2.1
CC
L[c
m]
70
75
80
85
90
95
100
Figure 10: Box plots of curve carapace length (CCL). [A]: CCL distribution among the 4 sampled islands; [B]: CCL distribution where S. Vicente was split into the two sampled beaches; [C]: CCL split into the 5 major haplotypes (per haplotype more than 2 samples)

Chapter I - Results
36
Figure 11: Mean Straight Carapace Length (SCL) of nesting females compared to other rookeries. Error bars represent size range of female turtles. Florida (Gallagher et al. 1972); Cape Verde (present study); Libya (Broderick and Godley 1996); Greece (Margaritoulis et al. 2003); Cypres (Godley and Broderick 1992); Oman (Hirth and Hollingworth 1973); South Africa (Hughes 1975); Japan (Kamezaki 2003)
.
Chapter I - Discussion
37
Discussion
Demographic history
Despite representing the third largest rookery for loggerhead turtles worldwide, Cape
Verde Archipelago has received relatively little scientific attention. In our study, we
revealed the presence of eight distinct mtDNA haplotypes, including the presence of one
very divergent lineage (CCA2.1). Of those eight haplotypes, five have been described for
the Cape Verde population alone, supporting one of the highest haplotype and
nucleotide diversity of the Atlantic Ocean populations. Other populations with such high
diversity (e.g. southeastern United States population) are known to have experienced
constant population size in the past (Reis et al. 2009). In contrast, populations such as in
Greece and Brazil, which show low haplotype and nucleotide diversity, seem to have
arisen from recent colonization events (Reis et al. 2009). After colonization events,
diversity is usually low since it is generally accompanied by a population bottleneck
(“Founder effect”). Our results supported by the Sum of Squared Deviations (SSD), Fu Fs
and Tajima’s D neutrality indicators suggest that the Cape Verde loggerhead rookery
experienced no recent major demographic event.
When increasing geographical complexity and looking at the pattern of colonization
among the islands, we found that the island where 90% of the nesting occurs, Boavista,
does not show signs of recent population expansion events. Interestingly, results
suggested otherwise for other islands. For instance, S. Nicolau population showed
significantly negative D values, low non-significant r values (both signs of population
expansion), and the observed mismatch distribution fits the expected distribution on an
expansion model. All these indices suggest a past colonization event of this island. By
reducing the scale to the beach level, the data suggests that the expansion seen on this
island arose primarily from the Carrical beach. Most of the deviation from a unimodal
distribution of the mismatch analysis came from a second peak which appears from the
presence of the divergent CCA2.1 haplotypes. This fact suggests that a second lineage
has either introgressed from other rookeries by migration, explaining relatively low
frequencies (Monzón-Argüello et al. 2010), or this lineage represents a second, more
recent colonization event. By expanding previous sampling (Monzón-Argüello et al.
2010) we found this haplotype to be more prevalent than previously believed (mainly

Chapter I - Discussion
38
on Lazareto beach) and to represent a stable evolutionary unit in the Cape Verde
rookery.
The most abundant lineage (CCA1.3 and its satellite haplotypes) is mainly found in the
western Atlantic basin (Encalada et al. 1998), proposing that Cape Verde was colonized
from this rookery. The other lineage (CCA2.1), which composes 10% of the Cape Verde
rookery, is mainly found in the Mediterranean, but also in the western Atlantic
(Encalada et al. 1998). This haplotype is thought to have evolved in the Indian Ocean and
to have entered the Atlantic Ocean through South Africa (Bowen et al. 1994). Thus, the
Cape Verde could have been colonized from the western Atlantic, the Mediterranean or
directly from the Indian Ocean (following the Benguela Current) in a second wave of
colonization. Because the Mediterranean loggerhead populations arose from the
western Atlantic population (Bowen et al. 1993) about 12000 years ago, after the retreat
of the last glacial maximum, it is unlikely to have founded the Cape Verde rookery.
Additionally, such a recent colonization event would have been detected on the mtDNA
signature in the mismatch distribution or based on heterozygote excess in the two phase
model Wilcoxon test based on mutation-drift equilibrium. Instead, we propose that the
Cape Verde is a rather old rookery, which is supported by high haplotype and nucleotide
diversity indices, and propose that the Mediterranean may have also been founded from
the Cape Verde rookery, serving as stepping stone from the western Atlantic. When the
theory of colonization of the Mediterranean was postulated (Bowen et al. 1993), no
genetic information from the Cape Verde rookery was available, which may have led to
an incomplete conclusion.
Mitochondrial DNA has higher mutation rates than nuclear DNA (Haag-Liautard et al.
2008), but nuclear DNA evolves faster than the mtDNA control region, due to the
potential of recombination (Kimura 1983). Thus, demographic history on different time
scales can be obtained by using different markers. Testing nuclear microsatellites at the
rookery level, we found no signs of a recent major demographic event. By increasing
geographical complexity to the island level, we found that the islands of S. Vicente
showed a significant heterozygote excess, a sign of a recent bottleneck effect. The further
reduction of the scale to the beach level in S. Vicente revealed highly significant values,
indicating possible bottlenecks in both beaches. Furthermore, Lazareto turtles showed
the modal shift in allele frequency classes expected from past population reductions.
Additionally, Lazareto beach seemed to have a reduced number of microsatellite alleles
Chapter I - Discussion
39
when compared to other populations, reinforcing the bottleneck hypothesis on this
population. Such a demographic event would support the hypothesis of two
independent colonization waves in Cape Verde, with the second one being more recent
than the major one, as shown by CC.2.1 haplotype on Lazareto,. This further supports the
idea of a recent colonization of the Mediterranean rookery in a stepping stone model.
Philopatry and genetic structure
Although females seem to be philopatric to the rookery, two different philopatric
strategies seem to co-exist within the loggerhead turtle population in Cape Verde. On the
one hand, some turtles seem to be specific to one beach (Lazareto), while other turtles
show a less accurate philopatric behavior, nesting on several beaches either within an
island or other islands, while remaining philopatric to Cape Verde. Such a behavior has
been observed on the island of Sal, where tagging data revealed that turtles nest on
various beaches, even within one nesting season. Turtles tagged in Boavista, have also
been reported to nest in the island of Sal (Varo-Cruz 2010).
Different philopatric behavior accuracies have been observed in different turtle colonies
around the world. The northeastern United States population showed haplotype
homogeneity for over 1000 km, while in the southeastern United States population a
precision of roughly 50-100 km was estimated (reviewed in: Bowen and Karl 2007).
This difference in philopatric behavior was attributed to the fact the northern
population was more recently colonized after the last glaciation resulting in a low
variance in haplotypes distribution (reviewed in: Bowen and Karl 2007). A similar
pattern was observed in Japan (Hatase et al. 2002) and Brazil (Reis et al. 2009). Our
results suggest a different explanation, independent of demographic events, since Cape
Verde seems to be an old rookery.
First of all, since all females are philopatric to the Cape Verde rookery, they may aim to
nest on the main island of Boavista (90% of nesting) but may not succeed and spread to
other islands or beaches- leading to genetic leakage. This is supported by decreasing
nest frequency, with increasing geographic distance from Boavista and that this island is
geographically the first possible nesting opportunity turtles encounter if they come from
West African foraging grounds. Secondly, evolutionary bet hedging theory would also
predict that nesting on different beaches/islands would increase likelihood of
Chapter I - Discussion
40
contributing to the nest generation allele pool in case of major incident on one beach-
explaining potentially non site fidelity. Thirdly, local adaption theory would predict that
females would go back to their natal beach because they carry the necessary genetic
make up to survive in that environment which will be passed on to the next generation.
Eventually, philopatric behavior might be linked to mating strategies. For instance, if
both sexes are philopatric, females increase the possibility of finding a mate, a major
constraint in migratory species (Greenwood 1980).
Those remain hypotheses and are not mutually exclusive within a population. Further
work will have to identify pressure underlying the potential of co-existing philopatric
strategies to better understand female nesting behavior.
Reproductive isolation
Our mtDNA results suggest the existence of two sub-populations of loggerhead turtles in
Cape Verde. The same pattern was also seen on microsatellite markers. The Lazareto
turtles are genetically differentiated from all other sampled populations thus suggesting
partial reproductive isolation. The significant differentiation found within the island of S.
Vicente between beaches separated by only a couple of tens of kilometers, indicate that
reproductive isolation can be reduced to a surprisingly small scale. Barriers to gene flow
do not seem to arise solely from isolation by distance in Cape Verde, although it may also
contributes to the pattern as seen with the 3-D factorial component analysis plot where
individuals cluster according to their sampling origin. This could be an indication, that
mating occurs more or less specific to an island, but gene flow between islands is also
maintained by female nesting strategy, giving none significant result in the mantel test.
Sampling during mating would probably be a better indicator of barrier to gene flow
than during nesting. However this is a challenging enterprise.
Nonetheless, it is important to note that gene flow including Lazareto population seems
to be reduced with the other sampled islands/beaches and that for large migratory
marine species, signs of reduced gene-flow are scares.
Since the microsatellite pattern observed matched the mtDNA pattern it is justified to
wonder whether the signs of reduced gene flow arise from reproductive isolation or
from ancestral signal. Testing gene flow using haplotype as statistical unit rather than
nesting population in the 3-D factorial component analysis we show that the signal
Chapter I - Discussion
41
probably arises from reproduction and not from vestiges of ancestral genetic
divergence, since all but one turtle (not sampled in Lazareto) that carried the CCA2.1
haplotype showed a different microsatellite signal.
This study has shown that in sea turtle biology it is important to reduce the scale down
to a beach level to infer proper population demography and life history.
Biometrics and hatchling dispersal
The loggerhead turtles nesting in Cape Verde are smaller than those from other
populations in the Atlantic and fall into the size distribution of the Mediterranean
population (Margaritoulis et al. 2003). This pattern was already described by Cejudo et
al. (2000). The size differences between the Mediterranean and western Atlantic
populations are thought to arise from lower nutrient levels, and the implied lower
productivity of the system in the Mediterranean Sea (Tiwari and Bjorndal 2000).
Resource availability affects growth rate, maturation time, and maximum size in sea
turtles (Bjorndal 1985). Thus turtles may be responding to lower resource levels, by
maturating sooner and diverting energy from growth into reproduction, in order to
maximize lifetime reproductive success (Tiwari and Bjorndal 2000).
In Cape Verde, two post-nesting trajectories for foraging have been described using
satellite loggers, supporting the idea of two feeding habitats, an oceanic habitat, and a
neritic habitat. Based on size dichotomy, the oceanic habitat would correspond to 91%
of the turtles nesting in Cape Verde. This oceanic habitat, comprises a powerful
upwelling system, however, strong seasonal fluctuations are found in the strength of the
upwelling (Mittelstaedt 1991). The deep dives of turtles in this habitat could suggest
that loggerheads have to invest a considerable amount of energy in food allocation
(Hawkes et al. 2006), resulting in reduced growth in these turtles. The neritic feeding
ground, on the other hand, supports larger turtles (Hawkes et al. 2006). The other major
insular rookery of the loggerhead turtle in Japan also shows size dependent foraging
habitat selection, with smaller turtles foraging in the pelagic and bigger turtles along the
coasts (Hatase, et al., 2002). The authors proposed that body size is mainly determined
by growth in the immature life stage, since sea turtles grow very little after reaching
maturity (Hughes 1974). Thus, habitat selection, as a function of body size, is closely
related to the recruitment and settlement of juvenile loggerheads, after developmental

Chapter I - Discussion
42
migrations to the North Pacific, where they then grow and eventually mature in the
feeding grounds. The philopatric behavior of sea turtles to both nesting and foraging
areas would then bring them back to the feeding habitat they settled in as juveniles,
either neritic or oceanic (Hatase, et al., 2002). Such a case could also be true for the Cape
Verde turtles. It would imply that the turtles do not move from the oceanic feeding
ground to the neritic as they get older, since growth is mainly determined in the
immature phase. Hence, the feeding habitat might be related to the settlement of
juveniles and this settlement dependent upon hatchling and juvenile dispersal in very
early life stages.
We propose the following dispersal patterns, based on major ocean currents for the
Cape Verde rookery, in order to explain how they could get to the two different foraging
grounds (Figure 12). The first scenario is sufficient to explain both feeding grounds but
both are not mutually exclusive and may complement each other:
In one scenario (black line on Figure 12 ), following ocean currents, hatchlings could
enter the North Atlantic Subtropical Gyre through the Canary and the North Equatorial
Current and stay in this habitat for post hatchling development (as the North Western
Atlantic hatchlings). The Gulf Stream and North Atlantic Drift would eventually bring
them back to the eastern Atlantic basin. Juveniles from Cape Verde found in the Azores
and the Canary Islands (Monzón-Argüello et al. 2009) would support this scenario.
These juveniles might then move with the Canary Current further south and inhabit the
pelagic habitat east of Cape Verde, grow slowly and mature at a relatively small size.
Maturation and philopatry would then bring them back to this habit after every
breeding migration.
In this scenario, the juveniles could also move further down the coast (not settling in the
oceanic habitat of Senegal), eventually use the Guinea current and to enter the neritic
habitat off the coast of Sierra Leone and mature there (grey line on Figure 12).
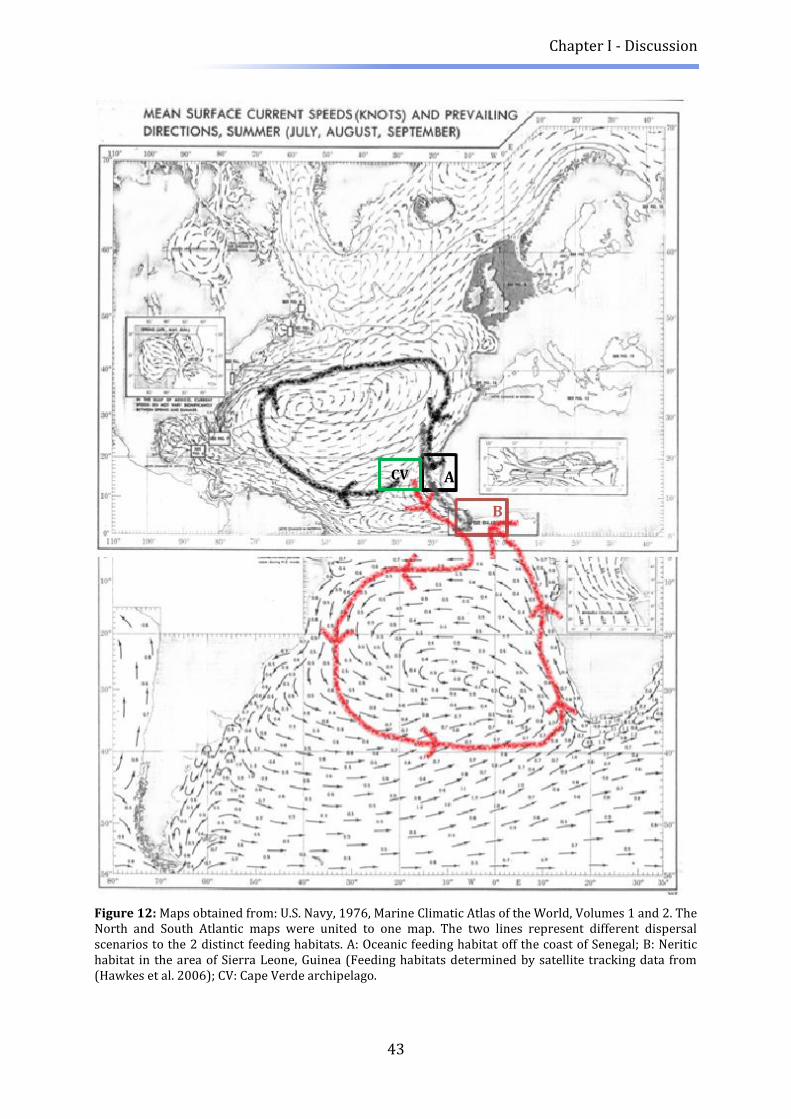
Chapter I - Discussion
43
Figure 12: Maps obtained from: U.S. Navy, 1976, Marine Climatic Atlas of the World, Volumes 1 and 2. The North and South Atlantic maps were united to one map. The two lines represent different dispersal scenarios to the 2 distinct feeding habitats. A: Oceanic feeding habitat off the coast of Senegal; B: Neritic habitat in the area of Sierra Leone, Guinea (Feeding habitats determined by satellite tracking data from (Hawkes et al. 2006); CV: Cape Verde archipelago.
A
B
CV
V
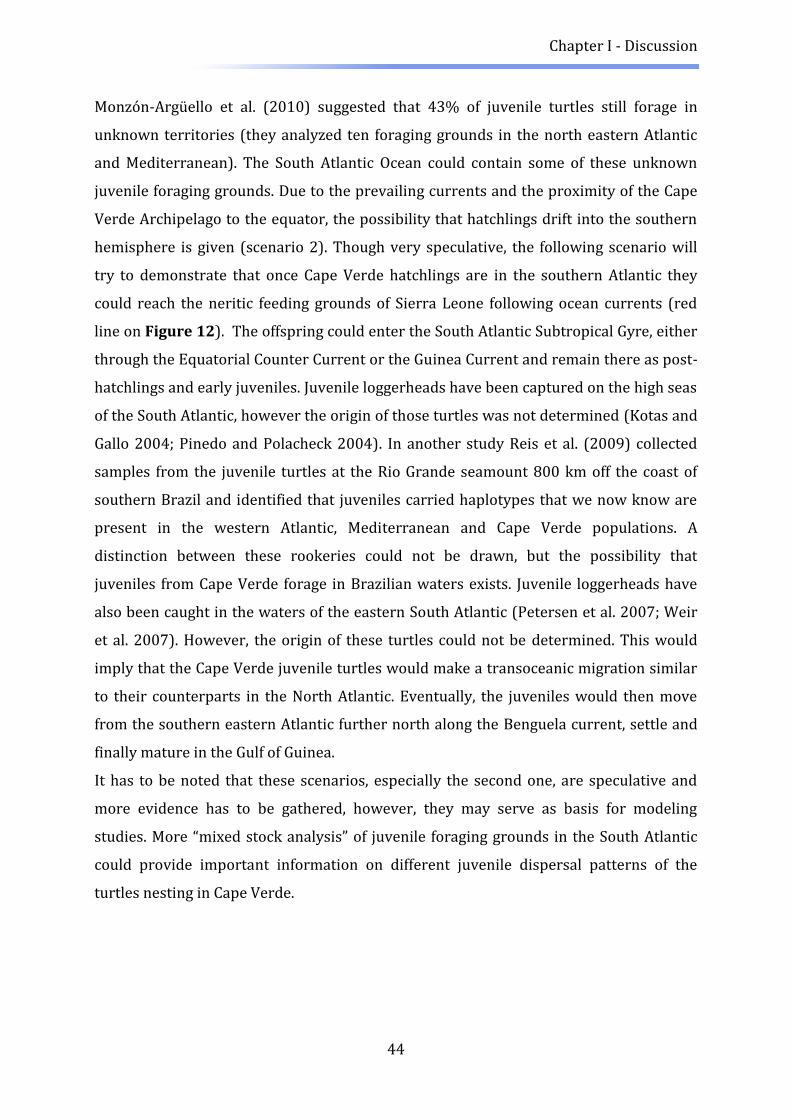
Chapter I - Discussion
44
Monzón-Argüello et al. (2010) suggested that 43% of juvenile turtles still forage in
unknown territories (they analyzed ten foraging grounds in the north eastern Atlantic
and Mediterranean). The South Atlantic Ocean could contain some of these unknown
juvenile foraging grounds. Due to the prevailing currents and the proximity of the Cape
Verde Archipelago to the equator, the possibility that hatchlings drift into the southern
hemisphere is given (scenario 2). Though very speculative, the following scenario will
try to demonstrate that once Cape Verde hatchlings are in the southern Atlantic they
could reach the neritic feeding grounds of Sierra Leone following ocean currents (red
line on Figure 12). The offspring could enter the South Atlantic Subtropical Gyre, either
through the Equatorial Counter Current or the Guinea Current and remain there as post-
hatchlings and early juveniles. Juvenile loggerheads have been captured on the high seas
of the South Atlantic, however the origin of those turtles was not determined (Kotas and
Gallo 2004; Pinedo and Polacheck 2004). In another study Reis et al. (2009) collected
samples from the juvenile turtles at the Rio Grande seamount 800 km off the coast of
southern Brazil and identified that juveniles carried haplotypes that we now know are
present in the western Atlantic, Mediterranean and Cape Verde populations. A
distinction between these rookeries could not be drawn, but the possibility that
juveniles from Cape Verde forage in Brazilian waters exists. Juvenile loggerheads have
also been caught in the waters of the eastern South Atlantic (Petersen et al. 2007; Weir
et al. 2007). However, the origin of these turtles could not be determined. This would
imply that the Cape Verde juvenile turtles would make a transoceanic migration similar
to their counterparts in the North Atlantic. Eventually, the juveniles would then move
from the southern eastern Atlantic further north along the Benguela current, settle and
finally mature in the Gulf of Guinea.
It has to be noted that these scenarios, especially the second one, are speculative and
more evidence has to be gathered, however, they may serve as basis for modeling
studies. More “mixed stock analysis” of juvenile foraging grounds in the South Atlantic
could provide important information on different juvenile dispersal patterns of the
turtles nesting in Cape Verde.

Chapter I - Discussion
45
Implications for conservation
Two distinct subpopulations have been determined in Cape Verde: One frequenting the
beaches of Lazareto in S. Vicente and another nesting on Boavista, Sal, S. Nicolau and the
north eastern beaches of S. Vicente. We suggest that the Lazareto turtles should be
treated as an evolutionary significant unit (Moritz 1994)until further samples have been
collected in following seasons to verify the size and distribution of this population. Few
turtles have been observed to frequent the heavy urbanized and polluted beach in
Lazareto in the past nesting seasons, suggesting that this population is substantially
threatened. Being an evolutionary significant unit, the loss of this nesting site could
mean loosing important genetic variability of the entire Cape Verde rookery. The ability
of a population to adapt to biotic or abiotic change is dependent on the set of genes of
the entire population (Hoeglund 2009), thus loosing distinct genes from Lazareto, could
reduce the capacity of the entire Cape Verde population to adapt to future changes. Our
results propose that this population has already suffered a bottleneck event and we
therefore recommend special attention of local conservation projects to be given to this
nesting aggregation. Furthermore, our results demonstrate the need for investigating
nesting aggregations at different geographical scales, as large geographic patterns may
not reflect the complex functioning of the rookeries, neither in terms of philopatry,
reproduction or dispersal.

Chapter II - Introduction
46
Chapter II
Characterization of MHC class I gene in the endangered
Loggerhead Sea Turtles reveals low functional diversity
Introduction
All species are confronted to disease. However, endangered species with potentially
restricted genetic diversity are particularly threatened (Sommer 2005). In vertebrates,
growing evidence suggests that genetic diversity is particularly important at the level of
the major histocompatibility complex (MHC). The MHC represents the most
polymorphic cluster of genes in all jawed vertebrates (Apanius et al. 1997). Since the
primary function of MHC molecules is to present parasite derived peptides to T
lymphocytes, which initiate protection against parasites, the predominant selective
forces are likely pathogen-driven (Piertney and Oliver 2006; Sommer 2005).
There are two main types of MHC molecules, MHC class I and class II. Both MHC
molecule classes transport peptides from the cytoplasm and display them on the cell
surface. The peptides presented by MHC class I molecules are mostly derived from
proteins degraded by the proteasome, whereas MHC class II molecules display peptides
from extracellular antigens that have been endocytosed and degraded by endosomal and
lysosomal proteases. Class Iα molecules present peptides to CD8+ cytotoxic T
lymphocytes and class II molecules to CD4+ T helper cells (Janeway et al. 2001). MHC
class I molecules are present on nearly all cell types, while MHC class II molecules are
displayed by antigen presenting cells such as macrophages, B cells and dendritic cells.
The antigen receptors on T cells are specific for complexes of foreign peptides displayed
on self MHC molecules. In human, up to six different MHC molecules can be displayed on
the cell surface, which are the products of three different MHC class- I genes (A, B and C).
MHC genes are particularly polymorphic in the region that encodes for the peptide-
binding domain. Particularly, the class I MHC molecules consist of an α-chain, which has
three extracellular domains (α1, α2 and α3) and the noncovalently associated β-2
microglobulin. The residues of the α1α2 domains form the peptide-binding region
(PBR). Antigenic peptides are anchored at specific residues called antigen binding sites
(ABS), which are commonly found to be under positive selection (e.g. striped mice
(Froeschke and Sommer 2005), great snipe (Ekblom et al. 2007), cichlids (Blais et al.

Chapter II - Introduction
47
2007). MHC genes that differ at ABS produce molecules that effectively bind and present
different ranges of antigens to T cells. This will in turn determine whether or not an
effective immune response can be mounted against an infectious agent. Polymorphism
in ABS provides an individual and the population a greater chance of responding to a
new pathogen in the environment. Genetic diversity at MHC loci has been used to
measure the immunological fitness of wild populations .
The potential mechanisms by which parasite mediated selection acts on MHC
polymorphism can be summarized in three major hypotheses: heterozygote advantage,
negative frequency dependent selection and habitat heterogeneity (reviewed in
Eizaguirre and Lenz 2010; Piertney and Oliver 2006). It is worth noting that these three
mechanisms acting on MHC polymorphism are not mutually exclusive (e.g. Apanius et al.
1997). This is best seen in the many associations between MHC allelic diversity and
resistance to parasitism that have been found in natural populations (see Milinski 2006;
Piertney and Oliver 2006), which could be a sign for heterozygote advantage but also for
negative frequency-dependent selection.
Additionally, there is growing evidence, that MHC-dependent mate choice may
contribute to its outstanding polymorphism (Reusch et al. 2001; Yamazaki et al. 1976)
and thus may play crucial role for species survival.
A specific feature of the MHC polymorphism is trans-species existence. Allelic lineages
are maintained over long periods of time, even across speciation events (Klein 1986).
Trans-species sharing of MHC sequences among genera has been supported by
observations in many taxa (e.g. fish (Ottová et al. 2005), carnivores (Seddon and
Ellegren 2004) and ungulates (Hedrick et al. 1999), however little is known about
reptiles (but see Glaberman and Caccone 2008).
Genetic variation at MHC loci is thought to be important for resistance against
pathogens, thereby increasing individual fitness and thus the long-term survival of
endangered species (Hughes and Nei 1988). Several studies have reported decreased
pathogen resistance among MHC homozygotes, or an increase in pathogen susceptibility
in inbred individuals in general. However, a direct link between pathogen-mediated
population decline and low MHC variation has been difficult to demonstrate in natural
populations (reviewed in Sommer 2005). The importance of those genes for population
viability is best highlighted by the case of the largest remaining marsupial carnivore, the
Tasmanian devil (Sarcophilus harrisii). It is currently under threat of extinction due to a

Chapter II - Introduction
48
newly emerged wildlife disease (facial tumor disease). A conclusive link between a loss
of MHC diversity and the spread of the disease was identified (Siddle et al. 2007). How
much minimum MHC diversity and population structuring is needed before species go
extinct, remains to be discovered (Siddle et al. 2010).
Despite a tremendous research effort to understand further the evolution of MHC genes,
surprisingly, only a few number of studies considered the group of non avian reptiles. As
sister taxa to both mammals and birds, non avian reptiles provide the link between the
ancient and ectothermic lineage (fish and amphibians) and the modern endotherms
(mammals and birds). There are four groups of non avian reptiles: squamate (snakes
and lizards), crocodilia (crocodilians), sphenodontia (tuatara) and chelonian (turtles).
The better characterized example is the Tuatara (Miller et al. 2008; Miller et al. 2006).
Analysis of the exon 2 of the MHC class I revealed two sets of duplicated alleles in most
individuals, alleles with 6bp insertion and alleles without this insertion.
In this study we investigate variation at MHC class I exon 2 of the Loggerhead Sea Turtle
(Caretta caretta) from the second largest aggregation in the Atlantic Ocean in the
archipelago of Cape Verde. Due to its fast decline and the numerous threats the
loggerhead turtles are confronted to the species has been listed as endangered in the list
of threatened species (IUCN 2007). Additionally, in Cape Verde, the fungus Fusarium
solani was found to be the cause of infections in the eggs of which accounted for over
80% mortality in challenged experiment (Sarmiento-Ramírez et al. 2010)
This chapter has two goals. First, we aim to provide tools to investigate
resistance/susceptibility to disease for an endangered species. Second, we intend to
complement the knowledge about the evolution of MHC genes in a phylogenetic old
group.

Chapter II - Materials and Methods
49
Materials and Methods
Sampling and DNA extraction
Tissue samples from 40 loggerhead turtles (Caretta caretta) were collected in the 2010
nesting season (June to October) on the island of Sal in the Cape Verde Archipelago.
Sampling and DNA extraction were performed as described in the previous chapter.
Primer design
In order to design primers to characterize the highly polymorphic MHC class Iα exon 2
sequence, Genebank was searched for MHC sequences of related species to the
loggerhead turtle. The found reptile and avian MHC class I sequences were aligned using
BioEdit version 7.0.5.3 (Hall 1999) and consisted of sequences from reptiles Malaclemy
terrapin (Genebank accession numbers: GQ495891.1), Pelodiscus sinensis (AB185243.1
and AB022885.1), Sphenodon punctatus (FJ457094.1, FJ457093.1), and a bird species
Gallus Gallus (AY123227.1). Within this alignment, conserved regions in the exon 2 were
selected to design primers. After various tests for different primer combinations,
annealing temperatures, cloning and sequencing procedures the primer combination Cc-
MHC-I-F (5’-GATGTATGGGTGTGATCTCCGGG-‘3) and Cc-MHC-I-R (5’-
TTCACTCGATGCAGGTCDNCTCCAGGT-‘3) showed consistent amplification of multiple
MHC class I sequences. Although, the Cc-MHC-I-R primer shows polymorphism from the
16th to 18th base pair, no better primers could be obtained.
Amplification, Cloning, and Sequencing
To reduce the risk of PCR artifacts, two independent 20 µl PCR reactions were prepared.
Each consisted of 2µl 10x Dreamtaq® Buffer, 1µl dNTP’s (10mM), 2 µl of each primer
(5pmol/µl), 0.2µl Taq Polymerase (Dreamtaq®), and 2 µl of template DNA. Thermal
profile started with an initial denaturing step at 95°C for 3 minutes, followed by 30
cycles of 30 seconds at 94°C, 30 seconds at 66°C and 1 minute at 72°C. The final
elongation was set for 5 min at 72°C. The volumes of both reactions were then pooled, of
which 30µl were loaded in an agarose gel (1.5%, 5h at 45 V). Bands of expected size
~200 bp were excised.

Chapter II - Materials and Methods
50
Gel purification followed manufacturer’s protocol for the NucleoSpin Extract II Kit
(Macherey-Nagel, Düren, Germany). PCR amplicons were cloned with the Qiagen® PCR
cloning Kit (Qiagen, Hilden, Germany). The manufacturer’s ligation protocol was
followed to the exception that the ligation-reaction-mixture consisted of 1µl pDrive
Cloning Vector, of 5µl Ligation Master Mix and of 4 µl PCR products. The transformation
protocol was modified as follows: 5 µl of the ligation-reaction mixture were mixed with
25 µl competent cells. Reactions were then heated for 40 seconds at 42°C. Later, 150 µl
SOC medium were added and to allow recombinant growth for Kanamycin selection, the
reaction mixture was first incubated for 30 minutes at 37°C (slightly shaken) and then
plated on a Kan® IptgX-Gal plate. Plasmids were extracted with the Invisorb® Spin
Plasmid Mini Two Extraction Kit (Invitek, Berlin, Germany) as described in Kit’s
provided protocol, with a final elution step of 50µl. Cycle sequencing took place in 10 µl
PCR reactions consisting of 1 µl Big Dye® Buffer, of 1µl Big Dye® Terminator, 1µl of the
universal M13 Forward primer, 3µl of HPLC water and 4 µl of extracted plasmid
template. The thermal cycling protocol had a first step for 1 minute at 96°C, then 26
cycles consisting of a step at 96°C for 10 seconds, the next step at 50°C for 5 seconds and
the elongation final step was set at 60°C for 4 minutes. After DNA precipitation the
products were loaded on an ABI 3130 Genetic Analyzer (Applied Biosystems, Darmstadt,
Germany). After verification of the sequences, the newly established MHC amplification
protocol was used for high throughput sequencing on new generation sequencing
platform.
454 genotyping of all individuals
The 454 next generation sequencing platform, using a barcoded deep amplicon
approach (Babik et al. 2009) was chosen to assure large coverage and determine all
possible alleles carried by the sampled turtles. To this end, DNA concentrations were
standardized to 10 ng/µl to maximize likelihood of equal coverage of all samples. As
previously described two independent PCR reactions were performed. For each
replicate, the protocol was split into two steps. In the first step, PCR conditions were
kept as described above but the cycles were reduced to 25. A reconditioning step was
performed and consisted of only 10 cycles and used the end product of the first PCR as
template. Reconditioning procedure and independent reactions reduce the final

Chapter II - Materials and Methods
51
proportion of artifacts (Lenz and Becker 2008) a major problem with new sequencing
technologies. Reconditioning step used 454 sequencing adaptors (Forward side TitaA
CCATCTCATCCCTGCGTGTCTCCGACTCAG; Reverse side TitaB
CCTATCCCCTGTGTGCCTTGGCAGTCTCAG, GATC, Constance, Germany), followed by a 10
bp individual tag (MID, Roche) and the newly developed specific primer pairs. The MID
tags were designed such as the random accumulation of up to two polymerase errors in
the MID would still lead to the correct individual identification.
After amplification, amplicons were cleaned using the Qiagen PCR Purification Kit
(Qiagen, Hilden, Germany). The cleaned products were run on gels, to verify the
presence of the expected bands.
From all cleaned samples DNA concentration was measured again and all samples were
pooled so that each PCR reaction contributed to an equal amount of 100 ng/sample. To
remove other unspecific amplicons the final pool was loaded on a gel (14 h at 30 V), and
bands at 340 bp were cut and products were extracted as described above.
Genotyping
MHC alleles were called and assigned to each individual using Perl scripts and the
program cd-hit (Li and Godzik 2006). Reads were screened for the forward and reverse
primers designed for the sequencing, allowing one nucleotide mismatch or indel (on top
of the degenerate bases) in case of sequencing errors. Reads were then sorted by MID
tags, again allowing for one nucleotide mismatch or indel, which was rendered possible
because MID tags were designed to differ from one another by at least two nucleotides.
Reads were mapped and those blasting MHC class I alleles were retained. Reads were
eventually assigned to individual turtle given their MID tag sequences. All reads were
aligned using BioEdit and resulting sequences were designated as alleles. Reads that
were originally assigned to individuals were sorted to correspond to these designated
alleles. Importantly, for each turtle, only alleles that appeared in both independent PCR
preparations were kept, and remaining allele frequencies were calculated. Alleles were
assigned to a turtles if their frequency (in terms of number of reads) was above 10% of
the most frequently occurring allele within an individual.
Errors occurring during the 454 sequencing errors include substitutions and small
indels (Babik et al. 2009; Galan et al. 2010). The frequency of errors resulting in base

Chapter II - Materials and Methods
52
substitutions was low, and these were expected to occur randomly across the sequence.
Therefore, the probability of multiple, identical substitution errors was low (Galan et al.
2010). Single base indels occurring in homopolymer tracts were relatively common and
were non-randomly distributed along the sequence. However, such variants were
removed because of low frequency within an individual. Although sequences may stem
from different loci, variants will be referred to as alleles.
Data analyses
To test for signs of positive selection, MEGA 4 was used and dN/dS ratio and z-test were
calculated. MEGA 4 was also used to build a neighbor joining tree with 1000 bootstraps
for all MHC alleles found in the loggerhead. Two additional neighbor joining trees were
simulated: one based on the control region of 6 reptile species and one based on the
MHC class I of 5 reptile species.
We used the ScoreCons online server to determine variation for amino acid residues of
the exon 2 of the loggerhead turtles. The software MultiLocus 1.22 (Agapow and Burt
2001) was used to estimate linkage disequilibrium between detected alleles using
10000 randomizations.
The risk that females will choose an MHC-identical male, or a male with fewer alleles,
when mating completely at random was assessed in a permutation procedure. We
combined 40 female genotypes with identical 40 putative male genotypes 100 times at
random, each time counting genotypic similarity and difference in allele number.
Difference between observed and expected distribution were tested using Kolmogorov-
Smirnov test and potential difference between medians were tested using Wilcoxon test.
Chapter II - Results
53
Results
Descriptive sequencing
For the sequenced turtles used in this chapter we obtained approximately 4100 usable
reads from the sequencing company. Coverage varied between 54 and 106 reads per
allele.
Turtles description - Allelic pools
We detected 24 different variants in 40 turtles from Sal sequenced for which our
stringent thresholds were passed. Allele frequencies varied from 0.025 to 0.275 for the
most common allele. Out of the 24 alleles, 13 had a frequency equal or higher than 10%
(Figure 13).
Figure 13: Histogram representing the frequencies of the different alleles found in 40 loggerhead sea turtles from Sal.
Building a phylogenetic tree, we identified three main lineages supported by high
bootstrap (Figure 14). One of those lineages is represented by only one allele, which
strongly diverges from the others but remained functional (allele 5). This allele was not
rare (frequency = 10%). When in the reading frame, all alleles show functional
sequences. The 24 alleles encoded for 20 amino-acid sequences.

Chapter II - Results
54
Figure 14: Neighbor joining tree based on the MHC class I sequences of the loggerhead turtle retrieved from 40 samples from the island of Sal. Values represent percentage support based on 1000 boostraps.
In stickleback for instance, alleles have been shown to appear in tight linkage
disequilibrium (Lenz et al. 2009) which is not the case in the loggerhead. None of the
alleles that appeared in more than one individual were in linkage disequilibrium with
another (p=0.557) - suggesting independence of the loci.

Chapter II - Results
55
Turtles description - Individual allele variation
Individual diversity ranged from 1 to 4 (median=2) indicating between two and four loci
(4 loci, each homzygote) being present in the loggerhead populations. Nucleotide
difference ranged from 1 to 66 with a median of 22.5, and from 1 to 13 amino acid
changes (median of 6.3). As expected under parasite mediated selection, MHC genes in
turtle show strong sign of positive selection Z=3.587, p<0.001 (Mean non synonymous
substitution Dn= 123.057, Mean Synonymous substitution Ds=35.943).
Previous study in stickleback identified selection on individual diversity comparing
distribution of observed individual number of alleles to the one obtained under random
mating. In the case of the loggerhead, to follow this approach, we have to assume that
both males and females display identical diversity. Permutation based test of 40 females
mating randomly with 40 males showed significant difference from the observed
distribution (D = 0.4159, p-value = 0.015). We observed a lower number of individual
MHC alleles diversity than under random mating (W = 245, p-value = 0.003;
medianrandom= 3.5, median observed=2), suggesting selection for intermediate MHC
diversity.
Comparison with other reptiles
The two neighbor joining trees built using the mtDNA control region and the MHC class I
α, respectively, display different information (Figure 15). On the one hand, the control
region showed clear clustering for species where each node is supported by high
boostrap values. On the other hand, the MHC class I shows at least two lineages
supported by 99% bootstrap value. Interestingly, the loggerhead MHC alleles belong to
both clusters and showed closer relationship with MHC alleles from other reptiles than
within the species- indicating trans-species polymorphism over a large range of reptile
species.

Chapter II - Results
56
Figure 15: A) Neighbor-Joining tree based on the control region of six reptile species; B) Neighbor-Joining tree based on the MHC class I of 5 reptiles and an marine mammal as outgroup. Although A) shows clear separation for species, B) demonstrates trans-species polymorphism of the MHC class I gene in reptiles.
A
B

Chapter II - Discussion
57
Discussion
In this work, we characterized the genes of the major histocompatibility complex of the
endangered loggerhead sea turtles (IUCN 2007). Loggerhead turtles have been
confronted to multiple direct or indirect anthropogenic threats menacing genetic
diversity – a crucial component of population viability (Sommer 2005). The MHC genes
are not only good proxy to estimate genetic diversity but also play important role on the
onset of the adaptive immune system and mating strategy. Here, we describe a working
protocol for fast high throughput genotyping. We found that, despite their endangered
status, turtles from the studied population still display normal level of genetic diversity
both at the individual and at the population level. We also found that there seem to be
selection for non-random MHC individual allele distribution, suggesting selection for an
optimal individual diversity (Reusch et al. 2001). Eventually we show a strong sign of
trans-species polymorphism over large range of reptile species.
Several hypotheses have been proposed to explain the maintenance of MHC
polymorphism, but, given the function of those genes, parasite mediated balancing
selection is the most likely (reviewed in Milinski 2006; Piertney and Oliver 2006). The
exceptional allelic diversity usually observed in natural populations provides the unique
potential to adapt to a given parasite spectrum both in terms of specific alleles as well as
in terms of diversity. The 40 sequenced turtles showed up to 4 different MHC alleles.
This implies at least one event of duplication or up to four different loci. The number of
MHC loci in the genome is restricted (see Nowak et al. 1992) and represents the
bottleneck for adaptation. Each individual can express only a limited number of the
alleles that are available in the population and consequently can only resist a limited
range of pathogens. On an evolutionary time scale, the number of loci within a species is
not fixed and may vary over time in a birth-and-death process of gene duplications and
deletions (Klein et al. 1993). In response to more diverse parasite communities, the
advantage to present (and recognize) a higher number of parasitic antigens might select
for haplotypes with additional gene copies, because these enable the expression of a
higher number of different MHC alleles. Evidence for varying number of MHC loci
between individual haplotypes within and between population within a species exist
(e.g. in the stickleback, Lenz et al. 2009). The birth-and-death process of MHC gene
evolution has so far mostly been explained in qualitative terms, i.e. genes which carry an

Chapter II - Discussion
58
advantageous allele are maintained whereas others are silenced and eventually
removed (Nei et al. 1997)
In the loggerhead turtles, the detected alleles also showed high clustering suggesting
different lineages to be amplified and probably expressed. MHC alleles frequently cluster
into distinct allelic lineages whose origin predates species divergence, a phenomenon
also known as trans-species polymorphism (Klein 1986). This phenomenon is generally
explained by balancing selection, whereby a large number of alleles is maintained in a
population at any given moment in time and therefore, in a speciation event, alleles of
different allelic lineages are passed on to each of the diverging new species (Klein et al.
2007). Two alleles from distinct allelic lineages are likely more divergent (i.e.,
accumulated different mutations) than two alleles from the same lineage. Genotypes
with two such alleles are then expected to bind more different parasite derived antigens
and should therefore be favored. Consequently, alleles from distinct lineages would be
propagated, leading to the maintenance of divergent allelic lineages in the population
over long time spans, including speciation events (Klein et al. 2007). Trans-species has
already been reported in three related iguana species (Glaberman et al. 2008). Our
results show a larger taxonomic range of trans-species polymorphism, from marine
turtles to terrestrial iguanas, which may arise from the old phylum represented by
reptiles.
It was suggested for several taxa, and demonstrated experimentally for others, that
females make their mating decision based on MHC (reviewed in Milinski 2006),
including reptiles (Sand lizard (Olsson et al. 2003) and the Sphenodon (Miller et al.
2009)). In the context of sexual selection, only recently it had been taken into account
that most vertebrates possess several MHC loci (Reusch et al. 2001). As a result, there
are many possible combinations of alleles at different loci. The chances of choosing a
partner with identical MHC alleles become very unlikely, because the combination of
alleles at multiple loci lowers the likelihood of existing MHC genotypes. In sticklebacks,
it was shown that allele distribution at the population reflects MHC-based mate choice
when different from random mating (Reusch et al. 2001). In the loggerhead turtle, using
a similar approach and assuming identical female and male genotypes, we found lower
median than under random mating, suggesting selection for intermediate MHC diversity
(Nowak et al. 1992; Woelfing et al. 2009).

Chapter II - Discussion
59
Although increased individual MHC diversity is expected to be advantageous
(Heterozygous advantage, Doherty and Zinkernagel 1975), it has been suggested to
result in a depletion of the mature T-cell repertoire and thereby reduce
immunocompetence (Lawlor et al. 1990; Vidović and Matzinger 1988)(Lawlor et al.
1990; Vidović and Matzinger 1988). Therefore, it may be more advantageous to
optimize MHC diversity rather than maximize it (Reusch et al. 2001; Wegner et al.
2003).Future studies will have to determine whether or not female loggerhead turtles
make their mating decision based on MHC genes. If it is the case, it opens a large field of
science, since reptiles represent an old phylogenetic group and would provide great
insights about the evolution of mating strategies. Additionally, as seen in chapter I, mate
choice and reproductive strategies have the potential to explain female philopatry and
the observed genetic structure at neutral markers.
The MHC class I data presented in this chapter can serve as an important launching
point for studies of conservation genetics, sexual selection, and disease resistance in the
loggerhead turtle. Over the last two decades, the MHC has emerged as an important
model system for evaluating the relative influence of natural selection versus drift and
migration on the levels of genetic variation in populations (Bernatchez and Landry
2003; Piertney and Oliver 2006). This is important when considering that selection may
have its greatest effect on functionally important genes. Additionally, evidence for
selection on large migratory marine organism is scarce and the loggerhead turtle could
provide new insights.

Final Conclusions
60
Final Conclusions
Despite representing one of the largest worldwide rookeries for the loggerhead sea
turtle, the Cape Verde Archipelago has received relatively little scientific attention.
Genetic diversity is believed to be crucial for the adaptive and evolutionary potential of
populations. Endangered species, like the loggerhead turtle, are more prone to
extinction due to potential loss of genetic diversity and the consequent weak potential of
adaptation (Hoeglund 2009). Major gaps in the understanding of population structure
and estimate of neutral and adaptive genetic diversity prevail in the loggerhead species.
Thus, in this study we investigated genetic structure across the archipelago using
neutral markers, such as the control regions of the mitochondrial DNA and
microsatellites and characterized the class I loci of the major histocompatibility complex
(MHC).
In order to understand the nature of selection shaping the genetic patterns found in the
Cape Verde population, we investigated the demographic history of the loggerhead
turtle. Results suggest the rookery to be rather old and of stable population size: The
archipelago seems to have been colonized in two distinct waves, the second wave
bringing in a very divergent haplotype. Furthermore, based on the observed genetic
diversity present in the rookery and comparing it to other major rookeries in the
Atlantic and the Mediterranean Sea, we propose that Cape Verde has served as a
stepping stone towards the colonization of the Mediterranean Sea after the last
glaciations.
Another major insight brought by our study suggests that increasing geographical
resolution may reveal complex population functioning. At the island level for instance, a
genetic bottleneck on the most north western island (S. Vicente) was detected, although
not visible at the rookery level. Increasing the geographical complexity further to the
beach level showed that both beaches that were sampled on that island went through
bottleneck events.
One of those beaches, the Lazareto beach, did not only show a bottleneck, but also
significant different set of mtDNA haplotypes compared to all other populations. Such
results are signs for the co-existence of two distinct philopatric behaviors of nesting
females on Cape Verde: one very accurate strategy, where females return to their natal
beach (Lazareto beach in S. Vicente) and one more diverse strategy where females seem

Final Conclusions
61
to spread their clutches over different beaches and islands. The evolutionary pressures
underlying these two strategies, is a matter of investigation in future studies.
Surprisingly, the same Lazareto beach also showed signs of structure on microsatellite
markers, indicating reproductive isolation between this beach and the other islands.
Therefore, we recommend considering the beach of Lazareto an evolutionary significant
unit (Moritz 1994) and implanting special efforts in the survival of this unit. The finding
of this conservation unit reduced to a beach scale depicts the importance in sea turtle
biology to increase complexity in future investigations.
One evolutionary concept underlying philopatric behavior is adaptation to a local
environment (Greenwood 1980). A major challenge in evolutionary biology is to identify
relevant ecological pressure and their underlying selected genes (Janeway et al. 2001). A
well known example of such a system is the interaction between parasites and the major
histocompatibility complex (MHC, reviewed in Milinski 2006). The high degree of
polymorphism found in these genes and the known selective pressure, make this system
ideal to target question of local adaptation (Eizaguirre et al. 2010). Indeed, the MHC
genes have been suggested to play an important role in adaptive population divergence
(Eizaguirre et al. 2009). Furthermore, since the MHC function is to resist pathogen
pressures, MHC diversity is often correlated to individual fitness and thus long-term
survival of species (Hughes and Nei 1988).
Therefore, the successful characterization of the MHC class I of the loggerhead turtle,
which allows for fast high throughput genotyping, opens new research directions. First
of all, we show that reptiles seem to show a high level of trans-species polymorphism
offering great opportunity to further investigate evolution of MHC genes in a
phylogenetic old group. Secondly, we also found suggestive evidence for female turtles
to not mate randomly with regards to MHC. Further work will need to focus on
investigating, whether MHC-based mate choice explains the observed pattern of
reproductive isolation between Lazareto and the other populations.
The next step, which could not be addressed within the time frame of this thesis, would
be to investigate the potential patterns of local adaptation. Local adaptation could be a
strategy of females to transfer adaptive genes efficiently in the local environment to
maximize offspring survival.

Final Conclusions
62
To conclude, this thesis has served as a threefold stepping stone to i) refine the pattern
of colonization of the northern Atlantic by the loggerhead turtles, ii) show large range of
trans-species polymorphism across several reptilian taxa for the MHC genes and iii)
develop new research directions for investigating female mate choice and pattern of
local adaptation in a large migratory marine species.

63
References
Abella E, Marco a, López-Jurado LF (2007) Success of Delayed Translocation of Loggerhead Turtle Nests. Journal of Wildlife Management 71:2290.
Abella E (2010) Factores ambientales y de manejo que afectan al desarollo embrionario del la tortugal marina Caretta caretta. Implicaciones en Programas de incubacion controlada. Universidad de las Palmas de Gran Canaria Doctoral t.
Abreu-Grobois FA, Horrocks J, Formia A, Dutton P, Lereux R, Velez-Zuazo X, SOARES L, MEYLAN P, Brown D (2006) New mtDNA control region primers which work for a variety of marine turtle species may increase the resolution capacity of mixed stock analyses. Book of Abstracts. 26th Annual Symposium on Sea Turtle Biology and Conservation. International Sea Turtle Society, Athens, Greece:179.
Agapow P-M, Burt A (2001) Indices of multilocus linkage disequilibrium. Molecular Ecology Notes 1:101-102.
Apanius V, Penn D, Slev PR, Ruff L, Potts WK (1997) The nature of selection on the major histocompatibility complex. Critical Reviews in Immunology 17:179-224.
Arvy C, Dia AT, Colas F, Fretey J (2000) Records of Caretta caretta in Mauritania. Marine Turtle Newsletter 88:2011-2011.
Babik W, Taberlet P, Ejsmond MJ, Radwan J (2009) New generation sequencers as a tool for genotyping of highly polymorphic multilocus MHC system. Molecular Ecology Resources 9:713-719.
Barton NH, Briggs DEG, Eisen JA, Goldstein DB, Patel NH (2007) Evolution. Cold Spring Harbor Laboratory Press.
Belkhir K, Borsa P, Cjickhi L, Raufaste N (1999) Genetix 4.05, logiciel sous Windows TM pour la génétique des populations. Laboratoire Génome, Populations, Interactions, CNRS UMR 5171, Université de Montpellier II, Montpellier (France).
Bernatchez L, Landry C (2003) MHC studies in nonmodel vertebrates: what have we learned about natural selection in 15 years? Journal of evolutionary biology 16:363-77.
Bjorndal K, Bolten A, Martins H (2000) Somatic growth model of juvenile loggerhead sea turtles Caretta caretta: duration of pelagic stage. Marine Ecology Progress Series 202:265-272.
Bjorndal K a (1985) Nutritional Ecology of Sea turtles. 2:736-751.
Blais J, Rico C, Oosterhout C van, Cable J, Turner GF, Bernatchez L (2007) MHC adaptive divergence between closely related and sympatric African cichlids. PloS one 2:e734.

64
Bolten AB (2003) Active Swimmers - Passive Deifters: The ocenaic juvenile stage of Loggerheads in the Atlantic system. In: Bolten AB, Witherington BE (eds) Loggerhead Sea turtles. Smithsonian Books Washington, pp 63-78.
Bolten AB, Bjorndal K a, Martins HR, Dellinger T, Biscoito MJ, Encalada SE, Bowen BW (1998) TRANSATLANTIC DEVELOPMENTAL MIGRATIONS OF LOGGERHEAD SEA TURTLES DEMONSTRATED BY mtDNA SEQUENCE ANALYSIS. Ecological Applications 8:1-7.
Bowen BW, Bass a L, Soares L, Toonen RJ (2005) Conservation implications of complex population structure: lessons from the loggerhead turtle (Caretta caretta). Molecular ecology 14:2389-402.
Bowen BW, Karl S a (2007) Population genetics and phylogeography of sea turtles. Molecular ecology 16:4886-907.
Bowen BW (2003) What is a Loggerhead turtle? The genetic perspective. In: Bolten AB, Witherington BE (eds) Loggerhead Sea turtles. pp 7 - 21.
Bowen BW, Kamezaki N, Limpus CJ, Hughes GR, Meylan AB, Avise JC (1994) Global Phylogeography of the Loggerhead Turtle (Caretta caretta) as Indicated by Mitochondrial DNA Haplotypes. Evolution 48:1820.
Bowen B, AVISE JC, RICHARDSON JI, MEYLAN AB, MARGARITOULIS D, HOPKINS-MURPHY SR (1993) Population Structure of Loggerhead Turtles (Caretta caretta) in the Northwestern Atlantic Ocean and Mediterranean Sea. Conservation Biology 7:834-844.
Broderick C, Godley BJ (1996) Population and nesting ecology of the Green Turtle, Chelonia mydas, and the Loggerhead Turtles, Caretta caretta, in norther Cyprus. Zoology in the Middle East 13:27-46.
Brongersma LD (1982) Marine turtles of the eastern Atlantic Ocean. In: Biology and Conservation of Sea Turtles (K. A. Bjorndal, Ed.). Smithsonian Inst. Press, Washington D. C, pp 407-416.
Caldwell DK, Berry FH, Carr A, Ragotzkie RA (1959) Multiple and group nesting by the Atlantic loggerhead turtle. Bull. Fla. State Mus. Biol. Sci 4:309-318.
Carr A (1986) Rips, FADS, and little loggerheads. BioScience 36:92-100.
Carreras C, Pascual M, Cardona L, Aguilar A, Margaritoulis D, Rees A, Turkozan O, Levy Y, Gasith A, Aureggi M, Khalil M (2007) The genetic structure of the loggerhead sea turtle (Caretta caretta) in the Mediterranean as revealed by nuclear and mitochondrial DNA and its conservation implications. Conservation Genetics 8:761-775.
Cejudo D, Cabrera I, Lopez-Jurado LF, Evora C, Alfama P (2000) The Reproductive Biology of Caretta caretta on the Island of Boavista ( Republic of Cabo Verde , Western Africa ). Smithsonian:244-245.

65
Conant TA, Dutton PH, Eguchi T, Epperly SP, Fahy CC, Godfrey MH, Macpherson SL, Possardt EE, Schroeder BA, Seminoff JA, Snover ML, Upite CM, Witherington BE (2009) Loggerhead sea turtle (Caretta caretta)2009 Status Report. Under the U.S endangered species act. Report of the Loggerhead Bological Review Team to the National Marine Fisheries Service.
Cornuet JM, Luikart G (1997) Description and power analysis of two tests for detecting recent population bottlenecks from allele frequency data. Genetics 144:2001-2014.
Coulson TN, Pemberton JM, Albon SD, Beaumont M, Marshall TC, Slate J, Guinness FE, Clutton-Brock TH (1998) Microsatellites reveal heterosis in red deer. Proceedings. Biological sciences / The Royal Society 265:489-95.
Cozens J (2009) 2009 CAMPAIGN REPORT.
Di Rienzo a, Peterson a C, Garza JC, Valdes a M, Slatkin M, Freimer NB (1994) Mutational processes of simple-sequence repeat loci in human populations. Proceedings of the National Academy of Sciences of the United States of America 91:3166-70.
Dodd C (1988) SYNOPSIS OF THE BIOLOGICAL DATA ON THE LOGGERHEAD SEA TURTLE CARETTA CARETTA ( LINNAEUS 1758 ). In: Fish and Wildlife Service U.S. department of the Interior Biological report.
Doherty PC, Zinkernagel RM (1975) A biological role for the major histocompatibility antigens. The Lancet 305:1406-1409.
Eizaguirre C, Lenz TL (2010) Major histocompatibility complex polymorphism: dynamics and consequences of parasite-mediated local adaptation in fishes. Journal of Fish Biology 77:2023-2047.
Eizaguirre C, Lenz TL, Traulsen A, Milinski M (2009) Speciation accelerated and stabilized by pleiotropic major histocompatibility complex immunogenes. Ecology letters 12:5-12.
Eizaguirre C, Lenz TL, Sommerfeld RD, Harrod C, Kalbe M, Milinski M (2010) Parasite diversity, patterns of MHC II variation and olfactory based mate choice in diverging three-spined stickleback ecotypes. Evolutionary Ecology.
Ekblom R, Saether SA, Jacobsson P, Fiske P, Sahlman T, Grahn M, Kålås JA, Höglund J (2007) Spatial pattern of MHC class II variation in the great snipe (Gallinago media). Molecular ecology 16:1439-51.
Encalada SE, Bjorndal K a, Bolten AB, Zurita JC, Schroeder BA, Possardt EE, Sears CJ, Bowen BW (1998) Population structure of loggerhead turtle ( Caretta caretta ) nesting colonies in the Atlantic and Mediterranean as inferred from mitochondrial DNA control region sequences. Marine Biology:567-575.
Evanno G, Regnaut S, Goudet J (2005) Detecting the number of clusters of individuals using the software structure: a simulation study. Molecular Ecology 14:2611-2620.

66
Excoffier L, Laval G, Schneider S (2005) Arlequin (version 3.0): an integrated software package for population genetics data analysis. Evolutionary bioinformatics online 1:47-50.
Felsenstein J (1989) PHYLIP - Phylogeny Inference Package (Version 3.2). Cladistics 5:164-166.
FitzSimmons NN, Moritz C, Limpus CJ, Miller JD, Parmenter CJ, Prince R (1996) Comparative Genetic Structure of Green, Loggerhead, and Flat-back Populations in Australia Based on Variable mtDNA and nDNA Regions. Proceedings of the international symposium on sea turtle conservation genetics. NOAA Technical Memorandum NMFS-SEFSC-396:25-32.
Frazer N, Ehrhart L (1983) Relating Straight-Line to Over-the-Curve Measurements for Loggerheads Marine Turtle Newsletter. :4-5.
Fretey J (2001) Biogeography and Conservation of Marine Turtles of the Atlantic Coast of Africa/Biogéographie et conservation des tortues marines de la côte Atlantique de lʼAfrique. CMS Technical Series Publication 6.
Froeschke G, Sommer S (2005) MHC class II DRB variability and parasite load in the striped mouse (Rhabdomys pumilio) in the Southern Kalahari. Molecular biology and evolution 22:1254-9.
Fu YX (1997) Statistical Tests of Neutrality of Mutations against Population Growth, Hitchhiking and Background Selection. Genetics 147:915-925.
Galan M, Guivier E, Caraux G, Charbonnel N, Cosson J-F (2010) A 454 multiplex sequencing method for rapid and reliable genotyping of highly polymorphic genes in large-scale studies. BMC Genomics 11:296.
Gallagher RM, Hollinger RM, Futch CR (1972) Marine turtle nesting on Hutchinson Island, Florida, in 1971. Florida Department of Natural Resources Marine Research Laboratory Special Science Report 37:1-11.
Glaberman S, Caccone A (2008) Species-specific evolution of class I MHC genes in iguanas (order: Squamata; subfamily: Iguaninae). Immunogenetics 60:371-82.
Glaberman S, Du Pasquier L, Caccone A (2008) Characterization of a nonclassical class I MHC gene in a reptile, the Galápagos marine iguana (Amblyrhynchus cristatus). PloS one 3:e2859.
Godley BJ, Broderick A (1992) Glasgow University turtle conservation expedition to northern Cyprus 92. Expedition report. Glasgow University Turtle Conservation Project:80.
Greenwood P (1980) Mating systems, philopatry and dispersal in birds and mammals. Animal Behaviour 28:1140-1162.

67
Haag-Liautard C, Coffey N, Houle D, Lynch M, Charlesworth B, Keightley PD (2008) Direct estimation of the mitochondrial DNA mutation rate in Drosophila melanogaster. PLoS biology 6:e204.
Harpending HC (1994) Signature of Ancient Population Growth in a Low-Resoltion Mitochondrial Mismatch Distribution. Human Biology 66:591-600.
Hatase H, Kinoshita M, Bando T, Kamezaki N, Sato K, Matsuzawa Y, Goto K, Omuta K, Nakashima Y, Takeshita H, Sakamoto W (2002) Population structure of loggerhead turtles, Caretta caretta , nesting in Japan: bottlenecks on the Pacific population. Marine Biology 141:299-305.
Hatase H, Takai N, Matsuzawa Y, Sakamoto W, Omuta K, Goto K, Arai N, Fujiwara T (2002) Size-related differences in feeding habitat use of adult female loggerhead turtles Caretta caretta around Japan determined by stable isotope analyses and satellite telemetry. Marine Ecology Progress Series 233:273-281.
Hawkes L, Broderick A, Godfrey M, Godley B (2009) Climate change and marine turtles. Endangered Species Research 7:137-154.
Hawkes L a, Broderick AC, Coyne MS, Godfrey MH, Lopez-Jurado L-F, Lopez-Suarez P, Merino SE, Varo-Cruz N, Godley BJ (2006) Phenotypically linked dichotomy in sea turtle foraging requires multiple conservation approaches. Current biology : CB 16:990-5.
Hawkes LA, Broderick AC, Coyne MS, Godfrey MH, Lopez-Jurado L-F, Lopez-suarez P, Merino SE, Varo-cruz N, Godley BJ (2006) Report Phenotypically Linked Dichotomy in Sea Turtle Foraging Requires Multiple Conservation Approaches. Current Biology:990-995.
Hedrick P (2001) Conservation genetics: where are we now? Trends in Ecology & Evolution 16:629-636.
Hedrick PW, Parker KM, Miller EL, Miller PS (1999) Major histocompatibility complex variation in the endangered Przewalskiʼs horse. Genetics 152:1701-10.
Henwood TA (1987) Movements and seasonal changes in loggerhead turtle Caretta caretta aggregations in the vicinity of Cape Canaveral, Florida (1978-84). Biological Conservation 40:191-202.
Hirth HF, Hollingworth SL (1973) Report to the Government of the People’s Democratic Republic of Yemen on marine turtle management. United Nations Development Program nº TA3178.
Hoeglund J (2009) Evoltionary Conservation Genetics. Oxford University Press, USA.
Hughes (1974) The sea turtles of South-east Africa. 2. The biology of the Tongaland loggerhead turtle Caretta caretta with comments on the leatherback turtle Dermochelys coriacea and the green turtle Chelonia mydas in the study region. Invest. Rep. Oceanogr. Res. Inst. Durban 36:96.

68
Hughes AL, Nei M (1988) Pattern of nucleotide substitution at major histocompatibility complex class I loci reveals overdominant selection. Nature 335:167–170.
Hughes GR (1975) The marine turtles of Tongaland, VIII. Lammaergeyer 22:9-18.
IUCN (2007) Red list of threatened species. www.iucnredlist.org.
Janeway CJ, Travers P, Walport M, Shlomchik Ma (2001) Immunbiology: The Immune System in Health and Disease. Garland Science, New York.
Kalinowski S (2005) HP-Rare: A computer program for perfoming rarefreaction on measures of allelic diversity. Molecular Ecology Notes 5:187-189.
Kamezaki N (2003) What is a loggerhead turtle? The morphological perspective. In: Loggerhead sea turtles (Bolten, A.B. and Witherington, B.E.). pp 28-43.
Karl SA, Bowen BW, Avise JC (1992) Global population genetic structure and male-mediated gene flow in the green turtle (Chelonia mydas): RFLP analyses of anonymous nuclear loci. Genetics 131:163-173.
Kimura M (1983) The neutral theory of molecular evolution. Cambridge University Press.
Klein J (1986) Natural History of the Major Histocompatibility Complex. John Wiley and sons. New York.
Klein J, Satta Y, OʼhUigin C, Takahata N (1993) The molecular descent of the major histocompatibility complex. Annual Review of Immunology 11:269-295.
Klein J, Sato A, Nikolaidis N (2007) MHC, TSP, and the origin of species: from immunogenetics to evolutionary genetics. Annual Review of Genetics 41:281-304.
Kotas JE, Gallo BMG (2004) Incidental capture of loggerhead ( Caretta caretta ) and leatherback ( Dermochelys coriacea ) sea turtles by the pelagic longline fishery off southern Brazil. Fishery Bulletin 399:393-399.
Lawlor DA, Zemmour J, Ennis PD, Parham P (1990) Evolution of class-I MHC genes and proteins: from natural selection to thymic selection. Annual Review of Immunology 8:23-63.
Lenz TL, Becker S (2008) MHC and other highly polymorphic loci — Implications for evolutionary analysis. Gene.
Lenz TL, Eizaguirre C, Becker S, Reusch TBH (2009) RSCA genotyping of MHC for high-throughput evolutionary studies in the model organism three-spined stickleback Gasterosteus aculeatus. BMC Evolutionary Biology 13.
Librado P, Rozas J (2009) DnaSP v5: a software for comprehensive analysis of DNA polymorphism data. Bioinformatics (Oxford, England) 25:1451-2.

69
Limpus CJ, Miller JD, Paramenter CJ, Reimer D, McLachlan N, Webb R (1992) Migration of green (Chelonia mydas) and loggerhead (caretta caretta) turtles to and from eastern Australian rookeries. Wildlife Research 19:347-357.
Li W, Godzik A (2006) Cd-hit: a fast program for clustering and comparing large sets of protein or nucleotide sequences. Bioinformatics (Oxford, England) 22:1658-9.
Lohmann KJ, Lohmann C (2003) Orientation Mechanisms of Hatchling Loggerhead. Loggerhead sea turtles (Bolten, A.B. and Witherington, B.E.) Chapter 3.
Lopez-Jurado LF, Varo-cruz N, Lopez-Suarez P (2003) Incidental Capture of Loggerhead Turtles ( Caretta caretta ) on Boa Vista ( Cape Verde Islands ). Marine turtle newsletter:14-16.
Lopez-Jurado L-F, Evora C, Cabrera I, Cejudo D, Alfama P (2000) Proposals for the conservation of marine turtles on the Island of Boavista (Republic of Cabo Verde, western Africa). Proceedings of the 19th annual symposium on sea turtle conservation and biology. NOAA technical memorandum NMFS-SEFSC-443. South Padre Island, Texas, 1999:204-205.
Madsen T, Olsson M, Wittzell H, Stille B, Gullberg A, Shine R, Andersson S, Tegelstrom H (2000) Population size and genetic diversity in sand lizards (Lacerta agilis) and adders (Vipera berus). Biological Conservation 94:257-262.
Marco A, Lopez O, Abella E, Varo-Cruz N, Martins S, Goana S, Sanz P, Lopez-Jurado LF (2008) Massive capture of nesting females in severely threatening the Cabo Verdian loggerhead population. 28th Annual symposium on sea turtle biology and conservation, Loreto, Baja California Sur, Mexico, 19–26 January 2008.
Margaritoulis D, Argano R, Baran I, Bentivegna F, Bradai NM, Camiñas JA, Casale, P., De Metrio, G., Demetropoulos A, Gerosa G, Godley BJ, D.A. H, Joughton J, Laurent L, Lazar B (2003) Loggerhead turtles in the Mediterranean Sea: present knowledge and conservation perspective. In: Loggerhead sea turtles (Bolten, A.B. Witherington, B.E. (ed)). pp 175-198.
Meyers LA, Bull JJ (2002) Fighting change with change: adaptive variation in an uncertain world. Trends in Ecology & Evolution 17:551-557.
Meylan AB, Bowen BW, Avise JC (1990) A genetic test of the natal homing versus social facilitation models for green turtle migration. Science 248:724-727.
Milinski M (2006) The Major Histocompatibility Complex, Sexual Selection, and Mate Choice. Annual Review of Ecology, Evolution, and Systematics 37:159-186.
Miller HC, Miller K a, Daugherty CH (2008) Reduced MHC variation in a threatened tuatara species. Animal Conservation 11:206-214.
Miller HC, Belov K, Daugherty CH (2006) MHC Class I genes in the Tuatara (Sphenodon spp.): evolution of the MHC in an ancient reptilian order. Molecular biology and evolution 23:949-56.

70
Miller HC, Moore J a, Nelson NJ, Daugherty CH (2009) Influence of major histocompatibility complex genotype on mating success in a free-ranging reptile population. Proceedings. Biological sciences / The Royal Society 276:1695-704.
Mittelstaedt E (1991) The ocean boundary along the northwest African coast: Circulation and oceanographic properties at the sea surface. Progress In Oceanography 26:307-355.
Monzón-Argüello C, Muñoz J, Marco A, López-Jurado LF, Rico C (2008) Twelve new polymorphic microsatellite markers from the loggerhead sea turtle (Caretta caretta) and cross-species amplification on other marine turtle species. Conservation Genetics 9:1045-1049.
Monzón-Argüello C, Rico C, Carreras C, Calabuig P, Marco A, López-Jurado LF (2009) Variation in spatial distribution of juvenile loggerhead turtles in the eastern Atlantic and western Mediterranean Sea. Journal of Experimental Marine Biology and Ecology 373:79-86.
Monzón-Argüello C, Rico C, Naro-Maciel E, Varo-Cruz N, López P, Marco A, López-Jurado LF (2010) Population structure and conservation implications for the loggerhead sea turtle of the Cape Verde Islands. Conservation Genetics.
Moritz C (1994) Defining “Evolutionarily Significant Units” for conservation. Trends in ecology & evolution (Personal edition) 9:373-5.
Musick JA, Limpus CJ (1997) Habitat utilization and migration in juvenile sea turtles. In: Lutz PL, Musick JA (eds) The Biology of Sea Turtles. CRC Pres, Boca Raton, pp 137-164.
Nei M (1987) Molecular Evolutionary Gentics. Columbia University Press, New York.
Nei M, Gu X, Sitnikova T (1997) Evolution by the birth-and-death process in multigene families of the vertebrate immune system. Proceedings of the National Academy of Sciences of the United States of America 94:7799-7806.
Nowak MA, Tarczy-Hornoch K, Austyn JM (1992) The optimal number of major histocompatibility complex molecules in an individual. Proceedings of the National Academy of Sciences of the United States of America 89:10896-10899.
Olsson M, Madsen T, Nordby J, Wapstra E, Ujvari B, Wittsell H (2003) Major histocompatibility complex and mate choice in sand lizards. Proceedings. Biological sciences / The Royal Society 270 Suppl :S254-6.
Ottová E, Simkova A, Jurajda P, Dávidová M, Ondračková M, Pecʼinková M, Gelnar M (2005) Sexual ornamentation and parasite infection in males of common bream (Abramis brama): a reflection of immunocompetence status or simple cost of reproduction. Evolutionary Ecology Research 7:581-593.

71
Petersen S, Nel D, Omardien A (2007) Towards an Ecosystem Approach to Longline Fisheries in the Benguela: An assesment of impacts on seabirds, sea turtles and sharks. WWF South Africa Report Series – 2007/Marine/001.
Piertney SB, Oliver MK (2006) The evolutionary ecology of the major histocompatibility complex. Heredity 96:7-21.
Pinedo M, Polacheck T (2004) Sea turtle by-catch in pelagic longline sets off southern Brazil. Biological Conservation 119:335-339.
Potts WK, Slev PR (1995) Pathogen-Based Models Favoring MHC Genetic Diversity. Immunological Reviews 143:181-197.
Pritchard JK, Stephens M, Donnelly P (2000) Inference of population structure using multilocus genotype data. Genetics 155:945-59.
Pritchard PCH, Trebbau P (1984) The turtles of Venezuela. Contributions in Herpetology 2, Society for the Study of Amphibians and Reptiles. Fundacion de Internados Rurales, Caracas, Venezuela.
Reis EC, Soares LS, Vargas SM, Santos FR, Young RJ, Bjorndal K a, Bolten a B, Lôbo-Hajdu G (2009) Genetic composition, population structure and phylogeography of the loggerhead sea turtle: colonization hypothesis for the Brazilian rookeries. Conservation Genetics 11:1467-1477.
Reusch TB, Häberli M a, Aeschlimann PB, Milinski M (2001) Female sticklebacks count alleles in a strategy of sexual selection explaining MHC polymorphism. Nature 414:300-2.
Robinson J, Waller MJ, Parham P, Groot ND, Bontrop R, Kennedy LJ, Stoehr P, Marsh SGE (2003) IMGT / HLA and IMGT / MHC : sequence databases for the study of the major histocompatibility complex. Nucleic Acids Research 31:311-314.
Ross JP (1997) ESTIMATIONS OF THE NESTING POPULATION SIZE OF LOGGERHEAD SEA TURTLES, CARETTA CARETTA, MASIRAH ISLAND, SULTANATE OF OMAN. NOAA Technical Memorandum NMFS SEFSC [NOAA Tech. Mem. NMFS SEFSC]-PROCEEDINGS OF THE SEVENTEENTH ANNUAL SEA TURTLE SYMPOSIUM 415:91-92.
Santos Loureiro N (2008) Sea Turtles in Santiago Island , Cape Verde. Marine turtle newsletter 120:6-8.
Sarmiento-Ramírez JM, Abella E, Martín MP, Tellería MT, López-Jurado LF, Marco A, Diéguez-Uribeondo J (2010) Fusarium solani is responsible for mass mortalities in nests of loggerhead sea turtle, Caretta caretta, in Boavista, Cape Verde. FEMS Microbiology Letters 312:192-200.
Schleich H (1979) Sea Turtle Protection Needed at the Cape Verde Islands. Archives:2011-2011.

72
Schneider S, Excoffier L (1999) Estimation of past demographic parameters from the distribution of pairwise differences when the mutation rates vary among sites: application to human mitochondrial DNA. Genetics 152:1079-89.
Seddon JM, Ellegren H (2004) A temporal analysis shows major histocompatibility complex loci in the Scandinavian wolf population are consistent with neutral evolution. Proceedings of the Royal Society B Biological Sciences 271:2283-2291.
Shamblin BM, Faircloth BC, Dodd M, Wood-Jones A, Castleberry SB, Carroll JP, Nairn CJ (2007) Tetranucleotide microsatellites from the loggerhead sea turtle (Caretta caretta). Molecular Ecology Notes 7:784-787.
Shannon LV (1985) The Bengula Ecosystem. Part. I. Evolution of the Benguela phyisical feautures and processes. OCeanography and Marine BiologyAnnual reviews 23:105-182.
Siddle HV, Kreiss A, Eldridge MDB, Noonan E, Clarke CJ, Pyecroft S, Woods GM, Belov K (2007) Transmission of a fatal clonal tumor by biting occurs due to depleted MHC diversity in a threatened carnivorous marsupial. Proceedings of the National Academy of Sciences of the United States of America 104:16221-6.
Siddle HV, Marzec J, Cheng Y, Jones M, Belov K (2010) MHC gene copy number variation in Tasmanian devils: implications for the spread of a contagious cancer. Proceedings. Biological sciences / The Royal Society:2001-2006.
Sommer S (2005) The importance of immune gene variability (MHC) in evolutionary ecology and conservation. Frontiers in zoology 2:16.
Soule M (1980) Thresholds for survival: Maintaining fitness and evolutionary potential. In: Soule ME, Wilcox BA (eds) Conservation Biology: An Evolutionary-Ecological Perspective. Sinauer Associates, Sunderland, Mass., pp 151-169.
Spielman D, Brook BW, Frankham R (2004) Most species are not driven to extinction before genetic factors impact them. Proceedings of the National Academy of Sciences of the United States of America 101:15261-4.
Spurgin LG, Richardson DS (2010) How pathogens drive genetic diversity: MHC, mechanisms and misunderstandings. Proceedings. Biological sciences / The Royal Society 277:979-88.
Tajima F (1989) Statistical method for testing the neutral mutation hypothesis by DNA polymorphism. Genetics 123:585-95.
Taylor H, Cozens J (2010) The effects of tourism , beachfront development and increased light pollution on nesting Loggerhead turtles Caretta caretta ( Linnaeus , 1758 ) on Sal , Cape Verde Islands. Zoologia Caboverdiana 1:100-111.
TEWG (2000) Asessment update for the Kemp`s ridley and loggerhead seat turtle popualtion in the western North Atlantic. NOAA Technical Memorandum NMFS-SEFSC, 444.

73
Tiwari M, Bjorndal K (2000) Variation in morphology and reproduction in loggerheads, Caretta caretta, nesting in the United States, Brazil, and Greece. Herpetologica.
Trowsdale J (1993) Genomic structure and function in the MHC. Trends in Genetics 9:117-122.
Varo-Cruz N (2010) Biologia Reproductora de la tortuga boba en la isla de Boavista, archipelago de Cabo Verde. Universidad de las Palmas de Gran Canaria. Doctoral Thesis.
Vidović D, Matzinger P (1988) Unresponsiveness to a foreign antigen can be caused by self-tolerance. Nature 336:222-225.
Wegner KM, Kalbe M, Kurtz J, Reusch TBH, Milinski M (2003) Parasite selection for immunogenetic optimality. Science (New York, N.Y.) 301:1343.
Weir CR, Ron T, Morais M, Duarte ADC (2007) Nesting and at-sea distribution of marine turtles in Angola, West Africa, 2000–2006: occurrence, threats and conservation implications. Oryx 41:224-231.
Witherington B (2002) Ecology of neonate loggerhead turtles inhabiting lines of downwelling near a Gulf Stream front. Marine Biology 140:843-853.
Woelfing B, Traulsen A, Milinski M, Boehm T (2009) Does intra-individual major histocompatibility complex diversity keep a golden mean? Philosophical Transactions of the Royal Society of London - Series B: Biological Sciences 364:117-128.
Wyneken J, Salomon M (1992) Frenzy and postfrenzy swimming activity in loggerhead, green and leatherback hachling sea turtles. Copeia 1992:478-487.
Yamazaki K, Boyse EA, Miké V, Thaler HT, Mathieson BJ, Abbott J, Boyse J, Zayas ZA, Thomas L (1976) Control of mating preferences in mice by genes in the major histocompatibility complex. The Journal of Experimental Medicine 144:1324-1335.

74
Appendix
Locus Primer sequence (5’ 3’)
LCM15382 GCTTAACCCTAAAGCATTGG
H950 GTCTCGGATTTAGGGGTTTG
Cc-2 F CCCCCATAACACCACATCTC
Cc–2 R AGGTCACAAATGGAGCAAGC
Cc-10 F TCCACATGGGGTTGTATGAA
Cc-10 R TGCCCTCCTTGAGAATTCAG
Cc-17 F CCACTGGAAGTCTAAGAAGAGTGC
Cc-17 R GGAATTGAAGGGATTTTGCT
Cc2G10 F CAGTCGGGCGTCATCAGTGGCAAG
GTCAAATACAG
Cc2G10 R GTTTGCCCTTATTTGGTCACAC
Cc2H12 F CAGTCGGGCGTCATCATCTTCAGG
AGTTTTTGACTTG
Cc2H12 R GTTTCCACACCCCTGTTTCAGA
Cc-22 F CCCCCACTGCTTTAACTTCA
Cc-22 R TATTCCAACATGCCCACAGA
Cc-17 F CCACTGGAAGTCTAAGAAGAGTGC
Cc-17 R GGAATTGAAGGGATTTTGCT
Cc7C04 F GTTTCCTAACCAACGGAGAAACA
Cc7C04 R CAGTCGGGCGTCATCACTCCTTCAG
AAGTCTTCACAT

75
Acknowledgements
First of all, I want to thank Christophe Eizaguirre for being the best supervisor a student
can possible imagine. Thanks for the guidance, patience, always taking time when I had
problems, the friendship and the fun field trips we had. Incredible!
I also want to express my gratitude to all those all those people involved in the 3.5
months sample collection in Cape Verde. I want to thank the INDP, especially Sonia
Merino, Alciani, Sandra, Nelson and all the volunteers that helped in sample collection
and somehow managed to get almost every turtle nesting on the beaches. I also wish to
thank Jacquie Cozens and all the amazing volunteers from SOS Tartarugas in Sal for
helping in sample collection, letting me stay in the beautiful house and save many
turtles. My gratitude also goes to Christian Roeder from Turtle Foundation in Boavista,
who organized sampling on such a short notice and to all the volunteers from Turtle
Foundation who helped me in collecting samples.
I would also like to thank Andrea Frommel for helping during sample collection, gave
some very good comments on the written thesis and for always being there.
I also thank Katrin Beining for all the help and advice in the Lab, as well as Soeren Bolte
and Jan Dierking for fruitful discussions.
Specials thanks to my office mates, Sandra Vogel and Hendrik Schultz for all the good
times.
Finally my greatest gratitude goes to my parents, for supporting my through all these
years of study and for never ending love.
76
Statement
Hiermit bestätige ich, dass ich die vorliegende Arbeit selbstständig – abgesehen von der
Beratung durch meine akademischen Lehrer – und ohne Benutzung anderer als der
angegebenen Hilfsmittel angefertigt habe. Alle Stellen, die wörtlich oder sinngemäß aus
veröffentlichten und nicht veröffentlichten Werken entnommen sind, wurden als solche
kenntlich gemacht. Die Arbeit hat in gleicher oder ähnlicher Form noch keiner anderen
Prüfungsbehörde vorgelegen.
Ich versichere weiterhin, dass ich noch kein weiteres Diplomverfahren begonnen habe.
Diese Arbeit darf in der Bibliothek der Christian Albrechts Universität hinterlegt werden.
__________________ _______________________________________
Ort, Datum Victor Stiebens
Recommended