POLYMORPHISM OF PROLACTIN (PRL), DIACYLGLYCEROL ACYLTRANSFERASE (DGAT-1) AND BOVINE SOLUTE CARRIER FAMILY
35 MEMBER 3 (SLC35A3) GENES IN NATIVE CATTLE BREEDS AND ITS IMPLICATION FOR TURKISH CATTLE BREEDING
A THESIS SUBMITTED TO THE GRADUATE SCHOOL OF NATURAL AND APPLIED SCIENCES
OF MIDDLE EAST TECHNICAL UNIVERSITY
BY
EDA ŞEYMA KEPENEK
IN PARTIAL FULLFILMENT OF THE REQUIREMENTS FOR
THE DEGREE OF MASTER OF SCIENCE IN
BIOLOGY
NOVEMBER 2007

Approval of the thesis:
POLYMORPHISM OF PROLACTIN (PRL), DIACYLGLYCEROL ACYLTRANSFERASE (DGAT-1) AND BOVINE SOLUTE CARRIER
FAMILY 35 MEMBER 3 (SLC35A3) GENES IN NATIVE CATTLE BREEDS AND ITS IMPLICATION FOR TURKISH CATTLE BREEDING
submitted by EDA ŞEYMA KEPENEK in partial fulfillment of requirements for the degree of Master of Science in Biological Science Department, Middle East Technical University by, Prof. Dr. Canan Özgen Dean, Graduate School of Natural and Applied Science Prof. Dr. Zeki Kaya Head of Department, Biological Sciences Prof. Dr. İnci Togan Supervisor, Biological Sciences Dept., METU Examining Committee Members: Prof. Dr. Zeki Kaya Biological Sciences Dept., METU Prof. Dr. İnci Togan Biological Sciences Dept., METU Prof. Dr. Mesude İşcan Biological Sciences Dept., METU Prof. Dr. Okan Ertuğrul Veterinary Faculty, Ankara University Assoc. Prof. İrfan Kandemir Biology Department, Karaelmas University Date:
ii
I hereby declare that all information in this document has been obtained and presented in accordance with academic rules and ethical conduct. I also declare that, as required by these rules and conduct, I have fully cited and referenced all material and results that are not original to this work. Name, Last name: Eda Şeyma Kepenek
Signature:
iii

ABSTRACT
POLYMORPHISM OF PROLACTIN (PRL), DIACYLGLYCEROL
ACYLTRANSFERASE (DGAT-1) AND BOVINE SOLUTE CARRIER FAMILY
35 MEMBER 3 (SLC35A3) GENES IN NATIVE CATTLE BREEDS AND ITS
IMPLICATION FOR TURKISH CATTLE BREEDING
Kepenek, Eda Şeyma
M.Sc., Department of Biological Sciences
Supervisor: Prof. Dr. İnci Togan
November 2007, 68 pages
In the present study samples from four native Turkish Cattle Breeds; South
Anatolian Red (n= 48), East Anatolian Red (n= 34), Anatolian Black (n= 42) and
Turkish Grey (n=46) and elite bulls of Holstein (n=21) were genotyped with
respect to two milk production enhancer genes, Prolactin (PRL) and Diacylglycerol
acyltransferase (DGAT1), and one disease (Complex Vertebral Malformation)
causing gene (SLC35A3). A allele frequency for PRL gene, believed to be positively
associated with the milk yield in cattle, ranged between 0.5645 (Anatolian Black) -
0.7558 (South Anatolian Red). K allele frequency which is thought to be related
with the milk fat content in cattle varied between 0.7794 (East Anatolian Red) -
0.9250 (Anatolian Black). Complex Vertebral Malformation gene was not observed
in any of the examined individuals (n= 164), hence, SLC35A3 locus was
monomorphic.
iv
Pairwise Fst values based on the two polymorphic loci revealed that breeds are not
significantly different from each other with respect to these two genes. Correlations,
but weak, between the PRL A allele frequency and milk yield and similarly DGAT1
K allele and milk fat content was observed, Principle Component Analysis generated
two compound axis based on the two polymorphic loci. Positions of the breeds on
the first axis were correlated with the milk fat content of the breeds, perfectly.
Again, positions of the breeds on the second axis were correlated with the milk yield
of the breeds. Furthermore, PCA revealed that both A of PRL and K of DGAT1
genes seemed to have contributions in milk yield Results are believed to be useful
for the management efforts of Turkish native cattle breeds.
Keywords: Native Turkish cattle breeds, PRL, DGAT1, SLC35A3, PCA.
v
ÖZ
PRL (PROLACTIN), DGAT1 (DIACYLGLYCEROL ACYLTRANSFERASE-1)
VE SLC35A3 (BOVINE SOLUTE CARRIER FAMILY 35 MEMBER 3)
GENLERİNİN POLİMORFİZİMİNİN YERLİ SIĞIR IRKLARINDA
İNCELENMESİ VE TÜRK SIĞIR IRKLARININ ISLAHINDA
UYGULAMALARI
Kepenek, Eda Şeyma
Yüksek Lisans, Biyoloji Bölümü
Tez Yöneticisi: Prof. Dr. İnci Togan
Kasım 2007, 68 Sayfa
Sunulan çalışmada, dört yerli Türk sığır ırkı; Güney Anadolu Kırmızısı (n= 48),
Doğu Anadolu Kırmızısı (n=34), Yerli Kara (42), Bozırk (n=46) ve damızlık olarak
kullanılan Holstein (n=21) örnekleri, süt üretimini arttıran Prolaktin (PRL) ve
Diaçilgliserol açiltransferaz 1 (DGAT1) genleri ve sığırlarda görülen genetik resesif
bir hastalığa (Kompleks Vertebral Malformasyon) neden olan gen (SLC35A3)
açısından çalışılmıştır. Yüksek süt verimiyle ilgili olduğu düşünülen PRL geninin A
allelinin frekansının değeri 0.5645 (Yerli Kara) ile 0.7558 (Güney Anadolu
Kırmızısı) arasında değişmektedir. Sütteki yağ miktarıyla ilgili olduğu düşünelen
DGAT1 geninin K allelinin frekansının değeri 0.7794 (Doğu Anadolu Kırmızıs) ile
0.9250 (Yerli Kara) arasında değişmektedir. Kompleks Vertebral Malformasyon
geni, çalışılan hiç bir örnekte (n= 164) tespit edilmemiştir. Sonuç olarak SLC35A3
geninin monomorfik olduğu gözlenmiştir.
vi

İki polimorfik lokusa dayalı ikili Fst değerleri, ırkların bu iki gen açısından
biribirinden anlamlı bir şekilde farklı olmadığını göstermektedir. PRL A alleli
frekansı ve süt üretimi arasında ve DGAT1 K alleli frekansı ve süt yağı miktarı
arasında zayıf olmakla birlikte bir bağlantı gözlenmiştir. Temel öğeler analizi (PCA)
sonucunda iki polimorfik lokusa dayalı iki bileşik eksen oluşmuştur. Birinci
eksendeki ırkların konumu, ırkların sütteki yağ miktarıyla tam bir korelasyon
göstermiştir. Aynı şekilde ikinci eksendeki ırkların konumu, ırkların süt üretim
miktarıyla gene tam korelasyon göstermiştir. Ayrica, temel öğeler analizi süt
miktarina PRL A alleli gibi DGAT1 K allelinin de etkisi olabileceğini göstermiştir.
Sunulan çalışmanın sonuçlarının, yerli Türk sığır ırklarının iyileştirilmesine katkıda
bulunacağı düşünülmektedir.
Anahtar Kelimeler: Yerli Türk Sığır Irkları, PRL, DGAT1, SLC35A3, PCA
vii

To my brother Ali Kemal Kepenek…
viii

ACKNOWLEDGEMENTS
First of all, I wish to express my deepest gratitude to my supervisor Prof. Dr. İnci
Togan for her guidance, advice, criticism, encouragements and insight throughout
the research.
Foremost, I would like to thank to my parents; Zübeyde and Cihan Kepenek, my
brother, Hasan Kepenek and my aunt, Lale Kepenek Kavalcı for their help
encouragement and moral support. Honestly, I could not have completed this thesis
without you. Thanks for being with me.
Special appreciation and gratitude are also due to my friends Gül Fidan Sarıbay,
Sibel Mete and Nilüfer Aybar for their encouragement, reassurance and
understandin of me.
I would like to thank Havva Dinç for her infinite help and suggestions throughout
the research and while writing this thesis.
I want to thank Dr. Ceren Caner Berkman for the statistical analyses and her
limitless help during writing the thesis.
I would also thank Asist Prof. Emel Özkan her endless help and suggestion
throughout the research.
I want to thank Dr. Remziye Yılmaz who helped me in my problematic experiments.
ix

Finally, I want to thank my lab mates, Emel Özkan, Ceren Caner Berkman, Havva
Dinç, Çiğdem Gökçek and Eren Yüncü.
x
TABLE OF CONTENTS
ABSTRACT................................................................................................................iv
ÖZ...............................................................................................................................vi
ACKNOWLEDGEMENTS........................................................................................ix
TABLE OF CONTENTS............................................................................................xi
LIST OF FIGURES..................................................................................................xiii
LIST OF TABLES.....................................................................................................xv
LIST OF ABBREVIATION.....................................................................................xvi
CHAPTERS
1. INTRODUCTION...................................................................................................1
1.1 Prolactin (PRL), Diacylglcerol acyltransferase (DGAT1) and Complex
Vertebral Malformation (CVM) syndrome (SLC35A3) genes............................... 2
1.1.1 Prolactin (PRL) gene ...........................................................................2
1.1.2 Diacylglycerol acyltransferase -1 (DGAT1) gene ......................................4
1.1.3 Complex Vertebral Malformation (CVM) syndrome ................................6
1.2 The Objective of the Study ............................................................................... 8
2. MATERIALS AND METHODS...........................................................................10
2.1 Samples ........................................................................................................... 10
2.2 Laboratory Experiments.................................................................................. 11
2.2.1 DNA Extraction .......................................................................................11
2.2.2 Checking the Presence of DNA ...............................................................12
2.2.3 Amplification of PRL, DGAT1 and SLC35A3 Genes by Using Polymerase
Chain Reaction (PCR).......................................................................................13
2.2.4 Checking the Presence of PCR Products .................................................16
2.2.5 Enzyme Digestion and Detection of Genotypes ......................................17
xi

2.3 Statistical Analyses ......................................................................................... 21
2.3.1 Allele frequencies and heterozygosities...................................................21
2.3.2 The Fst analysis........................................................................................23
2.3.4 Principal Component Analysis (PCA) .....................................................24
3. RESULTS..............................................................................................................25
3.1 Results of the Laboratory Experiments........................................................... 25
3.1.1 DNA extraction ........................................................................................25
3.1.2 Genotyping...............................................................................................27
3.2 Results of Statistical Analyses ........................................................................ 34
3.2.1 Allele frequencies, heterozygosities and Hardy-Weinberg equilibrium..34
3.2.2 FST Statistics ...........................................................................................38
4. DISCUSSION................................................................................................42
4.1 PRL gene in Turkish breeds............................................................................ 44
4.2 DGAT1 Gene in Turkish breeds ..................................................................... 46
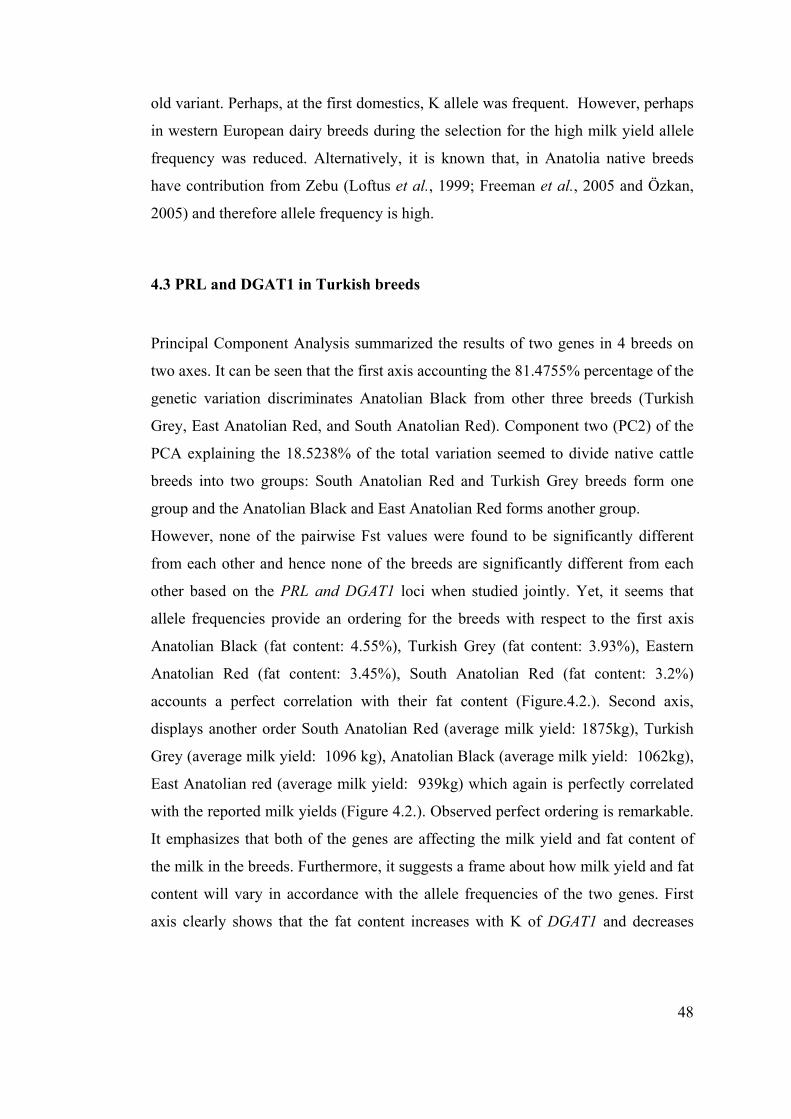
4.3 PRL and DGAT1 in Turkish breeds ............................................................... 48
4.4 CVM Disease (Complex Vertebral Malformation) ........................................ 50
REFERENCES..........................................................................................................53
APPENDIX A............................................................................................................61
xii
LIST OF FIGURES
Figure 2.1. The expected genotypes and the sizes of the expected restriction
fragments for the PRL gene on 6% polyacrylamide gel. .......................................... 17
Figure 2.2. The expected genotypes and the sizes of the expected restriction
fragments for the DGAT1 gene on 4% agarose gel. ................................................. 19
Figure 2.3 The expected genotypes and the sizes of the expected restriction
fragments for the SLC35A gene on 4% agarose gel. ................................................ 20
Figure 3.1. A check gel for total DNA extracts on 0.8% agarose gel. Those letters
and numbers shown above the wells are identification codes of the samples used
(such as, 1d: 1st sample of South Anatolian Red (d) breed)...................................... 26
Figure 3.2. Photograph of PCR amplification products of PRL gene on agarose gel.
Those letters and numbers shown above the wells are the identification codes of
used samples (such as, 27a: 27th sample of Turkish Grey (a) breed)........................ 28
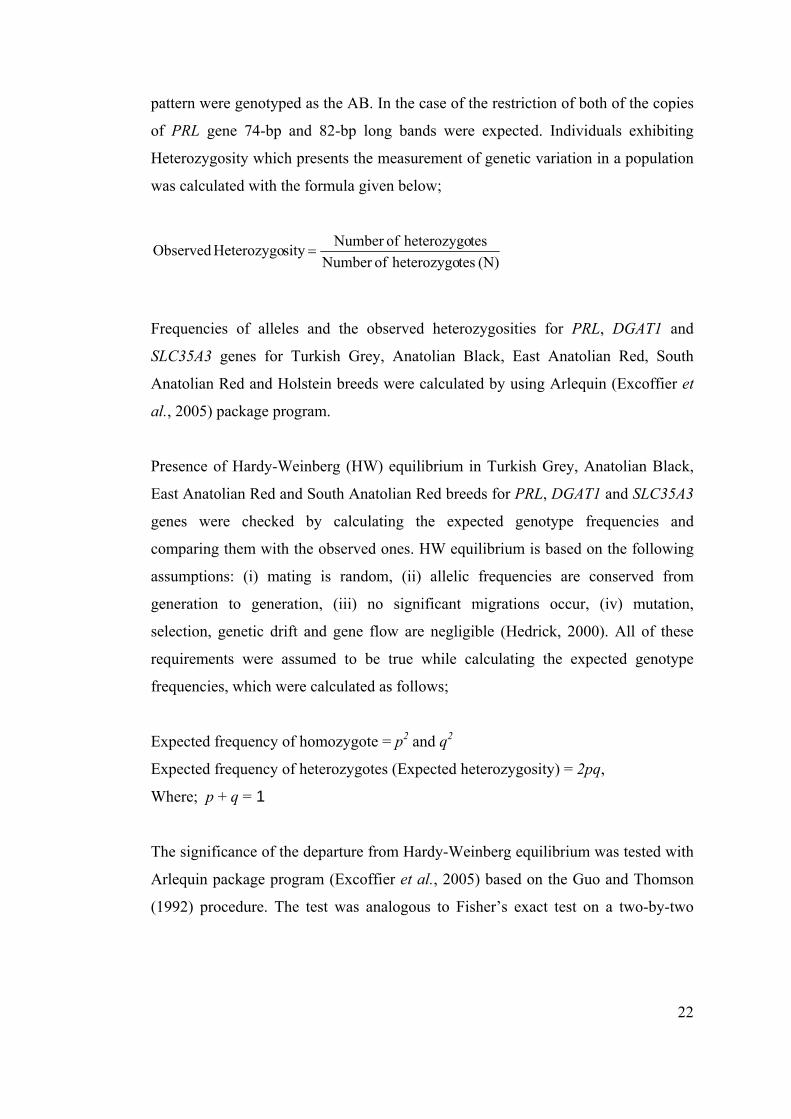
Figure 3.3. Photograph of digestion using products of PRL gene on polyacrylamide
gel. Those letters and numbers shown above the wells are the identification codes of
used samples (such as, 27a: 27th sample of Turkish Grey (a) breed)........................ 29
Figure 3.4. Photograph of PCR amplification products of DGAT1 gene on agarose
gel. Those letters and numbers shown above the wells are the identification codes of
used samples (such as, 2b: 2nd samples of East Anatolian Red (b) breed)................ 30
xiii
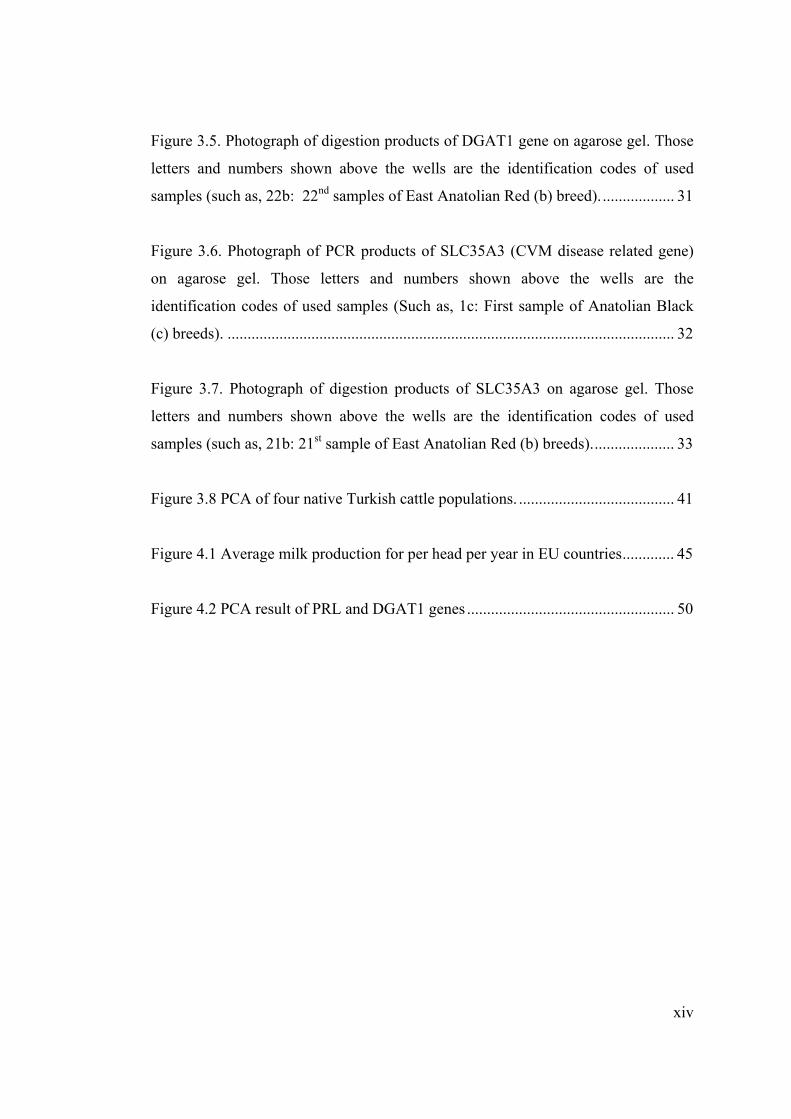
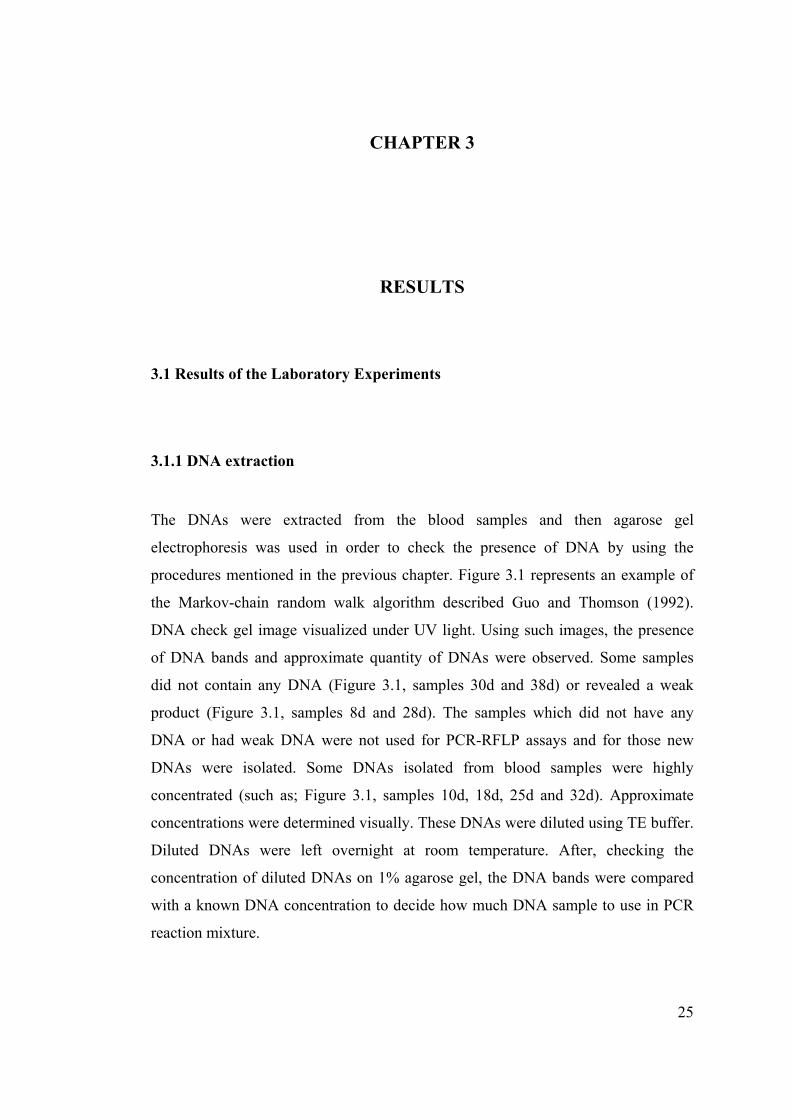
Figure 3.5. Photograph of digestion products of DGAT1 gene on agarose gel. Those
letters and numbers shown above the wells are the identification codes of used
samples (such as, 22b: 22nd samples of East Anatolian Red (b) breed)................... 31
Figure 3.6. Photograph of PCR products of SLC35A3 (CVM disease related gene)
on agarose gel. Those letters and numbers shown above the wells are the
identification codes of used samples (Such as, 1c: First sample of Anatolian Black
(c) breeds). ................................................................................................................ 32
Figure 3.7. Photograph of digestion products of SLC35A3 on agarose gel. Those
letters and numbers shown above the wells are the identification codes of used
samples (such as, 21b: 21st sample of East Anatolian Red (b) breeds)..................... 33
Figure 3.8 PCA of four native Turkish cattle populations. ....................................... 41
Figure 4.1 Average milk production for per head per year in EU countries............. 45
Figure 4.2 PCA result of PRL and DGAT1 genes .................................................... 50
xiv
LIST OF TABLES
Table 2.1. The number of collected samples, number of samples genotyped for each
locus (PRL, DGAT1, and SLC35A3) and number of samples genotyped for at least
two loci...................................................................................................................... 11
Table 2.2. PCR condition of the PRL gene............................................................... 14
Table 2.3. PCR condition of the DGAT1 gene. ........................................................ 15
Table 2.4. PCR condition of the DGAT1 gene. ........................................................ 16
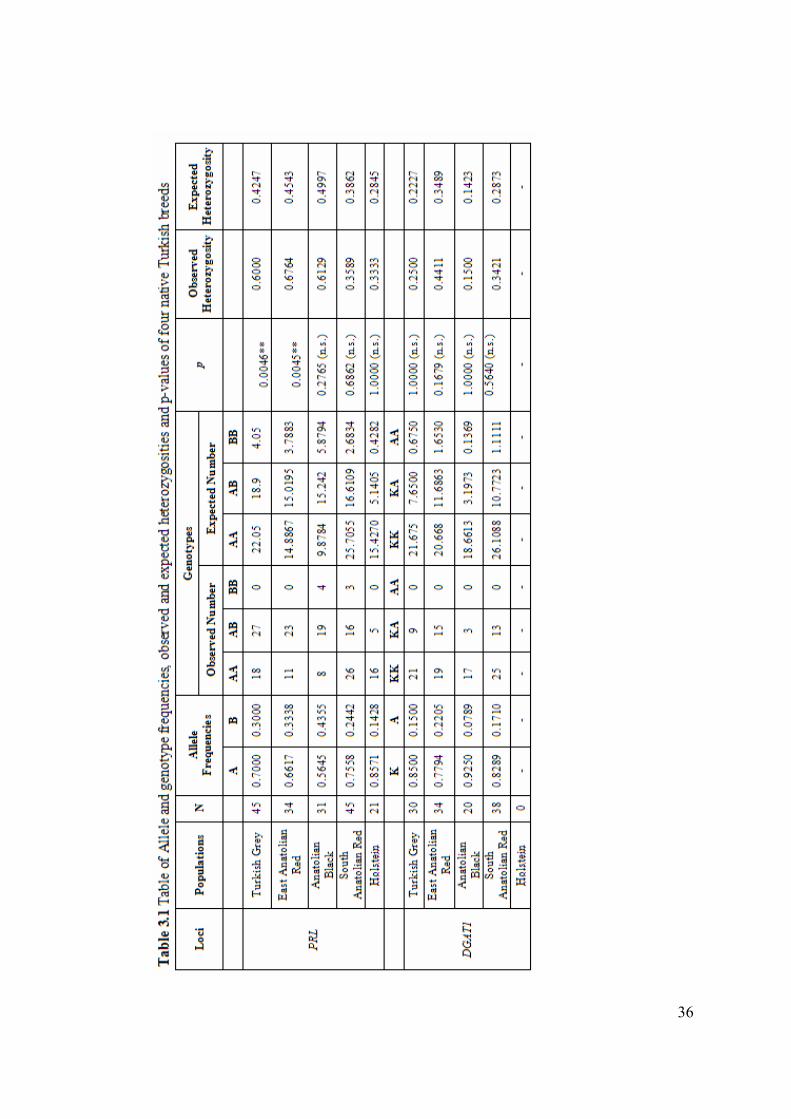
Table 3.1. Table of Allele and genotype frequencies, observed and expected
heterozygosities and p-values of four native Turkish breeds.................................... 35
Table 3.2. FST values of five native Turkish cattle breeds based on PRL gene ........ 38
Table 3.3. FST values of four native Turkish cattle breeds based on DGAT1 gene .. 39
Table 3.4. FST values of four native Turkish cattle breeds based on two loci (PRL
and SLC35A3). ......................................................................................................... 39
xv

LIST OF ABBREVIATIONS
Β: Beta
κ: Κ
°C: Degrees Celsius µl: microliter
µM: Micromolar
A: Adenine
bp: base pair
C: Citosine
ddATP: Dideoxyadenosine Triphosphate
ddCTP: Dideoxycytidine Triphosphate
ddGTP: Dideoxyguanosine Triphosphate
ddNTP: Dideoxynucleotide Triphosphate
ddTTP: Dideoxythymidine Triphosphate
DGAT1: Diacylglycerol acyltransferase 1
dH2O: Distilled water
DNA: Deoxyribonucleic acid
DnaSP: DNA Sequence Polymorphism
dNTP: Deoxyribonucleotide Triphosphate
EDTA: Ethylene diamine tetra acetic acid
EtOH: Ethanol
e.g: For example
G: Guanine
K3EDTA: Potassium EDTA
MgCl2: Magnesium Chloride
mg: miligram
ml: Mililiter
mM: Milimolar
xvi
M: Molar
NaAc: Sodium Acetate
ng: Nanogram
pca: Principle Component Analysis
PCR: Polymerase Chain Reaction
PRL: Prolactin gene
pp: Page
pmol: picomoles
Rpm: Rotations per minute
S: Segregating Sites
SDS: Sodium dodecyl sulfate
SLC35A3: bovine solute carrier family 35 member 3 gene
T: Tymine
TAE Buffer: Tris Acetate EDTA Buffer
UV: Ultra Violet
V: Volt
xvii

CHAPTER 1
INTRODUCTION
Cattle belong to the Bovidae family which appeared in the Miocene approximately
20 MYA, during the evolution of mammals. Ancestral species of domesticated cattle
was Bos primigenius. Bos primigenius believed to harbor two taxa, Bos taurus and
Bos indicus (Bradley et al., 2005). It is known that for the individuals of the species
of pre-domesticated ones are bigger in size compared to domestics. Hence, size
reduction is considered as one of the signs of domestication. From the archeological
finds, it was observed that first size reduction in Bos taurus (European taurine cattle)
was observed in the middle west banks of Euphrates River (Peters et al., 1999
referred by Bradley et al., 2005) within the Mid Pre-Pottery Neolithic B (ca. 8500
BP uncalibrated). Domestics at the center of domestication must be harboring the
highest level of genetic diversity. It can be anticipated that, diversity was reduced
due to migration in the direction away from the domestication center by the founders
(Nichols et al., 2001).
As in this line, it is known that European domestic cattle, almost exclusively, went
from Anatolia (Troy et al., 2001) and they have low level of diversity (Loftus et al.,
1999) Because of the geographic proximity of the Turkish native breeds to the
region of putative domestication area of European cattle, they might still be
harboring high level of genetic diversity as supported by a recent study (Freeman et
1

al., 2005) and presumably at least part of this diversity is the “raw” diversity and has
the potential to serve for the humans in the future especially under new emerging
environments. Therefore, Turkish native breeds must have high priority in
conservation (Bruford et al., 2003).
However, recently, Turkish native cattle breeds have been widely inseminated with
semen of elite bulls, predominantly by Holstein bulls. Primary purpose of this
introgression is to increase the milk yield in cattle in Turkey. During this
introgression process gene pools of Turkish native breeds must be changing.
Fertilization of native cows with relatively few males must be reducing the effective
population size of the gene pools and therefore genetic diversity might be in loss
with a high rate. Furthermore, some alleles which could be used in the future might
be in the process of loss. To understand the effect of introgression, composition of
genetic diversity for many loci must be determined and monitored. In the present
study, the state of diversity in four native Turkish cattle breeds; Turkish Anatolian
Black, South Anatolian Red, East Anatolian Red and Turkish Grey and in improved
breeds of Holstein breed with respect to PRL and DGAT1 and SLC35A3 genes
were tried to be determined. Further, follow up studies will document the rate of
change in the gene pools with respect to the genes under consideration.
1.1 Prolactin (PRL), Diacylglcerol acyltransferase (DGAT1) and Complex
Vertebral Malformation (CVM) syndrome (SLC35A3) genes
1.1.1 Prolactin (PRL) gene
Prolactin, pertaining the Prolactin/ Growth Hormone/ Placental Lactogen Family, is
a polypeptide hormone which is synthesized in and secreted from specialized cells
of the anterior pituitary gland, the lactotrophs (referred by Freeman et al., 2007). It
2
was found in many mammals including rats, primates, rodents, sheep, pig, mice and
human. Also it was synthesized by many organs other than anterior pitutary gland:
Brain, placenta, amnion, decidua, uterus and mammary gland. It had major role in
lactogenesis, lactation, mammary growth (Kopecny et al., 1998 referred by Skinkyte
et al., 2005).
Bovine Prolactin gene (PRL) is located on chromosome 23 and composed of five
exons and four introns (Camper et al., 1984 referred by Skinkyte et al., 2005). A
silent A-G mutation in codon for amino acid 103 in exon 3 of bovine PRL gene led
to a polymorphic RsaI site (Lewin, 1992 referred by Skinkyte et al., 2005). Lewin et
al. (1992) first presented the polymorphism laeding RsaI enzyme restriction site of
Bovine PRL gene which affects the milk production traits including milk yield, milk
fat yield and milk protein yield. Later, significant effect of PRL locus on milk
production traits was exhibited by Chung et al. (1996, referred by Dybus, 2002).
Distribution of PRL- RsaI allele, A allele of Prolactin gene (PRL) in cattle breeds
were studied by many researchers. A allele frequency for many breeds were given
below. Udina et al., (2001) showed that A allele frequencies of PRL gene were 91.4,
85.9 and 80.0 in Gorbatov Red breed, Ayrishire breed and Black Pied breed,
respectively. Another study on this subject was done by Dybus (2002). A allele
frequencies of PRL gene were 0.85, 0.85, 0.86, 0.83 and 0.88 in Kosierzewo,
Nowielice, Smardzewo, Trzebusz and Ostrowiec breeds, respectively. In the study
done by Skinkyte et al., (2005), A allele frequencies were 0.79 and 0.87 in
Lithuanian Black and White and Lithuanian Red breeds, respectively.
Polymorphism of PRL gene in Argentina and Bolivian Creole cattle was studied by
Liron et al., (2002). Results indicated that A allele frequencies of PRL gene were
0.96, 0.95, 0.81, 0.98, 1.00 and 0.90 in Argentine Creole, Patagonian Creole,
Saavedreno, Chaqueno, Boliviano, Yacumeno and Chusco breeds respectively.
Similarly, in Khatami et al.’s (2005) study A allele frequencies of PRL gene were
found 0.95, 0.61 and 0.65 in Russian Black and White, German Black and White
and Yaroslavl breeds, respectively. Again, distribution of polymorphism of PRL
3

gene was studied by Miceikiene et al., (2006), A allele frequencies of PRL gene
were 0.97, 0.95, 0.77 and 0.85 in Lithuanian White Backed, Lithuanian Light Grey,
Lithuanian Red and Lithuanian Black and White breed, respectively in this study.
Finally, in two independent studies A allele frequency of PRL gene was high, 0.95
in Holstein breed which is a well known breed selected for high milk yield (Chung
et al., 1996 and Chrenek et al., 1998 referred by Miceikiene et al., 2006).
As it can be seen from the summarized data, based on the breeds examined, A allele
frequency is varying between 0.61 (German Black and White), 0.97 (Lithuanian
White Backed) in Europe and is more often towards the upper end of the range. And
there was no previous observation of PRL gene frequency in Turkish native breeds.
1.1.2 Diacylglycerol acyltransferase -1 (DGAT1) gene
Diacylglycerol acyltransferase1 (DGAT1) gene encodes an enzyme which plays a
major role in the synthesis of triglycerides. Triglycerides which are major
components of fat are formed by binding of diacylglycerol to long chain fatty acyl-
CoAs. This reaction is catalyzed by at least two enzymes. One of these enzymes is
encoded by DGAT1 (homolog1, mouse) (Cases et al. 2001 referred by Winter et al.,
2002). Lactation deficiency was observed in female mice lacking both copies of
DGAT1, probably as a result of impaired or deficient triglyceride synthesis in
mammary gland. After this observation DGAT1 gene was suggested as a functional
candidate gene for milk production traits (Smith et al., 2000 referred by Winter et
al., 2002). DGAT1 gene was localized on centromeric end of the bovine
chromosome 14. A base substitution (K232A) in the DGAT1 (the acyl-CoA:
diacylglycerol acyltransferase1) gene at position 10,433 and 10,434 in exon number
8 lead to QTL (quantitative trait loci) variation (Grisart et al., 2002). While Lysine
variant (K allele) of DGAT1 gene was associated with high fat yield, Alanine variant
(A allele) of DGAT1 gene was associated with high milk yield.
4

DGAT1 polymorphism was first detected by Spelman et al., (2002). In one of the
study Winter et al., (2002) it was observed that frequency of Lysine variant (K) was
ranging between 0.10 to 1.00 in the 16 breeds examined. Lowest K allele (Lysine)
frequency (0.1) was found in Fleckvieh breed (Bos taurus taurus) while highest K
allele frequency (1.0) was found in Water buffalo (Bubalus bubalus).
Another extensive study on this subject was performed by Kaupe et al., (2003). In
the study DGAT1 polymorphism in Bos indicus and Bos taurus cattle breeds were
analyzed using 1748 DNA samples of 38 different Bos taurus covering four native
Turkish cattle breeds and Bos indicus cattle breeds from 13 countries of five
continents. Kaupe et al., (2003) observed that beef breeds tended to exhibit higher
DGAT1 A allele frequencies, yet, in dairy cattle the range for the A allele was from
very low levels to unexpectedly high level. Turkish Anatolian Black, South
Anatolian Red, East Anatolian Red and Grey Step exhibited intermediate K allele
frequencies (21-38%). In another study, Polymorphism of DGAT1 variants and milk
production traits in German cattle breeds was studied by Thaller et al., (2003).
Frequencies of lysine variants were 0.072 and 0.548 in Fleckvieh and German
Holstein breeds, respectively. Lower lysine frequency of Fleckvieh breed was an
unexpected observation. Because, in the past Fleckvieh breed was the most preferred
for its milk content (including high fat) while German Holstein which contains
higher lysine frequency had higher milk yield. Presumably, observed results are due
to the recent selections towards the high milk yield for Fleckvieh and high content
for Holstein.
Another unexpected result was observed by Sanders et al., (2006). K allele
frequency of DGAT1 gene was 0.61 in German Angeln breed which was relatively
high for a European breed. Again it was proposed that high K allele frequency could
be the result of recent selection for the milk content traits in this breed.
5
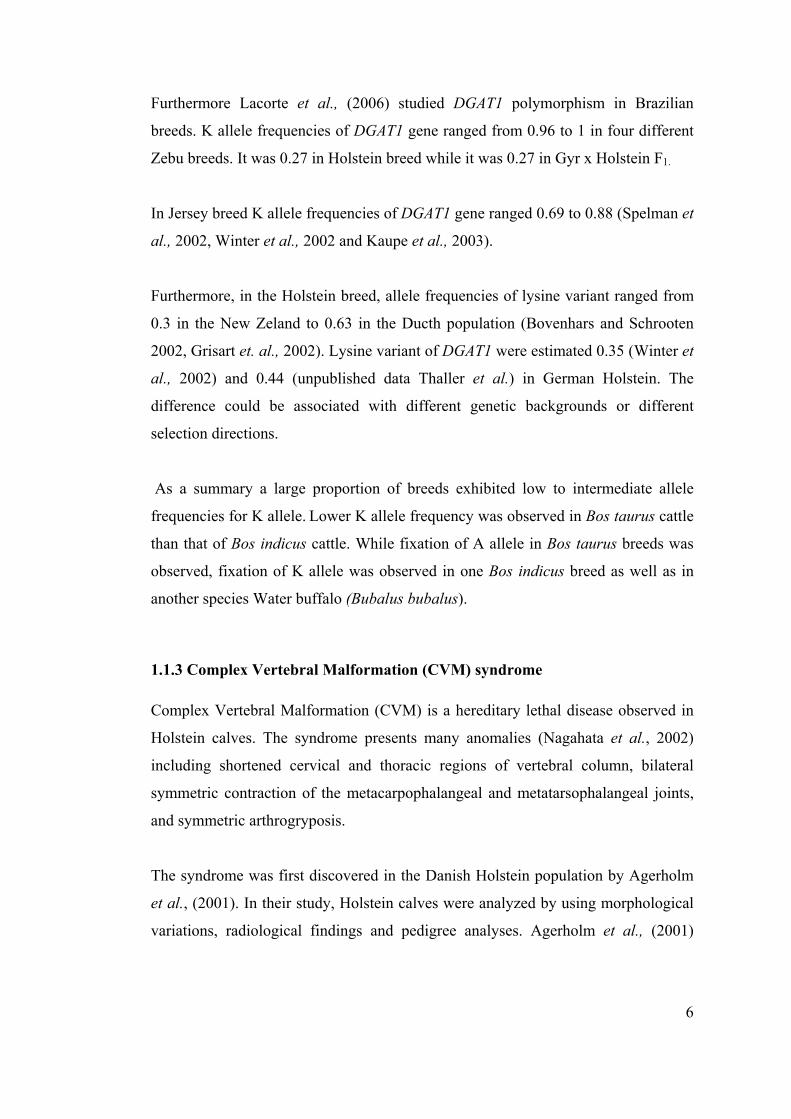
Furthermore Lacorte et al., (2006) studied DGAT1 polymorphism in Brazilian
breeds. K allele frequencies of DGAT1 gene ranged from 0.96 to 1 in four different
Zebu breeds. It was 0.27 in Holstein breed while it was 0.27 in Gyr x Holstein F1.
In Jersey breed K allele frequencies of DGAT1 gene ranged 0.69 to 0.88 (Spelman et
al., 2002, Winter et al., 2002 and Kaupe et al., 2003).
Furthermore, in the Holstein breed, allele frequencies of lysine variant ranged from
0.3 in the New Zeland to 0.63 in the Ducth population (Bovenhars and Schrooten
2002, Grisart et. al., 2002). Lysine variant of DGAT1 were estimated 0.35 (Winter et
al., 2002) and 0.44 (unpublished data Thaller et al.) in German Holstein. The
difference could be associated with different genetic backgrounds or different
selection directions.
As a summary a large proportion of breeds exhibited low to intermediate allele
frequencies for K allele. Lower K allele frequency was observed in Bos taurus cattle
than that of Bos indicus cattle. While fixation of A allele in Bos taurus breeds was
observed, fixation of K allele was observed in one Bos indicus breed as well as in
another species Water buffalo (Bubalus bubalus).
1.1.3 Complex Vertebral Malformation (CVM) syndrome Complex Vertebral Malformation (CVM) is a hereditary lethal disease observed in
Holstein calves. The syndrome presents many anomalies (Nagahata et al., 2002)
including shortened cervical and thoracic regions of vertebral column, bilateral
symmetric contraction of the metacarpophalangeal and metatarsophalangeal joints,
and symmetric arthrogryposis.
The syndrome was first discovered in the Danish Holstein population by Agerholm
et al., (2001). In their study, Holstein calves were analyzed by using morphological
variations, radiological findings and pedigree analyses. Agerholm et al., (2001)
6

pointed out that all CVM cases took place in a familial pattern with extensive
inbreeding because affected calves were progeny of apparently normal parents. It
was suspected that there was a homozygous locus having alleles originated from
common ancestor. The bull Carlin-M Ivanhoe Bell was used worldwide because of
superior lactation performance. It is believed that he and his daughters are
responsible in distributing the syndrome worldwide. Shortly after identification of
CVM in Denmark Holstein population, many cases were reported about existence of
CVM in the United States, the United Kingdom, and in Japan (Duncan et al., 2001,
Revell, 2001, Nagahata e. al., 2002 referred by Thomsen et al., 2005). Genetic
identification of the gene which is responsible for the CVM disease was done by
Bendixen et al., (2002). Now, it is known that the syndrome is autosomal
recessively inherited defect and a G to A point mutation at nucleotide position 559
of the bovine solute carrier family 35 member 3 (SLC35A3) led to this disease
(Thomsen et al., 2005).
When Nielsen et al., (2002) and Malher et al., (2006) analyzed the effect of fertility
traits in CVM carrier cows they observed that risk of return to service increases and
frequency of calving after first insemination were reduced, in Holstein cattle.
Furthermore, 93% of CVM affected calves died before the end of the gestation
period and many of the fetuses were aborted after 100-120 days conception. At this
phase of lactation a cow did not maintain a high yield until the following calving.
Furthermore, Agerholm et al., (2004) showed that incidence of CVM affected calves
is less than that of expected, possibly due to the high intrauterine mortality. Because
of all these reasons, culling ratio of cows was highly increased in these carrier cows.
population size of the gene pools and therefore genetic diversity might be in loss
with a high rate. Furthermore, some alleles which could be used in the future might
be in the process of loss. To understand the effect of introgression, composition of
genetic diversity for many loci must be determined and monitored. In the present
study, the state of diversity in four native Turkish cattle breeds; Turkish Anatolian
Black, South Anatolian Red, East Anatolian Red and Turkish Grey and in elite bulls
of Holstein breed with respect to PRL and DGAT1 and SLC35A3 genes were tried
7
to be determined. Further, follow up studies will document the rate of change in the
gene pools with respect to the genes under consideration.
1.2 The Objective of the Study
Nowadays, molecular genetic markers are widely used for characterization of milk
production traits in dairy cattle, and also they are used for detection of genetically
inherited diseases.
The milk production Prolactin (PRL) and Diacylglycerol acyltransferase (DGAT1)
genes are the two major genetic markers used for the characterization of milk
production traits. On the other hand, Complex Vertebral Malformation (CVM) is the
autosomal, recessively inherited lethal disease due to a point mutation in SLC35A3
gene. Hence, the form of the products of these 3 genetic markers (PRL, DGAT1 and
SLC35A3) is economically important in cattle and must be examined in native
Turkish cattle breeds. If for example A allele frequency of PRL is low, to have a
higher milk yield it might be subjected to a directional selection to increase its
frequency in Turkish cattle. On the other hand introgression of Holstein into Turkish
breeds might be introducing CVM related allele which might be causing economical
harms through the carrier cows.
In the present study genetic characterization of four native Turkish breeds (Grey
Step, East Anatolian Red, Native Black and South Anatolian Red) and elite bulls of
Holstein breed which is sampled from Cattle Breeders Association of Turkey were
done with respect to PRL, DGAT1 and SLC35A3 genes. Results were employed to
comparatively evaluate the milk yield and fat content properties of native breeds and
those of other breeds which are available in the literature with respect to the two
loci: PRL and DGAT1. Also, potential threat for the contamination of native gene
pools by the genes from Holstein breed with respect to CVM related allele of
SLC35A3 gene was discussed. Produced data is believed to contribute in
8
conservation and management of Turkish native cattle breeds, which are the
reservoirs of genetic diversity known to have prime importance for the future of
humankind.
9
CHAPTER 2
MATERIALS AND METHODS
2.1 Samples
In the present study, four native Turkish cattle breeds were examined. Their
distribution is as follows: South Anatolian Red (SAR) is found in South of Taurus
Mountains and South Anatolia. Turkish Grey (TG) is distributed in Thrace and other
cities of North-West Anatolia; East Anatolian Red (EAR) is distributed in East and
North East Anatolia, whereas Anatolian Black (AB) can be found in Middle and
North Anatolia. Altogether, 170 individuals from native breeds were examined.
Samples of SAR breed were obtained from Çukurova Agricultural Research
Institute. Fourty two samples of AB breed were collected from the villages around
Çankırı and Kastamonu. Thirty four samples of EAR breed were obtained from
Institute of East Anatolian Agricultural Research. Fourty six samples of TG breed
were obtained from Marmara Agricultural Institute and from villages around the
Keşan. Twenty one samples of Holstein breeds were obtained from Lüleburgaz
Türkgeldi Agricultural Administration. The number of collected samples, number of
samples genotyped for each locus (PRL, DGAT1, and SLC35A3) was given in Table
2.1. All samples were collected by the two staff members of Namik Kemal
University; Prof. Dr. İhsan Soysal and Dr. Emel Özkan in 2002. Blood samples
were stored at +4 °C during the transportation and then stored at +4 °C until they
10

were used for DNA extraction. DNAs of 191 (170 native 21 Holstein) individuals
were genotyped for two milk performance enhancer genes, (PRL (n=176) and
DGAT1 (n= 122)) and one disease related gene (SLC35A3 (n=164)).
Table 2.1 The number of collected samples, number of samples genotyped for each locus (PRL, DGAT1, and SLC35A3) and number of samples genotyped for at least two loci.
Number of genotyped samples Breed
Number of
collected samples PRL DGAT1 SLC35A3
Number of samples
genotyped for at least two loci
Turkish Grey 46 45 30 40 28 East Anatolian Red 34 34 34 34 34 Anatolian Black 42 31 20 32 17 South Anatolian Red 48 45 38 37 31 Holstein 21 21 0 21 21
2.2 Laboratory Experiments
2.2.1 DNA Extraction
DNA isolation from whole blood sample was done by employing phenol-
chloroform-isoamylalcohol (25:24:1) extraction method. DNAs were extracted from
10 ml blood by using Sambrook et al.’s (1989) method.
Blood samples were collected in the tubes containing EDTA to prevent coagulation
and completed up to 50 ml with 2X lysis buffer to lyses the red blood cells. Tubes
11
were mixed for 10 minutes by inversion and then centrifuged at 3000 rpm for 10
minutes at +4 °C to precipitate nuclei. The pellet was resuspended in 3 ml of salt-
EDTA buffer by vortex. Then 0.3 ml of 10% SDS and 150 µl proteinase-
K(10mg/ml) were added and the tubes were incubated at 55 °C for 3 hours. After the
incubation, 3ml phenol was added and this mixture was centrifuged at 3000 rpm for
10 minutes at +4 °C. The supernatant was transferred to new falcon tubes mixed
with 3 ml phenol–chloroform–isoamylalcohol solution (25:24:1) and centrifuged at
3000 rpm for 10 minutes at +4 °C. Then the upper phase was collected carefully and
transferred into a new glass tube by a transfer pipette. About 2 volumes of ethanol
were added to precipitate the DNA. Then mixture was mixed gently by inversion.
After that, precipitate was hooked out. Finally, precipitated DNA was dissolved in
0.5 ml of 10 mM Tris and 1mM EDTA solution (pH: 7.5). After isolation, DNA was
stored at -20 ºC.
2.2.2 Checking the Presence of DNA
After DNA extraction, existence and concentration of DNA was checked by agarose
gel electrophoresis. 0.8% agarose gel was prepared by boiling agarose in 0.5X Tris-
Boric Acid-EDTA (TBE) buffer. The prepared gel was poured into an
electrophoresis plate and left at room temperature for about 30 minutes for
polymerization. 1µl of newly isolated genomic DNA, 6 µl of 6X loading buffer
(bromophenol blue dye) and 6 µl of dH2O were mixed and then loaded into the wells
of the gel. The DNAs were run on agarose gel at 100 V for about 30 minutes in 0,5X
TBE buffer, stained in 0.5 µl/ml ethidium bromide (Et-Br) solutions and then was
visualized under UV light. The presence or absence of smears and migration patterns
of the bands on the gel corresponds to presence and the quality of DNA.
12

2.2.3 Amplification of PRL, DGAT1 and SLC35A3 Genes by Using Polymerase
Chain Reaction (PCR)
The polymerase chain reaction (PCR) is a technique widely used in molecular
biology. The procedure consists of 3 main steps: denaturation, annealing and
extension. In the denaturation step, double stranded DNA is dissociated into single
strands and then in the annealing step, primers are annealed to single stranded
DNAs. After that, in the extension step, oligonucleotide primers are extended in the
5'- to- 3' direction by Taq polymerase using the single stranded DNA bound to
primer as a template. After these reactions, the enzymatic amplification of
microgram quantities of specific DNA regions was obtained (Klug and Cummings,
1997).
In the present study, three different gene regions containing PRL, DGAT1 and
SLC35A3 (CVM disease related gene) genes were amplified with PCR.
2.2.3.1 PRL gene
A 156-bp fragment of PRL gene was amplified using PCR procedure applied by
Dybus (2002) with 50 µl reaction mixture containing;
• PCR buffer 1.0 X
• MgCl2 3.0 mM
• dNTP 0.2 µM
• Primer (both forward and reverse primers) 0.1 Pm
• DNA 50 ng
• Taq polymerase 0.5 U
13

Primers given below were used for amplification of a 156-bp fragment of PRL gene.
Forward: 5' - CGAG TCCTTATGAGCTTGATTCTT- 3'
Reverse: 5' – GCCTTCCAGAAGTCGTTTGTTTTC - 3'
PCR conditions used for the amplification of the PRL gene were given in Table 2.2.
Table 2.2 PCR condition of the PRL gene.
Step Temperature Duration Number of Cycles
Denaturation 94 °C 3 minutes 1 Denaturation 94 °C 20 seconds
Primer annealing 53 °C 40 secondsSynthesis 72 °C 40 seconds
35
Final Extension 72 °C 10 minutes 1
2.2.3.2 DGAT1 gene
A 411-bp fragment of bovine DGAT1 gene was amplified using PCR procedure
applied by Spelman et al. (2000) with 20 µl reaction mixture containing;
• PCR buffer 1.0 X
• MgCl2 0.6 mM
• dNTP 0.2 µM
• Primer (both forward and reverse primers) 1.0 pmol
• DNA 50 ng
• Taq polymerase 1 U
14

Primers given below were used for amplification of 411-bp fragment of the bovine
DGAT1 gene;
Forward: 5'- GCACCATCCTCTTCCTCAAG-3'
Reverse: 5'- GGAAGCGCTTTCGGATG -3'
PCR condition used for the amplification of the DGAT1 gene was presented in Table
2.3.
Table 2.3 PCR condition of the DGAT1 gene.
Step Temperature Duration Number of Cycles Denaturation 95 °C 5 minutes 1 Denaturation 94 °C 60 secondsPrimer annealing 60 °C 60 secondsExtension 72 °C 60 seconds
35
Final Extension 72 °C 10 minutes 1
2.2.3.3 SLC35A3 gene
A 233-bp of SLC35A3 gene was amplified using PCR protocol applied by Kanae et
al. (2005) with 30 µl reaction mixture containing;
• PCR buffer 1 X
• MgCl2 1.5 mM
• dNTP 0.2 µM
• Primer (both forward and reverse primers) 0.3 pm
• DNA 50 ng
• Taq polymerase 0.5 U
15

Primers given below were used for amplification of 233-bp of bovine SLC35A3
(CVM disease related gene) gene;
Forward: 5'- CACAATTTGTAGGTCTCACTGCA-3'
Reverse: 5'-CGATGAAAAAGGAACCAAAAGGG-3'
PCR conditions used for the amplification of the DGAT1 gene were given in Table
2.4.
Table 2.4 PCR condition of the DGAT1 gene.
Step Temperature Duration Number of Cycles Denaturation 94 °C 3 minutes 1 Denaturation 94 °C 45 secondsPrimer annealing 55 °C 20 secondsExtension 72 °C 40 seconds
30
Final Extension 72 °C 10 minutes 1
2.2.4 Checking the Presence of PCR Products
The presence of PCR products were analyzed by using agarose gel electrophoresis.
2% agarose gel was prepared by boiling agarose in 0,5X TBE buffer, pouring it into
an electrophoresis plate and leaving it at RT (room temperature) for 30 minutes for
polymerization. Then, 5µl of 6X bromophenol blue dye was added to 5µl of each
PCR product and loaded into the wells of the gel. The PCR products in the wells
were run in 0,5X TBE buffer at 120V until the bands reached the end of the gel.
Then, the gel was stained in 0.5 µl/ml Ethidium Bromide (Et-Br) solution and the
PCR products were directly visualized by UV fluorescence. The photograph of the
gel was obtained by a gel image system.
16

2.2.5 Enzyme Digestion and Detection of Genotypes
2.2.5.1 PRL gene
A 156-bp of PRL gene was amplified by using the PCR procedure mentioned above.
Amplified PRL gene PCR products were digested using procedure applied by Dybus
(2002). After PCR amplification, amplified 156-bp fragment of PRL gene was
overnight digested with RsaI enzyme, then were run on 6% polyacrylamide gel and
visualized under UV with the help of ethidium bromide. Genotyping of each
individual for PRL gene was was done as shown in Figure 2.1.
Figure 2.1 The expected genotypes and the sizes of the expected restriction fragments for the PRL gene on 6% polyacrylamide gel.
17

PRL gene has two alleles denoted as A and B. The B allele of the PRL gene has a
restriction site at codon for amino acid 103 for RsaI restriction enzyme. Therefore,
as a result of digestion of 156-bp fragment of PRL gene with RsaI restriction
enzyme, three different genotypes were expected (Lewin et al., 1992 referred by
Dybus 2002). Figure 2.1 visualizes the expected genotypes when PRL gene
was digested with RsaI restriction enzyme. If both of the alleles of the PRL genes
were not restricted with RsaI enzyme, just 156-bp band was expected. These
individuals were genotyped as AA. If just one of the gene copies had a restriction
site then the156-bp, 82-bp and 74-bp fragments were expected and individuals
having this74-bp and 82-bp long bands were genotyped as BB genotype.
2.2.5.2 DGAT1 gene In the presented study, 411-bp fragment of DGAT1 gene was amplified and digested
with CfrI restriction enzyme. Digestion products were separated electrophoretically
on 4% agarose gel.
A point mutation from lysine to alanine (K232A) results in two alleles of the
DGAT1 gene (K and A). The allele that has lysine at position 10433 or 10434 was
denoted as the K allele. The mutation from lysine to alanine cause the formation of a
restriction site for CfrI restriction enzyme and this allele was denoted as A alele.
18
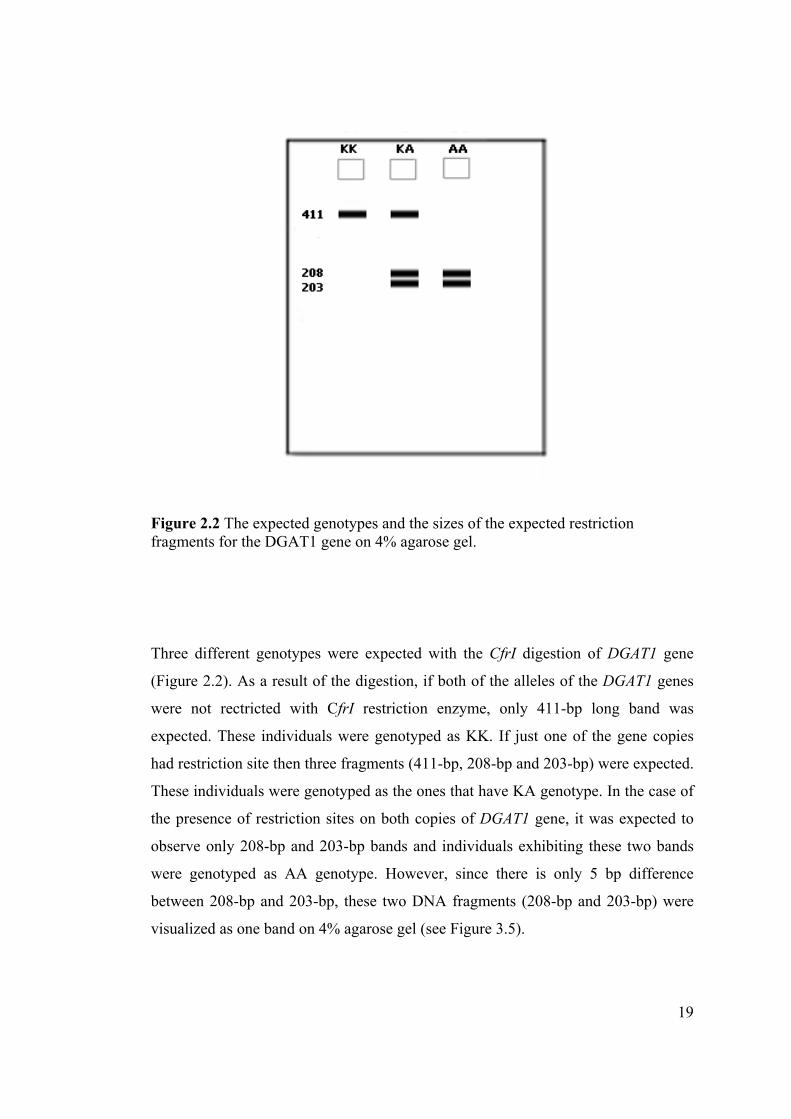
Figure 2.2 The expected genotypes and the sizes of the expected restriction fragments for the DGAT1 gene on 4% agarose gel.
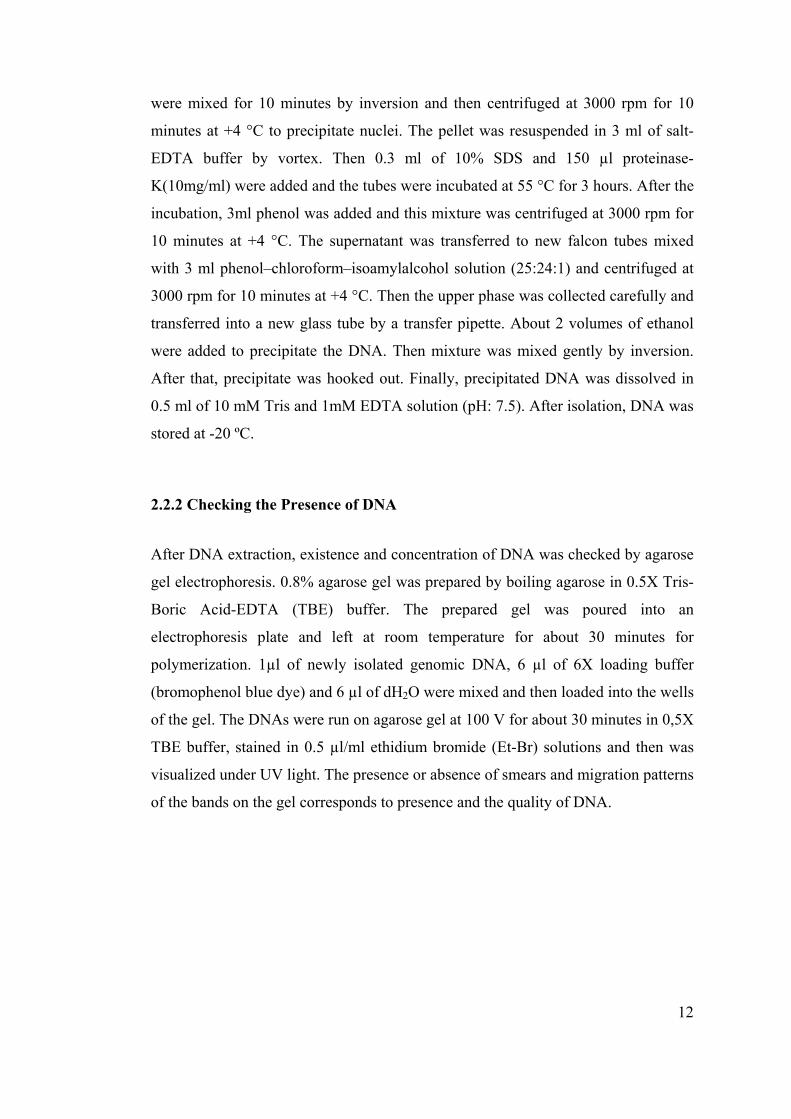
Three different genotypes were expected with the CfrI digestion of DGAT1 gene
(Figure 2.2). As a result of the digestion, if both of the alleles of the DGAT1 genes
were not rectricted with CfrI restriction enzyme, only 411-bp long band was
expected. These individuals were genotyped as KK. If just one of the gene copies
had restriction site then three fragments (411-bp, 208-bp and 203-bp) were expected.
These individuals were genotyped as the ones that have KA genotype. In the case of
the presence of restriction sites on both copies of DGAT1 gene, it was expected to
observe only 208-bp and 203-bp bands and individuals exhibiting these two bands
were genotyped as AA genotype. However, since there is only 5 bp difference
between 208-bp and 203-bp, these two DNA fragments (208-bp and 203-bp) were
visualized as one band on 4% agarose gel (see Figure 3.5).
19
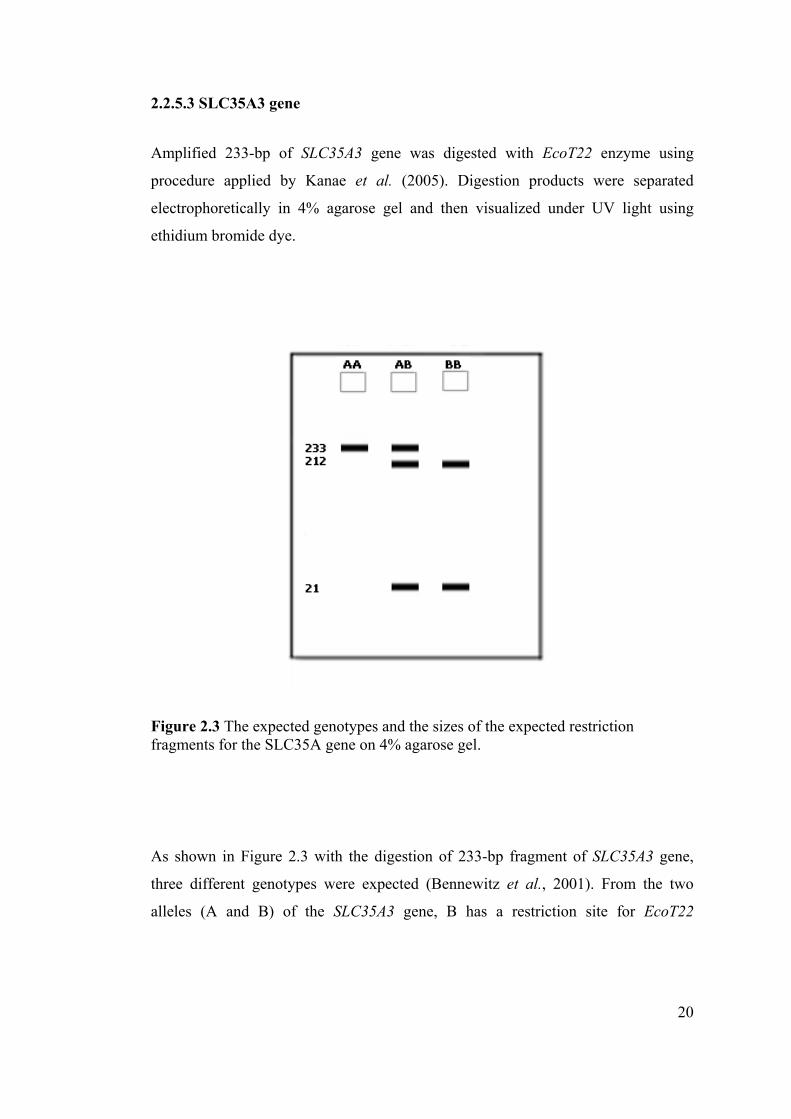
2.2.5.3 SLC35A3 gene
Amplified 233-bp of SLC35A3 gene was digested with EcoT22 enzyme using
procedure applied by Kanae et al. (2005). Digestion products were separated
electrophoretically in 4% agarose gel and then visualized under UV light using
ethidium bromide dye.
Figure 2.3 The expected genotypes and the sizes of the expected restriction fragments for the SLC35A gene on 4% agarose gel.
As shown in Figure 2.3 with the digestion of 233-bp fragment of SLC35A3 gene,
three different genotypes were expected (Bennewitz et al., 2001). From the two
alleles (A and B) of the SLC35A3 gene, B has a restriction site for EcoT22
20
restriction enzyme. If both of the alleles of the DGAT1 genes did not contain
EcoT22 restriction site, only 233-bp long band was expected. These individuals
were called as AA genotype and individuals having AA genotype were considered
as healthy individuals (Bennewitz et al., 2001.). If just one of the gene copies was
restricted then the 233-bp, 212-bp and 21-bp fragments were expected and
genotyped as AB. Individuals having AB genotype were considered as carriers
(Bennewitz et al., 2001.). In the case of the presence of restriction sites on both
copies of SLC35A3 gene, 212-bp and 21-bp bands were expected. Individuals
exhibiting these two bands were genotyped as BB genotype and considered as the
ones that have CVM disease (Bennewitz et al., 2001).
2.3 Statistical Analyses
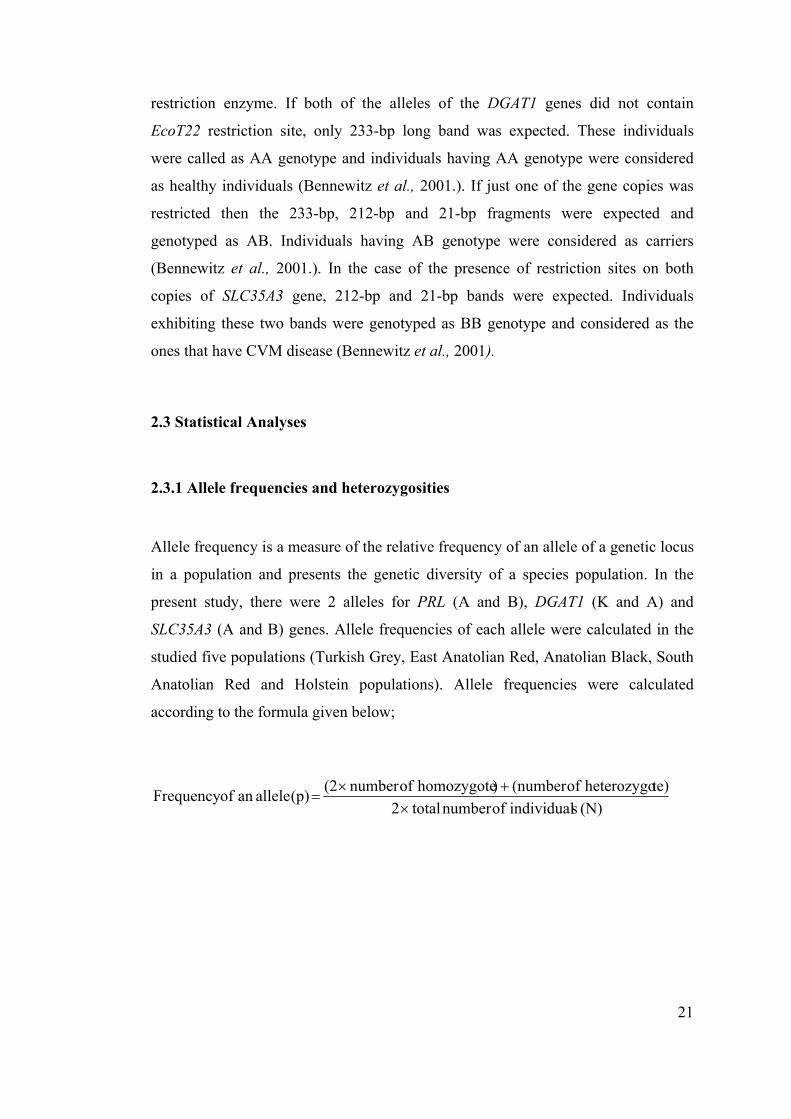
2.3.1 Allele frequencies and heterozygosities
Allele frequency is a measure of the relative frequency of an allele of a genetic locus
in a population and presents the genetic diversity of a species population. In the
present study, there were 2 alleles for PRL (A and B), DGAT1 (K and A) and
SLC35A3 (A and B) genes. Allele frequencies of each allele were calculated in the
studied five populations (Turkish Grey, East Anatolian Red, Anatolian Black, South
Anatolian Red and Holstein populations). Allele frequencies were calculated
according to the formula given below;
(N) sindividual ofnumber total2te)heterozygo of(number )homozygote ofnumber (2 (p) allelean ofFrequency
×+×
=
21
pattern were genotyped as the AB. In the case of the restriction of both of the copies
of PRL gene 74-bp and 82-bp long bands were expected. Individuals exhibiting
Heterozygosity which presents the measurement of genetic variation in a population
was calculated with the formula given below;
(N) tesheterozygo ofNumber tesheterozygo ofNumber sity Heterozygo Observed =
Frequencies of alleles and the observed heterozygosities for PRL, DGAT1 and
SLC35A3 genes for Turkish Grey, Anatolian Black, East Anatolian Red, South
Anatolian Red and Holstein breeds were calculated by using Arlequin (Excoffier et
al., 2005) package program.
Presence of Hardy-Weinberg (HW) equilibrium in Turkish Grey, Anatolian Black,
East Anatolian Red and South Anatolian Red breeds for PRL, DGAT1 and SLC35A3
genes were checked by calculating the expected genotype frequencies and
comparing them with the observed ones. HW equilibrium is based on the following
assumptions: (i) mating is random, (ii) allelic frequencies are conserved from
generation to generation, (iii) no significant migrations occur, (iv) mutation,
selection, genetic drift and gene flow are negligible (Hedrick, 2000). All of these
requirements were assumed to be true while calculating the expected genotype
frequencies, which were calculated as follows;
Expected frequency of homozygote = p2 and q2
Expected frequency of heterozygotes (Expected heterozygosity) = 2pq,
Where; p + q = 1
The significance of the departure from Hardy-Weinberg equilibrium was tested with
Arlequin package program (Excoffier et al., 2005) based on the Guo and Thomson
(1992) procedure. The test was analogous to Fisher’s exact test on a two-by-two
22

contingency table, but extended to a triangular contingency table of arbitrary size. It
is done using a modified version of the Markov-chain random walk algorithm
described Guo and Thomson (1992).
2.3.2 The Fst analysis
FST is a measure of degree of genetic differentiation between subpopulations and it
can be calculated by the formula given below:
T
STST H
HHF
−=
where;
HS = average expected heterozygosity in the subpopulations (in the present study the
breeds)
HT = average heterozygosity of the total population (Nei and Kumar, 2000), which is
when all the breeds are considered as one big population in the present study.
FST values range from 0 to 1 and higher FST values imply higher genetic
differentiation between subpopulations. On the other hand, if gene flow between
subpopulations is high genetic differentiation between subpopulations will be small.
Therefore, FST value will also be small. The pair-wise FST values between four
native Turkish cattle breeds were calculated with Arlequin package program
(Excoffier et al., 2005). The data were permutated for 1000 times in order to test the
significance of the pair-wise FST values.
23

2.3.4 Principal Component Analysis (PCA)
In the present study, Principal Component Analysis (PCA) was used for visualizing
population relationships (i.e. relative positions of populations) in 2 dimensional
spaces. PCA was performed by using NTSYS (Numerical Taxonomy and Multi
Variety Analysis System) package program (Rohlf, 2000). Two independent
compound axes are synthesized from two variables and relative positions of the
populations are visualized in the space generated by the PCA axes. The first axis
explains the highest variation of all the data that can be accounted for by the
compound axis; the second axis explains the next highest variation, (Jobling et al.,
2004).
24
CHAPTER 3
RESULTS
3.1 Results of the Laboratory Experiments
3.1.1 DNA extraction
The DNAs were extracted from the blood samples and then agarose gel
electrophoresis was used in order to check the presence of DNA by using the
procedures mentioned in the previous chapter. Figure 3.1 represents an example of
the Markov-chain random walk algorithm described Guo and Thomson (1992).
DNA check gel image visualized under UV light. Using such images, the presence
of DNA bands and approximate quantity of DNAs were observed. Some samples
did not contain any DNA (Figure 3.1, samples 30d and 38d) or revealed a weak
product (Figure 3.1, samples 8d and 28d). The samples which did not have any
DNA or had weak DNA were not used for PCR-RFLP assays and for those new
DNAs were isolated. Some DNAs isolated from blood samples were highly
concentrated (such as; Figure 3.1, samples 10d, 18d, 25d and 32d). Approximate
concentrations were determined visually. These DNAs were diluted using TE buffer.
Diluted DNAs were left overnight at room temperature. After, checking the
concentration of diluted DNAs on 1% agarose gel, the DNA bands were compared
with a known DNA concentration to decide how much DNA sample to use in PCR
reaction mixture.
25

Figure 3.1 A check gel for total DNA extracts on 0.8% agarose gel. Those letters and numbers shown above the wells are identification codes of the samples used (such as, 1d: 1st sample of South Anatolian Red (d) breed).
After the preparation of DNA samples, amplification of three genes (PRL, DGAT1
and SLC35A3) was carried out by using appropriate primers and PCR procedures.
PCR products were checked on 2% agarose gel and photographed under UV light as
will be shown in following sections (such as Figure 3.2). The quantity of DNA is
important for the success of RFLP analysis. The gel images were used to decide
which samples to be used in RFLP analysis and which ones to be re-amplified.
Repeated samples which did not contain any PCR product at all (Figure 3.4, sample
1b) or resulted in weak products (Figure 3.6, sample 1c) were excluded from the
analysis whereas the ones that have strong PCR products (Figure 3.2, sample 27a
and 1c) were used in the RFLP analysis.
26

3.1.2 Genotyping Genotyping of PCR products of PRL, DGAT1 and SLC35A3 genes were done by
using PCR-RFLP method. The genotype of each individual for each studied locus
was given in Appendix A.
3.1.2.1 PRL gene The PRL gene was amplified using PCR amplification procedure mentioned in the
previous chapter. Photograph representing PCR amplification results of PRL gene
was given in Figure 3.2. After amplification, PCR products were digested overnight
with RsaI restriction enzyme and run on 4% agarose gel. However, since 156-bp
fragment of PRL gene region was very short and digestion fragments (74-bp and 82-
bp) were very close to each other, agarose gel electrophoresis did not give clear
results. After many trials in order to clarify the results by using agarose gel
electrophoresis, it was decided to employ polyacrylamide gel electrophoresis
(PAGE) procedure. Since, resolution power of PAGE is very high, eventually clear
results were obtained by using this technique. Therefore polyacrylamide gel having
higher resolving power was used instead of agarose gel. An example gel photograph
showing the digestion products of PRL gene was given in Figure 3.3.
27

Figure 3.2 Photograph of PCR amplification products of PRL gene on agarose gel. Those letters and numbers shown above the wells are the identification codes of used samples (such as, 27a: 27th sample of Turkish Grey (a) breed).
The PCR product of the PRL gene is 156-bp and with the digestion of this product
with RsaI restriction enzyme three different genotypes were obtained. The ones that
have only 156-bp band (such as Figure 3.3, sample 24b) were genotyped as AA.
Individuals that have 156-bp, 82-bp and 74-bp bands (such as Figure 3.3, sample
27a and 1c) were genotyped as AB and those having 74-bp and 82-bp bands (such as
Figure 3.3, 3c) were genotyped as BB.
28
Figure 3.3 Photograph of digestion using products of PRL gene on polyacrylamide gel. Those letters and numbers shown above the wells are the identification codes of used samples (such as, 27a: 27th sample of Turkish Grey (a) breed).
3.1.2.2 DGAT1 gene
A 411-bp of DGAT1 gene was amplified by using the PCR amplification procedure
given in “Materials and Method” section. Photograph representing PCR
amplification results of DGAT1 gene was given in Figure 3.4. Amplification
products of DGAT1 gene were digested overnight with CfrI restriction enzyme.
29

Figure 3.4 Photograph of PCR amplification products of DGAT1 gene on agarose gel. Those letters and numbers shown above the wells are the identification codes of used samples (such as, 2b: 2nd samples of East Anatolian Red (b) breed).
The digestion products were run on 4% agarose gel and results were visualized
under UV light with ethidium bromide dye. An example gel photograph showing the
digestion products of DGAT1 gene was given in Figure 3.5.
30
Figure 3.5 Photograph of digestion products of DGAT1 gene on agarose gel. Those letters and numbers shown above the wells are the identification codes of used samples (such as, 22b: 22nd samples of East Anatolian Red (b) breed).
The genotypes of some individuals for the DGAT1 gene were given in Table 3.1.
The PCR product of the DGAT1 gene is 411 bp and with the digestion of this
product with CfrI restriction enzyme three genotypes (KK, KA and AA) were
expected. In the presented study, with the digestion of DGAT1 gene only two
genotypes, namely KK and KA were observed. The ones that have only 411-bp band
(Figure 3.5, sample 24b) were genotyped as KK. Individuals that have 411-bp, 208-
bp and 203-bp bands (Figure 3.5, sample 23b) were genotyped as KA.
31

3.1.2.3 SLC35A3 gene
A 233-bp fragment of SLC35A3 gene was amplified by the PCR amplification
procedure. Photograph exhibiting amplification results of this gene was given in
Figure 3.6. After that, the amplification products of SLC35A3 gene were digested
overnight with Ecot22 restriction enzyme, the digestion products were run on 4%
agarose gel and visualized under UV light with the ethidium bromide dye.
Photograph An example gel photograph showing the digestion products of SLC35A3
was given in Figure 3.7.
Figure 3.6 Photograph of PCR products of SLC35A3 (CVM disease related gene) on agarose gel. Those letters and numbers shown above the wells are the identification codes of used samples (Such as, 1c: First sample of Anatolian Black (c) breeds).
32

With the digestion of SLC35A3 gene product with Ecot22 restriction enzyme three
different genotypes were expected as indicated in “Materials and Methods”.
However, in all analyzed populations only AA (healthy) genotype was observed
(Figure 3.7).
Figure 3.7 Photograph of digestion products of SLC35A3 on agarose gel. Those letters and numbers shown above the wells are the identification codes of used samples (such as, 21b: 21st sample of East Anatolian Red (b) breeds).
33
3.2 Results of Statistical Analyses
3.2.1 Allele frequencies, heterozygosities and Hardy-Weinberg equilibrium
Allele frequencies of five breeds (Turkish Grey, East Anatolian Red, Anatolian
Black, South Anatolian Red, and Holstein) were calculated for PRL, DGAT1 and
SLC35A3 genes based on the genotypes given in appendix A and results were given
in Table 3.1 PRL and DGAT1 were polymorphic whereas SLC35A3 was
monomorphic in all of the studied breeds. The observed allele frequencies together
with observed heterozygosity and observed genotype numbers were given in Table
3.1 The presence of Hardy-Weinberg equilibrium was tested for all the studied
breeds in two polymorphic loci (PRL and DGAT1). The expected genotype numbers,
expected heterozygosities, and p values were also given in Table 3.1 Tests revealed
that the two breeds, the Turkish Grey (p=0.0195*) and East Anatolian Red
(p=0.0045**), were not in HWE for PRL gene.
In the present study, three genotypes (AA, AB and BB) were identified for the PRL
gene. The highest frequency (0.8571) for A allele was detected in Holstein. On the
other hand, when Turkish breeds were compared, the A allele was found with the
highest frequency in South Anatolian Red (0.7558) and Turkish Grey (0.7000)
breeds. It has the lowest frequency in Anatolian Black with the frequency of 0.5645.
As expected by the high frequency of A allele in the Holstein breed, the most
frequent genotype was the AA genotype (16/21=0.7619). BB genotype of PRL gene
was found in Anatolian Black (3 samples) and South Anatolian Red (4 samples)
breeds but BB genotype was not observed in Holstein, Turkish Grey and East
Anatolian Red breed
In Turkish Grey and East Anatolian Red, the two breeds which were not in Hardy-
Weinberg equilibrium, observed heterozygosities were higher than expected values.
34
In Turkish Grey breed, while number of expected heterozygosity was 18.9, number
of observed heterozygositiy was 25. In East Anatolian Red population, while
number of expected heterozygosity was 11, number of observed heterozygosity was
15.
The frequency of DGAT1 K allele was higher than the A allele in all of the studied
breeds (Turkish Grey, East Anatolian Red, Anatolian Black, and South Anatolian
Red). The A allele frequency was highest in East Anatolian Red with the frequency
of 0.2205 whereas lowest in Anatolian Black (0.0789). For the studied breeds only
KK and KA genotypes were identified
As indicated before, for the SLC35A3 gene all the studied breeds were
monomorphic for the A allele. B allele, disease related allele, was not found in any
of the individual in studied breeds. Hence, there was not even a single CVM disease
carrier among the tested individuals and breeds.
35
36

Tab
le 3
.1 (c
ontin
ued)
37

3.2.2 FST Statistics
The FST index was used to analyze the degree of genetic differentiation among the
studied breeds. FST analysis were performed first for each locus separately and then
for multi-loci. Based on single-locus analysis, pairwise FST values for PRL and
DGAT1 were given in Table 3.2 and Table 3.3, respectively.
Table 3.2 FST values of five native Turkish cattle breeds based on PRL gene POPULATIONS FST Values Turkish Grey-East Anatolian Red -0.0096 ns Turkish Grey-Anatolian Black 0.0260 ns Turkish Grey-South Anatolian Red -0.0073 ns Turkish Grey-Holstein 0.0284 ns. East Anatolian Red-Anatolian Black 0.0044 ns East Anatolian Red-South Anatolian Red 0.0022 ns East Anatolian Red-Holstein 0.0532 ns Anatolian Black-South Anatolian Red 0.0557 * Anatolian Black-Holstein 0.1341 ** South Anatolian Red-Holstein 0.0046 ns ns-not significant, * < 0.05, ** < 0.01, *** < 0.001
FST analysis for PRL gene was indicated that Anatolian Black is significantly
different than the South Anatolian Red (FST=0.0557*) and Holstein (FST=0.1341**)
breeds (Table 3.2). On the other hand, no population differentiation between studied
breeds (Turkish Grey, East Anatolian Red, Anatolian Black and South Anatolian
Red) was obtained for DGAT1 gene (Table 3.3).
38
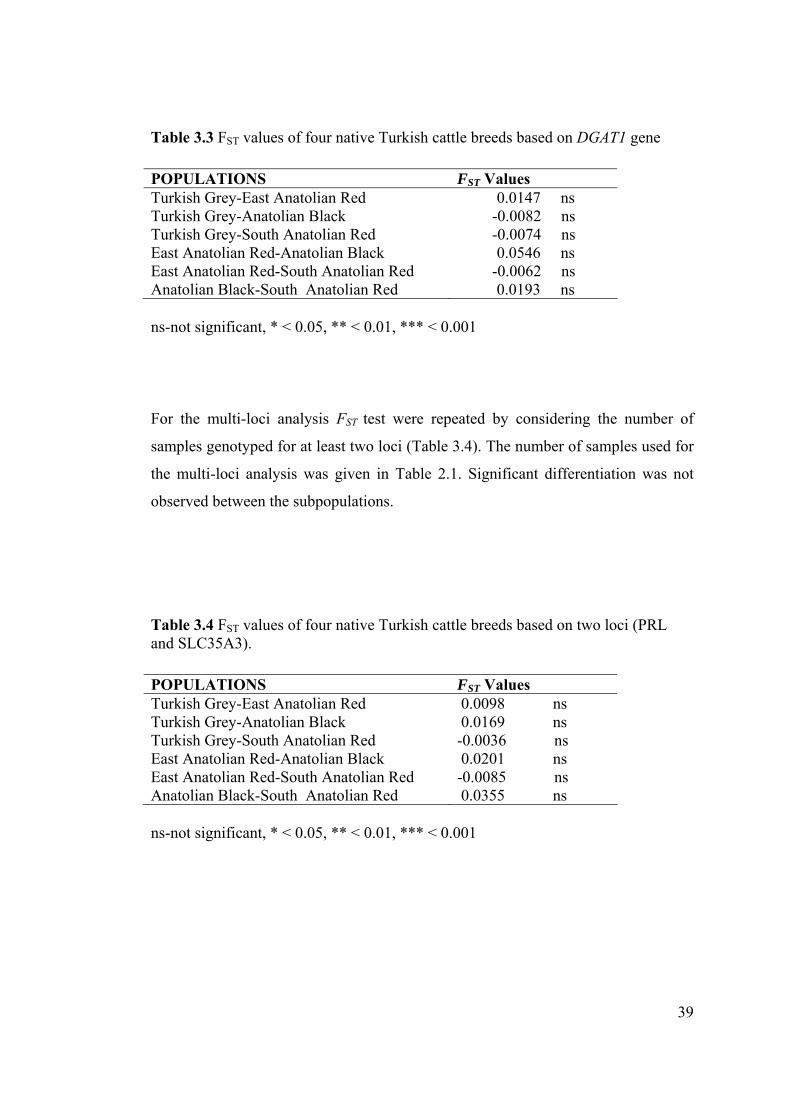
Table 3.3 FST values of four native Turkish cattle breeds based on DGAT1 gene POPULATIONS FST Values Turkish Grey-East Anatolian Red 0.0147 ns Turkish Grey-Anatolian Black -0.0082 ns Turkish Grey-South Anatolian Red -0.0074 ns East Anatolian Red-Anatolian Black 0.0546 ns East Anatolian Red-South Anatolian Red -0.0062 ns Anatolian Black-South Anatolian Red 0.0193 ns ns-not significant, * < 0.05, ** < 0.01, *** < 0.001
For the multi-loci analysis FST test were repeated by considering the number of
samples genotyped for at least two loci (Table 3.4). The number of samples used for
the multi-loci analysis was given in Table 2.1. Significant differentiation was not
observed between the subpopulations.
Table 3.4 FST values of four native Turkish cattle breeds based on two loci (PRL and SLC35A3). POPULATIONS FST Values Turkish Grey-East Anatolian Red 0.0098 ns Turkish Grey-Anatolian Black 0.0169 ns Turkish Grey-South Anatolian Red -0.0036 ns East Anatolian Red-Anatolian Black 0.0201 ns East Anatolian Red-South Anatolian Red -0.0085 ns Anatolian Black-South Anatolian Red 0.0355 ns ns-not significant, * < 0.05, ** < 0.01, *** < 0.001
39
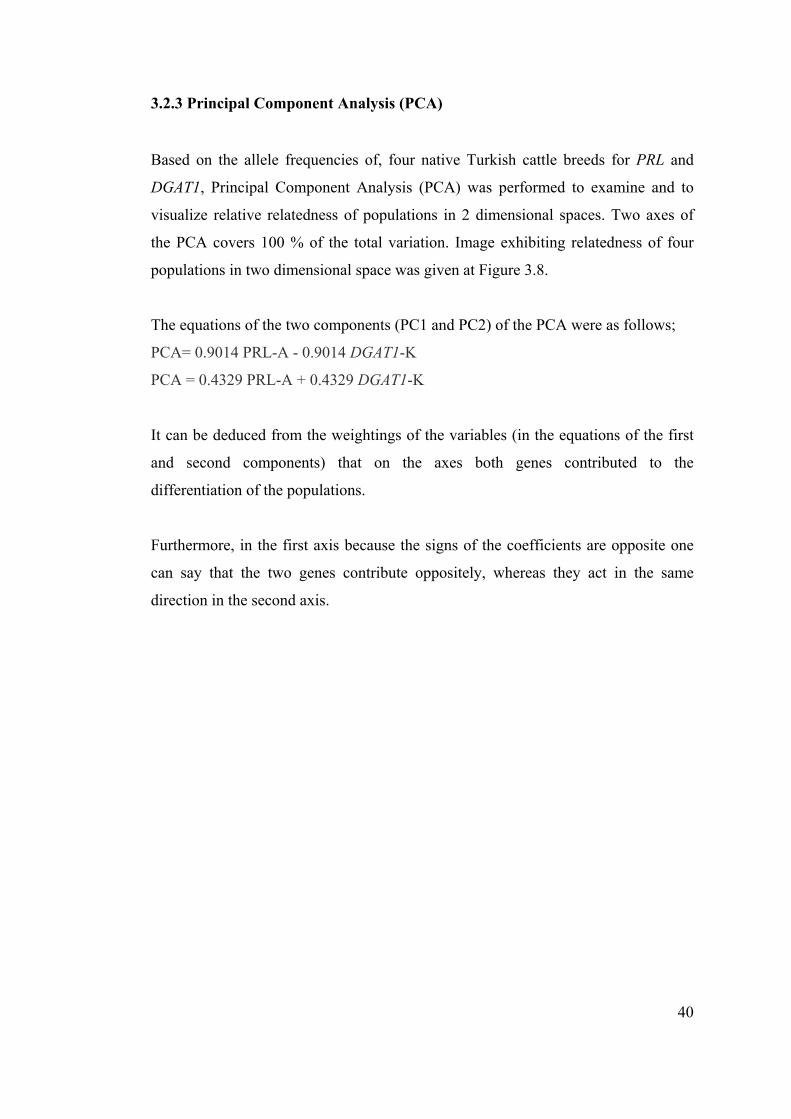
3.2.3 Principal Component Analysis (PCA)
Based on the allele frequencies of, four native Turkish cattle breeds for PRL and
DGAT1, Principal Component Analysis (PCA) was performed to examine and to
visualize relative relatedness of populations in 2 dimensional spaces. Two axes of
the PCA covers 100 % of the total variation. Image exhibiting relatedness of four
populations in two dimensional space was given at Figure 3.8.
The equations of the two components (PC1 and PC2) of the PCA were as follows;
PCA= 0.9014 PRL-A - 0.9014 DGAT1-K
PCA = 0.4329 PRL-A + 0.4329 DGAT1-K
It can be deduced from the weightings of the variables (in the equations of the first
and second components) that on the axes both genes contributed to the
differentiation of the populations.
Furthermore, in the first axis because the signs of the coefficients are opposite one
can say that the two genes contribute oppositely, whereas they act in the same
direction in the second axis.
40

Figure 3.8 PCA of four native Turkish cattle populations.
As a result of the PCA first component (PC1) which explains the 81.4755%
percentage of the genetic variation discriminates Anatolian Black from other three
breeds (Turkish Grey, East Anatolian Red, and South Anatolian Red) clearly.
Component two (PC2) of the PCA explaining the 18.5238% of the total variation
divides native cattle breeds into two groups. Based on the PC2, South Anatolian Red
and Turkish Grey breeds form one group and the Anatolian Black and East
Anatolian Red forms another group.
41

CHAPTER 4
DISCUSSION
Milk is one of the most essential and complete nutrition sources for mammals. Some
of the domesticated animals for instance cattle (Bradley et al., 2006) were employed
for milk production for the humankind in the last ten millennia. Milk can be used as
row milk or can be converted into a variety of dairy products such as cheese and
yoghurt by processing. Both the milk and its products have been subjected to
different preferences. Sometimes, high milk yield with low fat content can be
preferred for example in drinking milk; on the other hand milk with high fat content
can be preferred in some yoghurt.
Breeds of cattle have differentiated gene pools. Differentiation was under the effects
of selection (for example for the high milk yield), random genetic drift and
environmental selection (natural selection). Nowadays, tracking the genes which are
known to be associated with the properties of the milk one can identify the status of
the breed in relation to the property under consideration. Then one may manage the
breed based on the molecular information via marker assisted selection.
However, most of the traits in relation to properties of the milk are not controlled by
a single gene. For example, in this study two of the genes (PRL, DGAT1) are known
to be associated with the milk yield in cattle (see for example, Dybus, 2002 and
Sanders et al., 2006). If management is going to be carried out based on one gene it
42
might be inefficient. Furthermore, while focusing on the selection of one locus other
loci contributing to the trait might lose their integrity and hence, attempt of
management may be a complete failure in the result. Therefore, all the information
based on many genes must be collected first. Their possible interrelations should be
analysed and then must be employed in the management. For the milk yield for
example as well as A allele of PRL and A allele of DGAT1, A allele of β-
laktoglobulin (Tsiaras et al.,2005; Daniela et a.,l 2005) is also known to be related
with the milk yield in cattle.
Another issue is when focusing on one property such as milk yield of milk, gene
pool of the breeds might suffer from; i) erosion of gene diversity and ii) gene
pollution. While the former is unavoidable, the latter, consequence of introgression
(for example for high milk yield) or hitchhiking is something one can control and
avoid. The affect of latter can be so serious that it may sweep the gain from
selection. One of such gene could be SLC35A3. While, trying to increase the milk
yield in Turkey sperm of elite Holstein bulls were heavily used to fertilize the native
cows, this may introduce and increase the frequency of CVM carriers. It was
observed in several studies that not only still born are the problem but also the
carriers and hence the economy is adversely affected by CVM (Nielsen et al., 2002;
Agerholm et al., 2004; Berglund et al., 2004 and Mallher et al., 2005).
Milk and milk products, both their quantity and quality are important for the
economy of the country. In the present study, as well as the disease related allele of
SLC35A3 gene, allele and genotype frequencies of two genes related with the milk
yield and fat content of the milk were examined in Turkish native cattle breeds and
in a sample of Holstein breed for PRL and DGAT1 loci.
43

4.1 PRL gene in Turkish breeds
Observed range for the A allele of PRL locus was 0.61 in German Black and White
(Khatami et al., 2005), 0.97 in Lithuanian White Backed (Miceikiene et al., 2006)
and the frequencies were more often towards the upper end of the range. In Holstein
breed which is a well known breed selected for high milk yield A allele frequency of
PRL gene was 0.95 (Chung et al., 1996 and Chrenek et al., 1998 referred by
Miceikiene et al., 2006).
There was no previous observation on PRL gene frequency in Turkish native breeds.
In the present study the observed range being 0.56 (Anatolian Black) 0.76 (South
Anatolian Red) is narrow and the values are relatively low. All of the allele
frequencies were calculated based on sample sizes, n=31-45 for the native breeds.
Hence, allele frequencies must be quite reliable.
Whereas in Holstein sample A allele frequency was high (0.8571) in accordance
with the expectations from a breed with high milk yield. Yet, even the value
observed in Turkey (0.85) was not as high as some values observed (0.95) in other
Holstein samples before (Chung et al., 1996 and Chrenek et al., 1998 referred by
Miceikiene et al., 2006). Anatolian Black (AB) displayed unexpectedly low value;
lower than all of the previous observations in the literature. In Turkey, with respect
to PRL gene, AB was significantly different than that from South Anatolian Red
(p<0.05). Furthermore, it was more significantly (p<0.01) different than that of
Holstein sample.
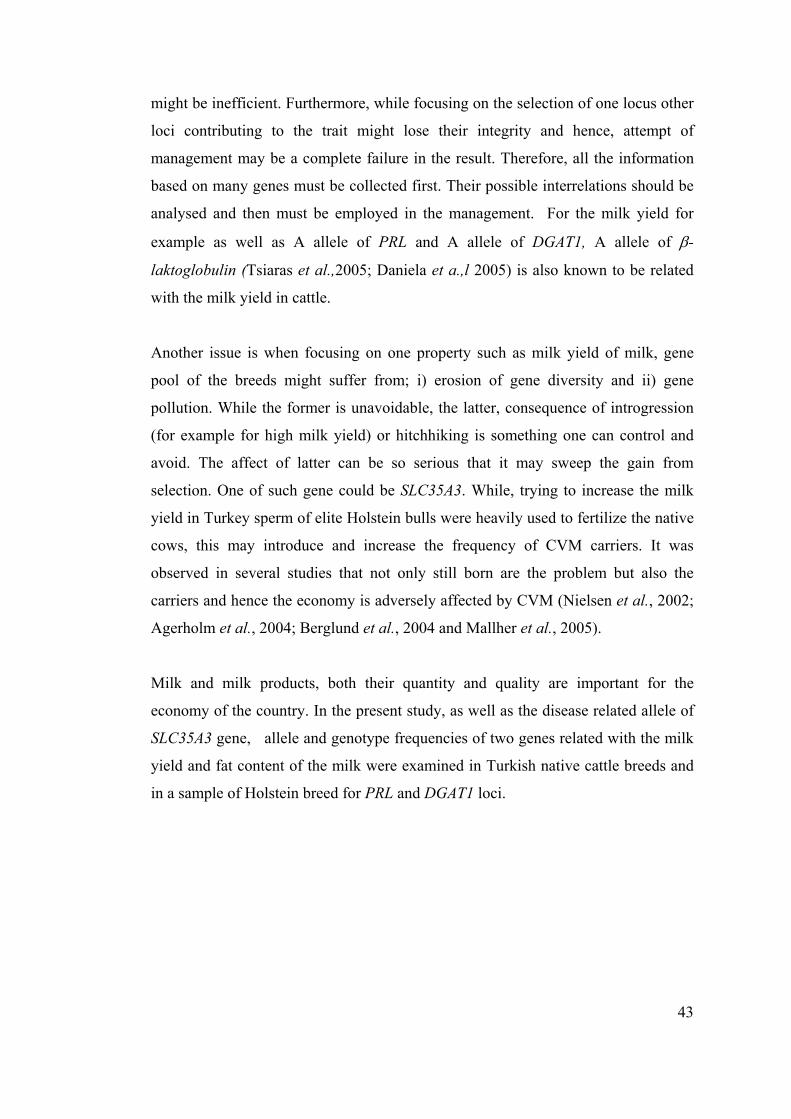
In Figure 4.1 Milk production per individual was shown for different countries
(Milk and milk products in theEuropean Union, 2006). If we consider average milk
yield/individual during the lactation period in Turkey (http://www.tarimsal.gov.tr)
the maximum value is 1875.36 for the South Eastern Anatolian Red. Maximum
yield of Turkish native cattle breeds seems to be half of the country average of
44
Lithuania (country with the minimum milk production among the European
Countries). Ranking of the Turkish native breeds in relation to their milk yield (kg)
is; South Anatolian Red (1875 kg), Turkish Grey ( 1096 kg) Anatolian Black (1062
kg), East Anatolian Red (939 kg) (http://www.tarimsal.gov.tr). Hence, observation
(http://www.tarimsal.gov.tr) that low A frequency and low milk yield in Turkish
native breeds fits well. Rank in the A frequency of PRL is South Anatolian Red,
Turkish Grey East Anatolian Red Anatolian Black is not exactly parallel to their
milk yield. Nevertheless, AB has the minimum milk yield in Turkish native breeds
and has the lowest A allele frequency of PRL gene and it is significantly different in
A compared to that of the SAR which has the maximum milk yield in Turkey. Of
course, milk yield is affected by the environmental conditions heavily. However
results of the present study suggests that perhaps genetic compound; low PRL A
allele frequency may also be playing role in low milk yield of our native breeds.
Figure 4.1 Average milk production for per head per year in EU countries
45
It is observed that within the breed BB genotype cows had lower milk yield and
higher fat content than those with AA and AB genotypes (Khatami et. al., 2005).
With respect to fat contents, lowest A and hence highest frequency of B is found in
Anatolian Black and indeed the highest fat content (4.5%) is associated with this
breed (http://www.tarimsal.gov.tr). Similarly lowest B lowest fat content (3.2%) is
seen in South Anatolian Red. However, for the other two breeds possessing
intermediate B frequencies and intermediate fat contents association is not perfect.
Another, observation to be discussed in relation to PRL locus is, it exhibited
deviation in Hardy –Weinberg equilibrium in two of the breeds (Turkish Grey and
East Anatolian Red) out of 5 considered, observed heterozygosities were higher than
expected values. Since there was no further deviation from HW expectations in
relation to DGAT1 gene since in both of the breeds heterozygotes exceeded the
expected values it can be suggested that by chance we are observing perhaps excess
of the results of AA males X BB females type of crosses.
In relation to methodology, RFLP analysis of PRL gene was planned to be done by
the procedure given by Dybus (2002). However, this procedure was slightly
modified in the present study. Because digestion products of PRL gene were very
short (74 bp and 82 bp) and similar in size, for visualization of the bands
polyacrylamide gel instead of agarose was preferred.
4.2 DGAT1 Gene in Turkish breeds
More than one gene has effect on milk composition and milk yield. The second gene
affecting these two properties of milk is DGAT1. DGAT1 K allele seems to be
parallel to the B allele of PRL gene; it is associated with high fat content of the milk.
However, while high K frequency was observed in beef breeds in the dairy cattle
everything from very low levels to very high K allele frequencies were observed
(Kaupe et al., 2003). The highest K frequencies were observed in Zebu breeds
46

(88%-92%) and Turkish native breeds exhibited intermediate values (21%-38%) in a
previous study (Kaupe et al., 2003).
However, in the present study observed frequencies of K allele (0.78%-0.93%) are
higher than those observed before for the native Turkish breeds and they are in the
range of Zebu breeds. One reason for the discrepancy of the results could be the
difference in the methods. However, methods are the same. Second reason could be
the difference in the samples. For another locus in cattle, β-laktoglobulin,
presumably based on the same samples of the breeds again differences in the allele
frequencies in relation to the samples of the same breeds were observed for the β-
casein, β-lactoglobulin and κ-casein genes (Togan et al., 2007: Jann et al., 2004).
These observations emphasize the importance of sampling in the breeds. In sampling
a breed, to represent its gene pool, maximum possible geographic area must be
covered and very few, 1-3 individuals must be sampled/herd as suggested by a 5th
frame EU project (Econogene Project, 2005).
Since, sampling strategies were not given (previous studies) or known to be different
(present study) than the one suggested by Econogene Project (Econoge Consortiom,
2005) probably none of the samples; neither the one in the present study nor the one
in the previous studies can be considered as the best representatives of the breeds.
The rank in K allele frequency is Anatolian Black>Turkish Grey> South Anatolian
Red> East Anatolian Red. Whereas rank in fat content is follows: Anatolian Black
> Turkish Grey> East Anatolian Red> South Anatolian Red. Hence, an association,
although not perfect, between the two variables was observed.
What could be the reason of high K frequency? Several explanations can be
suggested. Native Turkish breeds were never subjected to systematic selection for
high milk yield. They are assumed to be close relatives of the early domesticated
cattle. DGAT1 is known to be present in Zebu cattle (Winter et al., 2002 Kaupe et
al., 2003) and Water Buffalo (Winter et al., 2002), hence it must evolutionary be an
47
old variant. Perhaps, at the first domestics, K allele was frequent. However, perhaps
in western European dairy breeds during the selection for the high milk yield allele
frequency was reduced. Alternatively, it is known that, in Anatolia native breeds
have contribution from Zebu (Loftus et al., 1999; Freeman et al., 2005 and Özkan,
2005) and therefore allele frequency is high.
4.3 PRL and DGAT1 in Turkish breeds
Principal Component Analysis summarized the results of two genes in 4 breeds on
two axes. It can be seen that the first axis accounting the 81.4755% percentage of the
genetic variation discriminates Anatolian Black from other three breeds (Turkish
Grey, East Anatolian Red, and South Anatolian Red). Component two (PC2) of the
PCA explaining the 18.5238% of the total variation seemed to divide native cattle
breeds into two groups: South Anatolian Red and Turkish Grey breeds form one
group and the Anatolian Black and East Anatolian Red forms another group.
However, none of the pairwise Fst values were found to be significantly different
from each other and hence none of the breeds are significantly different from each
other based on the PRL and DGAT1 loci when studied jointly. Yet, it seems that
allele frequencies provide an ordering for the breeds with respect to the first axis
Anatolian Black (fat content: 4.55%), Turkish Grey (fat content: 3.93%), Eastern
Anatolian Red (fat content: 3.45%), South Anatolian Red (fat content: 3.2%)
accounts a perfect correlation with their fat content (Figure.4.2.). Second axis,
displays another order South Anatolian Red (average milk yield: 1875kg), Turkish
Grey (average milk yield: 1096 kg), Anatolian Black (average milk yield: 1062kg),
East Anatolian red (average milk yield: 939kg) which again is perfectly correlated
with the reported milk yields (Figure 4.2.). Observed perfect ordering is remarkable.
It emphasizes that both of the genes are affecting the milk yield and fat content of
the milk in the breeds. Furthermore, it suggests a frame about how milk yield and fat
content will vary in accordance with the allele frequencies of the two genes. First
axis clearly shows that the fat content increases with K of DGAT1 and decreases
48

with A of PRL. Because the coefficients are both high and because the axis account
high percent of the total variability (81.4755%) it can be suggested that each
generates a quick response in fat. The most interestingly, the second axis, however,
is generated by the positive contribution of both A and K. So while increasing K, not
only fat content, but also milk yield is increased The observed wide range of K in
dairy cattle (Kaupe et al., 2003) might also be explained by their parallel effects in
milk yield. In the absence of molecular markers humans might have selected some
breeds for high K and some for high A, both for the purpose of high milk yield.
Anatolian breeds might be those in the line of high K breeds. But, perhaps A related
milk yield is higher than that of K related milk yield.
Again, one may anticipate that, a heavy, A related milk yield also effected the gene
pool such that breed became more vulnerable to the extremes of environmental
conditions as was the case for economically important breeds such as Holstein
breed.
49
Figure 4.2 PCA result of PRL and DGAT1 genes
4.4 CVM Disease (Complex Vertebral Malformation)
The spread of recessive genetic defect in domestic animal populations may lead to
very important economic losses and may impair the efficiency of genetic
improvement programmes. One such genetic defect known as Complex Vertebral
Malformation (CVM) was first observed in Denmark (Agerholm et al., 2001), and
recognized as a problem in the United States (Duncan et al., 2001), the United
50

Kingdom (Revell, 2001), the Netherlands (Wouda et al., 2000) and Japan (Nagahata
et al., 2002) referred by (Thomsen et al., 2005). A point mutation from G to T at
nucleotide position 559 of bovine solute carrier family 35 member of 3 (SLC35A3)
caused an abnormal nucleotide-sugar transport into the Golgi apparatus (Thomsen et
al., 2005). The carrier elite bull, due to superior lactation performance of his
daughters was extensively used and hence the wide spread problem was caused
(Thomsen et al., 2005).
In the present study possible introduction of the defect to Turkish native breeds was
tested. The defect was not observed in neither the 21 elite bulls of Cattle Breeders
Association of Turkey nor in any of the 143 individuals of four native Turkish cattle
(South Anatolian Red, East Anatolian Red, Anatolian Black and Turkish Grey)
breeds.
As a conclusion, in the present study, for the economically important 3 cattle genes
(PRL, DGAT1, SLC35A3) an easy, RFLP based molecular genotyping was repeated
and established in our laboratory, with minor modifications in DGAT1 locus.
Observed low milk yield for our native breeds correlated with low frequency of A
allele in PRL locus. Similarly, K allele frequency of DGAT1 locus was parallel to
the fat content of the milks of Turkish native breeds. Yet, when both of the genes
were considered jointly it was suggested that both A and K alleles of the genes have
contributions in milk yield. It is known that PRL and DGAT1 are only the two genes
related with the milk yield. Other genes must also be examined. PCA seems to be a
promising easy method that can be used to reveal pattern of cooperative effect of
many genes in milk yield.
Based on the results of the present study, in order to improve the milk yield of
Turkish native breeds perhaps, A allele can tried to be enriched in dairy cattle.
However, it must be known that enrichment might be at the expense of some genetic
variability, which perhaps is related with the genes confirming the local adaptation.
51
Finally, elite bulls and the Turkish native cattle breeds in this study seemed to be
free from the CVM.
52

REFERENCES
Agerholm, J.S., Bendixen, C., Andersen, O., and Arnbjerg, j. 2001. Complex
Vertebral Malformation in Holstein calves. J Vet Diagn Invest. 13: 283-289
Agerholm, J. S., Andersen, O., Almuskou, M.B., Bendixen, C., Arnbjerg, j.,
Aamand, G.P., Nielsen, U.S., Panitz, F., Petersen, A.H. 2004. Evaluation of the
inheritance of the Complex Vertebral Malformation syndrome by breeding Studies.
Acta vet. Scand. 45: 133-137.
Bendixen, C., Svensen, S., Jensen, H., Panitz, F., Aasberg, A., Holm, L.E., Horn, P.,
Hoj, A., Thomsen, B., Jeppesen B.M., Nielsen, V.H., and Jonker, M. 2002. Genetic
test for the identification of carriers of Complex Vertebral Malformations in cattle.
World Intellectual Property Organization (Publication No WO 02/40709 A2)
Bennewitz, J., Reinsch, N., Paul, S., Looft, C., Weimann, C., Erhardt, G., Thaller,
G., Kühn, Ch., Schwerin, M., Thomsen, H., Reinhardt, F., Reents, R., and Kalm, E.
2004. The DGAT1 K232A Mutation is Not Solely Responsible for the Milk
Production Quantitative Trait Locus on the Bovine Chromosome 14. J. Dairy Sci.
87: 431-442.
Berlungd, B., Person, A., and Stalhammar, H. 2004. Effects of Complex Vertebral
Malformation on fertility in Swedish Holstein cattle. Acta vet. Scand. 45: 161-165.
Boulay, J., and Paul, W. 1992. The interleukin-4-related lymphokines and their
binding to hematopoietin receptors. J Biol Chem 267: 20525–20528.
53

Bradley, D.G., and Magee, D.A. 2006. Documenting Domestication. University of
California Press.
Bruford, M.W., Bradley, D.G., and Luikart, G. 2003. DNA markers reveal the
complexity of livestock domestication. Nat. Rev. Genet. 4: 900–910.
Camper, S. A., Luck, D. N., Yao, Y., Woychik, R. P., Goodwin, R.
G., Lyons, R. H., and Rott-Man, F. M. 1984. Characterization of the bovine
prolactin gene. DNA. 3: 237-249.
Chrenek, P., Vasicek, D., Bauerova, M., Bulla, J., and Czech, J. 1998. Animal Sci.
43: 53-55.
Chung, ER., Rhim, TJ., and Han SK. 1996. Korean J Animal Sci. 38: 321-336.
Citek, J. and Blahova, B. 2004. Recessive disorders – a serious helath hazard?.
Journal of Applied Biomedicine. 2: 187-194.
Daniela I. and Vintila I., Analysis of gene polymorphism at locus of κ-casein and β-
lactoglobulin genes using multiplex PCR technique, Zootehnie şi Biotehnologii, 38,
769-773, (2005).
Dinç, H., Koban, E., and Togan, İ. 2007. İdentification of Some genotypes of β-
Casein, β-Lactoglobulin and κ-Casein which are Human and animal health and
cheese yield related proteins using DNA based methods The Scientific and
Tehcnical Research Council of Turkey project.
Duncan, R.B.J., Carrig, C.B., Agerholm, J.S., and Bendixen, C. 2001. Complex
vertebral malformation in a holstein calf: Report of a case in the USA. J. Vet. Diagn.
Invest. 13: 333–336.
54
Dybus, A. 2002. Association of growth hormone (GH) and prolactin (PRL) genes
polymorphisms with milk production traits in Polish Black-and-White cattle. Animal
Science Papers and Reports. 20: 203-212.
Excoffier, L., Laval, G., and Schneider, S. 2006. Arlequin ver 3.1 An Integrated
Software Package for Population Genetics Data Analysis.
Freeman, A. R., Bradley, D. G., Nagda, S., Gibson, J. P., and Hanotte O. 2005.
Combination of multiple microsattelite data sets to investigate genetic diversity and
admixture of domestic cattle. Animal Genetics. 37: 1-9.
Freeman, M.E., Kanyicska, B., Lerant, A., and Rgynagy, G. 2000. Prolactin: Struct
Function, and Regulation of Secretion. Physicological Reviews. 80.
Guo, S.W., and Thomson, E.A. 1992. Performing the exact test of Hardy-Weinberg
proportion for multiple alleles. Biometrics. 48: 361-372
Grisart, B., Coppieters, W., Farnir, F., Karim, L., Ford, C., Berzi, P., Cambisano, N.,
Mni, M., Reid, S., Simon, P., Spelman, R., Georges, M., and Snell, R. 2002.
Positional candidate cloning of a QTL in dairy cattle: Identification of missense
mutation in the bovine DGAT1 gene with major effect on milk yield and
composition. Genome Research. 12: 222-231.
Hedrick, P. W. 2000. Genetics of populations. Jones and Bartlett Pub lishers, Inc.,
Sudbury, MA
Jann O.C., Ibeagha-Awemu E.M., Özbeyaz C., Zaragoza P., Williams J.L., Ajmone-
Marsan P., Lenstra J.A., Moazami-Goudarzi K. ve Erhardt, G., Geographic
distribution of haplotype diversity at the bovine casein locus. Genet. Sel. Evol., 36,
243-257, (2004).
55

Jobling, M.A., Hurles, M.E., Tyler-Smith, C. 2004. Human Evolutionary Genetics.
Origins, People and Disease. Garland Publishing.
Kanae, Y., Endoh, D., Nagahata, H., Hayashi, M. 2005. A method for detecting
complex vertebral malformation in Holstein calves using polymerase Chain reaction
– primer introduced restriction analysis. J. Vet. Diagn. Invest. 17: 258-262.
Kaupe, B., Winter, A., Fries, R., Erhard, G. 2003. DGAT1 polymorphism in Bos
indicus and Bos taurus cattle breeds. Journal of Dairy Research. 71: 182-187.
Khatami, S. (2005). Association of DNA polymorphisms of the growth hormone and
prolactin genes with milk productivity in Yaroslavl and Black-and-White cattle.
Russian Journal of Genetics. 41(2): 167-173.
Klug, W. S., and Cummings, M. R. 1997. C oncepts of. Genetics. Fifth Edition.
Prentice Hall International, Inc.
Kopečný, M., Nebola, M., Dvořák, J. 1998. Growth hormone and prolactin genes in
Czech Republic and Poland.
Lacorte, G. A., Machado, M. A., Martinez, M. L., Campos A. L., Maciel, R. P.,
Verneque, R. S., Teodoro, R. L., Peixoto, M.G.C.D., Carvalho, M.R.S., and
Fonseca, C.G. 2006. DGAT1 K232A polymorphism in Brazilian cattle breeds.
Genetics and Molecular Research. 5 (3): 475-482.
Lewin, H.A., Schmitt, K., Hubert, R., van Eijk, M.J.T., and Arnheim, N. (1992).
Close linkage between bovine prolactin and BoLA-DRB3 genes: genetic mapping in
cattle by single sperm typing. Genomics. 13: 44-48.
56
Liron, J. P., Ripoli, M.V., De Luca, J.C., Peral- Garcia, P., and Giovambattista, G.
2002. Analysis of genetic diversity and population structure in Argentine and
Bolivian Creole cattle using five loci related to milk production. Genetics and
Molecular Biology. 25: 413-419.
Loftus, R. T., Ertuğrul, O., Harba, A.H., El-Barody, M.A., MacHungh, D.E., Park,
S.D., and Bradley, D.G. 1999. A microsatellite survey of cattle from a centre of
origin: the Near East. Molecular Ecology. 8: 2015-2022
Mallher, X., Beaudeau, F., Philipot, J. M. 2005. Effects of sire and dam genotype for
complex vertebral malformation (CVM) on risk of return-to-service in Holstein
dairy cows and heifers. Theriology. 65: 1215-1225.
Miceikiene, I., Pecuilaitiene, N., Baltrenaite, L., Skinkyte, R., Indriulyte, R. 2006.
Association of cattle genetic markers with performance traits. Biologija. 1: 24-29.
Nagahata, H., Oota, H., Nitanai, A., Oikawa, S., Higuchi, H., Nakade, T., Kurosawa,
T., Morita, M., and Ogawa, H. 2002. Complex Vertebral Malformation in a stillborn
Holstein calf in Japan. J. Vet. Med. Sci. 64: 1107-1112.
Nei, M. and Kumar, S., 2000. Molecular evolution and phylogenetics. Oxford
University Press.
Nichols, R. A., Bruford, M. W., and Groombridge, J. J. 2001. Sustaining genetic
variation in a small population: Evidence from the Mauritius kestrel. Mol. Ecol.
10:593–602
Nielsen, U., Aamand, G., Andersen, O., Bendixen, C., Nielsen, V., and Agerholm, J.
2003. Effects of complex vertebral malformation on fertility traits in Holstein cattle.
Livestock Production Science. 79: 233-238.
57
Özkan, E., An investigation on genetic structure of native and cultural cattle breeds
in Turkey by microsatellite markers, Phd. Thesis., Zoothecny basic science section,
Tekirdağ Agriculture Faculty., Trakya University(2005).
Peters, J., Helmer, A., Driesch, V., and Segui, S. 1999. Animal husbandary in the
northern Levant. Paleorient. 25: 27-48.
Revell, S. 2001. Complex vertebral malformation in a Holstein calf in the UK. Vet.
Rec. 149: 659–660.
Rohlf, F.J. 1993. NTSYS-pc: Numerical Taxonomy and Multivariate Analysis
System, version 2.10q., App. Biostatistics, Inc.
Sambrook, j., Foritsch, E.F., Maniatis, T. 1989. Molecular Cloning: A Laboratory
Manual. Second Edition. Cold Spring Harbor Laboratory, Cold Spring Harbor, New
York.
Sanders, K., Bennewitz, J., Reinsch, N., Thaller, G., Prinzenberg, E.- M., Kühn, C.
Kalm, E. 2006. Characterization of the DGAT1 Mutations and the CSN1S1
Promoter in the German Angeln Dairy Cattle Population. J. Dairy Sci. 89: 3164-
3174.
Skinkyte, R., Zwierzchowski, L., Riaubaite, L., Baltrenaite, L., and Miceikiene, I.
2005. Distrubition of allele frequencies important to milk production traits in
Lithuanian Black and White and Lithuanian Red cattle. Veterinarija ir Zootechnika.
31: 93-97.
Smith, S. J., Cases, S., Jensen, D. R., Chen, H. C., Sande, E., Tow, B., Sanan, D. A.,
Raber, J., Eckel, R. H., and Farese, R. V. 2000. Nat. Genet. 25: 87-90.
58

Spelman, R.J., Ford, C.A., McElhinney, P., Gregory G.C., and Snell R.G. 2002.
Charaterization of the DGAT1 gene in the New Zeleand Dairy population. J. Dairy
Sci. 85: 3514-3517.
Thaller, G., Kramer, W., Winter, A., Kaupe, B., Eehardt, G., Fries, R. 2003. Effects
of DGAT1 variants on milk production traits in German cattle breeds. American
Society of Animal Science. 81: 1911-1918.
Thomsen, B., Horn, P., Panitz, F., Bendixen, E., Petersen, A., Holm, L., Holm, E.,
Nielsen, V., Agerholm, J., Arnbjerg, J., and Bendixen, C. 2005. A missense
mutation in the bovine SLC35A3 gene, encoding a UDP-N-acetylglucosamine
transporter, causes complex vertebral malformation. Genome Research. 16: 97-105.
Troy, C.S., MacHungh, D.E., Bailey, J.F., Magee, D.A., Loftus, R.T., Cunningham,
P., Chamberlain, A.T., Sykes, B.C., and Bradley D.G. 2001. Genetic evidence for
Near-Eastern origins of European cattle. Nature. 410: 1088-1091.
Tsiaras A.M., Bargouli G.G., Banos G. ve Boscos C.M., Effect of kappa-casein and
beta-lactoglobulin loci on milk production traits and reproductive performance of
Holstein cows, Journal of Dairy Science, 88, 327-334, (2005).
Udina, I.G. 2001. Polymorphism of Bovine Prolactin Gene: Microsatellites, PCR-
RFLP. Russian Journal of Genetics. 37(4): 407-411.
Winter, A., Kramer, W., Werner, F., Kollers, S., Kata, S., Durstewitz, G., Buitkamp,
J., Womack, J., Thaller, G., and Fries, R. 2002. Association of a lysine -232/alanine
polymorphism in a bovine gene encoding acyl- CoA : Diacylglycerol acyltransferase
(DGAT1) with variation at a quantitative trait locus for milk fat content. PNAS. 99:
9300-9305.
59

Wouda, W., Visser, I.J., Borst, G.H., Vos, J.H., Zeeuwen, A.A., and Peperkamp,
N.H. 2000. Developmental anomalies in aborted and stillborn calves in The
Netherlands. Vet. Rec. 147: 612.
60

APPENDIX A
Table 1.
BREED NAME GENE 1 GENE 2 GENE 3
TURKISH GREY PRL DGAT1 SLC35A3
GREY STEP 1 AA KK AA
GREY STEP 2 AB - AA
GREY STEP 3 AA KK AA
GREY STEP 4 AA KK AA
GREY STEP 5 AB KK AA
GREY STEP 6 AB KK AA
GREY STEP 7 AA KK AA
GREY STEP 8 AB KK AA
GREY STEP 9 AB - AA
GREY STEP 10 AB KK AA
GREY STEP 11 AA - AA
GREY STEP 12 AB KA AA
GREY STEP 13 AB - AA
GREY STEP 14 AA KA AA
GREY STEP 15 AA KK AA
GREY STEP 16 AA - AA
GREY STEP 17 AA KK AA
GREY STEP 18 AB KK AA
GREY STEP 19 AB KK AA
GREY STEP 20 AA KA AA
GREY STEP 21 AB KK AA
GREY STEP 22 AA KA AA
GREY STEP 23 AA KA AA
61

Table 1. (continued) GREY STEP 24 AB - -
GREY STEP 25 AA KK AA
GREY STEP 26 AB KK AA
GREY STEP 27 - KA AA
GREY STEP 28 AA KA AA
GREY STEP 29 AA KA AA
GREY STEP 30 AB KK AA
GREY STEP 31 AB - AA
GREY STEP 32 AB - -
GREY STEP 33 AB KK AA
GREY STEP 34 AB - AA
GREY STEP 35 AA KK AA
GREY STEP 36 AB - -
GREY STEP 37 AB KK AA
GREY STEP 38 AB KK AA
GREY STEP 39 AB - AA
GREY STEP 40 AB - -
GREY STEP 41 AB KK AA
GREY STEP 42 AB - AA
GREY STEP 43 AB - AA
GREY STEP 44 AB - -
GREY STEP 45 AA - -
GREY STEP 46 AA - AA
62

Table 2. BREED NAME GENE 1 GENE 2 GENE 3
EAST ANATOLIAN RED PRL DGAT1 SLC35A3
EAST ANATOLIAN RED 2 AB KA AA
EAST ANATOLIAN RED 3 AB KA AA
EAST ANATOLIAN RED 4 AA KA AA
EAST ANATOLIAN RED 5 AB KK AA
EAST ANATOLIAN RED 6 AA KK AA
EAST ANATOLIAN RED 7 AB KK AA
EAST ANATOLIAN RED 8 AB KK AA
EAST ANATOLIAN RED 18 AA KA AA
EAST ANATOLIAN RED 19 AB KA AA
EAST ANATOLIAN RED 20 AB KA AA
EAST ANATOLIAN RED 21 AA KA AA
EAST ANATOLIAN RED 22 AB KK AA
EAST ANATOLIAN RED 23 AA KK AA
EAST ANATOLIAN RED 24 AB KK AA
EAST ANATOLIAN RED 25 AB KK AA
EAST ANATOLIAN RED 26 AB KK AA
EAST ANATOLIAN RED 27 AB KK AA
EAST ANATOLIAN RED 28 AB KA AA
EAST ANATOLIAN RED 29 AB KK AA
EAST ANATOLIAN RED 30 AA KA AA
EAST ANATOLIAN RED 31 AA KK AA
EAST ANATOLIAN RED 32 AA KK AA
EAST ANATOLIAN RED 33 AA KA AA
EAST ANATOLIAN RED 34 AB KK AA
EAST ANATOLIAN RED 35 AA KK AA
63

Table 3. BREED NAME GENE 1 GENE 2 GENE 3
NATIVE BLACK PRL DGAT1 SLC35A3
NATIVE BLACK 1 AB KK AA
NATIVE BLACK 2 AB KK AA
NATIVE BLACK 3 BB KK AA
NATIVE BLACK 4 AA KK AA
NATIVE BLACK 5 AB KK AA
NATIVE BLACK 6 AB - AA
NATIVE BALCK 7 AA KK AA
NATIVE BLACK 8 AB KK AA
NATIVE BLACK 9 BB KK AA
NATIVE BLACK 10 AA - -
NATIVE BLACK 13 AA KK AA
NATIVE BLACK 14 AA KK AA
NATIVE BLACK 15 AB KA AA
NATIVE BLACK 16 KK
NATIVE BLACK 17 AB KK AA
NATIVE BALCK 18 AB KK AA
NATIVE BLACK 19 AB - AA
NATIVE BALCK 20 AA - -
NATIVE BALCK 21 AB KA AA
NATIVE BLACK 22 AA - AA
NATIVE BLACK 24 AB - AA
NATIVE BLACK 25 - KA AA
NATIVE BALCK 26 AA KK AA
NATIVE BLACK 27 AB - AA
NATIVE BLACK 28 AB - -
64

Table 3. (continued)
NATIVE BLACK 29 AB - AA
NATIVE BLACK 30 AB - AA
NATIVE BLACK 31 - - AA
NATIVE BLACK 32 AB KK AA
NATIVE BLACK 38 AB - -
NATIVE BLACK 39 BB - -
NATIVE BLACK 40 AB KK AA
NATIVE BLACK 41 AB - -
NATIVE BLACK 42 BB KK AA
65

Table 4. BREED NAME GENE 1 GENE 2 GENE 3
SOUTH ANATOLIAN RED PRL DGAT1 SLC35A3
SOUTH ANATOLIAN RED1 AA AA AA SOUTH ANATOLIAN RED2 AA AA AA SOUTH ANATOLIAN RED3 AA - AA SOUTH ANATOLIAN RED4 AA AA AA SOUTH ANATOLIAN RED5 AB AA AA SOUTH ANATOLIAN RED6 AB - AA SOUTH ANATOLIAN RED7 BB AA AA SOUTH ANATOLIAN RED8 - - AA SOUTH ANATOLIAN RED9 AA AB AA SOUTH ANATOLIAN RED10 AB AA AA SOUTH ANATOLIAN RED11 AB AA AA SOUTH ANATOLIAN RED12 AB AB AA SOUTH ANATOLIAN RED13 AB AA AA SOUTH ANATOLIAN RED14 AA - AA SOUTH ANATOLIAN RED15 AA AB AA SOUTH ANATOLIAN RED16 AB AB - SOUTH ANATOLIAN RED17 AA AA AA SOUTH ANATOLIAN RED18 AA AB AA SOUTH ANATOLIAN RED19 AB AA - SOUTH ANATOLIAN RED20 AA KA AA SOUTH ANATOLIAN RED21 AB AA AA SOUTH ANATOLIAN RED22 AA AB AA SOUTH ANATOLIAN RED23 AA AB AA SOUTH ANATOLIAN RED24 AA AB AA SOUTH ANATOLIAN RED25 AA AB AA SOUTH ANATOLIAN RED26 AA AA AA SOUTH ANATOLIAN RED27 AA - - SOUTH ANATOLIAN RED28 AA AA AA SOUTH ANATOLIAN RED29 AB AA AA SOUTH ANATOLIAN RED30 - AA AA SOUTH ANATOLIAN RED31 AB - -
66

SOUTH ANATOLIAN RED32 AB AB AA Table 4. (continued) SOUTH ANATOLIAN RED33 AA AA AA SOUTH ANATOLIAN RED34 AA AB AA SOUTH ANATOLIAN RED35 AA - - SOUTH ANATOLIAN RED36 AB AA AA SOUTH ANATOLIAN RED37 - AA AA SOUTH ANATOLIAN RED38 AB - AA SOUTH ANATOLIAN RED39 BB AB AA SOUTH ANATOLIAN RED40 AA AA AA SOUTH ANATOLIAN RED41 BB AA AA SOUTH ANATOLIAN RED42 AA - AA SOUTH ANATOLIAN RED43 - AA AA SOUTH ANATOLIAN RED44 - AA AA SOUTH ANATOLIAN RED45 - AA AA SOUTH ANATOLIAN RED46 - AA AA SOUTH ANATOLIAN RED47 - AA AA
67

Table 5.
BREED NAME GENE 1 GENE 2 GENE 3 HOLSTEIN PRL DGAT1 SLC35A3 HOLSTEIN 1 AA - AA HOLSTEIN2 AB - AA HOLSTEIN 3 AB - AA HOLSTEIN 4 AA - AA HOLSTEIN 5 AA - AA HOLSTEIN 6 AA - AA HOLSTEIN 7 AB - AA HOLSTEIN 8 AA - AA HOLSTEIN 9 AA - AA HOLSTEIN 10 AA - AA HOLSTEIN 11 AA - AA HOLSTEIN 12 AA - AA HOLSTEIN 13 AB - AA HOLSTEIN 14 AA - AA HOLSTEIN 15 AB - AA HOLSTEIN 16 AA - AA HOLSTEIN 17 AA - AA HOLSTEIN 18 AA - AA HOLSTEIN 19 AB - AA HOLSTEIN 20 AA - AA HOLSTEIN 21 AB - AA
68
Recommended