Pittsburgh’s charter schools
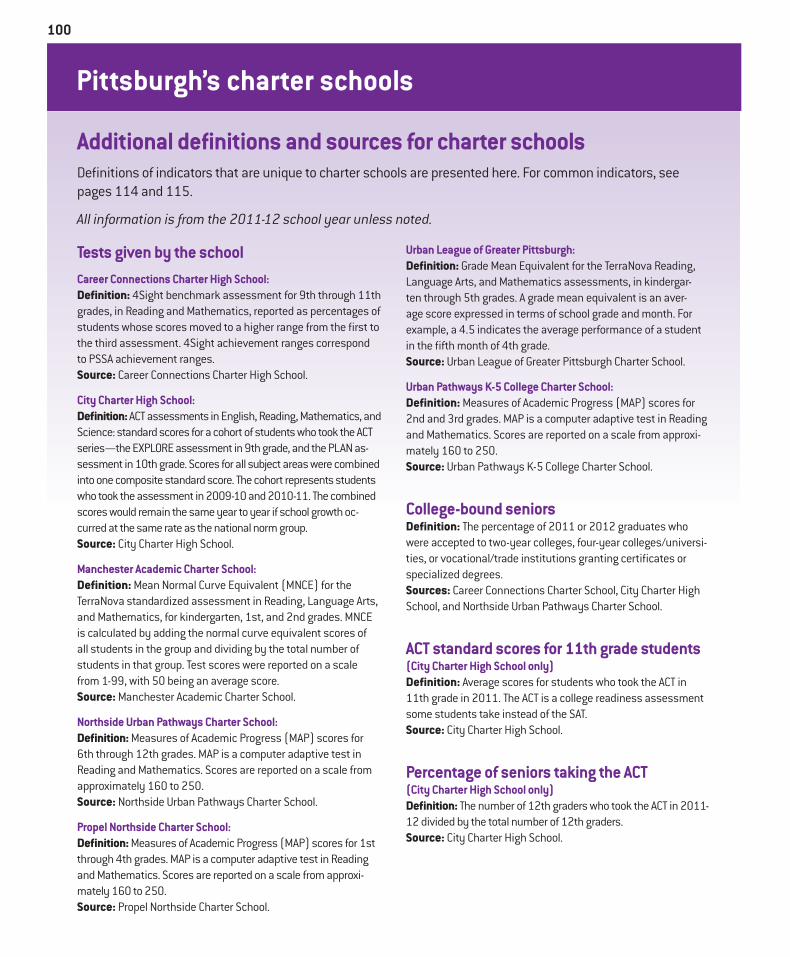
Additional definitions and sources for charter schoolsDefinitions of indicators that are unique to charter schools are presented here. For common indicators, see pages 114 and 115.
All information is from the 2011-12 school year unless noted.
100
Tests given by the schoolCareer Connections Charter High School:Definition: 4Sight benchmark assessment for 9th through 11th grades, in Reading and Mathematics, reported as percentages of students whose scores moved to a higher range from the first to the third assessment. 4Sight achievement ranges correspond to PSSA achievement ranges.Source: Career Connections Charter High School.
City Charter High School:Definition: ACT assessments in English, Reading, Mathematics, and Science: standard scores for a cohort of students who took the ACT series—the EXPLORE assessment in 9th grade, and the PLAN as-sessment in 10th grade. Scores for all subject areas were combined into one composite standard score. The cohort represents students who took the assessment in 2009-10 and 2010-11. The combined scores would remain the same year to year if school growth oc-curred at the same rate as the national norm group.Source: City Charter High School.
Manchester Academic Charter School:Definition: Mean Normal Curve Equivalent (MNCE) for the TerraNova standardized assessment in Reading, Language Arts, and Mathematics, for kindergarten, 1st, and 2nd grades. MNCE is calculated by adding the normal curve equivalent scores of all students in the group and dividing by the total number of students in that group. Test scores were reported on a scale from 1-99, with 50 being an average score.Source: Manchester Academic Charter School.
Northside Urban Pathways Charter School:Definition: Measures of Academic Progress (MAP) scores for 6th through 12th grades. MAP is a computer adaptive test in Reading and Mathematics. Scores are reported on a scale from approximately 160 to 250.Source: Northside Urban Pathways Charter School.
Propel Northside Charter School:Definition: Measures of Academic Progress (MAP) scores for 1st through 4th grades. MAP is a computer adaptive test in Reading and Mathematics. Scores are reported on a scale from approxi-mately 160 to 250.Source: Propel Northside Charter School.
Urban League of Greater Pittsburgh:Definition: Grade Mean Equivalent for the TerraNova Reading, Language Arts, and Mathematics assessments, in kindergar-ten through 5th grades. A grade mean equivalent is an aver-age score expressed in terms of school grade and month. For example, a 4.5 indicates the average performance of a student in the fifth month of 4th grade.Source: Urban League of Greater Pittsburgh Charter School.
Urban Pathways K-5 College Charter School:Definition: Measures of Academic Progress (MAP) scores for 2nd and 3rd grades. MAP is a computer adaptive test in Reading and Mathematics. Scores are reported on a scale from approxi-mately 160 to 250.Source: Urban Pathways K-5 College Charter School.
College-bound seniorsDefinition: The percentage of 2011 or 2012 graduates who were accepted to two-year colleges, four-year colleges/universi-ties, or vocational/trade institutions granting certificates or specialized degrees.Sources: Career Connections Charter School, City Charter High School, and Northside Urban Pathways Charter School.
ACT standard scores for 11th grade students (City Charter High School only)Definition: Average scores for students who took the ACT in 11th grade in 2011. The ACT is a college readiness assessment some students take instead of the SAT. Source: City Charter High School.
Percentage of seniors taking the ACT (City Charter High School only)Definition: The number of 12th graders who took the ACT in 2011-12 divided by the total number of 12th graders.Source: City Charter High School.
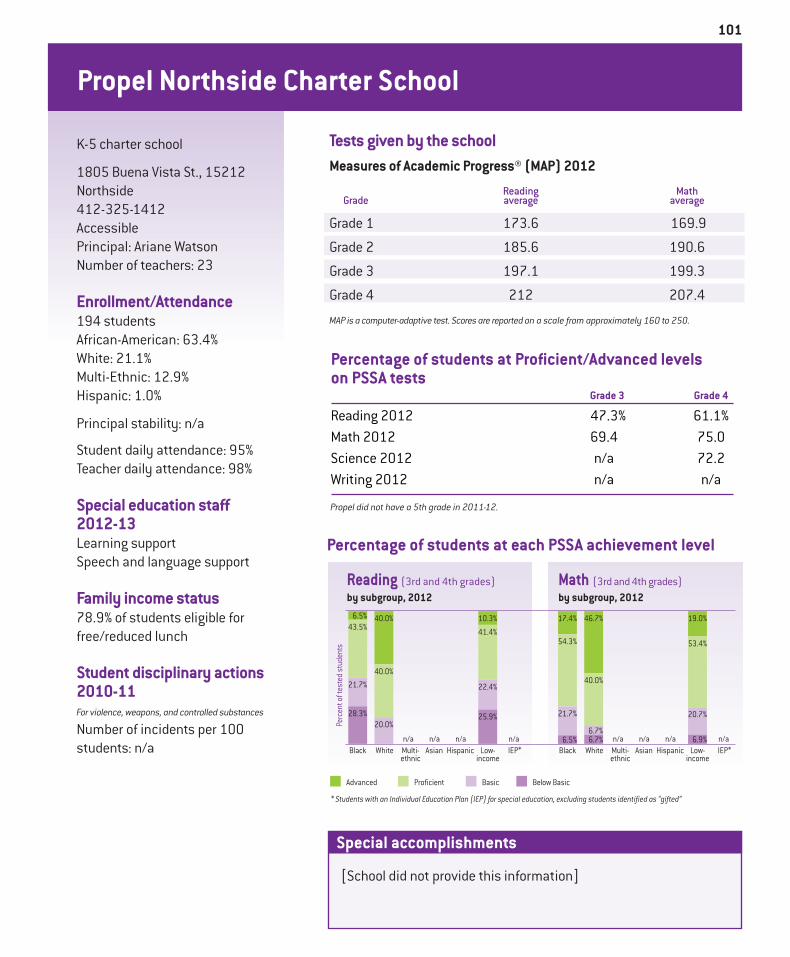
Propel Northside Charter School
101
K-5 charter school
1805 Buena Vista St., 15212Northside412-325-1412AccessiblePrincipal: Ariane WatsonNumber of teachers: 23
Enrollment/Attendance194 studentsAfrican-American: 63.4%White: 21.1%Multi-Ethnic: 12.9%Hispanic: 1.0%
Principal stability: n/a
Student daily attendance: 95%Teacher daily attendance: 98%
Special education staff 2012-13Learning supportSpeech and language support
Family income status78.9% of students eligible for free/reduced lunch
Student disciplinary actions 2010-11For violence, weapons, and controlled substances
Number of incidents per 100 students: n/a
[School did not provide this information]
Special accomplishments
Percentage of students at Proficient/Advanced levels on PSSA tests
Percentage of students at each PSSA achievement level
Grade 3 Grade 4
Reading 2012 47.3% 61.1%Math 2012 69.4 75.0Science 2012 n/a 72.2Writing 2012 n/a n/a
Perc
ent o
f tes
ted
stud
ents
Black
Advanced
White Low-income
IEP*Asian HispanicMulti-ethnic
Reading (3rd and 4th grades)by subgroup, 2012
Math (3rd and 4th grades)by subgroup, 2012
28.3%
21.7%
43.5%6.5%
22.4%
25.9%
41.4%
10.3%
n/a
20.0%
40.0%
40.0%
n/a n/an/aBlack White Low-
incomeIEP*Asian HispanicMulti-
ethnic
6.5%
21.7%
54.3%
17.4%
20.7%
6.9%
53.4%
19.0%
n/a6.7%6.7%
40.0%
46.7%
n/a n/an/a
* Students with an Individual Education Plan (IEP) for special education, excluding students identified as “gifted”
Proficient Basic Below Basic
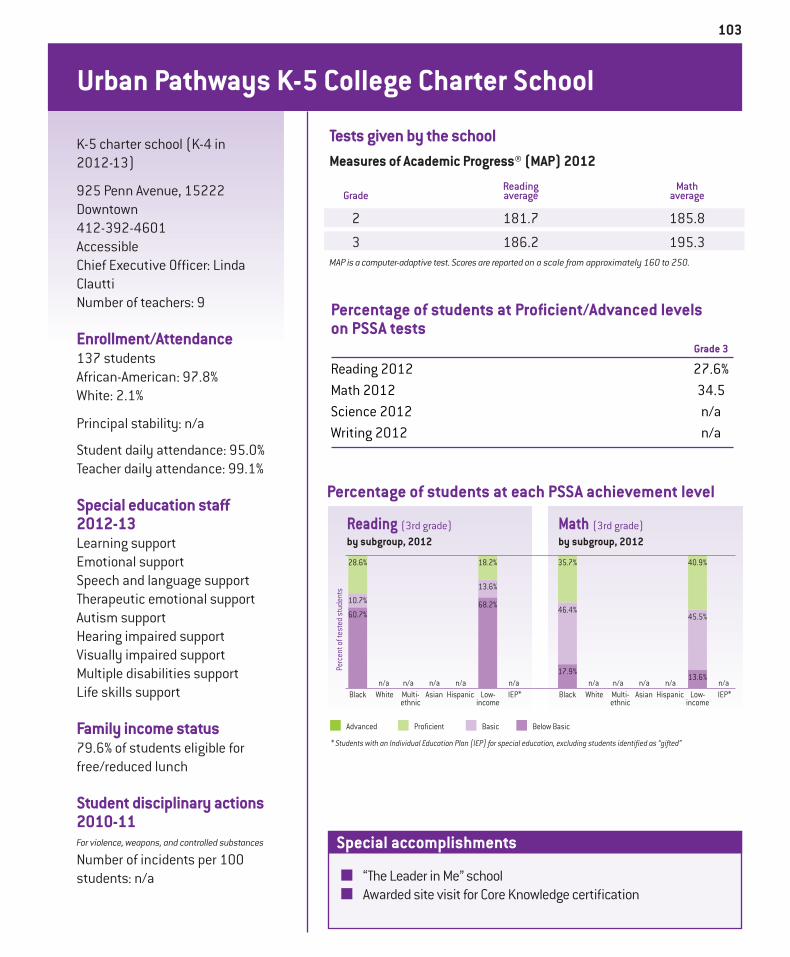
Measures of Academic Progress® (MAP) 2012
Reading Math Grade average average
Grade 1 173.6 169.9
Grade 2 185.6 190.6
Grade 3 197.1 199.3
Grade 4 212 207.4
MAP is a computer-adaptive test. Scores are reported on a scale from approximately 160 to 250.
Tests given by the school
Propel did not have a 5th grade in 2011-12.
Urban League of Greater Pittsburgh Charter School
K-5 charter school
327 N. Negley Ave., 15206East Liberty412-361-1008Accessible entrance, no elevatorPrincipal/Chief Executive Officer: Gail EdwardsNumber of teachers: 21
Enrollment/Attendance222 students African-American: 100%
Administrator stability: 1 principal/chief executive officer in the last four years
Student daily attendance: 93%Teacher daily attendance: 90%
Special education staff 2012-13Learning supportSpeech and language supportMultiple disabilities support
Family income status86% of students eligible for free/reduced lunch
Student disciplinary actions 2010-11For violence, weapons, and controlled substances
Number of incidents per 100 students: 3.9
102
n Edible Schoolyard siten Student competed in 2012 Western
PA Spelling Bee
Special accomplishments
2009 2010
100%Math (Fifth grade)Reading (Fifth grade)
2011 2012 2009 2010 2011 2012
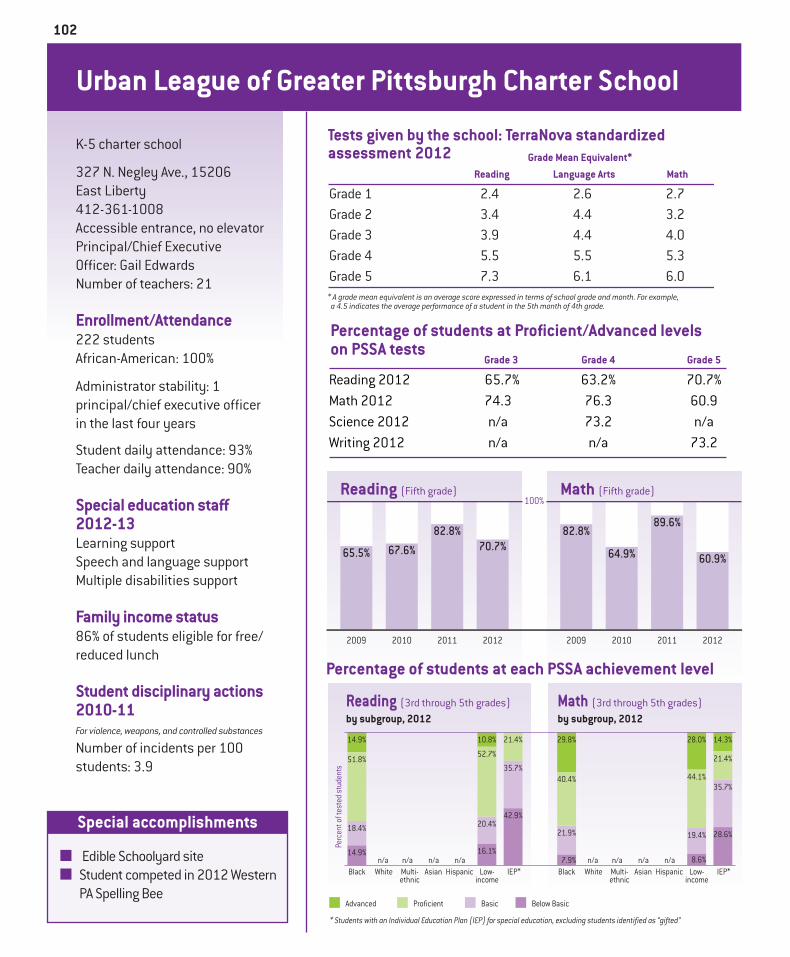
65.5% 67.6%
82.8%70.7%
82.8%
64.9%
89.6%
60.9%
Percentage of students at Proficient/Advanced levels on PSSA tests
Percentage of students at each PSSA achievement level
Grade 3 Grade 4 Grade 5
Reading 2012 65.7% 63.2% 70.7% Math 2012 74.3 76.3 60.9 Science 2012 n/a 73.2 n/a Writing 2012 n/a n/a 73.2
Perc
ent o
f tes
ted
stud
ents
Black
Advanced
White Low-income
IEP*Asian HispanicMulti-ethnic
Reading (3rd through 5th grades)by subgroup, 2012
Math (3rd through 5th grades)by subgroup, 2012
14.9%
18.4%
51.8%
14.9%
20.4%
16.1%
52.7%
10.8%
42.9%
35.7%
21.4%
n/a n/a n/an/aBlack White Low-
incomeIEP*Asian HispanicMulti-
ethnic
7.9%
21.9%
40.4%
29.8%
19.4%
8.6%
44.1%
28.0%
28.6%
35.7%
21.4%
14.3%
n/a n/a n/an/a
* Students with an Individual Education Plan (IEP) for special education, excluding students identified as “gifted”
Proficient Basic Below Basic
Tests given by the school: TerraNova standardized assessment 2012
* A grade mean equivalent is an average score expressed in terms of school grade and month. For example, a 4.5 indicates the average performance of a student in the 5th month of 4th grade.
Grade Mean Equivalent* Reading Language Arts Math
Grade 1 2.4 2.6 2.7Grade 2 3.4 4.4 3.2Grade 3 3.9 4.4 4.0Grade 4 5.5 5.5 5.3Grade 5 7.3 6.1 6.0
Urban Pathways K-5 College Charter School
K-5 charter school (K-4 in 2012-13)
925 Penn Avenue, 15222Downtown412-392-4601AccessibleChief Executive Officer: Linda ClauttiNumber of teachers: 9
Enrollment/Attendance137 studentsAfrican-American: 97.8%White: 2.1%
Principal stability: n/a
Student daily attendance: 95.0%Teacher daily attendance: 99.1%
Special education staff 2012-13Learning supportEmotional supportSpeech and language supportTherapeutic emotional supportAutism supportHearing impaired supportVisually impaired supportMultiple disabilities supportLife skills support
Family income status79.6% of students eligible for free/reduced lunch
Student disciplinary actions 2010-11For violence, weapons, and controlled substances
Number of incidents per 100 students: n/a
103
n “The Leader in Me” schooln Awarded site visit for Core Knowledge certification
Special accomplishments
Percentage of students at Proficient/Advanced levels on PSSA tests
Percentage of students at each PSSA achievement level
Grade 3
Reading 2012 27.6%Math 2012 34.5Science 2012 n/aWriting 2012 n/a
Perc
ent o
f tes
ted
stud
ents
Black
Advanced
White Low-income
IEP*Asian HispanicMulti-ethnic
Reading (3rd grade)by subgroup, 2012
Math (3rd grade)by subgroup, 2012
60.7%
10.7%
28.6%
13.6%
68.2%
18.2%
n/an/a n/a n/an/aBlack White Low-
incomeIEP*Asian HispanicMulti-
ethnic
17.9%
46.4%
35.7%
45.5%
13.6%
40.9%
n/an/a n/a n/an/a
* Students with an Individual Education Plan (IEP) for special education, excluding students identified as “gifted”
Proficient Basic Below Basic
Measures of Academic Progress® (MAP) 2012
Reading Math Grade average average
2 181.7 185.8
3 186.2 195.3 MAP is a computer-adaptive test. Scores are reported on a scale from approximately 160 to 250.
Tests given by the school
The Environmental Charter School at Frick Park
K-8 charter school, housed in two buildings(K-7 in 2012-13)
Lower school (K-3): 309 S. Braddock Ave., 15221Regent Square412-242-1480AccessiblePrincipal: Tawana CookUpper school (4-7):829 Milton St., 15218Regent Square412-247-7970Accessible entrance, no elevatorPrincipal: Stephen Pellathy Number of teachers: 49
Enrollment/Attendance525 students
African-American: 23.9% White: 61.1%Multi-ethnic: 6.0%Asian: 3.1%Hispanic: 4.9%Other: 0.9%
Principal stability: Upper school, 1 principal in the last four years; lower school, n/a
Student daily attendance: 95.6%Teacher daily attendance: 97%
104
[School did not provide this information]
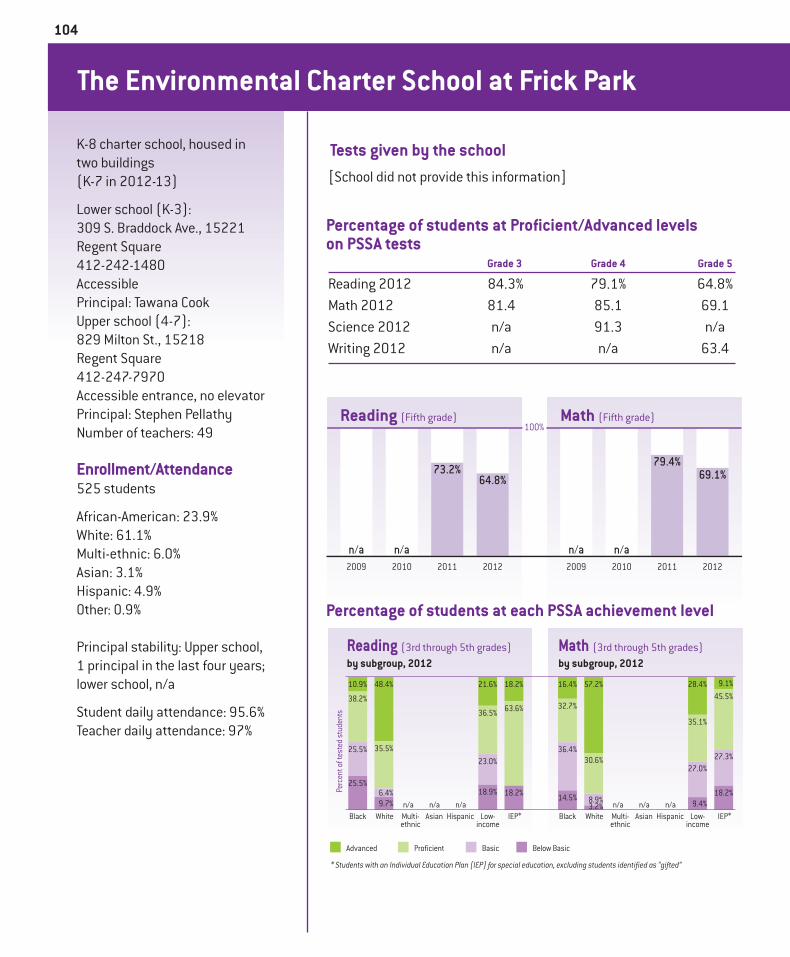
Tests given by the school
2009 2010
100%Math (Fifth grade)Reading (Fifth grade)
2011 2012 2009 2010 2011 2012
n/a n/a
73.2%64.8%
n/a n/a
79.4%69.1%
Percentage of students at Proficient/Advanced levels on PSSA tests Grade 3 Grade 4 Grade 5
Reading 2012 84.3% 79.1% 64.8%Math 2012 81.4 85.1 69.1Science 2012 n/a 91.3 n/aWriting 2012 n/a n/a 63.4
Perc
ent o
f tes
ted
stud
ents
Black
Advanced
White Low-income
IEP*Asian HispanicMulti-ethnic
Reading (3rd through 5th grades)by subgroup, 2012
Math (3rd through 5th grades)by subgroup, 2012
25.5%
25.5%
38.2%
10.9%
23.0%
18.9%
36.5%
21.6%
18.2%
63.6%
18.2%
9.7%6.4%
35.5%
48.4%
n/a n/an/aBlack White Low-
incomeIEP*Asian HispanicMulti-
ethnic
14.5%
36.4%
32.7%
16.4%
27.0%
9.4%
35.1%
28.4%
18.2%
27.3%
45.5%9.1%
3.2%8.9%
30.6%
57.2%
n/a n/an/a
* Students with an Individual Education Plan (IEP) for special education, excluding students identified as “gifted”
Proficient Basic Below Basic
Percentage of students at each PSSA achievement level
Special education staff 2012-13Learning supportSpeech and language support
Family income status34.5% of students eligible for free/reduced lunch
Student disciplinary actions 2010-11For violence, weapons, and controlled substances
Number of incidents per 100 students: 0
105
n School received Honorable Mention from Green Ribbon Schools
n Locally produced school lunches through partnership with Springboard Kitchens
Special accomplishments
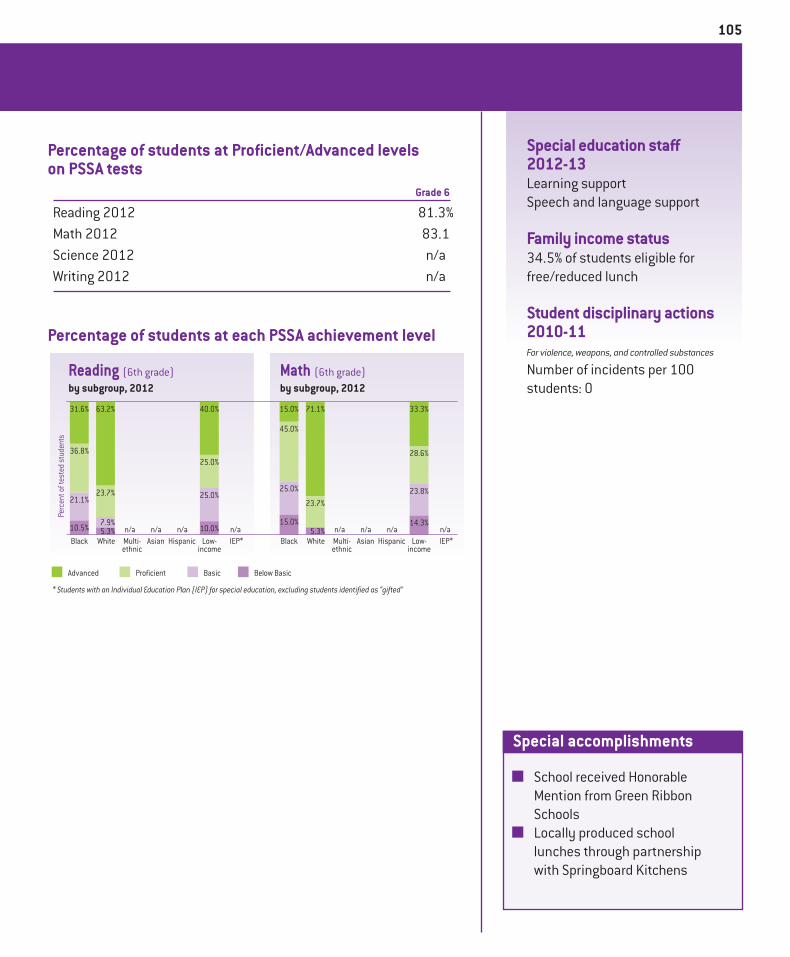
Percentage of students at Proficient/Advanced levels on PSSA tests
Grade 6
Reading 2012 81.3%Math 2012 83.1 Science 2012 n/aWriting 2012 n/a
Perc
ent o
f tes
ted
stud
ents
Black
Advanced
White Low-income
IEP*Asian HispanicMulti-ethnic
Reading (6th grade)by subgroup, 2012
Math (6th grade)by subgroup, 2012
10.5%
21.1%
36.8%
31.6%
25.0%
10.0%
25.0%
40.0%
n/a5.3%7.9%
23.7%
63.2%
n/a n/an/aBlack White Low-
incomeIEP*Asian HispanicMulti-
ethnic
15.0%
25.0%
45.0%
15.0%
23.8%
14.3%
28.6%
33.3%
n/a5.3%
23.7%
71.1%
n/a n/an/a
* Students with an Individual Education Plan (IEP) for special education, excluding students identified as “gifted”
Proficient Basic Below Basic
Percentage of students at each PSSA achievement level
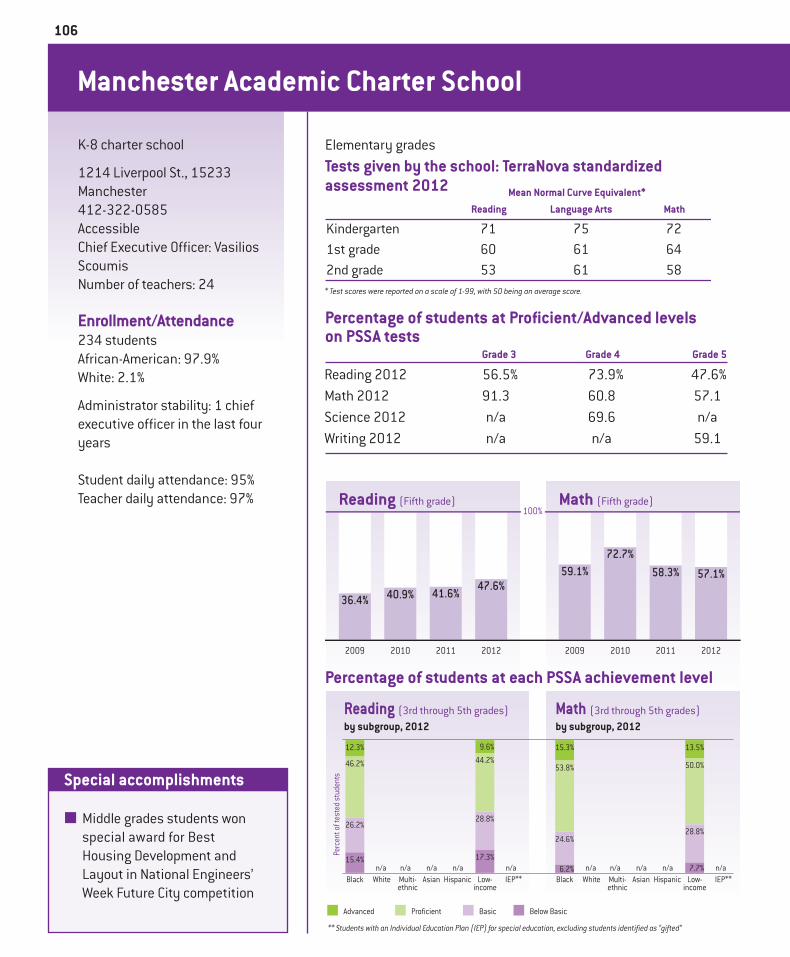
Manchester Academic Charter School
K-8 charter school
1214 Liverpool St., 15233Manchester412-322-0585AccessibleChief Executive Officer: Vasilios ScoumisNumber of teachers: 24
Enrollment/Attendance234 studentsAfrican-American: 97.9%White: 2.1%
Administrator stability: 1 chief executive officer in the last four years
Student daily attendance: 95%Teacher daily attendance: 97%
106
Tests given by the school: TerraNova standardized assessment 2012 Mean Normal Curve Equivalent*
Reading Language Arts Math
Kindergarten 71 75 721st grade 60 61 642nd grade 53 61 58* Test scores were reported on a scale of 1-99, with 50 being an average score.
2009 2010
100%Math (Fifth grade)Reading (Fifth grade)
2011 2012 2009 2010 2011 2012
36.4% 40.9% 41.6% 47.6%59.1%
72.7%58.3% 57.1%
Percentage of students at Proficient/Advanced levels on PSSA tests
Percentage of students at each PSSA achievement level
Grade 3 Grade 4 Grade 5 District*
Reading 2012 56.5% 73.9% 47.6% Math 2012 91.3 60.8 57.1Science 2012 n/a 69.6 n/aWriting 2012 n/a n/a 59.1
Perc
ent o
f tes
ted
stud
ents
Black
Advanced
White Low-income
IEP**Asian HispanicMulti-ethnic
Reading (3rd through 5th grades)by subgroup, 2012
Math (3rd through 5th grades)by subgroup, 2012
15.4%
26.2%
46.2%
12.3%
28.8%
17.3%
44.2%9.6%
n/an/a n/a n/an/aBlack White Low-
incomeIEP**Asian HispanicMulti-
ethnic
6.2%
24.6%
53.8%
15.3%
28.8%
7.7%
50.0%
13.5%
n/an/a n/a n/an/a
** Students with an Individual Education Plan (IEP) for special education, excluding students identified as “gifted”
Proficient Basic Below Basic
n Middle grades students won special award for Best Housing Development and Layout in National Engineers’ Week Future City competition
Special accomplishments
Elementary grades
107
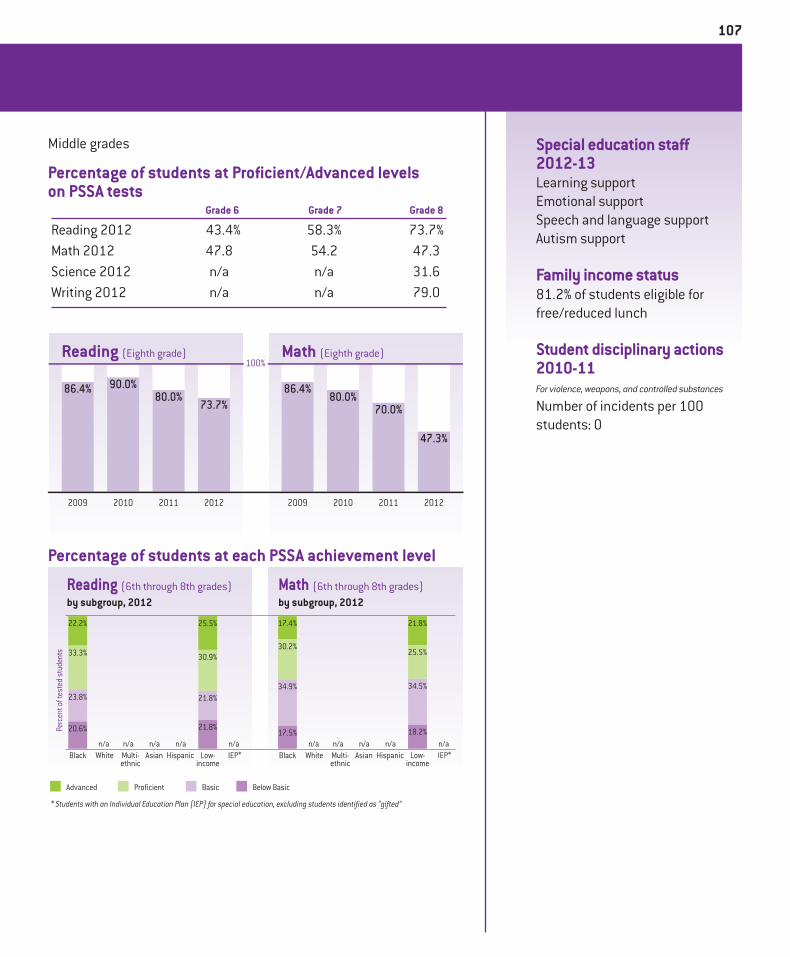
Special education staff 2012-13Learning supportEmotional supportSpeech and language supportAutism support
Family income status81.2% of students eligible for free/reduced lunch
Student disciplinary actions 2010-11For violence, weapons, and controlled substances
Number of incidents per 100 students: 0
Percentage of students at Proficient/Advanced levels on PSSA tests
2009 2010
100%Math (Eighth grade)Reading (Eighth grade)
2011 2012 2009 2010 2011 2012
86.4% 90.0%80.0%
73.7%86.4%
80.0%70.0%
47.3%
Grade 6 Grade 7 Grade 8
Reading 2012 43.4% 58.3% 73.7% Math 2012 47.8 54.2 47.3 Science 2012 n/a n/a 31.6 Writing 2012 n/a n/a 79.0
Middle grades
Percentage of students at each PSSA achievement level
Perc
ent o
f tes
ted
stud
ents
Black
Advanced
White Low-income
IEP*Asian HispanicMulti-ethnic
Reading (6th through 8th grades)by subgroup, 2012
Math (6th through 8th grades)by subgroup, 2012
20.6%
23.8%
33.3%
22.2%
21.8%
21.8%
30.9%
25.5%
n/an/a n/a n/an/aBlack White Low-
incomeIEP*Asian HispanicMulti-
ethnic
17.5%
34.9%
30.2%
17.4%
34.5%
18.2%
25.5%
21.8%
n/an/a n/a n/an/a
* Students with an Individual Education Plan (IEP) for special education, excluding students identified as “gifted”
Proficient Basic Below Basic
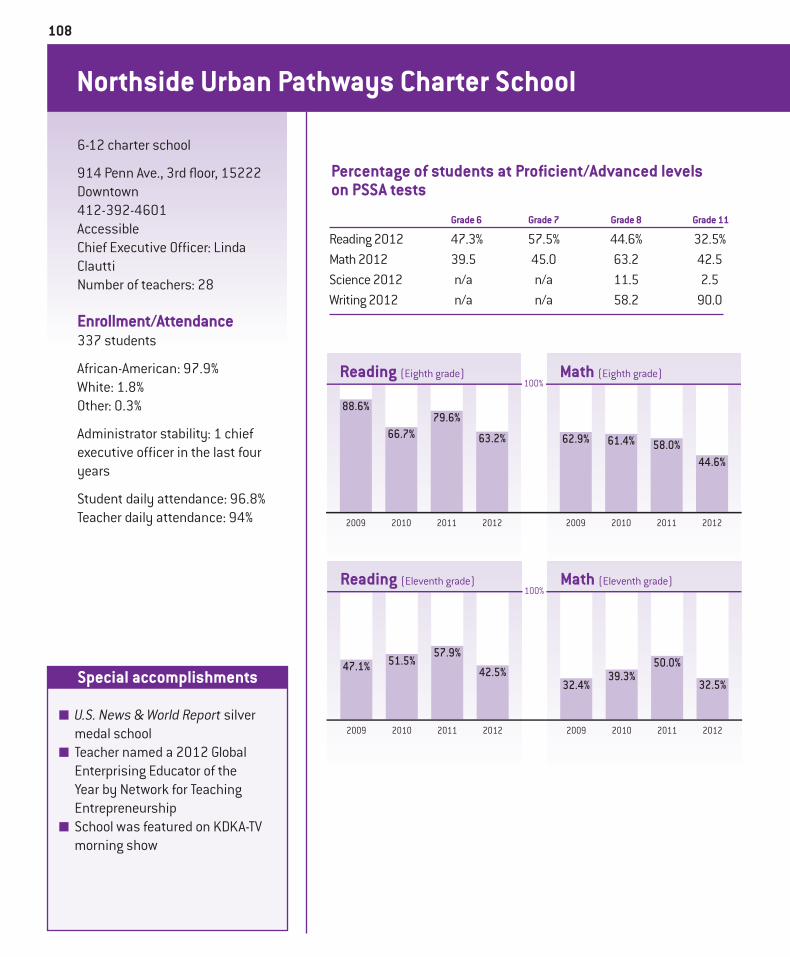
Northside Urban Pathways Charter School
6-12 charter school
914 Penn Ave., 3rd floor, 15222Downtown412-392-4601AccessibleChief Executive Officer: Linda Clautti Number of teachers: 28
Enrollment/Attendance337 students
African-American: 97.9% White: 1.8%Other: 0.3%
Administrator stability: 1 chief executive officer in the last four years
Student daily attendance: 96.8%Teacher daily attendance: 94%
108
n U.S. News & World Report silver medal school
n Teacher named a 2012 Global Enterprising Educator of the Year by Network for Teaching Entrepreneurship
n School was featured on KDKA-TV morning show
Special accomplishments
Percentage of students at Proficient/Advanced levels on PSSA tests
Grade 6 Grade 7 Grade 8 Grade 11
Reading 2012 47.3% 57.5% 44.6% 32.5% Math 2012 39.5 45.0 63.2 42.5Science 2012 n/a n/a 11.5 2.5Writing 2012 n/a n/a 58.2 90.0
2009 2010
100%Math (Eighth grade)Reading (Eighth grade)
2011 2012 2009 2010 2011 2012
88.6%
66.7%79.6%
63.2% 62.9% 61.4% 58.0%44.6%
2009 2010
100%Math (Eleventh grade)Reading (Eleventh grade)
2011 2012 2009 2010 2011 2012
47.1% 51.5%57.9%
42.5%32.4%
39.3%50.0%
32.5%
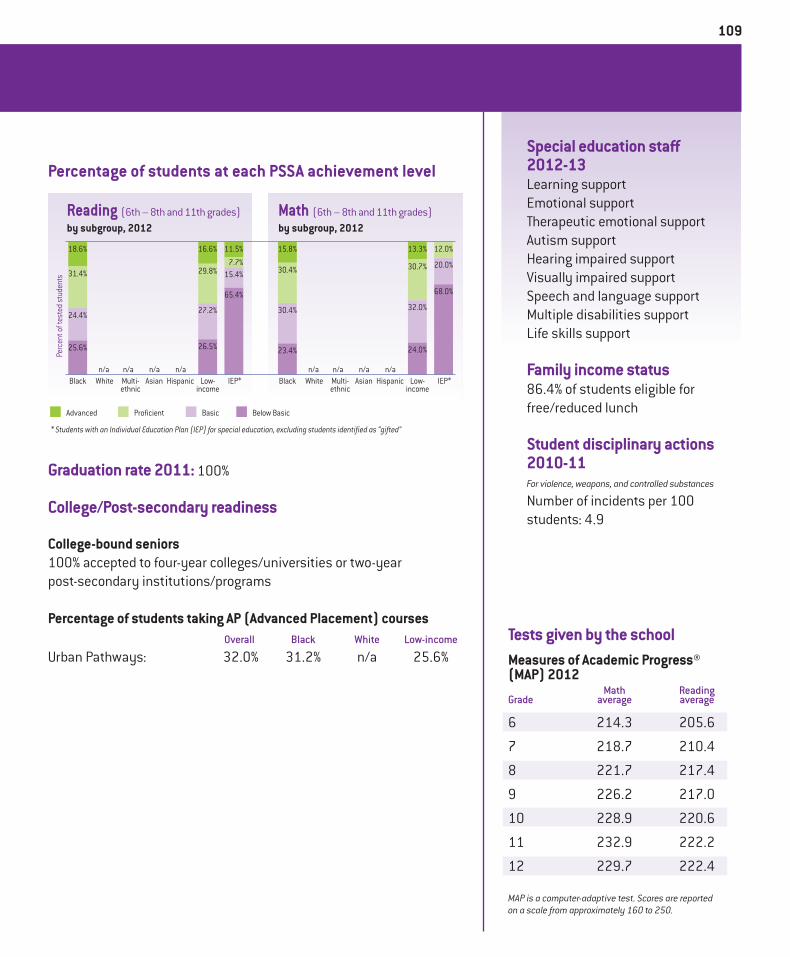
Special education staff 2012-13Learning supportEmotional supportTherapeutic emotional supportAutism supportHearing impaired supportVisually impaired supportSpeech and language supportMultiple disabilities supportLife skills support
Family income status86.4% of students eligible for free/reduced lunch
Student disciplinary actions 2010-11For violence, weapons, and controlled substances
Number of incidents per 100 students: 4.9
Graduation rate 2011: 100%
College/Post-secondary readiness
College-bound seniors100% accepted to four-year colleges/universities or two-year post-secondary institutions/programs
Percentage of students taking AP (Advanced Placement) courses Overall Black White Low-income
Urban Pathways: 32.0% 31.2% n/a 25.6%
109
Perc
ent o
f tes
ted
stud
ents
Black
Advanced
White Low-income
IEP*Asian HispanicMulti-ethnic
Reading (6th – 8th and 11th grades)by subgroup, 2012
Math (6th – 8th and 11th grades)by subgroup, 2012
25.6%
24.4%
31.4%
18.6%
27.2%
26.5%
29.8%
16.6%
65.4%
15.4%7.7%
11.5%
n/a n/a n/an/aBlack White Low-
incomeIEP*Asian HispanicMulti-
ethnic
23.4%
30.4%
30.4%
15.8%
32.0%
24.0%
30.7%
13.3%
68.0%
20.0%
12.0%
n/a n/a n/an/a
* Students with an Individual Education Plan (IEP) for special education, excluding students identified as “gifted”
Proficient Basic Below Basic
Percentage of students at each PSSA achievement level
Measures of Academic Progress® (MAP) 2012 Math ReadingGrade average average
6 214.3 205.6
7 218.7 210.4
8 221.7 217.4
9 226.2 217.0
10 228.9 220.6
11 232.9 222.2
12 229.7 222.4
MAP is a computer-adaptive test. Scores are reported on a scale from approximately 160 to 250.
Tests given by the school
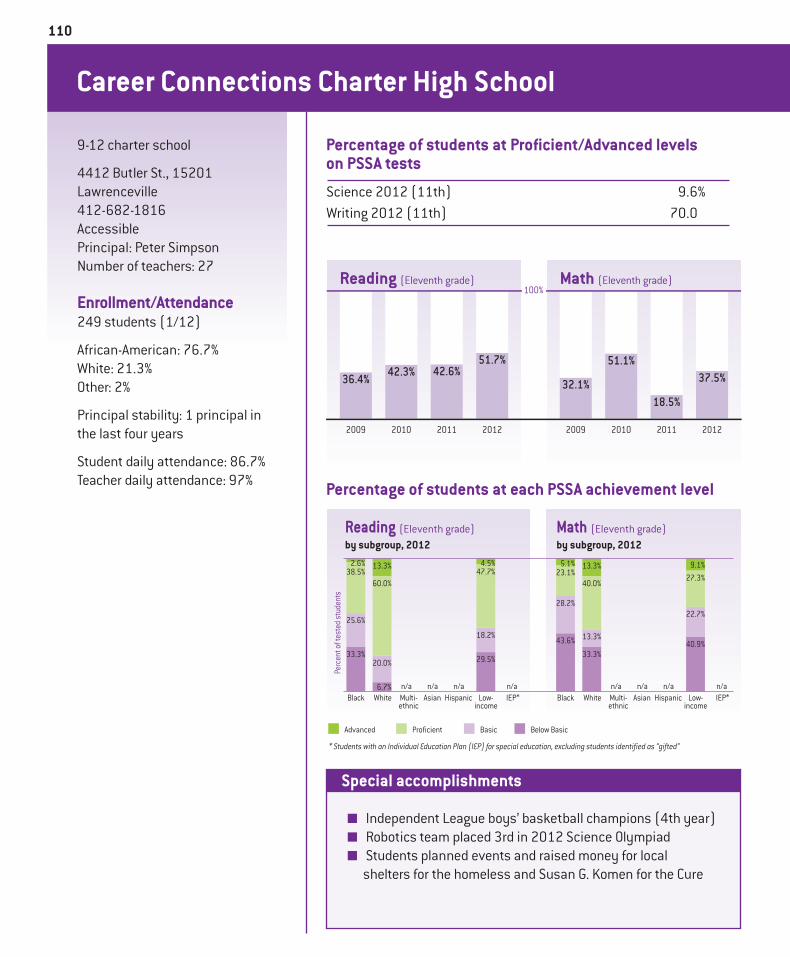
Career Connections Charter High School
9-12 charter school
4412 Butler St., 15201Lawrenceville412-682-1816AccessiblePrincipal: Peter SimpsonNumber of teachers: 27
Enrollment/Attendance249 students (1/12)
African-American: 76.7%White: 21.3%Other: 2%
Principal stability: 1 principal in the last four years
Student daily attendance: 86.7%Teacher daily attendance: 97%
110
n Independent League boys’ basketball champions (4th year)n Robotics team placed 3rd in 2012 Science Olympiadn Students planned events and raised money for local
shelters for the homeless and Susan G. Komen for the Cure
Special accomplishments
Percentage of students at Proficient/Advanced levels on PSSA tests
Science 2012 (11th) 9.6%Writing 2012 (11th) 70.0
2009 2010
100%Math (Eleventh grade)Reading (Eleventh grade)
2011 2012 2009 2010 2011 2012
36.4% 42.3% 42.6%51.7%
32.1%
51.1%
18.5%
37.5%
Perc
ent o
f tes
ted
stud
ents
Black
Advanced
White Low-income
IEP*Asian HispanicMulti-ethnic
Reading (Eleventh grade)by subgroup, 2012
Math (Eleventh grade)by subgroup, 2012
33.3%
25.6%
38.5%2.6%
18.2%
29.5%
47.7%4.5%
n/a6.7%
20.0%
60.0%
13.3%
n/a n/an/aBlack White Low-
incomeIEP*Asian HispanicMulti-
ethnic
43.6%
28.2%
23.1%5.1%
22.7%
40.9%
27.3%9.1%
n/a
33.3%
13.3%
40.0%
13.3%
n/a n/an/a
* Students with an Individual Education Plan (IEP) for special education, excluding students identified as “gifted”
Proficient Basic Below Basic
Percentage of students at each PSSA achievement level
Special education staff 2012-13Learning supportEmotional supportHearing impaired supportSpeech and language supportMultiple disabilities support
Family income status83.5% of students eligible for free/reduced lunch
Student disciplinary actions 2009-10For violence, weapons, and controlled substances
Number of incidents per 100 students: 18.6
111
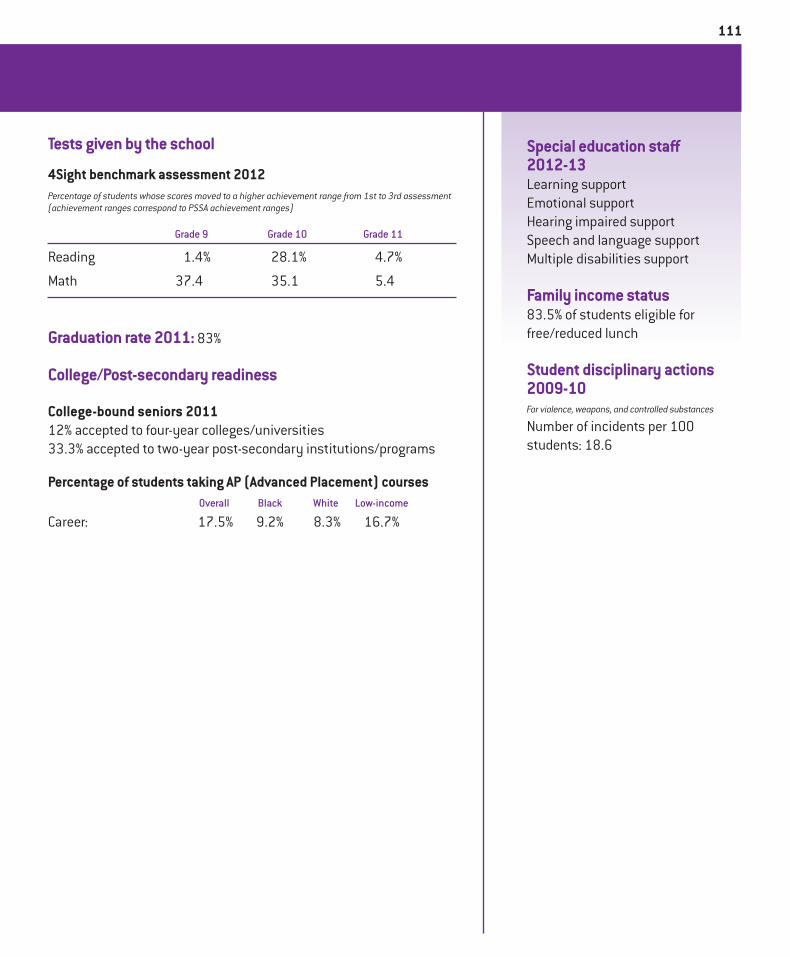
Graduation rate 2011: 83%
College/Post-secondary readiness
College-bound seniors 201112% accepted to four-year colleges/universities33.3% accepted to two-year post-secondary institutions/programs
Percentage of students taking AP (Advanced Placement) courses Overall Black White Low-income
Career: 17.5% 9.2% 8.3% 16.7%
Tests given by the school
4Sight benchmark assessment 2012Percentage of students whose scores moved to a higher achievement range from 1st to 3rd assessment (achievement ranges correspond to PSSA achievement ranges)
Grade 9 Grade 10 Grade 11
Reading 1.4% 28.1% 4.7%
Math 37.4 35.1 5.4
City Charter High School
9-12 charter school
201 Stanwix St., 15222Downtown412-690-2489AccessibleChief Executive Officer: Ron SofoNumber of teachers: 59
Enrollment/Attendance547 students
African-American: 51.6% White: 38.9%Multi-ethnic: 7.5%Hispanic: 1.6%
Administrator stability: 2 chief executive officers in the last four years
Student daily attendance: 93.5%Teacher daily attendance: 96.2%
112
n Graduating seniors earned 427 Microsoft Office Certifica-tions (MOS); 52 are MOS “masters”
n Redesigned school lunch program—all food prepared fresh on site
Special accomplishments
Percentage of students at Proficient/Advanced levels on PSSA tests
Science 2012 (11th) 34.7%Writing 2012 (11th) 94.4
2009 2010
100%Math (Eleventh grade)Reading (Eleventh grade)
2011 2012 2009 2010 2011 2012
71.8% 71.9%78.6%
85.5%
55.0% 50.8% 50.4%
79.0%Pe
rcen
t of t
este
d st
uden
ts
Black
Advanced
White Low-income
IEP*Asian HispanicMulti-ethnic
Reading (Eleventh grade)by subgroup, 2012
Math (Eleventh grade)by subgroup, 2012
6.9%
17.2%
48.3%
27.6%
11.3%3.8%
50.0%
35.0%
n/a1.9%3.8%
45.3%
49.1%
n/a n/an/aBlack White Low-
incomeIEP*Asian HispanicMulti-
ethnic
15.5%
13.8%
48.3%
22.4%
16.3%
8.8%
40.0%
35.0%
n/a3.8%7.5%
34.0%
54.7%
n/a n/an/a
* Students with an Individual Education Plan (IEP) for special education, excluding students identified as “gifted”
Proficient Basic Below Basic
Percentage of students at each PSSA achievement level
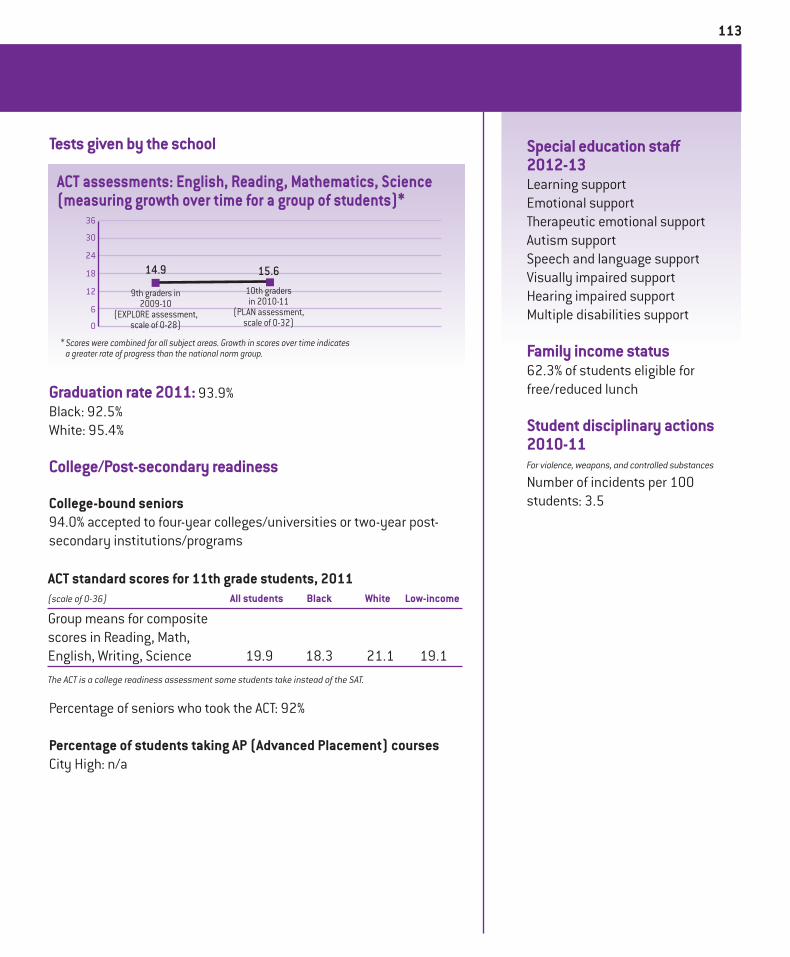
Graduation rate 2011: 93.9% Black: 92.5% White: 95.4%
College/Post-secondary readiness
College-bound seniors94.0% accepted to four-year colleges/universities or two-year post-secondary institutions/programs
Percentage of seniors who took the ACT: 92%
Percentage of students taking AP (Advanced Placement) courses City High: n/a
ACT standard scores for 11th grade students, 2011 (scale of 0-36) All students Black White Low-income
Group means for composite scores in Reading, Math, English, Writing, Science 19.9 18.3 21.1 19.1The ACT is a college readiness assessment some students take instead of the SAT.
Special education staff 2012-13Learning supportEmotional supportTherapeutic emotional supportAutism supportSpeech and language supportVisually impaired supportHearing impaired supportMultiple disabilities support
Family income status62.3% of students eligible for free/reduced lunch
Student disciplinary actions 2010-11For violence, weapons, and controlled substances
Number of incidents per 100 students: 3.5
113
ACT assessments: English, Reading, Mathematics, Science (measuring growth over time for a group of students)*
0
6
12
18
24
30
36
10th gradersin 2010-11
(PLAN assessment,scale of 0-32)
* Scores were combined for all subject areas. Growth in scores over time indicates a greater rate of progress than the national norm group.
14.9 15.6
9th graders in2009-10
(EXPLORE assessment,scale of 0-28)
Tests given by the school
Recommended