1
Physics ofComputed Radiography
Overview Acceptance Testing
Quality Control
J. Anthony Seibert, Ph.D.University o f California, DavisMedical Center , Sacramento
AAPM 1999 Annual Meeting, Nashvil le
Computed Radiography (CR)...is the generic term applied to an imaging
system comprised of:
Photostimulable Storage Phosphorto acquire the x-ray projection image
CR Readerto extract the electronic latent image
Digital electronicsto convert the signals to digital form
CR Detector• Photost imulable Storage Phosphor (PSP)• BaFBr compound, Eu activated
Phosphor Plate Cassette Holder
Computed Radiography “reader”
Information panel
Plate stacker
X-raysystem
Patient
PSPdetector
ComputedRadiograph
1. X-ray Exposure
ImageReader
2.Image
Scaling
3.ImageRecord
4.
unexposed
exposed
5.
re-usablephosphor
plate
CR Image acquisitionRIS interface CR reader interface
Download patient demographic data; select image processing algorithms
2
ID terminal: select anatomy-specific exam Bar-code reader: identify exposed cassette
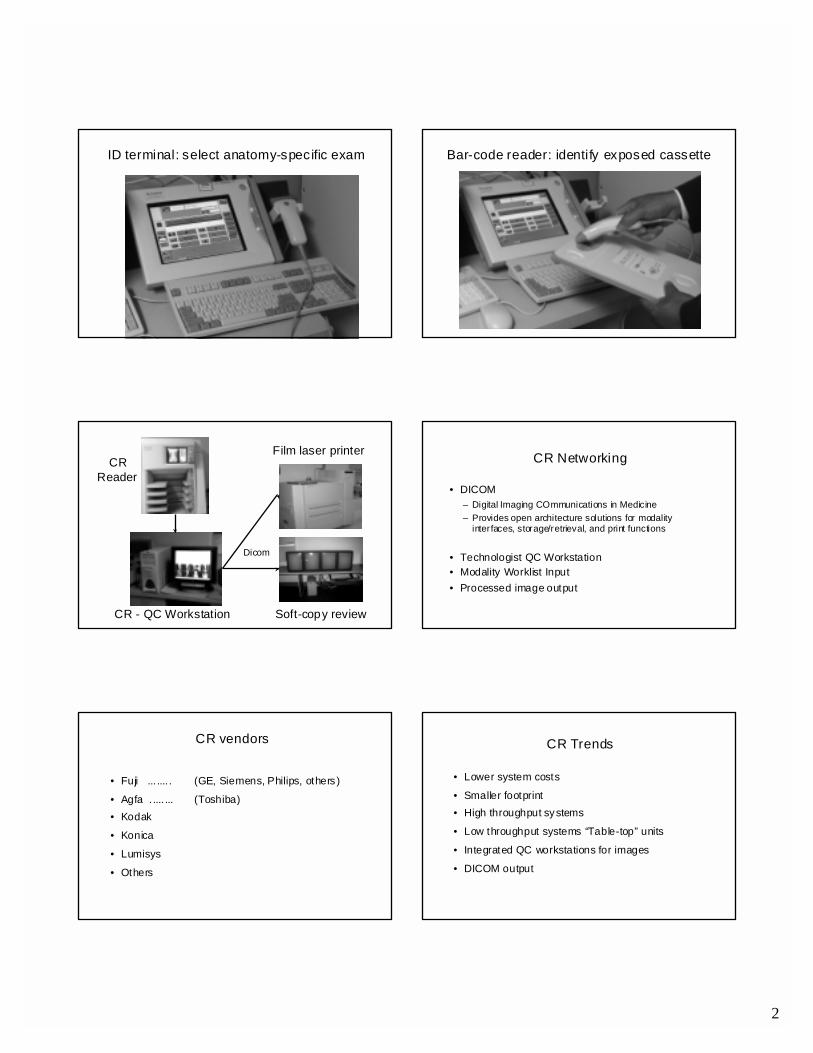
Film laser printer
CR - QC Workstation
Dicom
Soft-copy review
CRReader
CR Networking
• DICOM– Digital Imaging COmmunications in Medicine– Provides open architecture solutions for modality
interfaces, storage/retrieval, and print functions
• Technologist QC Workstation• Modality Worklist Input• Processed image output
CR vendors
• Fuji ... .... . (GE, Siemens, Philips, others )
• Agfa . .... ... (Toshiba)• Kodak
• Konica
• Lumisys
• Others
CR Trends
• Lower system costs
• Smaller footprint• High throughput systems
• Low throughput systems “Table-top” units
• Integrated QC workstations for images
• DICOM output

3
Conventional film/screen detector
Gray Scaleencoded on
filmFilm Intensifying Screens
x-rays → light
Transmitted x-rays through patient
Film processing: light to optical density
1. Acquisition, Display, Archiving
Digital x-ray detector
Chargecollection
device
X-ray converterx-rays → electrons
Transmitted x-raysthrough patient
Digitalprocessing
Analog to Digi talConversion
1. Acquisition
2. Display
3. Archiving
Dig ital to AnalogConversion
Digital PixelMatrix
PSP Latent Image FormationElectrons trapped in proportion to x-rays absorbed
Laser stimulation
2.0 eV
Conduction band
Valence band
PSL3.0 eV
ττττ ====tunneling ττττ ====recombination
ττττ ====Eu
Eu3+ / Eu2+
F F +/
phonon
8.3 eV
F centers proportional toincident x-ray intensity
Incident x-rayse-
e-e-
300400500600700800
Rel
ativ
e in
tens
ity
0.0
0.5
1.0
λ (nm)
Energy (eV)3 42.521.5
Stimulation and Emission Spectra
1.75
Stimulation Emission
HeNe633 nm
Diode680 nm
BaFBr: Eu2+
Photostimulated Luminescence
Incident Laser Beam
PMT
Protective Layer
Phosphor Layer
Base Support
LightScattering
Laser Light Spread
PhotostimulatedLuminescence
"Effective" readout diameter
ExposedImaging
Plate
Light guidePSLSignal
CR: Latent Image Readout
PMT
PolygonalMirror
LaserSource
Light channel ing gu ide
Plat e translation: Sub-scan direction
Laser beam: Sca n direction
Output Signal
Referencedetector Cylindrica l mi rror
f-θlens
ADC
To imageprocessor
4
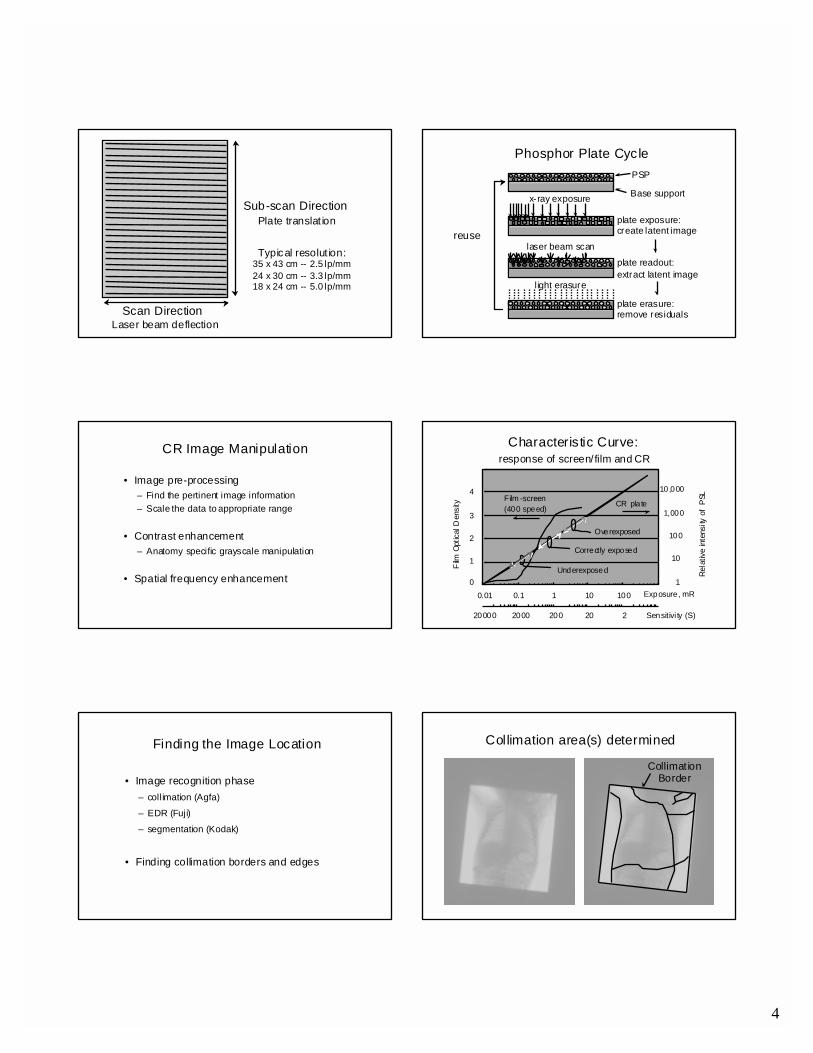
Scan Direction
Sub-scan Direction
Laser beam deflection
Plate translat ion
Typical resolut ion:35 x 43 cm -- 2.5 lp/mm24 x 30 cm -- 3.3 lp/mm18 x 24 cm -- 5.0 lp/mm
Phosphor Plate Cycle
x-ray exposure
laser beam scan
light erasure
plate exposure:create latent image
plate readout:extract latent image
plate erasure:remove residuals
PSP
Base support
reuse
CR Image Manipulation
• Image pre-processing– Find the pertinent image information– Scale the data to appropriate range
• Contrast enhancement– Anatomy specific grayscale manipulation
• Spatial frequency enhancement
CR plateFilm -screen(400 speed)
0.01 0.1 1 10 1001
10
100
1,000
10,000
Exposure, mR
Rela
tive
inten
sity
of P
SL
Film
Opt
ical D
ensit
y
0
1
2
3
4
20000 2000 200 20 2 Sensitivi ty (S)
Underexposed
Overexposed
Correctly exposed
Characteristic Curve: response of screen/film and CR
Finding the Image Location
• Image recognition phase– collimation (Agfa)
– EDR (Fuji)
– segmentation (Kodak)
• Finding collimation borders and edges
Collimation area(s) determined
Collimat ionBorder
5
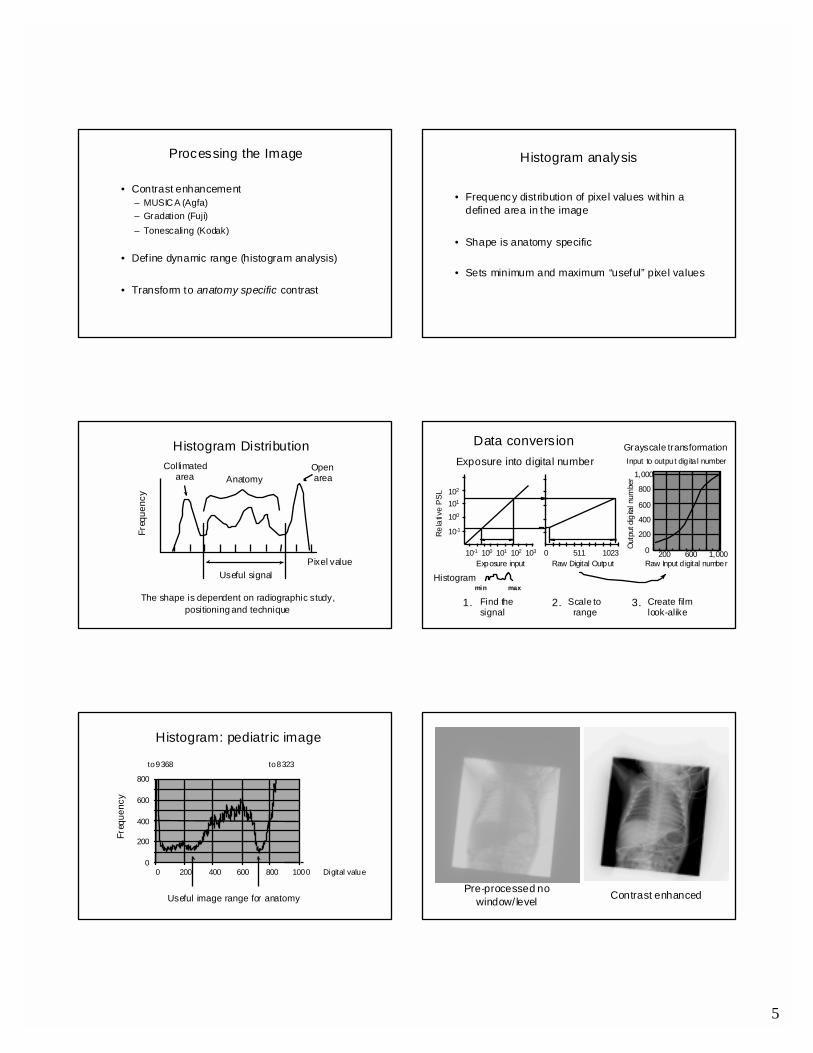
Processing the Image
• Contrast enhancement– MUSICA (Agfa)– Gradation (Fuji)– Tonescaling (Kodak)
• Def ine dynamic range (histogram analysis)
• Transform to anatomy specific contrast
Histogram analysis
• Frequency distribution of pixel values within adefined area in the image
• Shape is anatomy specific
• Sets minimum and maximum “useful” pixel values
Histogram Distribution
The shape is dependent on radiographic study,positioning and technique
AnatomyOpenarea
Collimatedarea
Freq
uenc
y
Useful signalPixel value
Data conversionExposure into digital number
200 600 1,0000
200
400
600
800
1,000
Raw Input d igital number
Outp
ut di
gital
num
ber
Create filmlook-alike
Grayscale transformationInput to output dig ita l number
Histogram
0 511 102310310-1 100 102101
Exposure input
Rela
tive
PSL
Raw Digital Output
101
10-1
100
102
Find thesignal
min max
Scale torange
1. 2. 3.
Histogram: pediatric image
0
200
400
600
800
0 400 600 800 1000 Digital value
Freq
uenc
y
to 8323to 9368
Useful image range for anatomy
200
Pre-processed nowindow/level Contrast enhanced
6
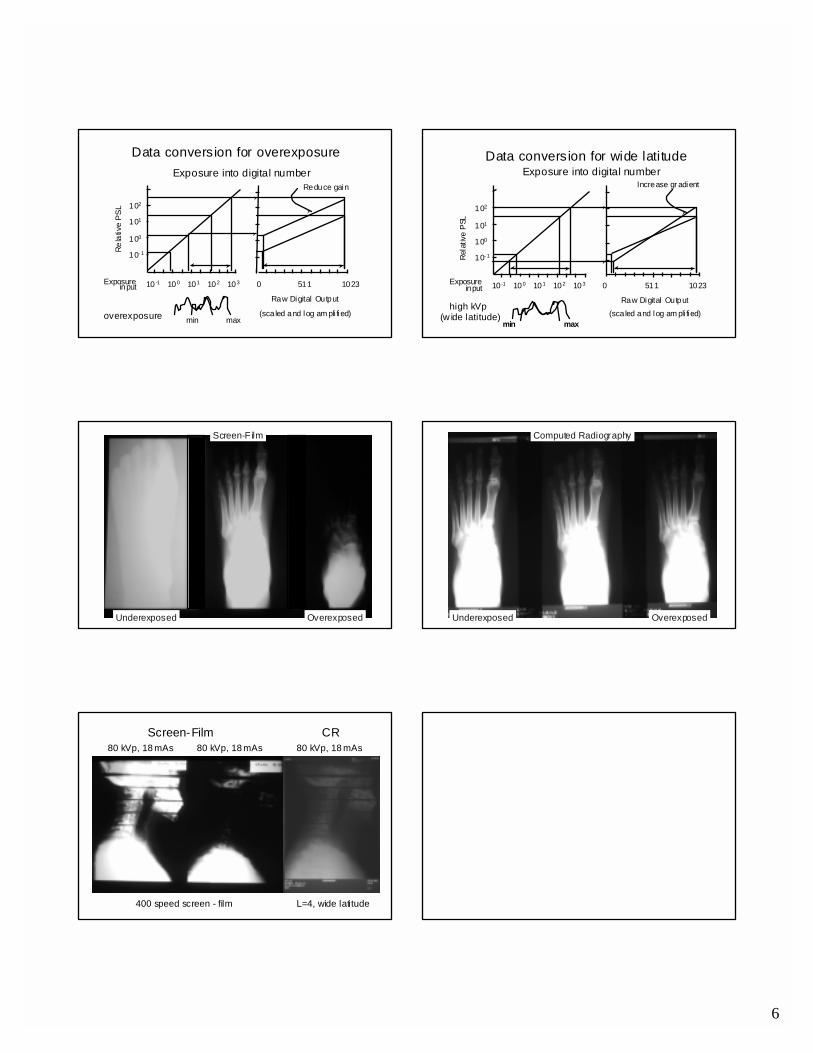
Data conversion for overexposureExposure into digital number
Exposureinput
Rela
tive
PSL
0 511 1023
Raw Digital Output
(sca led and log am pli fied)min maxoverexposure
Reduce gain
10310-1 100 102101
101
10- 1
100
102
Data conversion for wide latitudeExposure into digital number
Rela
tive
PSL
high kVp(w ide latitude)
101
10- 1
100
102
0 511 1023
Raw Digital Output(sca led and log am pli fied)
Increase gr adient
Exposureinput 10310-1 100 102101
min max
Screen-Film
Underexposed Overexposed
Computed Radiography
Underexposed Overexposed
Screen-Film80 kVp, 18 mAs 80 kVp, 18 mAs
CR80 kVp, 18 mAs
L=4, wide latitude400 speed screen - film
7
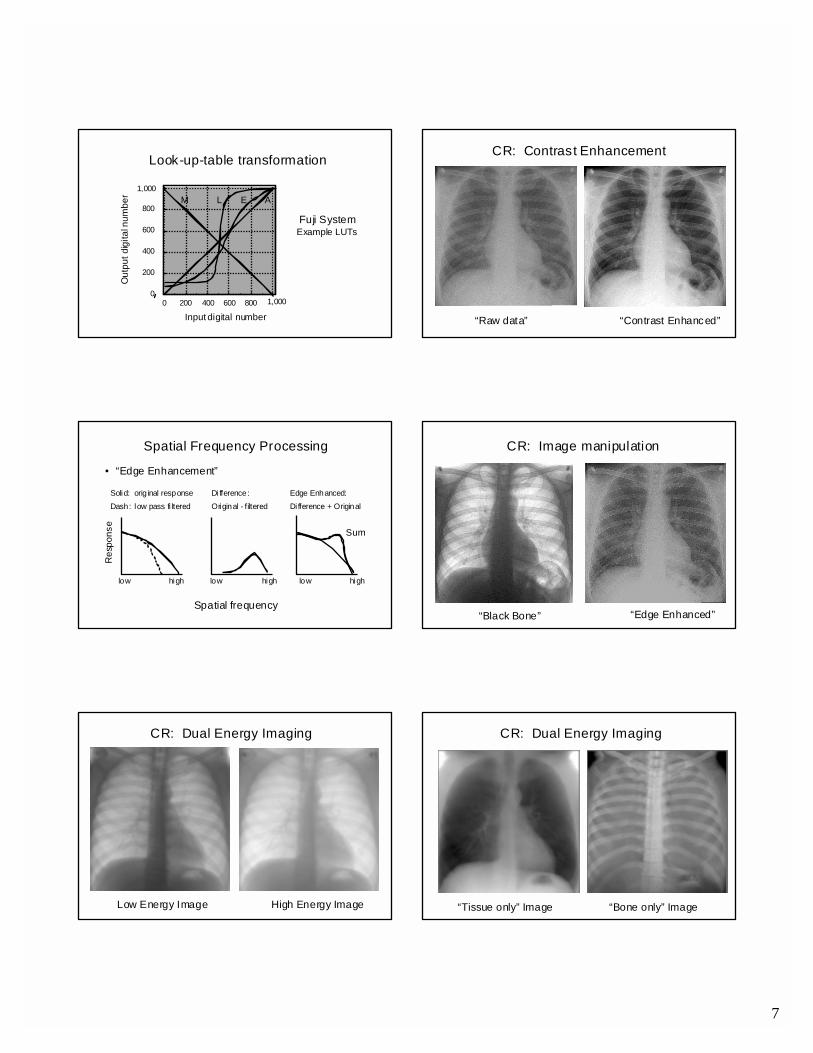
Look-up-table transformation
0 200 400 600 800 1,0000
200
400
600
800
1,000
Input digital number
Out
put d
igita
l num
ber AELM
Fuji SystemExample LUTs
CR: Contrast Enhancement
“Raw data” “Contrast Enhanced”
Spatial Frequency Processing
• “Edge Enhancement”
Solid: orig inal responseDash: low pass fi ltered
Spatial frequency
Original - filtered
Res
pons
e
low
Sum
Difference:
lowlow
Di fference + OriginalEdge Enhanced:
high highhigh
“Black Bone” “Edge Enhanced”
CR: Image manipulation
CR: Dual Energy Imaging
Low Energy Image High Energy Image
CR: Dual Energy Imaging
“Tissue only” Image “Bone only” Image

8
Image Performance Measures
• Spatial resolut ion– Dependent on IP size– Less than corresponding speed screen-film
• Contrast sensitivity– Dependent on exposure and SNR
• Exposure– Variable speed detector
CR: Spatial Resolution• Phosphor p late sizes: impact on resolution
35x43 (14x17)
0.2 mm pixels
24x30 (10x12)
0.14 mm pixels 0.1 mm pixels
18x24 (8x10)
High Contrast (Spatial) Resolution18 x 24 cm 35 x 43 cm
Subscan
MTF Curves
2 4 6 8 100
0.2
0.4
0.6
0.8
1.0
Spatial Frequency ( lp/mm)
MTF
Scan
Hi res CR
Screen-film
Sampled MTF:Standard CR2K x 2K matrix35 x 43 cm
Pre-sampled MTF
Standard CR
X-ray Absorption Efficiency
0 20 40 60 80 100 120 1400
0.2
0.4
0.6
0.8
1
Energy (keV)
Pho
ton
abso
rptio
n fra
ctio
n
Gd2O2S, 120 mg/cm2
BaFBr, 100 mg/cm²
BaFBr, 50 mg/cm²
Low Contrast Response: Leeds TO-16
0.5 mR3.5 mR 70 kVp
9
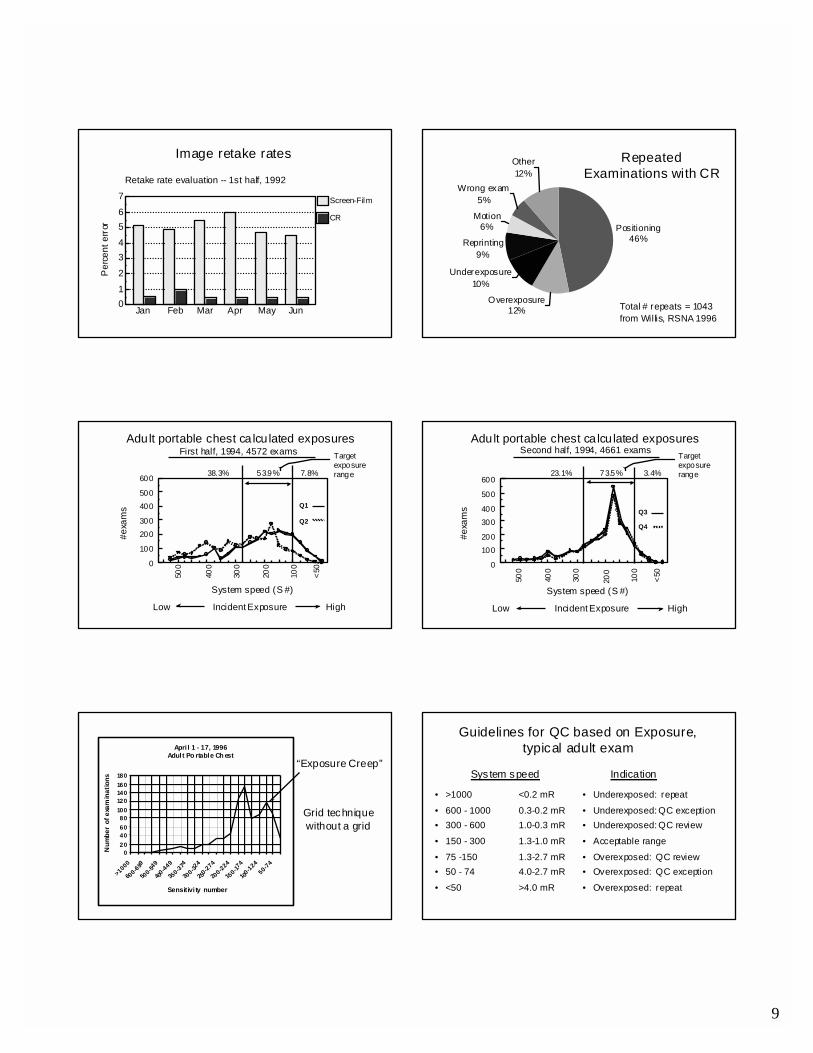
Image retake rates
Retake rate evaluation -- 1st half, 1992
Jan Feb Mar Apr May Jun01
2
34
56
7
Per
cent
err
or
Screen-Film
CR
Total # repeats = 1043from Willis, RSNA 1996
Positioning46%
Overexposure12%
Underexposure10%
Reprinting9%
Motion6%
Wrong exam5%
Other12%
RepeatedExaminations with CR
Adult portable chest ca lcu lated exposuresFirst half, 1994, 4572 exams
Incident ExposureLow High
500
400
300
200
100
<500
100
200300
400500
600
System speed (S #)
#exa
ms
38.3% 53.9% 7.8%
Targetexposurerange
Q1
Q2Q3
Q4
Adult portable chest ca lcu lated exposuresSecond half, 1994, 4661 exams
23.1% 73.5% 3.4%
Targetexposurerange
Incident ExposureLow High
500
400
300
200
100
<500
100200
300400
500
600
System speed (S #)
#exa
ms
Apri l 1 - 17, 1996Adult Po rtable Ch est
020406080
100120140160180
>1000
600-699
500-549
400-449
350-374
300-324
250-274
200-224
150-174
100-124
50-74
Sensitivi ty number
Num
ber
of e
xam
inat
ions
“Exposure Creep”
Grid techniquewithout a grid
Guidelines for QC based on Exposure,typical adult exam
• >1000 <0.2 mR
• 600 - 1000 0.3-0.2 mR• 300 - 600 1.0-0.3 mR
• 150 - 300 1.3-1.0 mR
• 75 -150 1.3-2.7 mR• 50 - 74 4.0-2.7 mR
• <50 >4.0 mR
• Underexposed: repeat
• Underexposed: QC exception• Underexposed: QC review
• Acceptable range
• Overexposed: QC review• Overexposed: QC exception
• Overexposed: repeat
Sys tem speed Indication
10
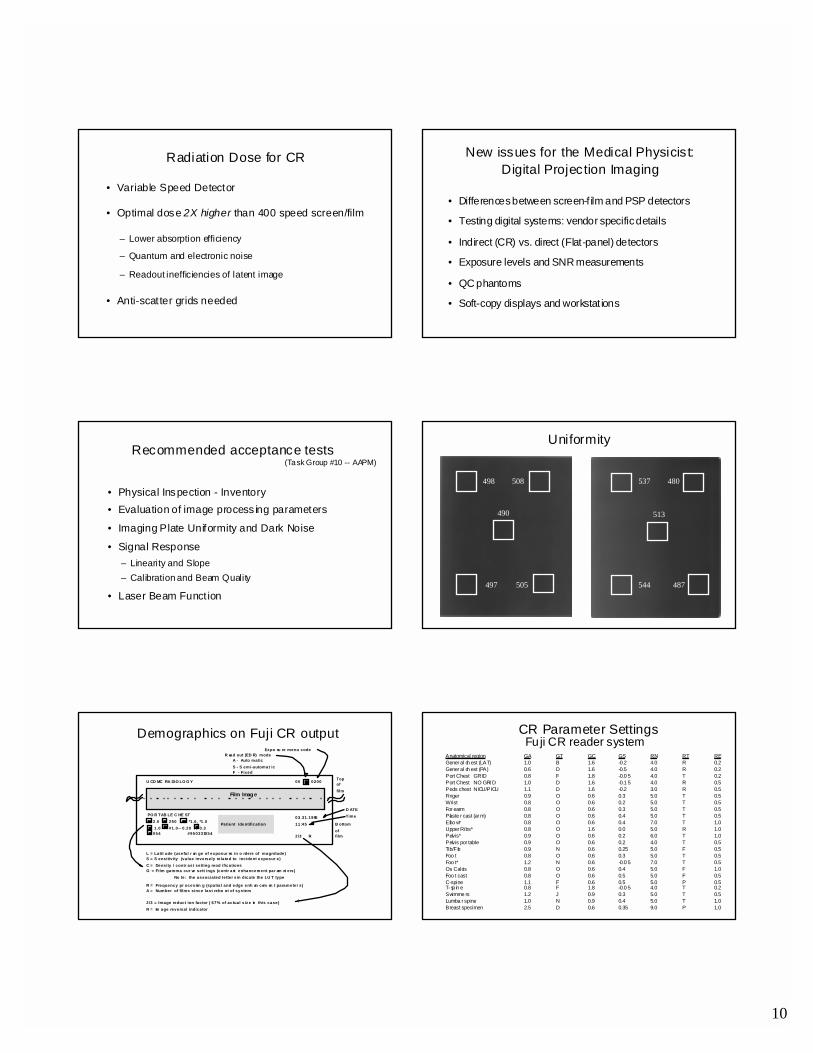
Radiation Dose for CR
• Variable Speed Detector
• Optimal dose 2X higher than 400 speed screen/film
– Lower absorption efficiency
– Quantum and electronic noise
– Readout inefficiencies of latent image
• Anti-scatter grids needed
New issues for the Medical Physicist:Digital Projection Imaging
• Differences between screen-f ilm and PSP detectors
• Testing digital systems: vendor specific details
• Indirect (CR) vs. direct (Flat-panel) detectors
• Exposure levels and SNR measurements
• QC phantoms
• Soft-copy displays and workstat ions
Recommended acceptance tests
• Physical Inspection - Inventory• Evaluation of image process ing parameters
• Imaging Plate Uniformity and Dark Noise
• Signal Response– Linearity and Slope– Calibration and Beam Quality
• Laser Beam Funct ion
(Task Group #10 -- AAPM)
Uniformity
498 508
490
497 505
537
487544
513
480
A
Demographics on Fuji CR output
03.31.199511:45
2/3 R
U CD MC RA DIO LO G Y 00 A 0200
Patient Identification
Film Imag e
L = Latit ude (useful r an ge of exposur es in o rders of magnitude)S = S ensitiv ity (value inversely related to incident exposur e)C = Density / contr ast setting mod ifications G = Film gamma cur ve sett ings (contr ast enhancement par am et ers)
No te: the associated letter s in dicate the LU T type
R = Frequency pr ocessin g (spatia l and edge enh an cem en t parameter s)A = Number of films since last rebo ot of system
2/3 = Image reduct ion factor ( 67% of actual s iz e in this case)R = Im age reversal indicator
R ead out (ED R) modeA - Auto maticS - S emi-automat icF - Fixed
Topoffilm
B ottomoffilm
Expo su re menu code
D ATETimePO R TAB LE C HE ST
L 2.0 S 250 *1 .6, *1 .0G
C1.0 E #1.0-- 0 .20 R 0.3
054 #950331054
CR Parameter SettingsFuji CR reader system
Anatomical region GA GT GC GS RN RT REGener al ch est (LAT) 1.0 B 1.6 -0.2 4.0 R 0.2Gener al ch est (PA) 0.6 D 1.6 -0.5 4.0 R 0.2Port Chest GRID 0.8 F 1.8 -0.0 5 4.0 T 0.2Port Chest NO GRI D 1.0 D 1.6 -0.1 5 4.0 R 0.5Peds chest NICU/PICU 1.1 D 1.6 -0.2 3.0 R 0.5Finger 0.9 O 0.6 0.3 5.0 T 0.5Wrist 0.8 O 0.6 0.2 5.0 T 0.5For earm 0.8 O 0.6 0.3 5.0 T 0.5Plaste r cast (ar m) 0.8 O 0.6 0.4 5.0 T 0.5Elbo w* 0.8 O 0.6 0.4 7.0 T 1.0Upper Ribs* 0.8 O 1.6 0.0 5.0 R 1.0Pelvis* 0.9 O 0.6 0.2 6.0 T 1.0Pelvis por table 0.9 O 0.6 0.2 4.0 T 0.5Tib/F ib 0.9 N 0.6 0.25 5.0 F 0.5Foo t 0.8 O 0.6 0.3 5.0 T 0.5Foo t* 1.2 N 0.6 -0.0 5 7.0 T 0.5Os Calcis 0.8 O 0.6 0.4 5.0 F 1.0Foo t cast 0.8 O 0.6 0.5 5.0 F 0.5C-spine 1.1 F 0.6 0.5 5.0 P 0.5T- sp in e 0.8 F 1.8 -0.0 5 4.0 T 0.2Swimme rs 1.2 J 0.9 0.3 5.0 T 0.5Lumba r spine 1.0 N 0.9 0.4 5.0 T 1.0Breast specimen 2.5 D 0.6 0.35 9.0 P 1.0
11
Da te: 7/1 0/98 Lo ca tio n: UCDM C, ACC, 3 M ed ic al Phy si ci st: Antho ny Sei be rt, Ph.D. Sy ste m Ide ntif i ca tio n: CR u ni t 3
UC Davi s Medica l C enterCR R eader and Screens
Signa l Response: Calib ration a nd Beam Quality
No te: Use mAs va lu es to pro vid e a n ap pro xi ma te ex po su re of 1 mR to th e IP.
Men u = TEST Ex posure ConditionsIP Type: ST 1 4x 17 Su bMenu = A ve 2. 0 Foc al sp ot Time del ay S ID (c m) SMD (cm)
IP SN: L = 2 , E D R = se mi 1. 2 m m ~ 2 m in 140 1 30
k Vp De pendencyk V p F il trati on m As mR -mete r mR -IP S S (1 mR ) OD NA6 0 1 A l/0 .5 Cu 15 .00 1 .06 0 .9 1 1 21 .0 0 11 0.5 9 1 .4 1 NA8 0 1 A l/0 .5 Cu 4 .5 1 .06 0 .9 1 1 08 .0 0 98 .7 1 1 .3 8 NA11 5 1 A l/0 .5 Cu 1.13 1 .14 0 .9 8 1 15 .0 0 11 3.0 4 1 .4 5 NA
Ma xi mu m Dif feren ce : 14 .3 3 0 .0 7 NAF i l trati o n D e pe n d en cy
k V p F il trati on m As m R-me ter mR -IP S S (1 mR ) OD NA8 0 n on e 0.50 0 .96 0 .8 3 1 87 .0 0 15 4.7 9 1 .4 0 NA8 0 1 A l/0 .5 Cu 4.50 1 .06 0 .9 1 1 08 .0 0 98 .7 1 1 .3 8 NA8 0 1Al/2 .5 Cu 60 .00 0 .99 0 .8 5 1 24 .0 0 10 5.8 5 1 .4 0 NA
Ma xi mu m Dif feren ce : 56 .0 8 0 .0 2 NA
0.00
2 0.00
4 0.00
6 0.00
8 0.00
10 0.00
12 0.00
50 70 90 110 13 0kV p
Res
pons
e
S (1mR)
0.0 0
20 .0 0
40 .0 060 .0 0
80 .0 0100 .0 0
120 .0 0140 .0 0
160 .0 0180 .0 0
n one 1 A l/ 0. 5 Cu 1Al / 2. 5CuFi l trati on
Resp
onse
S (1mR )
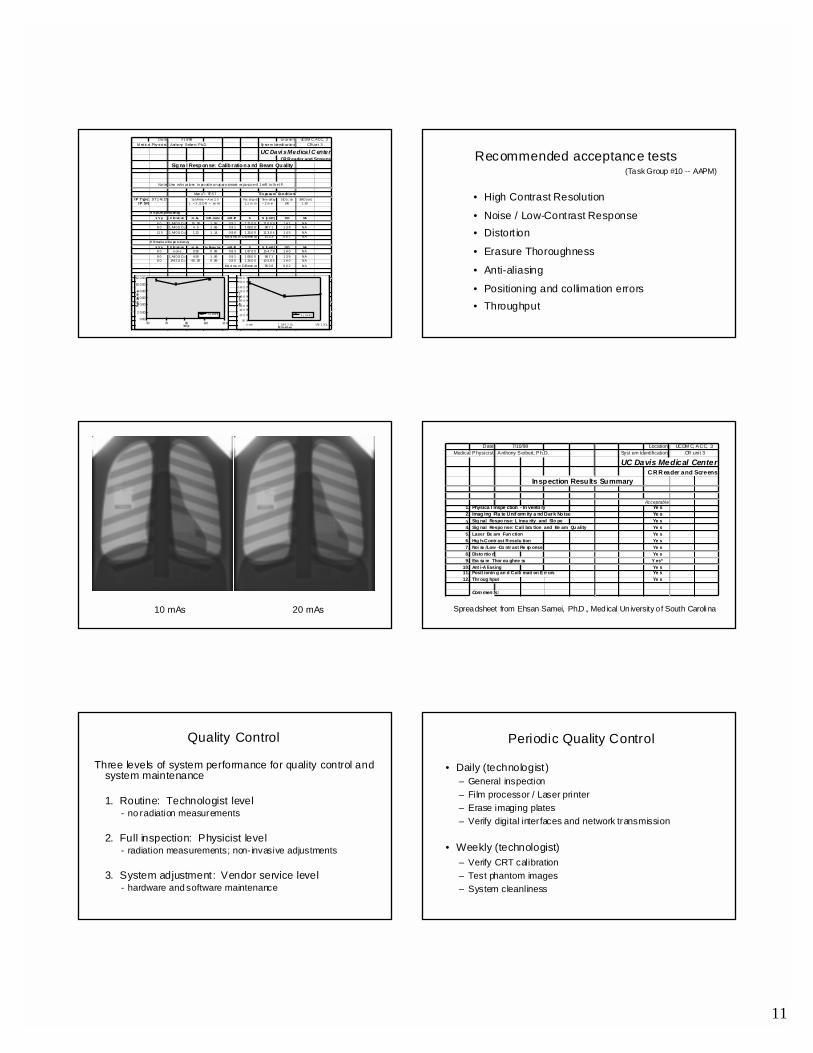
Recommended acceptance tests
• High Contrast Resolution
• Noise / Low-Contrast Response• Distort ion
• Erasure Thoroughness
• Anti-aliasing
• Positioning and collimation errors• Throughput
(Task Group #10 -- AAPM)
10 mAs 20 mAs
Date: 7/10/98 Location: UCDM C, ACC, 3 Medical Physicist: Anthony Seibert, Ph.D. Syst em Identification: CR unit 3
UC Davis Medical CenterC R R eader and Screens
Inspection Results Summary
Acceptable1. Physica l Inspe ction - In vento ry Ye s2. Imag ing Pla te Unif orm ity a nd Dar k No ise Ye s3. Sig nal Respo nse: L inea rity and Slo pe Ye s4. Sig nal Respo nse: C ali bra tion and Be am Qu ality Ye s5. Laser Be am Fun ction Ye s6. Hig h-C ontr ast R esolu tion Ye s7. Noi se /Low -Co ntr ast Re sp onse Ye s8. Disto rtio n Ye s9. Era su re Thor ou ghne ss Y es*
10. Ant i-A liasing Ye s11. Posit ionin g an d C olli mati on E rr ors Ye s12. Thr oug hput Ye s
Com men ts:
Spreadsheet from Ehsan Samei, Ph.D., Medical University o f South Carolina
Quality Control
Three levels of system performance for quality control andsystem maintenance
1. Routine: Technologist level- no radiation measurements
2. Full inspection: Physicist level- radiation measurements; non-invasive adjustments
3. System adjustment: Vendor service level- hardware and software maintenance
Periodic Quality Control
• Daily (technologist)– General inspection– Film processor / Laser printer– Erase imaging plates– Verify digital interfaces and network transmission
• Weekly (technologist)– Verify CRT calibration– Test phantom images– System cleanliness

12
Periodic Quality Control
• Monthly (Technologist)
– Film processor maintenance (if any)
– Inspect and clean image receptors
– Review film retake rate
– QC review for “out-of-tolerance” issues
Periodic Quality Control
• Semi-Annually / Annually (Physicist)
– Evaluate image quality
– Acceptance tests to re-establish baseline values
– Review• patient exposure trends• retake activity• QC records• Service history
CR: Specifications
• Phosphor plate throughput
• Spatial resolut ion
• Contrast resolut ion and dynamic range
• RIS-HIS-DICOM interfaces / compliance
• Peripheral equipment; QC phantoms
• Service issues; plate longevity; warranties
CR: Clinical Considerations
• Sensit iv ity to scatter
• Multiple images per phosphor plate?
• Patient demographic data
• Image quality control
• Input to PACS
Computed Radiography Experience
• Flexibility is a double-edged sword– reduced retakes but higher under/over exposures– variable speed (need to tailor exposure to exam)– more difficult to correctly use
• Provides guidelines for new digital detectors
• Indicates the need for continuous training
Summary
• CR is current ly the only readily available technologyfor direc t digital acquisition of projection radiographs
• Experience with CR will provide a framework forfuture digital detector implementation and QC
• Filmless radiology requires a lot more than just digitalacquisit ion devices -- a massive investment in PACSand knowledgeable support personnel, includingMEDICAL PHYSICIST INPUT is necessary
Recommended