Turk J Chem
(2016) 40: 402 – 411
c⃝ TUBITAK
doi:10.3906/kim-1507-54
Turkish Journal of Chemistry
http :// journa l s . tub i tak .gov . t r/chem/
Research Article
Photocatalysis of formaldehyde in the aqueous phase over ZnO/diatomite
nanocomposite
Reza DARVISHI CHESHMEH SOLTANI1,∗, Alireza KHATAEE2,Masumeh MASHAYEKHI1, Mahdi SAFARI3
1Department of Environmental Health Engineering, School of Health, Arak University of Medical Sciences,Arak, Iran
2Research Laboratory of Advanced Water and Wastewater Treatment Processes, Department of Applied Chemistry,Faculty of Chemistry, University of Tabriz, Tabriz, Iran
3Department of Environmental Health Engineering, School of Health, Kurdistan University of Medical Sciences,Sanandaj, Iran
Received: 20.07.2015 • Accepted/Published Online: 24.11.2015 • Final Version: 17.05.2016
Abstract: In the present study, ZnO nanostructures were synthesized and immobilized on the surface of diatomite via
a simple sonochemical method for the photocatalytic degradation of formaldehyde in the aqueous phase. The character-
ization of as-prepared ZnO/diatomite nanocomposite was carried out by means of scanning electron microscopy (SEM),
X-ray diffraction (XRD), and Fourier transform infrared spectroscopy (FT-IR). The photocatalysis of formaldehyde was
favored at neutral pH. At a ZnO to diatomite ratio of 0.3, increasing the photocatalyst dosage from 0.2 to 1.5 g/L resulted
in increasing the photocatalytic removal of formaldehyde from 37.51% to 88.05%. At a formaldehyde concentration of
100 mg/L, the complete removal of formaldehyde was attained within the reaction time of 50 min. A mineralization
efficiency of 53% was achieved, thereby confirming a suitable mineralization of formaldehyde within the short reaction
time of 60 min.
Key words: Formaldehyde, immobilization, nanocatalyst, photocatalysis, ZnO nanostructures
1. Introduction
Discharging industrial effluents containing hazardous compounds can pollute receiving waters such as rivers
and lakes. Formaldehyde is one of the most toxic refractory organic compounds and is widely used in chemical
industries and anatomy laboratories. Thus, its discharge into the aqueous environment can cause serious
environmental and sanitary impacts.1−3 The carcinogenic effect of formaldehyde has been demonstrated by
the International Agency for Research on Cancer (IARC). It is also the most toxic organic substance of 45
organic compounds causing environmental problems.2 There are various industries discharging effluents with
formaldehyde concentrations ranging from 100 to 10,000 mg/L, indicating an urgent need for the treatment of
such effluents before discharge into the environment.1 One of the promising alternatives for the degradation of
refractory organic compounds such as formaldehyde is the application of advanced oxidation processes (AOPs).
Among the various AOPs, the application of photocatalytic processes has gained much more attention due to
their high potential to degrade toxic organic compounds.4,5 The photocatalysis of gaseous formaldehyde has
been studied by many researchers,6−9 but little attention has been paid to the photocatalysis of this organic
∗Correspondence: [email protected]
402

DARVISHI CHESHMEH SOLTANI et al./Turk J Chem
pollutant from the aqueous phase. Among various photocatalysts, ZnO, in nanosize, has been considered an
efficient and cost-effective photocatalyst because of its large volume to area ratio, wide band gap (3.37 eV), high
potential to absorb UV light irradiation, and low cost.10,11 Generally, photocatalysts with smaller particle size
possess higher photocatalytic activity. However, it is demonstrated that using suspended nanoparticles leads
to the aggregation and inactivation of nanophotocatalysts in the aqueous phase, causing a significant decrease
in photocatalytic activity. The difficult separation also limits the application of suspended nanophotocatalysts
for the treatment process.12,13 Moreover, discharging nanoparticles into the environment must be limited due
to their toxic effects on the aquatic and terrestrial environments.14 Therefore, suspended ZnO nanoparticles
should be immobilized on a suitable support before application as photocatalyst. Different supports have been
used for the immobilization of nanosized photocatalysts such as glass plates,14,15 ceramic sheets,16 and clay-like
materials.12,17,18 Considering the economical point of view, in the present study, Iranian diatomite was applied
as a promising clay-like support for the immobilization of ZnO nanostructures. Diatomite is a sedimentary rock
of microfossils of aquatic plants, especially single-celled algae, that is mainly composed of SiO2 . It is used in
many industries as insulation material, filter aid, surface cleaning material, abrasive agent, adsorbent, catalyst
support, and silica source in chemical industries. Furthermore, diatomite has high surface area, creating a
suitable structure for the immobilization of nanosized photocatalysts.19−21 To the best of our knowledge, there
is no report on the use of ZnO-coated diatomite for the photocatalysis of formaldehyde in aqueous solutions.
Thus, in the present study, ZnO nanostructures were synthesized and immobilized on the surface of diatomite
through a simple sonochemical method for the photocatalysis of formaldehyde. After the characterization of
as-prepared photocatalyst, the effects of various operational parameters on the photocatalysis of formaldehyde
were evaluated. In the following, reusability and mineralization tests were carried out.
2. Results and discussion
2.1. Structural characteristics
Figure 1a shows the scanning electron microscopy (SEM) image of pure diatomite. As shown, diatomite particles
have nonuniform size distribution. The porous and rough structure of diatomite particles could be beneficial
for the efficient immobilization of ZnO nanostructures. Figure 1b exhibits the morphological structure of
ZnO/diatomite nanocomposite. Figure 1b also shows that the immobilization of ZnO nanostructures on the
diatomite surface is accomplished well. The stability of immobilized catalyst is of great importance. In fact, the
immobilization procedure applied in the present study results in the strong attachment of ZnO to the surface of
each siliceous support such as diatomite. According to our previous studies, the release of Zn into the solution
after the reaction was not significant due to the useful approach applied for the immobilization of ZnO.22,23
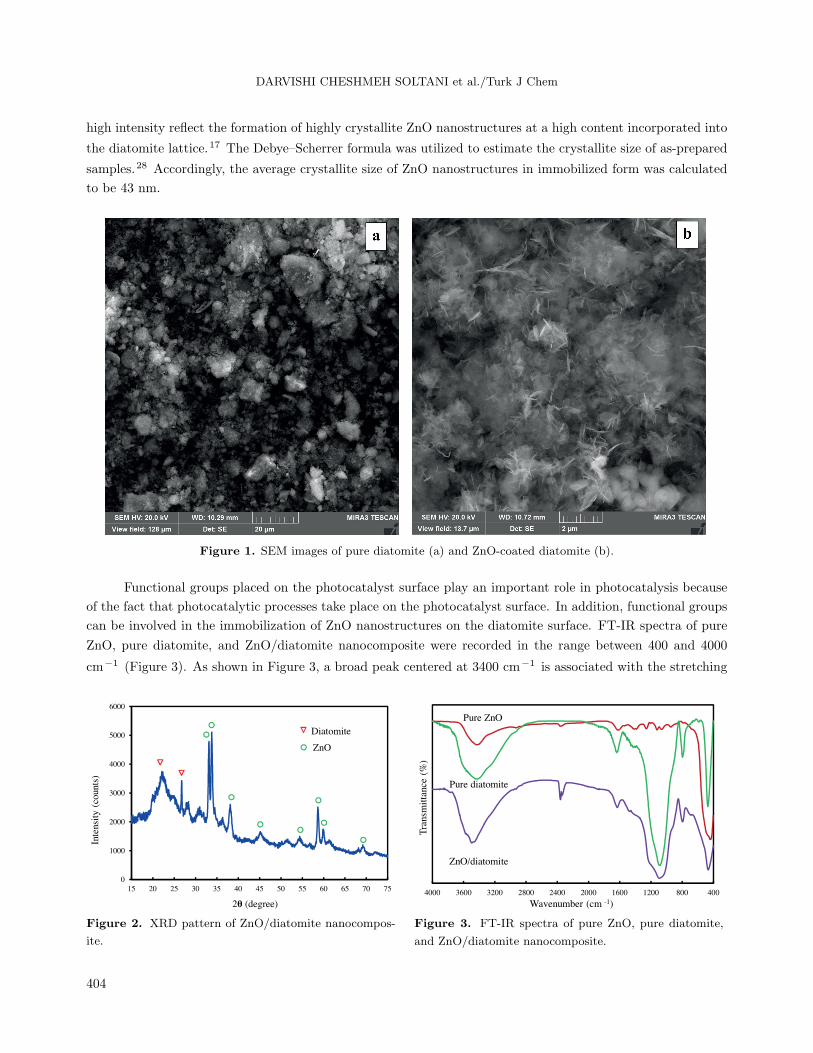
XRD analysis was performed to show the crystallite structure of as-prepared ZnO/diatomite nanocom-
posite. Figure 2 displays the XRD pattern of ZnO/diatomite nanocomposite, together with the XRD pattern of
pure diatomite. The XRD pattern of ZnO/diatomite nanocomposite contains peaks of both ZnO and diatomite.
Two peaks located at 2θ of 21.8◦ and 26.7◦ indicated the presence of a crystallite silica structure, which is in
accordance with the major peaks of a pure phase of silica in the JCPDS Card no. 00-001-0647.24 According to
JCPDS Card no. 36-1451, the main peaks of pure ZnO are located at 2θ of 32.0◦ , 34.6◦ , 36.3◦ , 47.6◦ , 56.7◦ ,
62.9◦ , 66.3◦ , and 68.0◦ , corresponding to the (100), (002), (101), (102), (110), (103), (200), and (112) planes of
hexagonal wurtzite ZnO, respectively.25−27 These main peaks were shifted to 33.0◦ , 33.8◦ , 38.0◦ , 44.8◦ , 54.0◦ ,
58.6◦ , 59.8◦ , and 68.9◦ in the XRD pattern of ZnO/diatomite nanocomposite. These shifts are significant to
confirm the formation of a ZnO pillar in the interlayer space of the diatomite. In addition, the peaks with
403
DARVISHI CHESHMEH SOLTANI et al./Turk J Chem
high intensity reflect the formation of highly crystallite ZnO nanostructures at a high content incorporated into
the diatomite lattice.17 The Debye–Scherrer formula was utilized to estimate the crystallite size of as-prepared
samples.28 Accordingly, the average crystallite size of ZnO nanostructures in immobilized form was calculated
to be 43 nm.
Figure 1. SEM images of pure diatomite (a) and ZnO-coated diatomite (b).
Functional groups placed on the photocatalyst surface play an important role in photocatalysis because
of the fact that photocatalytic processes take place on the photocatalyst surface. In addition, functional groups
can be involved in the immobilization of ZnO nanostructures on the diatomite surface. FT-IR spectra of pure
ZnO, pure diatomite, and ZnO/diatomite nanocomposite were recorded in the range between 400 and 4000
cm−1 (Figure 3). As shown in Figure 3, a broad peak centered at 3400 cm−1 is associated with the stretching
0
1000
2000
3000
4000
5000
6000
15 20 25 30 35 40 45 50 55 60 65 70 75
Inte
nsi
ty (
counts
)
2θ (degree)
Diatomite
ZnO
40080012001600200024002800320036004000
Tra
nsm
itta
nce (
%)
Wavenumber (cm -1)
Pure ZnO
Pure diatomite
ZnO/diatomite
Figure 2. XRD pattern of ZnO/diatomite nanocompos-
ite.
Figure 3. FT-IR spectra of pure ZnO, pure diatomite,
and ZnO/diatomite nanocomposite.
404

DARVISHI CHESHMEH SOLTANI et al./Turk J Chem
vibrations of the –OH groups and free silanol group (Si–OH) on the diatomite surface.20,29,30 This peak was
shifted from 3400 to 3520 cm−1 after the immobilization of ZnO nanostructures. In addition, hydroxyl groups
of the catalyst surface react with the photogenerated valence band holes (h+) and subsequently the adsorbed
water on the catalyst surface to generate hydroxyl radicals.14 The peaks located at 1650, 1110, 810, and
480 cm−1 were attributed to the presence of the (H–O–H) bending vibration of water retained in the silica
matrix, asymmetric stretching modes of the Si–O–Si bond, Si–O stretching of the silanol group, and Si–O–Si
bending vibration of the diatomite structure, respectively.31−34 The intensity of these peaks decreased after the
incorporation of ZnO nanostructures into the diatomite lattice. The results of FT-IR analysis confirmed the
important role of functional groups in the immobilization of ZnO nanostructures on the diatomite surface.
2.2. Comparative study
A comparative study was performed before conducting the experiments to specify the role of each process
involved in the photocatalysis of formaldehyde. As depicted in Figure 4, the adsorption of formaldehyde onto
pure ZnO, pure diatomite, and ZnO/diatomite nanocomposite resulted in formaldehyde removal of 15.67%,
27.47%, and 30.21%, respectively. Furthermore, in order to reach the adsorption–desorption equilibrium, the
reactor was placed in the dark for 30 min prior to the experiments. Although ZnO/diatomite nanocomposite
can adsorb some formaldehyde molecules (Figure 4), most of them will desorb. They will be released into the
bulk solution to be more effectively degraded by OH . as well as the photocatalysis of formaldehyde molecules
adsorbed on the photocatalyst surface via hole oxidation.22 Both visible and UV light (photolysis processes)
could not significantly remove formaldehyde from the aqueous solution. The visible light and UV light reduced
the formaldehyde by 9.11% and 33.95%, respectively. However, visible light/ZnO and UV light/ZnO processes
were responsible for formaldehyde removal of 19.22% and 71.87%, respectively. Overall, the photocatalysis
of formaldehyde over UV light-induced photocatalyst was efficient in removing formaldehyde compared with
photolysis alone. A similar result was reported by Mendez et al. in their study on the detoxification of
formaldehyde in aquatic environments.35 The oxidation of water and hydroxyl groups on the photocatalyst
surface produces OH . , resulting in the degradation of formaldehyde to form CO2 and H2O as shown in Eqs.
(1)–(5):
ZnO − diatomite+ hv → e− + h+ (1)
h+ +OH− → OH . (2)
h+ +H2O (ads) → H+ +OH . (3)
CH2O +OH . → HCO−2 + 2H+ (4)
HCO−2 +OH . → H2O + CO2 (5)
The immobilized form of ZnO nanostructures was irradiated with UV light and caused formaldehyde removal of
about 80% at an initial formaldehyde concentration of 500 mg/L within a reaction time of 60 min. In accordance
with our results, Seftel et al. found that TiO2 /LDH clay nanocomposite had photocatalytic activity higher
than that of pure TiO2 , due to the increased adsorption of the target organic pollutant.18 Additionally, it is
demonstrated that the immobilization of photocatalyst on the diatomite surface improves the charge, optical
properties, and mass transfer efficiency during photocatalysis.13,36
405

DARVISHI CHESHMEH SOLTANI et al./Turk J Chem
2.3. The effect of ZnO to diatomite ratio
To evaluate the effect of ZnO to diatomite ratio on the photocatalysis of formaldehyde, this ratio was varied
between 0.1 and 1.0. As shown in Figure 5, increasing the ZnO to diatomite ratio from 0.1 to 0.7 resulted in
increasing the removal efficiency of formaldehyde from 67.35% to 90.06%, respectively. However, increasing the
ratio to 1.0 led to a small decrease in removal efficiency (83.56%). In accordance with our results, Saleh et al.37
reported that increasing the photocatalyst to support ratio up to a specified value could cause a significant drop
in the photocatalytic degradation of the target pollutant. The excessive amount of photocatalyst immobilized on
the diatomite results in the accumulation and aggregation of nanostructures. The aggregation of photocatalyst
decreases the interfacial area between the bulk solution and the photocatalyst, which reduces the number of
active sites on the photocatalyst surface. Moreover, the excess amount of photocatalyst can mask some parts of
the photosensitive surface and deactivate the activated molecules caused by the collision with the ground state
of the photocatalyst.13,38 The application of photocatalyst at optimum amount leads to a better distribution of
nanostructures and improved light adsorptive behavior of the photocatalyst, which is helpful for better exciting
the photocatalyst to produce OH . .11,39,40 Overall, it can be deduced that an optimum ZnO to diatomite ratio
is necessary for enhancing formaldehyde removal and avoiding the use of excess photocatalyst.
0
10
20
30
40
50
60
70
80
90
0 10 20 30 40 50 60
Rem
ov
al e
ffic
iency
(%
)
Time (min)
Visible light alone
ZnO alone
Visible light/ZnO
Diatomite alone
ZnO/Diatomite
UV light alone
UV light/ZnO
UV light/ZnO/Diatomite
0
10
20
30
40
50
60
70
80
90
100
0 10 20 30 40 50 60
Rem
oval
eff
icie
ncy
(%
)
Reaction time (min)
ZnO/Diatomite: 0.1
ZnO/Diatomite: 0.3
ZnO/Diatomite: 0.5
ZnO/Diatomite: 0.7
ZnO/Diatomite: 1.0
Figure 4. Contribution of each process involved in
the photocatalytic degradation of formaldehyde (formalde-
hyde concentration = 500 mg/L, photocatalyst dosage =
1 g/L, ZnO to diatomite ratio = 0.3, and initial pH = 7).
Figure 5. The effect of photocatalyst to support ratio on
the photocatalytic degradation of formaldehyde (formalde-
hyde concentration = 500 mg/L, photocatalyst dosage =
1 g/L, and initial pH = 7).
2.4. The effect of initial pH
Figure 6 displays the effect of initial pH on the photocatalytic degradation of formaldehyde in the pH range
between 3 and 11. As can be observed, both acidic and basic conditions are unfavorable for the photocatalysis
of formaldehyde over ZnO/diatomite nanocomposite. Decreasing the initial pH from neutral value of 7 to
3 and 11 resulted in decreasing the removal efficiency from the optimum value of 80.07% to 23.45% and
50.79%, respectively. At basic pH values, formaldehyde is converted to methoxide (CH3O−) and formate
anions,41 leading to electrostatic repulsion between the produced anions and the negative surface charge of the
photocatalyst (the zero point charge of pure ZnO nanostructures is about 9.0). This can restrain the efficient
photocatalytic reaction on the photocatalyst surface.1
406

DARVISHI CHESHMEH SOLTANI et al./Turk J Chem
2.5. The effect of photocatalyst dosage
In order to avoid the application of excess photocatalyst, it is essential to find out the optimum photocatalyst
dosage for efficient photocatalysis. The effect of photocatalyst dosage on the photocatalysis of formaldehyde
was investigated (Figure 7). As illustrated in Figure 7, a high amount of catalyst enhanced the photocatalysis of
formaldehyde over ZnO/diatomite nanocomposite. With increasing photocatalyst dosage from 0.2 to 1.5 g/L, the
photocatalytic removal of formaldehyde increased from 37.51% to 88.05%, respectively. This can be as a result of
enhanced absorption of photons and subsequently increased photogeneration of OH . .42 However, increasing the
photocatalyst dosage beyond 1.0 g/L did not influence the photocatalysis of formaldehyde. A further increase
in the photocatalyst dosage can cause the screening effect. Moreover, the aggregation of nanostructures may
also decrease the photocatalytic activity at high loadings of the photocatalyst.11,42 Therefore, a photocatalyst
dosage of 1 g/L was chosen as the selective value for performing the rest of the experiments.
0
10
20
30
40
50
60
70
80
90
0 10 20 30 40 50 60
Rem
oval
eff
icie
ncy
(%
)
Reaction time (min)
pH=3
pH=5
pH=7
pH=9
pH=11
0
10
20
30
40
50
60
70
80
90
100
0 10 20 30 40 50 60
Rem
ov
al e
ffic
iency
(%
)
Reaction time (min)
0.2 g/L
0.5 g/L
0.7 g/L
1.0 g/L
1.3 g/L
1.5 g/L
Figure 6. The effect of initial pH on the photocatalytic
degradation of formaldehyde (formaldehyde concentration
= 500 mg/L, photocatalyst dosage = 1 g/L, and ZnO to
diatomite ratio = 0.3).
Figure 7. The effect of photocatalyst dosage on the pho-
tocatalytic degradation of formaldehyde (formaldehyde
concentration = 500 mg/L, ZnO to diatomite ratio = 0.3,
and initial pH = 7).
2.6. The effect of initial formaldehyde concentration
Obviously, the effect of initial pollutant concentration can be one of the most important parameters in the
treatment of various organic and inorganic pollutants. For this reason, the effect of the initial formaldehyde
concentration was assessed in the range of 100–2000 mg/L, where the other operational parameters were con-
stant. The result of this set of experiments showed that increasing the initial formaldehyde concentration from
100 to 2000 mg/L led to a significant drop in the photocatalysis of formaldehyde (Figure 8). At formaldehyde
concentration of 100 mg/L, the complete removal of formaldehyde was achieved within the reaction time of 50
min, while the removal efficiency of formaldehyde was insignificant (19.82%) at an initial concentration of 2000
mg/L. The higher the initial formaldehyde concentration, the longer the time needed for its photocatalysis.2
Moreover, at high pollutant concentrations, photonic efficiency decreases and the photocatalyst surface becomes
saturated, resulting in photocatalyst deactivation.35
407

DARVISHI CHESHMEH SOLTANI et al./Turk J Chem
0
10
20
30
40
50
60
70
80
90
100
0 10 20 30 40 50 60
Rem
ov
al e
ffic
iency
(%
)
Reaction time (min)
100 mg/L
300 mg/L
500 mg/L
700 mg/L
1000 mg/L
1500 mg/L
2000 mg/L
y = 0.0122x + 0.073
R² = 0.961
0
0.1
0.2
0.3
0.4
0.5
0.6
0.7
0.8
0.9
0
10
20
30
40
50
60
70
80
90
0 10 20 30 40 50 60
‒ln
(C
/C0)
Rem
ov
al e
ffic
iency
(%
)
Reaction time (min)
Formaldehyde removal (%)
Mineralization (%)
Formaldehyde removal reaction rate
Figure 8. The effect of initial formaldehyde concentration
on its photocatalytic degradation (photocatalyst dosage =
1 g/L, ZnO to diatomite ratio = 0.3, and initial pH = 7).
Figure 9. Mineralization of formaldehyde over UV light-
induced ZnO/diatomite nanocomposite, together with the
regression line of kinetic study (formaldehyde concentra-
tion = 500 mg/L, ZnO to diatomite ratio = 0.3, photocat-
alyst dosage = 1 g/L, and initial pH = 7).
2.7. Mineralization
The success of each advanced oxidation process in the degradation of target organic pollutants depends on
the rate of mineralization. To assess the mineralization of formaldehyde during photocatalysis, COD analysis
was performed and its removal was compared with the removal efficiency of formaldehyde. Figure 9 reveals
a mineralization efficiency of 53.12% within the reaction time of 60 min. The possible reaction between the
photogenerated hydroxyl radical and formaldehyde is depicted by Eq. (6):
CH2O + OH . → 3H+ + 3e− + CO2 (6)
Comparatively, Guimaraes et al. reported a mineralization efficiency of 46% in the case of the application of
the UV/H2O2 process for the degradation of 400 mg formaldehyde/L,2 and Kajitvichyanukul et al. found
that the complete mineralization of formaline can be achieved in the effluent after a reaction time of 240
min.43 In addition, the linearized pseudo-first-order kinetic model was applied in order to evaluate the reaction
rate constant of the photocatalysis of formaldehyde over ZnO/diatomite nanocomposite (Figure 9). As can
be observed in Figure 9, a relatively straight line of –ln(C/C0) versus reaction time was obtained (R2 =
0.961), which indicated the suitability of the applied model for predicting the rate of photocatalytic removal
of formaldehyde. According to the obtained regression line and its slope, the reaction rate constant of the
photocatalysis of formaldehyde was 0.0122 1/min. The reaction rate constant obtained in our previous study
regarding the photocatalysis of formaldehyde over commercial ZnO nanoparticles immobilized onto glass plates
was higher than that of obtained in the present work (0.0265 1/min). It could be due to the lower particle size
of commercial ZnO nanoparticles, creating more reaction sites for the photocatalysis of formaldehyde.
408

DARVISHI CHESHMEH SOLTANI et al./Turk J Chem
3. Materials and methods
3.1. Photocatalyst preparation
All chemicals, which were of analytical grade, were purchased from Merck, Germany. In a typical manner, the
ZnO to diatomite mass ratio was set to 0.3. ZnO/diatomite nanocomposite was prepared as follows: 10 mM
ZnCl2 was prepared in 50 mL of deionized water. Afterwards, 1 M NaOH solution was added dropwise to the
above solution under magnetic stirring until the pH reached 10. After the formation of precipitate, 2.724 g of
the diatomite was slowly added to the resulting precipitate under magnetic stirring. The mixture was sonicated
in an ultrasonic bath (Elmasonic E30H, Elma-Hans Schmidbauer GmbH & Co.KG, Germany) at 50 ◦C for 120
min to achieve homogeneity of ZnO nanostructures. The suspension was filtered and washed with deionized
water and ethanol repeatedly to obtain a salt-free sample. Finally, the solid sample phase was dried in an oven
at 80 ◦C for 48 h.22
3.2. Experimental procedure and analysis
To carry out the experiments, a quartz-made batch flow mode cylindrical reactor equipped with four 6-W
low-pressure UVC lamps with peak intensity at 254 nm (Philips, the Netherlands) was used (working volume
of 700 mL). The visible light source was four 6-W visible lamps with peak intensity at 544 nm. Working
solutions of formaldehyde were prepared by the dilution of stock solution (1000 mg/L). A magnetic stirrer
was applied to mix as-prepared photocatalyst and formaldehyde molecules in the bulk solution. The residual
concentration of formaldehyde was measured spectrophotometrically by Nash’s method.44 The mineralization of
formaldehyde during the photocatalysis was determined by means of chemical oxygen demand (COD) according
to the standard methods for the examination of water and wastewater.45 The surface morphology of the samples
was analyzed via a scanning electron microscope (TESCAN, Mira3, Czech Republic). X-ray diffraction (XRD)
patterns of pure ZnO nanostructures, pure diatomite, and ZnO/diatomite nanocomposite were taken via a
PANalytical diffractometer (Model: X’Pert Pro MPD, the Netherlands) at current intensity = 30 mA, voltage
= 40 kV, λ = 1.54056 A, step size = 0.026◦ /s, measurement temperature = 25 ◦C, and scanning angle = 10–
80◦ . Fourier transform infrared (FT-IR) analysis was conducted on KBr pellets to show the role of functional
groups in the immobilization of ZnO nanostructures (Tensor 27, Bruker, Germany) at wavenumbers ranging
from 400 to 4000 cm−1 .
4. Conclusions
ZnO-loaded diatomite irradiated by UV light lamps was applied for the photocatalysis of formaldehyde in
the aqueous phase. As a result, the adsorption and photolysis processes did not remove formaldehyde from
the solution reasonably well. The immobilization of ZnO nanostructures improved the removal efficiency of
formaldehyde. Increasing the photocatalyst dosage and decreasing the initial dye concentrations enhanced
the photocatalysis. Efficient COD removal was attained by applying the reaction time of 1 h for an initial
formaldehyde concentration of 500 mg/L. It could be concluded that ZnO/diatomite nanocomposite can be
efficiently used for the photocatalysis of formaldehyde in the aqueous environment.
Acknowledgment
The authors wish to thank Arak University of Medical Sciences (Iran) for their financial and instrumental
support.
409

DARVISHI CHESHMEH SOLTANI et al./Turk J Chem
References
1. Darvishi Cheshmeh Soltani, R.; Rezaee, A.; Safari, M.; Khataee, A. R.; Karimi, B. Desalin. Water Treat. 2015,
53, 1613-1620.
2. Guimaraes, J. R.; Turato Farah, C. R.; Maniero, M. G.; Fadini, P.S. J. Environ. Manage. 2012, 107, 96-101.
3. Raja Priya, K.; Sandhya, S.; Swaminathan, K. Chem. Eng. J. 2009, 148, 212-216.
4. Asl, S. K.; Sadrnezhaad, S. K. Turk. J. Chem. 2012, 36, 121-135.
5. Azar, P. A.; Dehaghi, S. M.; Samadi, S.; Tehrani, M. S.; Givianrad, M. H. Turk. J. Chem. 2011, 35, 37-44.
6. Zhang, G.; Xiong, Q.; Xu, W.; Guo, S. Appl. Clay Sci. 2014, 102, 231-237.
7. Liao, Y.; Xie, C.; Liu, Y.; Chen, H.; Li, H.; Wu, J. Ceram. Int. 2012, 38, 4437-4444.
8. Liao, Y.; Xie, C.; Liu, Y.; Huang, Q. J. Alloy. Compd. 2013, 550, 190-197.
9. Rezaee, A.; Rangkooy, H.; Khavanin, A.; Jafari, A. J. Environ. Chem. Lett. 2014, 12, 353-357.
10. Huey-Shya, G.; Adnan, R.; Farrukh, M. A. Turk. J. Chem. 2011, 35, 375-391.
11. Darvishi Cheshmeh Soltani, R.; Rezaee, A.; Khataee, A. R.; Safari, M. J. Ind. Eng. Chem. 2014, 20, 1861-1868.
12. Shirzad-Siboni, M.; Farrokhi, M.; Darvishi Cheshmeh Soltani, R.; Khataee, A.; Tajassosi, S. Ind. Eng. Chem. Res.
2014, 53, 1079-1087.
13. Xia, Y.; Li, F.; Jiang, Y.; Xia, M.; Xue, B.; Li, Y. Appl. Surf. Sci. 2014, 303, 290-296.
14. Darvishi Cheshmeh Soltani, R.; Rezaee, A.; Khataee, A. Ind. Eng. Chem. Res. 2013, 52, 14133-14142.
15. Khataee, A. R.; Pons, M. N.; Zahraa, O. J. Hazard. Mater. 2009, 168, 451-457.
16. Fathinia, M.; Khataee, A.; Naseri, A.; Aber, S. Spectrochim. Acta A. 2015, 136, 1275-1290.
17. Fatimah, I.; Wang, S.; Wulandari, D. Appl. Clay Sci. 2011, 53, 553-560.
18. Seftel, E. M.; Niarchos, M.; Mitropoulos, C.; Mertens, M.; Vansant, E. F.; Cool, P. Catal. Today 2014, 252,
120-127.
19. Aivalioti, M.; Papoulias, P.; Kousaiti, A.; Gidarakos, E. J. Hazard. Mater. 2012, 207-208, 117-127.
20. Caliskan, N.; Kul, A. R.; Alkan, S.; Sogut, E. G.; Alacabey, I. J. Hazard. Mater. 2011, 193, 27-36.
21. Darvishi Cheshmeh Soltani, R.; Safari, M.; Maleki, A.; Godini, H.; Pordel, M. A. J. Dispers. Sci. Technol. DOI:
10.1080/01932691.2015.1058715 (in press).
22. Darvishi Cheshmeh Soltani, R.; Jorfi, S.; Ramezani, H.; Purfadakari, S. Ultrason. Sonochem. 2016, 28, 69-78.
23. Darvishi Cheshmeh Soltani, R.; Safari, M.; Mashayekhi, M. Ultrason. Sonochem. DOI:10.1016/j.ultsonch.2015.11.018
(in press).
24. Darvishi Cheshmeh Soltani, R.; Khataee, A. R.; Safari, M.; Joo, S. W. Int. Biodeter. Biodegr. 2013, 85, 3833-3891.
25. Xu, H.; Yu, T.; Liu, J. Mater. Lett. 2014, 117, 263-265.
26. Khataee, A.; Darvishi Cheshmeh Soltani, R.; Hanifehpour, Y.; Safarpour, M.; Gholipour Ranjbar, H.; Joo, S. W.
Ind. Eng. Chem. Res. 2014, 53, 1924-1932.
27. Khataee, A. R.; Karimi, A.; Arefi-Oskoui, S.; Soltani, R. D. C.; Hanifehpour, Y.; Soltani, B.; Joo, S. W. Ultrason.
Sonochem. 2015, 22, 371-381.
28. Patterson, A. L. Phys. Rev. 1939, 56, 978-982.
29. Kıransan, M.; Soltani, R. D. C.; Hassani, A.; Karaca, S.; Khataee, A. J. Taiwan Inst. Chem. Eng. 2014, 45,
2565-2577.
30. Shams Khorramabadi, G.; Darvishi Cheshmeh Soltani, R.; Rezaee, A.; Khataee, A. R.; Jonidi Jafari, A. Can. J.
Chem. Eng. 2012, 90, 1539-1546.
31. Sheshdeh, R. K.; Nikou, M. R. K.; Badii, K.; Limaee, N. Y.; Golkarnarenji, G. J. Taiwan Inst. Chem. Eng. 2014,
45, 1792-1802.
410

DARVISHI CHESHMEH SOLTANI et al./Turk J Chem
32. Sheng, G.; Wang, S.; Hu, J.; Lu, Y.; Li, J.; Dong, Y.; Wang, X. Colloid. Surface. A 2009, 339, 159-166.
33. Sarı, A.; Cıtak, D.; Tuzen, M. Chem. Eng. J. 2010, 162, 521-527.
34. Darvishi Cheshmeh Soltani, R.; Safari, M.; Rezaee, A.; Godini, H. Environ. Prog. Sustain. Energy 2015, 34,
105-111.
35. Mendez, J. A. O.; Melian, J. A. H.; Arana, J.; Rodrıguez, J. M. D.; Dıaz, O. G.; Pena, J. P. Appl. Catal. B 2015,
163, 63-73.
36. Zhu, Q.; Zhang, Y.; Zhou, F.; Lv, F.; Ye, Z.; Fan, F.; Chu, P.K. Chem. Eng. J. 2011, 171, 61-68.
37. Saleh, T. A.; Gondal, M. A.; Drmosh, Q. A.; Yamani, Z. H.; Al-yamani, A. Chem. Eng. J. 2011, 166, 407-412.
38. Nezamzadeh-Ejhieh, A.; Khorsandi, S. J. Ind. Eng. Chem. 2014, 20, 937-946.
39. Sun, Z.; Hu, Z.; Yan, Y.; Zheng, S. Appl. Surf. Sci. 2014, 314, 251-259.
40. Siddiquey, I. A.; Furusawa, T.; Sato, M.; Bahadur, N. M.; Mahbubul Alam, M.; Suzuki, N. Ultrason. Sonochem.
2012, 19, 750-755.
41. Afkhami, A.; Bagheri, H.; Madrakian, T. Desalination 2011, 281, 151-158.
42. Rajamanickam, D.; Shanthi, M. Spectrochim. Acta A 2014, 128, 100-108.
43. Kajitvichyanukul, P.; Lu, M. C.; Liao, C. H.; Wirojanagud, W.; Koottatep, T. J. Hazard. Mater. 2006, 135,
337-343.
44. Nash T. Biochem. J. 1953, 55, 416-421.
45. APHA, AWWA, WEF. Standard Methods for the Examination of Water and Wastewater. American Public Health
Association: Washington DC, USA, 2005.
411
Recommended