
Philip CoxChief Executive Officer
EEI ConferenceLondon, February 2006

IPR in the industry value chain
Transmission Distribution Supply Customer
Combined heat & power (CHP)Gas transportation
Coal mining
Retail(Australia)
Shows IPR’s presence in the value chain
SeawaterDesalination
FuelSupply
WholesaleGeneration

A leading global power generatorPortfolio approach - regional focus
Key Hydro Coal Gas Other
Hazelwood
Pelican PointSynergen
Hays Midlothian I & II
Hartwell
Milford BlackstoneRugeley
Oyster Creek
Bellingham
Pego
Australia
EcoEléctrica
Loy Yang B
Kwinana
Canunda
Paiton
Shuweihat
TurbogásSpanish Hydro
Gross capacity in operation 28,793 MWNet capacity in operation 16,642 MWNet capacity under construction 1,729 MW
SEAgas pipeline
Europe
Asia
North America Deeside
HUBCO
KAPCO
Uni-Mar
Malakoff
Pluak DaengAl Kamil
ISAB
DerwentFirst Hydro
Uch
Saltend
HiddTihama
Ras Laffan
IPR Opatovice
UAN
Middle East

Capacity analysisNet MW geography and fuel type
28%
35%
Asia NorthAmerica
Europe
Australia
Geography
19%
13%
MiddleEast
6% 25%
62%
Coal
Gas
Oil3%
Fuel
9%
Pumpedstorage
Wind 0.5%Hydro 0.5%
Excludes assets under construction

Balanced approachPPA and merchant markets
Earnings and cash flow from- merchant assets- medium term contracted assets- PPA/long term contracted assets
Visible and stable earnings and cash flow from long term contracted assets
Overlaid by merchant markets with upside potential
Balanced risk reward profile

The IPR portfolio approach
Risk mitigation across 5 core regional markets Access to optimum growth opportunities
- greenfield- acquisitions
In depth regional market knowledge/customer contacts
Balance of contracted and merchant markets Knowledge/skills transfer

Capital structure
Non-recourse project debt the fundamental building block
Liquid resources at IPR corporate- cash- headroom- borrowing capacity
Free cash flow generation strong and consistent
Debt capitalisation 58% (at 30 September 2005)

Portfolio performance
High quality asset portfolio- robust operational performance
Strong financial performance- earnings underpinned by cash flow
Growth opportunities- growing markets – 2% to 8% demand
growth rates- acquisition opportunities- organic growth / greenfield opportunities
Progressive dividend policy

North America
Merchant & contracted capacity Key merchant markets - Texas &
New England- moving towards market recovery
Merchant capacity - key competitive advantages- modern, highly efficient- solid capital structure
Improved spark spreads, particularly in Texas Capacity payments - Nepool - represents upside
potential Full market recovery expected in 2007 - 2009

Europe Significant growth in capacity and profits
- EME, Turbogas, and Saltend acquisitions
Contracted portfolio performing well
UK Key merchant market
- 7th largest generator with 7% market share
Overall improving market conditions- improved coal spreads- favourable market conditions for First Hydro
Robust UK portfolio - benefiting from fuel diversity

Middle East
Creation of new region since 2000- six projects in six years- portfolio of long-term contracted assets
Power and desalination All operational assets performing well 3.6 GW (gross) construction programme Opportunity rich markets
- strong demand growth for power and water- pipeline of further projects
Experienced development, construction management and operational team in place
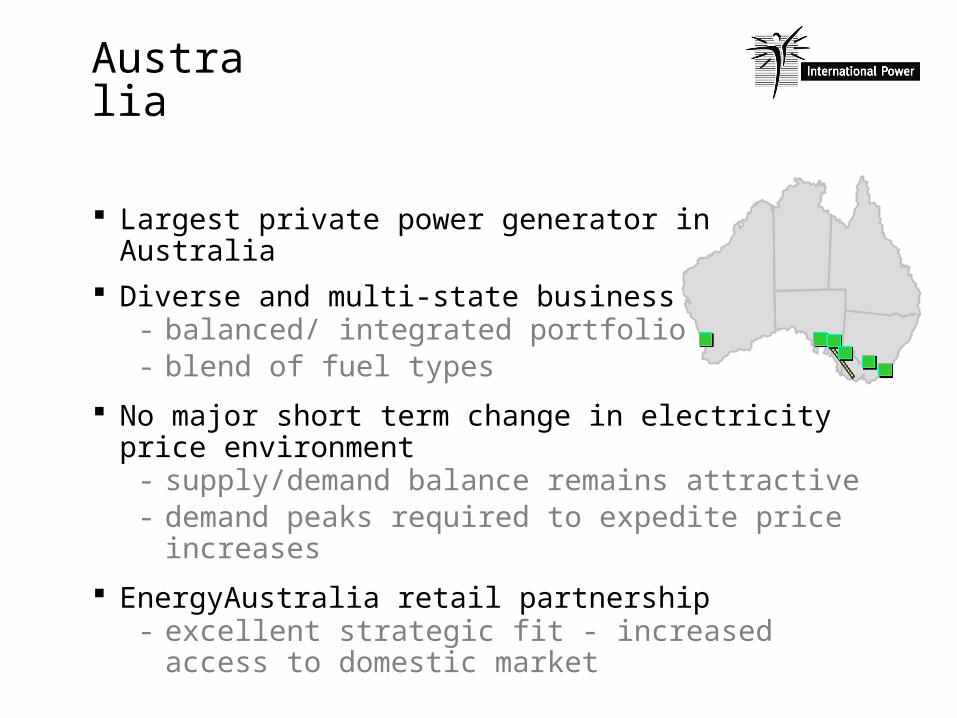
Australia
Largest private power generator in Australia Diverse and multi-state business
- balanced/ integrated portfolio- blend of fuel types
No major short term change in electricity price environment- supply/demand balance remains attractive- demand peaks required to expedite price
increases
EnergyAustralia retail partnership- excellent strategic fit - increased access to
domestic market

Asia
All long term contracted assets- IPR plant operator for most assets
Operational performance - key for contracted assets- robust performance- high availability and high reliability
All assets delivering solid financial performance - good cash flow

Acquisition track record EME international portfolio acquisition completed in late
2004- smooth integration into IPR portfolio- significantly earnings enhancing
Turbogas, Portugal- acquired in July 2004- high technical availability - key for contracted assets
Saltend, UK- acquired in July 2005- favourable gas supply contract- strong cash flow generation
Energy Australia- growing customer base
Hidd, Bahrain- long term offtake contract signed- IPR involved in O&M ahead of completion in July 2006

Financial highlights9 months to 30 September 2005
Good financial performance- EPS 9.6p up 48%- profit from operations up significantly to
£345m (2004: £162m)
Profit from operations up in all regions- strong contribution from recent
acquisitions- improved performance in the US and the
UK
Cash flow strong across the portfolio- free cash flow significantly up at £185m
(2004: £69m)

Geographic analysisRegional split of profit from operations
-30
0
30
60
90
120
150
Note: Profit from operations comprises the sum of profit before interest and tax (PBIT) of subsidiaries and profit after tax (PAT) of joint ventures and associates. Comparatives for 2004 have been presented on this basis.
NorthAmerica
Europe MiddleEast
Australia Asia
79
41
105
78
1816
145
55
28
-6
YTD 2004 YTD 2005
£m
Summary A leading global power generator
- regional balance - 5 core regions- contracted and merchant markets
Core competencies- greenfield development- acquisitions- financing- plant operations and asset management- trading and commercial structuring
Asset management- delivery of results
Growth opportunities Portfolio performing well
- operationally and financially
Recommended