66
Design Procedure
We now summarize the technique for designing a multipurpose energy efficient atmospheric column. First, the Watkins design method is used to obtain an initial scheme without pump-around circuits. Then a heat demand-supply diagram is constructed and the direction of heat shifting needed for maximum energy efficiency is determined. This procedure is repeated for at least the lightest crude and the heaviest crude that will be processed. Thus, the design procedure is divided into two parts, the targeting procedure and the multipurpose heat exchanger network design. We focus on the targeting procedure (Bagajewicz and Ji, 2001), which is presented next. After this, the goals of the heat exchanger network design procedure are outlined. Step 1: Begin with the lightest crude to be processed. As the lightest crude has the highest yields of light distillates, the supply of heat is the largest. Next, the major design parameters (the number of trays in each section, the pressure drop, and the amount of stripping steam) are chosen using the guidelines offered by Watkins with one exception: No pump-around circuits are included at this point. Step 2: The simulation is performed next. Usually the column is not difficult to converge, as the liquid reflux ratio is large. Step 3: The heat demand-supply diagram is constructed. Step 4: The maximum amount of heat is transferred to a pump-around circuit located in the region between the top tray and the first product withdrawal tray. The location of the pump-around circuit withdrawal and the return temperature are conveniently chosen so that the energy recovery is maximized. This is discussed further when presenting the example. Step 5: If the product gap becomes smaller than required, the stripping steam flowrate is to be increased to fix the gap. As long as the steam added has a lower cost than the energy saved, one can continue shifting loads. Otherwise, it is advisable to stop when a trade-off has been reached. Step 6: If there is heat surplus from the pump-around circuit just added, transfer the heat to the next pump-around circuit between draws in the same way as in step 4. If not, stop. At this stage, once this procedure is repeated for different crudes, one is left with heat removal targets from the condenser, the products and several pump-around circuit streams. Typically, since the light crude is the one that needs a larger reflux, it exhibits a larger amount of pump-around circuit duties. After these targets are determined, it is shown that there is still some flexibility to move heat from one pump-around to another, a feature that may be helpful in the final design of the heat exchanger network, or for retrofit. The above procedure is illustrated next.

67
Illustration
The properties of a light crude, an intermediate crude and a heavy crude are shown in Tables 4-1, 4-2 and 4-3. Table 4-4 indicates the specifications of the products. The product withdraw locations are determined according to Watkins’ guidelines and the results are shown in Table 4-5.
Table 4-1: Feedstock Used for the Design
Crude Density (kg/m3)
Throughput (m3/hr)
Light Crude 845 (36.0 API) 795 Intermediate Crude 889 (27.7 API) 795 Heavy Crude 934 (20.0 API) 795
Table 4-2:TBP Data Temperature (oC) Vol. %
Light Crude Intermediate Crude
Heavy Crude
5 45 94 133 10 82 131 237 30 186 265 344 50 281 380 482 70 382 506 640 90 552 670 N/A
Table 4-3: Light-ends Composition of Crude Vol. %
Compound Light Crude Intermediate Crude
Heavy Crude
Ethane 0.13 0.1 0 Propane 0.78 0.3 0.04
Isobutane 0.49 0.2 0.04 n-Butane 1.36 0.7 0.11
Isopentane 1.05 0 0.14 n-Pentane 1.30 0 0.16
Total 5.11 1.3 0.48

68
Table 4-4: Product Specifications and Withdrawal Tray
Product Specification Withdrawal Tray
Naphtha D86 (95% point) =182 °C 1 Kerosene D86 (95% point) =271 °C 9
Diesel D86 (95% point) =327 °C 16 Gas Oil D86 (95% point) =377-410 °C 25
Overflash rate 0.03 Kerosene –Naphtha (5-95) Gap ≥ 16.7 °C Diesel- Kerosene (5-95) Gap ≥ 0 °C Gas Oil- Diesel (5-95) Gap = -5.6 °C to –11 °C
Feed Tray 29 Total Trays 34
Table 4-5: Tray Requirements in Watkins Design Separation
Number of Trays Light Naphtha to Heavy Naphtha 6 to 8 Heavy Naphtha to Light Distillate 6 to 8 Light Distillate to Heavy Distillate 4 to 6
Heavy Distillate to Gas Oil 4 to 6 Flash Zone to First Draw Tray 3 to 4
Steam Stripping Sections 4 There are 34 trays in the main column and 4 trays in each stripper. The flowrates of stripping steam streams are estimated and adjusted to 10 lb per barrel of product, as suggested by Watkins. The total energy consumption (E) is calculated using the following expression:
E = U + 0.7 * ∑ siH (4-1)
where U is the minimum heating utility obtained using straight pinch analysis, and ∑ s
iH is the summation of energy flow of all steam streams. Because low-pressure steam is cheaper than fuel gas on the same amount of heat content, a weight factor of 0.7 is used for the steam. The total energy consumption is used as an objective function. Simulation results for the initial scheme with no pump-around circuits are shown in the first column of Table 4-6. Note the product gaps are well above the specifications.

69
Table 4-6: Comparative Results of One Top Pump-Around and No Pump-Around
Product No Pump-around One Pump-around Naphtha Flowrate 250 m3/hr 248 m3/hr Kerosene Flowrate 144 m3/hr 146 m3/hr Diesel Flowrate 70 m3/hr 70 m3/hr Gas Oil Flowrate 121 m3/hr 121 m3/hr Residue Flowrate 211 m3/hr 211 m3/hr Kerosene Stripping Steam Ratio* 9.82 9.68 Diesel Stripping Steam Ratio 10.22 10.27 Gas Oil Stripping Steam Ratio 10.12 10.11 Residue Stripping Steam Ratio 10.19 10.19 Kerosene-Naphtha (5%-95%) Gap 25.12°C 23.0°C (5-95) Diesel-Kerosene Gap 5.14°C 5.31°C (5-95) Gas Oil- Diesel Gap 0.93°C 0.91°C Kerosene Withdrawal Tray Temperature 238.8°C 237.1°C Diesel Withdrawal Tray Temperature 298.7°C 298.7°C Gas Oil Withdrawal Tray Temperature 338.7°C 338.7°C Residue Withdrawal Temperature 347.8°C 347.8°C Condenser Duty 103.86 MW 41.70 MW Condenser Temperature Range 155-43.3 °C 146.4-43.3 °C Pump-around 1 Duty - 62.14 MW Pump-around 1 Temperature Range - 179.6-104.4 °C Flash Zone Temperature 358.6 °C 358.6 °C Energy Consumption (E) 103.78 MW 96.77 MW
*Steam amount in lb/hr over the amount of product in bbl/hr.
The heat demand-supply diagram corresponding to the solution in Table 4-6 is shown in Figure 4-1. There is a very large heat surplus in the condenser region, which results in a large cooling utility. Meanwhile, a large heat deficit exists above 155 °C. As the total heat supply is almost constant, the way toward energy savings is to change the heat supply profile. That is, instead of supplying all heat at a low temperature, some heat can be supplied at a higher temperature where the heat demand is larger than the heat supply. In other words, transfer some heat from the condenser to a pump-around circuit as indicated by the arrow in Figure 4-1.

70
0
0.2
0.4
0.6
0.8
1
1.2
1.4
0 100 200 300 400
TEMPERATURE, °C
M*C
p, M
W/ °
CCOND
RES
CRUDE
PRODUCTS
1
PINCH
Figure 4-1: Heat Demand-Supply Diagram for Crude Distillation without Pump-Around Circuits
One Pump-Around Circuit If a pump-around is above all side-withdrawal product lines, the heat that can be transferred from the condenser will be the maximum. Therefore, the first pump-around has to be above the kerosene withdrawal tray. The question is how many trays one should put between the condenser and the top pump-around region. We recommend the top pump-around region be adjacent to the condenser. No tray is put in between. This is based on the observation that the trays below a product withdraw line and above an adjacent pump-around circuit receive little reflux and barely contribute to separation. The pump-around stream is withdrawn from tray 4, cooled in the heat exchangers and returned to tray 2. The return temperature is 104.4 °C, which is optimized after the duty is determined. The duty of the top pump-around (PA1) is increased gradually and product gaps are examined in each simulation. The kerosene-naphtha gap decreases with the increase of PA1 duty, but remains well above that of specification, while the other gaps are almost unchanged. The heat shift continues without violating the gap specifications until the reflux ratio is around 0.1. Further heat shift would result in liquid drying up on the top tray. Thus, the limit of the heat shifting has been reached. The duty of 62 MW represents the total amount of heat one could obtain from all pump-around circuits. The main operation variables of the scheme with one pump-around are shown in Table 4-6 and the corresponding demand-supply diagram is shown in Figure 4-2.

71
The major conclusions are: • The total energy consumption (E) decreases by 7 MW compared to the no pump-
around scheme. • The kerosene-naphtha gap is reduced from 25 °C to 23 °C, remaining well above the
specification of 16.7 °C. • The yield of naphtha decreases and the yield of kerosene increases. This is because
some light components of the vapor are absorbed by the cold pump-around stream and carried to the kerosene withdrawal tray. Note that the total yield of the two products remains constant.
• Little change takes place below the kerosene withdrawal tray.
0
0.2
0.4
0.6
0.8
1
1.2
1.4
0 100 200 300 400
TEMPERATURE, °C
M*C
p, M
W/ °
C
RES
CRUDE
PRODUCTS
PA1
COND
PINCH
Figure 4-2: Heat Demand-Supply Diagram for Crude Distillation with a Top Pump-around
Two Pump-Around Circuits We now turn our attention to the resulting heat demand-supply diagram (Figure 4-2). The shaded area is the energy savings achieved by adding PA1. The heat surplus in the condenser region is greatly reduced, but it is still significant. However, it is impossible to shift more heat from the condenser to PA1. The return temperature of PA1 is not important in terms of energy consumption, because the heat surplus is larger than the demand below the PA1 withdrawal temperature. To

72
reduce the heat surplus in the region of PA1, a second pump-around is installed at a position as indicated by the arrow in Figure 4-2. The second pump-around (PA2) is positioned between tray 10 and tray 12, just below the kerosene withdrawal tray. The return temperature is chosen to be approximately equal to that of the withdrawal temperature of PA1. A lower temperature would result in heat surplus in the region of PA1, while a very high return temperature would not alter the energy savings but result in a heavier liquid traffic in the PA2 region. With the increase of the PA2 duty, the gap between kerosene and naphtha decreases quickly. Table 4-7 shows the change of gaps as a function of the duty of pump-around PA2.
Table 4-7: Effect of Increasing PA2 Duty without Changing Steam Flowrates 1 2
Duty of PA2 29.31 MW 33.71 MW Duty of PA1 32.83 MW 28.43 MW
Duty of Condenser 41.94 MW 42.03 MW (5-95) Kerosene-Naphtha Gap 18.49 °C 16.60 °C (5-95) Diesel-Kerosene Gap 1.63 °C 1.48 °C (5-95) Gas Oil- Diesel Gap 1.22 °C 1.23 °C
Energy Consumption 70.59 MW 67.35 MW When the duty of PA2 is larger than 33.7 MW, the kerosene-naphtha gap does not satisfy the specification. To recover this gap, one could increase the stripping steam flowrate or increase the number of trays in the naphtha-kerosene section. The former option is used here, although one should make a trade-off analysis between capital and operating costs. The kerosene and diesel stripping steam flowrates are adjusted to meet the gap specifications.
With the help of the stripping steam, it is possible to move more heat from PA1 to PA2. The trade off between increasing energy recovery and spending more steam is evaluated using equation (4-1). Heat shifting continues until the liquid reflux at the kerosene withdrawal tray is small and /or the kerosene-naphtha gap cannot be recovered even with increased amounts of stripping steam. This is a limit imposed by the separation requirement. The limiting case is shown in Table 4-9 below (first column) and should be compared with the second column of Table 4-6.
The major changes from one pump-around to two pump-around circuits are:
• The net energy consumption decreases sharply by 32 MW. • The flowrate of the kerosene stripping steam is nearly doubled. The large extra steam
is used to strip a significant amount of light components in the kerosene withdrawal stream. The top section of the column becomes less hot because of the increased stripping steam. The kerosene withdrawal temperature drops by 33 °C.
• The yield of diesel increases while the yield of naphtha decreases.
73
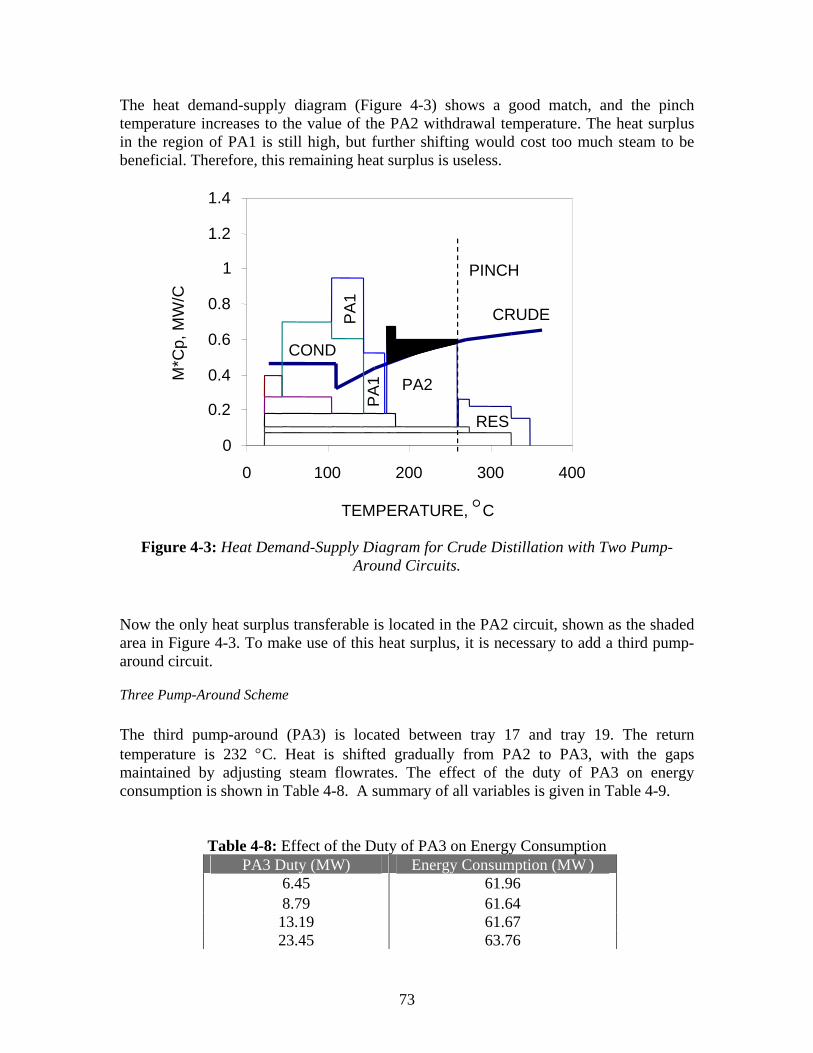
The heat demand-supply diagram (Figure 4-3) shows a good match, and the pinch temperature increases to the value of the PA2 withdrawal temperature. The heat surplus in the region of PA1 is still high, but further shifting would cost too much steam to be beneficial. Therefore, this remaining heat surplus is useless.
0
0.2
0.4
0.6
0.8
1
1.2
1.4
0 100 200 300 400
TEMPERATURE, °C
M*C
p, M
W/C
RES
CRUDEPA1
COND
PA2
PINCH
PA1
Figure 4-3: Heat Demand-Supply Diagram for Crude Distillation with Two Pump-Around Circuits.
Now the only heat surplus transferable is located in the PA2 circuit, shown as the shaded area in Figure 4-3. To make use of this heat surplus, it is necessary to add a third pump-around circuit.
Three Pump-Around Scheme The third pump-around (PA3) is located between tray 17 and tray 19. The return temperature is 232 °C. Heat is shifted gradually from PA2 to PA3, with the gaps maintained by adjusting steam flowrates. The effect of the duty of PA3 on energy consumption is shown in Table 4-8. A summary of all variables is given in Table 4-9.
Table 4-8: Effect of the Duty of PA3 on Energy Consumption
PA3 Duty (MW) Energy Consumption (MW ) 6.45 61.96 8.79 61.64 13.19 61.67 23.45 63.76

74
26.67 64.56
Table 4-9: Comparative Results for Two and Three Pump-Around Circuits. Product 2 Pump-around
circuits 3 Pump-around circuits
Naphtha Flowrate 244 m3/hr 244 m3/hr Kerosene Flowrate 145.6 m3/hr 145.5 m3/hr Diesel Flowrate 73.6 m3/hr 72.5 m3/hr Gas Oil Flowrate 121.6 m3/hr 123.85 m3/hr Residue Flowrate 210.5 m3/hr 209.7 m3/hr Kerosene Stripping Steam Ratio* 19.02 18.04 Diesel Stripping Steam Ratio 8.11 12.54 Gas Oil Stripping Steam Ratio 7.84 7.71 Residue Stripping Steam Ratio 10.20 10.24 (5-95) Kerosene-Naphtha Gap 16.7 °C 16.7 °C (5-95) Diesel-Kerosene Gap 0 °C 0 °C (5-95) Gas Oil- Diesel Gap -2.0 °C -2.9 °C Kerosene Withdrawal Tray Temperature
202.2 °C 212.7 °C
Diesel Withdrawal Tray Temperature 291.2 °C 289.9 °C Gas Oil Withdrawal Tray Temperature 336.1 °C 338.9 °C Residue Withdrawal Temperature 347.9 °C 348.2 °C Condenser Duty 42.4 MW 43.3 MW Condenser Temperature Range 143.6-43.3 °C 143.5-43.3 °C Pump-around 1 Duty 22.3 MW 22.3 MW Pump-around 1Temperature Range 169.2-104.4 °C 169.4-104.4 °C Pump-around 2 Duty 42.5 MW 33.7 MW Pump-around 2 Temperature Range 257.9-171.1 °C 255.3-171.1 °CPump-around 3 Duty - 8.8 MW Pump-around 3Temperature Range - 310.6-232.2 °C Flash Zone Temperature 358.7°C 359 °C Energy Consumption 64.73 MW 61.64 MW
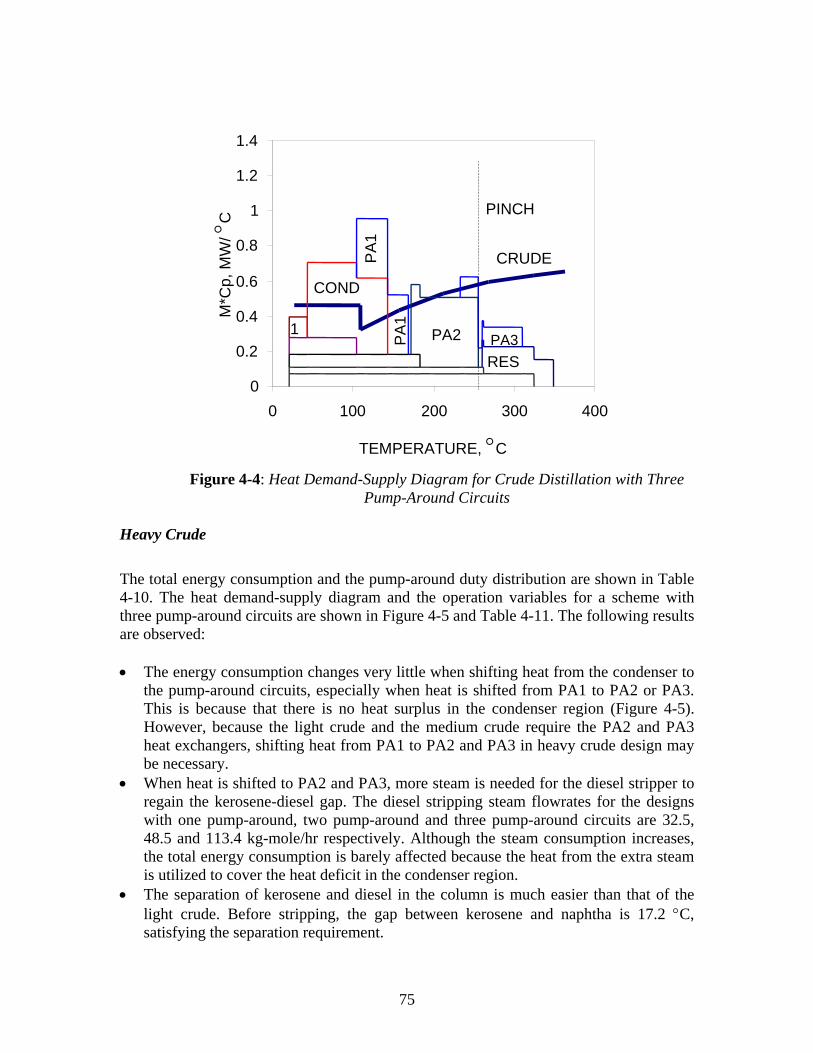
At the beginning, the energy consumption decreases with the increase of the duty of PA3. However, when the PA3 duty exceeds 8.8 MW, the energy consumption levels off over a wide range (Table 4-8). This is because little heat surplus exists in the region of PA2. Therefore, more heat shift makes no big difference. Beyond this stable range, more heat shift to PA3 results in an increase in energy consumption due to increased use of steam, which means that the cost of additional steam consumption outweighs the gain in energy recovery. Clearly 8.8 MW is the right point to stop. This effect cannot be captured with other design procedures. Figure 4-4 is the corresponding heat demand-supply diagram. The heat surplus previously in the region of PA2 (Figure 4-3) has been moved to the PA3, which accounts for the decrease in energy consumption.
75
0
0.2
0.4
0.6
0.8
1
1.2
1.4
0 100 200 300 400
TEMPERATURE, °C
M*C
p, M
W/ °
C
COND
RES
CRUDE
PA21PA3
PA1
PA1
PINCH
Figure 4-4: Heat Demand-Supply Diagram for Crude Distillation with Three
Pump-Around Circuits
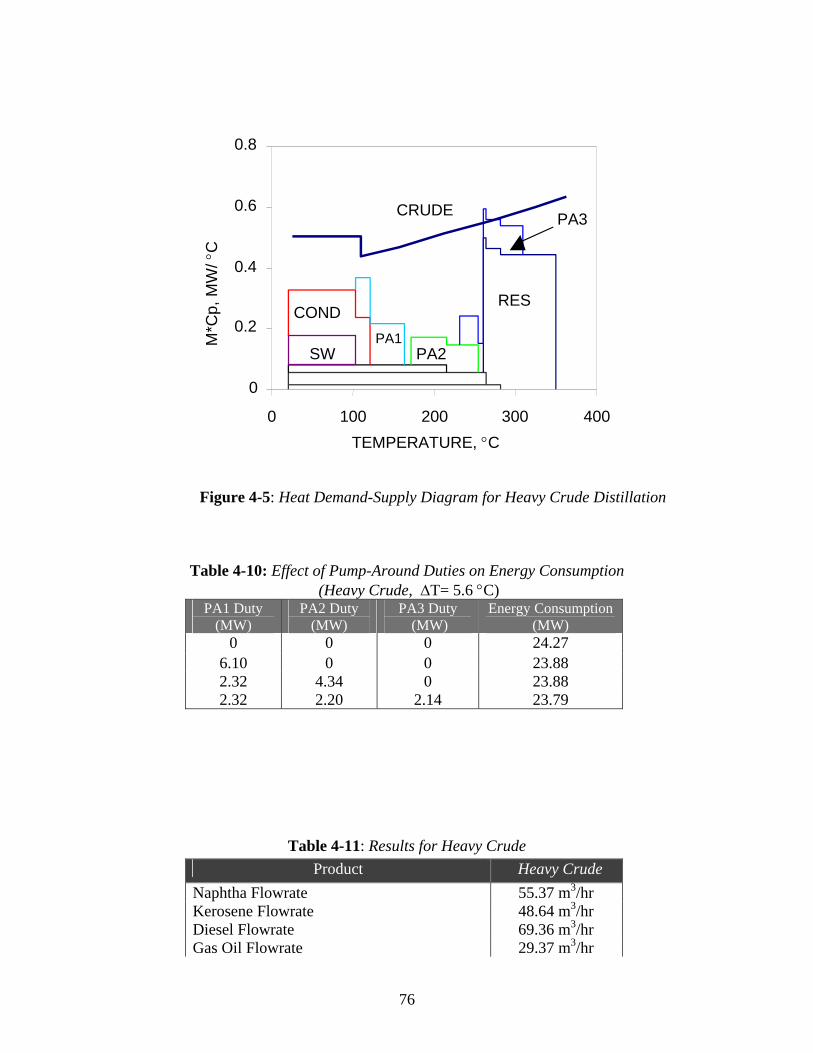
Heavy Crude The total energy consumption and the pump-around duty distribution are shown in Table 4-10. The heat demand-supply diagram and the operation variables for a scheme with three pump-around circuits are shown in Figure 4-5 and Table 4-11. The following results are observed: • The energy consumption changes very little when shifting heat from the condenser to
the pump-around circuits, especially when heat is shifted from PA1 to PA2 or PA3. This is because that there is no heat surplus in the condenser region (Figure 4-5). However, because the light crude and the medium crude require the PA2 and PA3 heat exchangers, shifting heat from PA1 to PA2 and PA3 in heavy crude design may be necessary.
• When heat is shifted to PA2 and PA3, more steam is needed for the diesel stripper to regain the kerosene-diesel gap. The diesel stripping steam flowrates for the designs with one pump-around, two pump-around and three pump-around circuits are 32.5, 48.5 and 113.4 kg-mole/hr respectively. Although the steam consumption increases, the total energy consumption is barely affected because the heat from the extra steam is utilized to cover the heat deficit in the condenser region.
• The separation of kerosene and diesel in the column is much easier than that of the light crude. Before stripping, the gap between kerosene and naphtha is 17.2 °C, satisfying the separation requirement.
76
0
0.2
0.4
0.6
0.8
0 100 200 300 400TEMPERATURE, °C
M*C
p, M
W/ °
C
CONDRES
CRUDE
SWPA1
PA2
PA3
Figure 4-5: Heat Demand-Supply Diagram for Heavy Crude Distillation
Table 4-10: Effect of Pump-Around Duties on Energy Consumption (Heavy Crude, ∆T= 5.6 °C)
PA1 Duty (MW)
PA2 Duty (MW)
PA3 Duty (MW)
Energy Consumption (MW)
0 0 0 24.27 6.10 0 0 23.88 2.32 4.34 0 23.88 2.32 2.20 2.14 23.79
Table 4-11: Results for Heavy Crude Product Heavy Crude
Naphtha Flowrate 55.37 m3/hr Kerosene Flowrate 48.64 m3/hr Diesel Flowrate 69.36 m3/hr Gas Oil Flowrate 29.37 m3/hr

77
Residue Flowrate 592.51 m3/hr Kerosene Stripping Steam Ratio* 1.63 Diesel Stripping Steam Ratio 2.98 Gas Oil Stripping Steam Ratio 37.9 Residue Stripping Steam Ratio 2.68 (5-95) Kerosene-Naphtha Gap 26.07 °C (5-95) Diesel-Kerosene Gap 0.86 °C (5-95) Gas Oil- Diesel Gap -5.84°C Kerosene Withdrawal Tray Temperature 259.7 °C Diesel Withdrawal Tray Temperature 317.4 °C Gas Oil Withdrawal Tray Temperature 344.4 °C Residue Withdrawal Temperature 366.7 °C Condenser Duty 14.8 MWW Condenser Temperature Range 123.3-18.5 °C PA1 Duty 20.8 MW PA1 Temperature Range 175.7-104.4 °C Flash Zone Temperature 353.2 °C Energy Consumption 81.49 MW
Effect of Minimum Temperature Approach The effect of HRAT on the optimal pump-around duty distribution is shown in Tables 4-12, 4-13 and 4-14. Note that for the light crude, PA3 duty increases with the increase of HRAT. This can be explained using the heat demand-supply diagram (Figure 4-4). When the HRAT is 5.6°C, there is almost no heat surplus in the region of PA2. However, when HRAT is increased, the crude demand curve is moved to the right and heat surplus appears again. Thus, the heat surplus needs to be reduced to achieve the maximum energy savings. The heavy crude behaves differently. As there is no heat surplus in the region of the condenser and PA1, shifting heat from PA1 to PA2 or PA3 does not reduce the net heat demand while more stripping steam is needed to keep the product gaps. At low HRAT (e.g., 5.6 °C), most of the heat coming from the condenser can be used because of the heat deficit in the condenser region. However, when HRAT is raised, the overlapping between the crude curve and the condenser curve reduces, and part of the heat from the condenser is at a temperature that is too low to be usable. In such a case, the heat from the increased steam cannot be used. Therefore, heat shifting to the lower pump-around circuits is not beneficial.
Table 4-12: Effect of HRAT on Energy Consumption (Light Crude) HRAT (�C)
PA1 Duty (MW)
PA2 Duty (MW)
PA3 Duty (MW)
Energy Consumption (MW)
5.6 22.3 34 8.8 61 22.2 22.3 29 8.8 69.8 44.4 22.3 23 13.2 81.2

78
Table 4-13: Effect of HRAT on Energy Consumption (Heavy Crude) HRAT (�C)
PA1 Duty (MW)
PA2 Duty (MW)
PA3 Duty (MW)
Energy Consumption
(MW) 5.6 7.9 7.5 7.3 81.2 22.2 22.6 0 0 86.4 44.4 22.6 0 0 93.1
These calculations were also performed for the intermediate crude (Table 4-14). In this case, the heat distribution does not change with HRAT. This is because there is always a heat surplus in the region of PA1 and heat deficit in the region of PA2. The heat surplus in the region of PA1 prompts maximum heat shift to PA2, while the heat deficit in PA2 excludes the need for shifting heat to PA3. Thus, the optimal solution is to maximize the duty of PA2.
Table 4-14: Effect of HRAT on Energy Consumption (Medium Crude)
HRAT (�C)
PA1 Duty (MW)
PA2 Duty (MW)
PA3 Duty (MW)
Energy Consumption (MW)
5.6 15.2 26.4 0 63.1 22.2 15.2 26.4 0 70.4 44.4 15.2 26.4 0 79.9
The same procedure was applied to Pre-flash/Pre-fractionation units (Bagajewicz and Ji, 2002) and to the recently proposed stripping type units (Ji and Bagajewicz, 2002).
Heat Exchanger Network Design The Regular Transshipment Model (RTM) (Papoulias and Grossmann, 1983) was applied to both light and heavy crudes, above and below the pinch for the same HRAT (11.1 oC). The details of this method are omitted here because we want to concentrate on the results. We first note that the two crudes exhibit different composite curve diagrams (Figures 4-6 and 4-7). One is in fact, not pinched (heavy crude).
The results show that for the light crude a network with 18 exchangers is required (Figure 4-8), while for the heavy crude 15 exchangers are needed (Figure 4-9). The first observation is that the network for the light crude can perform the heat transfer of the network of the heavy crude above the desalter, but cannot handle it efficiently below the desalter and vice versa. If one merges both networks, the resulting structure is very complicated and features 22 exchangers (Figure 4-10). Note that even though the network for the heavy crude above the desalter does not contain splits, the light crude structure can still be used.

79
Vertical Heat Transfer - Light Crude
0
50
100
150
200
250
300
350
400
0 50 100 150 200 250
Enthalpy (MW)
Tem
pera
ture
(o C)
Figure 4-6: Pinch Diagram for Light Crude
Vertical Heat Transfer - Heavy Crude
0
50
100
150
200
250
300
350
400
0 50 100 150 200
Enthalpy (MW)
Tem
pera
ture
(C)
Figure 4-7: Pinch Diagram for Heavy Crude.

80
Cooling water
DESALTER
C2
FURNACE
H4H9
H1
C1
H10
H8
H2 H3 H7
H6
H5
Figure 3: RTM Applied for Light Crude Figure 4-8: Design for Light Crude.
Captions: H1: Kerosene, H2: Diesel, H3: AGO, H4: Condenser, H5: PA1, H6: PA2, H7: PA3, H8: Residue, H9: Naphtha, H10: Sour Water, C1: Crude

81
Cooling water
DESALTER
C2
FURNACE
H6
H2
C1
H8
H7
H10H1
H5
H3H4
Figure 4: RTM Applied for Heavy Crude Figure 4-9: Design for the heavy crude.
Captions: H1: Kerosene, H2: Diesel, H3: AGO, H4: Condenser, H5: PA1, H6: PA2, H7: PA3, H8: Residue, H9: Naphtha, H10: Sour Water, C1: Crude

82
DESALTER
C1
H10
H4
FURNACE
H1
H8
H2 H3 H7
H6
H5
H9
Figure 5: Multipurpose HEN Obtained by Merging Figure 3 and 4.
C2NOT USED FORHEAVY CRUDE
NOT USED FORLIGHT CRUDE
Cooling water
Figure 4-10: Combined light/heavy pinch design.
Captions: H1: Kerosene, H2: Diesel, H3: AGO, H4: Condenser, H5: PA1, H6: PA2, H7: PA3, H8: Residue, H9: Naphtha, H10: Sour Water, C1: Crude
To obtain a better design a different methodology was used (Bagajewicz and Soto, 2001). This new method uses the targeting approach temperature (HRAT) to set energy consumption levels, but then relaxes this and allows the exchangers to violate it using a new minimum approach value, the Exchanger Minimum Approach Temperature (EMAT). Figure 4-11 shows the heat exchanger network obtained using an EMAT of 5.6 oC (10 oF). This network has 20 units, and neither loops nor bypasses exist. However, it is necessary to split the crude stream in four and five branches above and below the desalter, respectively. Costs are compared with the network obtained using the RTM model in Table 4-15. There is one heat exchanger that requires a large area (H6-C2) because it is the one that transfers heat in the middle region of the light crude composite curves where they are almost parallel (Figure 1).
In comparing this solution with the one obtained using the RTM model, one finds that the required area is increased by about 16% (Table 4-15), and the number of units is reduced (from 22 obtained for the RTM to 20), but the number of shells is larger. The operational

83
costs are the same because there is no difference in the energy consumption of both networks. The difference between the total annualized costs is smaller (7%) than the difference in area. The RTM design has nonetheless the added complexity of too many splitting.
The selected value of HRAT resulted in a large amount of area that is impractical. More important, the number of shells needed is unrealistic. Consequently, the HRAT was changed to 22.22 oC (40 oF) and 44.44 oC (80 oF). At the same time, EMAT was changed to 16.66 oC (30 oF) and 33.33 oC (60 oF), respectively. Before showing the impact of HRAT/EMAT changes, the role of the desalter temperature and the pump-around flexibility is discussed.
DESALTER
C1
C2
FURNACE
H7H3
H8
H6
H1 H5H2
H4
H10
H9
Figure 4-11: Solution using New Model
NOT USED FORHEAVY CRUDE
Cooling water
NOT USED FOR HEAVY CRUDE
Captions: H1: Kerosene, H2: Diesel, H3: AGO, H4: Condenser, H5: PA1, H6: PA2, H7: PA3, H8:
Residue, H9: Naphtha, H10: Sour Water, C1: Crude

84
Table 4-15: Area and costs for HRAT =11.1 oC.
Combined
RTM
Multiperiod
Model
Total area, m2 45,499 52,959 No. of units 22 20 No. of shells 57 64
Operating Costs, 106 $/yr. 4.18 4.18 Fixed Costs, 106 $/yr 3.13 3.63 Total Costs, 106 $/yr 7.31 7.81
Cost Data: Fuel gas =$6.83/ MW-hr, Cooling water=$1.2287/ MW-hr, Steam Cost= $ 1.76/Ton. Installed cost per shell= 1168.5 A0.65 (A in m2), Interest=10%, Plant life=15 years.
Desalter Temperature As it was discussed, while the light crude controls the network structure above the desalter, the heavy one does the same below it. Consequently, if the desalter temperature is increased for the light crude, one should expect a decrease in the network area above the desalter, as the light crude can now use the excess area below the desalter, which is there to serve the heavy crude heat recovery. In turn, increasing the desalter temperature for the heavy crude will require more area and matches because the region of temperatures below the desalter is limiting for this crude.
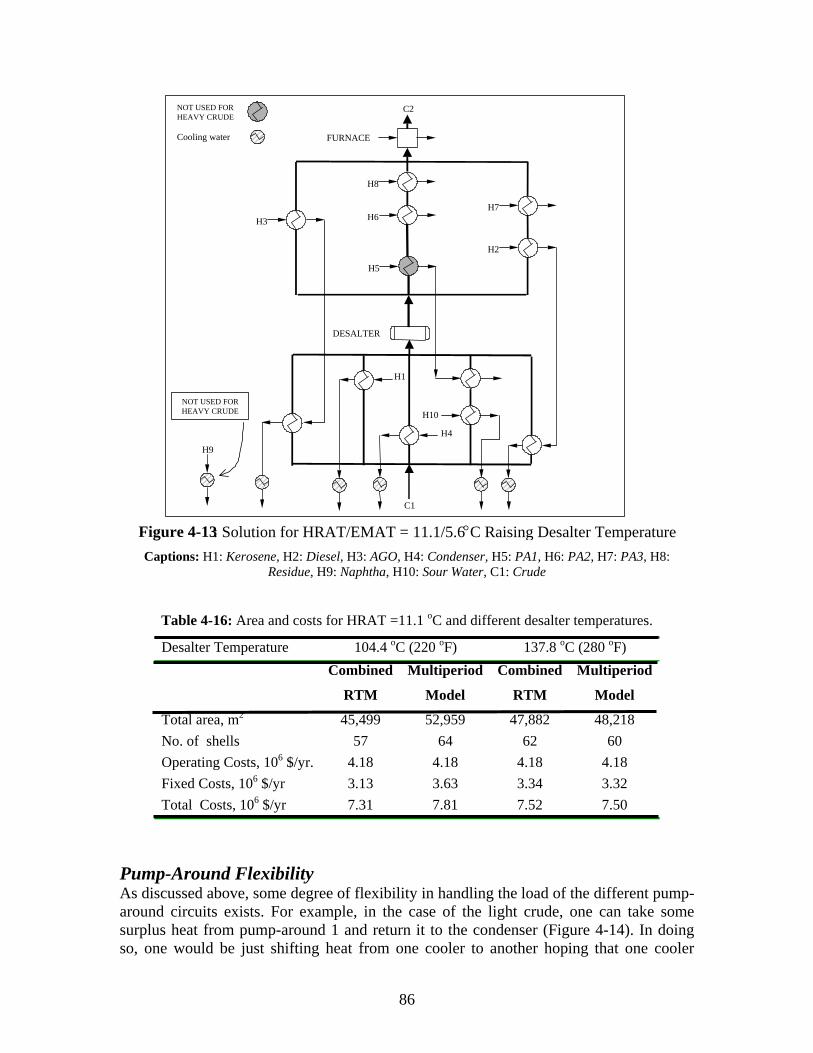
The previous RTM and Multiperiod designs (Figures 4-10 and 4-11) used a desalter temperature of 104.4 oC (220 oF) for both crudes. This temperature was increased to 137.8 oC (280 oF) only for the light crude set. Applying these changes, the RTM design gives the network of Figure 4-12. In turn, the new methodology gives the network structure shown in Figure 4-13, which has 2 exchangers less than the one in Figure 4-11. Furthermore, the required area is lower and compares well with the one obtained using the RTM as it is shown in Table 4-16. On the other hand, not only the RTM gives a very complicated network structure above the desalter but also it does the same below the desalter. Not only the multiperiod model renders a smaller cost, but it also renders fewer shells. In conclusion, the higher possible temperature in the desalter should be used for the light crude while the lower one should be selected for the heavy crude, so that the minimum network area is achieved.

85
Figure 4-12: Network Obtained Using RTM and high desalter temperature
H9
DESALTER
FURNACE
H1
H8
H2 H3 H7
H6
H5
C1
H10
H4
NOT USED FOR HEAVY CRUDE NOT USED FOR LIGHT CRUDE Cooling water
C2
Captions: H1: Kerosene, H2: Diesel, H3: AGO, H4: Condenser, H5: PA1, H6: PA2, H7: PA3, H8:
Residue, H9: Naphtha, H10: Sour Water, C1: Crude
86
DESALTER
C1
C2
FURNACE
H7H3
H8
H6
H1
H5
H2
H4
H10
H9
Figure 4-13 : Solution for HRAT/EMAT = 11.1/5.6 °C Raising Desalter Temperature
NOT USED FOR HEAVY CRUDE Cooling water
NOT USED FOR HEAVY CRUDE
Captions: H1: Kerosene, H2: Diesel, H3: AGO, H4: Condenser, H5: PA1, H6: PA2, H7: PA3, H8:
Residue, H9: Naphtha, H10: Sour Water, C1: Crude
Table 4-16: Area and costs for HRAT =11.1 oC and different desalter temperatures.
Desalter Temperature 104.4 oC (220 oF) 137.8 oC (280 oF) Combined
RTM
Multiperiod
Model
Combined
RTM
Multiperiod
Model
Total area, m2 45,499 52,959 47,882 48,218 No. of shells 57 64 62 60 Operating Costs, 106 $/yr. 4.18 4.18 4.18 4.18 Fixed Costs, 106 $/yr 3.13 3.63 3.34 3.32 Total Costs, 106 $/yr 7.31 7.81 7.52 7.50
Pump-Around Flexibility As discussed above, some degree of flexibility in handling the load of the different pump-around circuits exists. For example, in the case of the light crude, one can take some surplus heat from pump-around 1 and return it to the condenser (Figure 4-14). In doing so, one would be just shifting heat from one cooler to another hoping that one cooler

87
could be eliminated. However, the network obtained (Figures 4-11 or 4-13) does not use any cooling water for PA1 (stream H5), and therefore no exchanger can be eliminated by the proposed shift in the energy load distribution. Only the steam consumption could be decreased by this change. Such a shift, although beneficial, represents a small variation and is not explored any further.
0
0.2
0.4
0.6
0.8
1
1.2
0 100 200 300 400
TEMPERATURE, oC
M*C
p, M
W/o C
Cond
RES
CRUDE
PA2
PA1
1
PA3
Figure 9: Moving heat back to the condenser
0
0.2
0.4
0.6
0.8
1
1.2
0 100 200 300 400
TEMPERATURE, oC
M*C
p, M
W/o C
Cond
RES
CRUDE
PA2
PA1
1
PA3
(a) (b)
Economic Comparison for Different HRAT/EMAT Values
Because the number of shells is excessive for an HRAT of 11.1 oC, the effect of changing the HRAT to 22.2 oC (40 oF) and 44.4 oC (80 oF) was studied. Values of EMAT of 16.7 oC (30 oF) and 33.3 oC (60 oF), respectively, were used. As pointed out above, smaller values of EMAT can be used (around 10 oC), especially for large values of HRAT. Each time a value of HRAT is selected, the energy targets should be determined again because the heat load distribution throughout the column pump-around circuits changes. Not only the minimum utility changes, which is not even a linear function of HRAT as in straight pinch analysis because the heat capacities of the streams change, but also the pump-around duties are modified and consequently other flowrates are obtained. In addition, a high temperature in the desalter was used for the light crude 137.8 oC (280 oF). The solutions are shown in Figures 4-15 and 4-16 while total areas, number of shells and costs are shown in Table 4-17. As we can see, the solution of Figure 4-15 has 18 exchangers (40 shells). Although it has the same number of exchangers as the solution in Figure 4-13, the total area and costs are much lower. When the HRAT/EMAT is increased (Figure 4-16) the number of exchangers is reduced by one and the number of shells by eleven, while the total cost remains lower than those of the previous cases. To obtain an even
Figure 4-14: Moving Heat Back to the Condenser.

88
lower capital cost one can attempt to use a higher HRAT value. The exercise is the same and we do not repeat it here.
NOT USED FOR HEAVY CRUDE
NOT USED FOR HEAVY CRUDE
Cooling water FURNACE
H8
H6
H5
H7
H2
H10H4
H1
C1
DESALTER
H9
H3
Figure 4-15 : Heat Exchanger Network for HRAT/EMAT = 22.2/16.7 ° C Captions: H1: Kerosene, H2: Diesel, H3: AGO, H4: Condenser, H5: PA1, H6: PA2, H7: PA3, H8:
Residue, H9: Naphtha, H10: Sour Water, C1: Crude

89
NOT USED FOR HEAVY CRUDE
NOT USED FOR HEAVY CRUDE Cooling water
FURNACE
H8
H6
H7
H2
H10
H4
H1
C1
DESALTER
H9
H3
Figure 4-16 : Heat Exchanger Network for HRAT/EMAT = 44.4/33.3 ° C
H5
Captions: H1: Kerosene, H2: Diesel, H3: AGO, H4: Condenser, H5: PA1, H6: PA2, H7: PA3, H8:
Residue, H9: Naphtha, H10: Sour Water, C1: Crude
Table 4-17: Area and costs for different HRAT/EMAT.
HRAT/EMAT (oC) 22.2/16.7 44.4/33.3
Total area, m2 28,470 18,485 No. of shells 40 29 Operating Costs, 106 $/yr 4.51 5.13 Fixed Costs, 106 $/yr 2.04 1.37 Total Costs, 106 $/yr 6.55 6.50
Universal Heat Exchanger Network
The designs shown above address an energy efficient scheme for only two crudes. The conjecture is that it can also handle any crude of intermediate density. To test this conjecture, simulations of the entire system using an intermediate crude were performed. Minimum heating and cooling utilities for HRAT = 22.2 oC are 61.1 and 16.9 MW, respectively.

90
In order to test the ability of the network of Figure 4-16 to process this crude at maximum heat efficiency, the new model was run setting the integer variables corresponding to the matches to one. The desalter temperature was varied until a solution with the minimum energy consumption (61.1 and 16.9 MW, respectively) was obtained. However, the required area for some heat exchangers was higher than the one calculated before, especially below the desalter. Therefore, the conjecture that the design obtained can eventually handle an intermediate density crude at maximum energy efficiency (minimum utility) is confirmed only in relation to the network structure. Adjustments in the area of some heat exchangers are still needed. These adjustments amount to 7 additional shells corresponding to an additional 6210 m2 and 420,000 $/yr of additional fixed cost. Quite clearly, the medium crude has a higher residue stream than the light crude and sufficient duty in the pump-around circuits, so that all the structure prepared for the light crude above the desalter cannot handle the heat loads. A similar situation takes place below the desalter. A new conjecture emerges: If the model is used for the three crudes, the structure obtained would be able to accommodate the processing of crudes with densities in between. The possible outcomes are a) marginal increments of furnace heat duty if additional area is not added, or b) the same efficiency if additional area is added.
Removing Complexity
All designs shown so far proved that a high level of branching is needed to achieve energy efficiency. At the same time Table 4-17 proves that energy efficiency is not the driving force in the design of this system, as it is usually assumed. Indeed, Table 4-17 shows that roughly what is lost in energy efficiency is gained in capital cost reduction. In fact the total cost is roughly the same. It is therefore quite possible that further simplifications in the system, like reduced branching can have a similar effect, that is, just increase the cost slightly in exchange for its simplicity. We investigate the assumption next. Complete details can be found in Bagajewicz and Soto (2003).
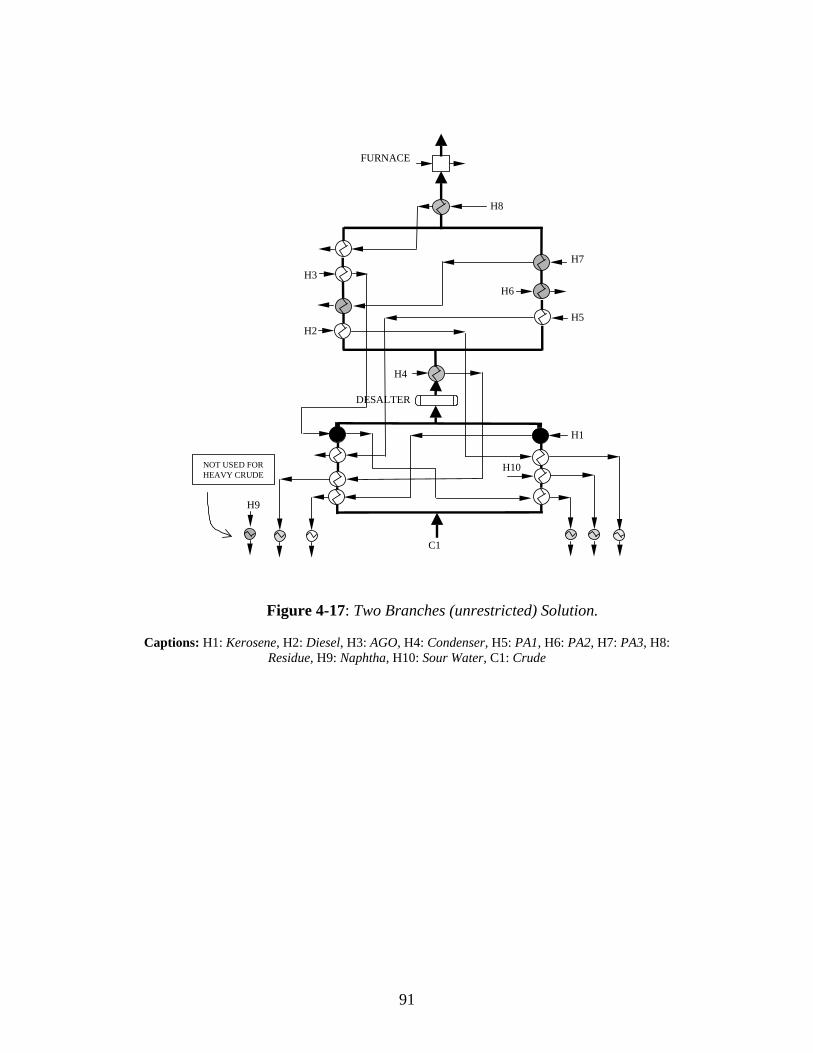
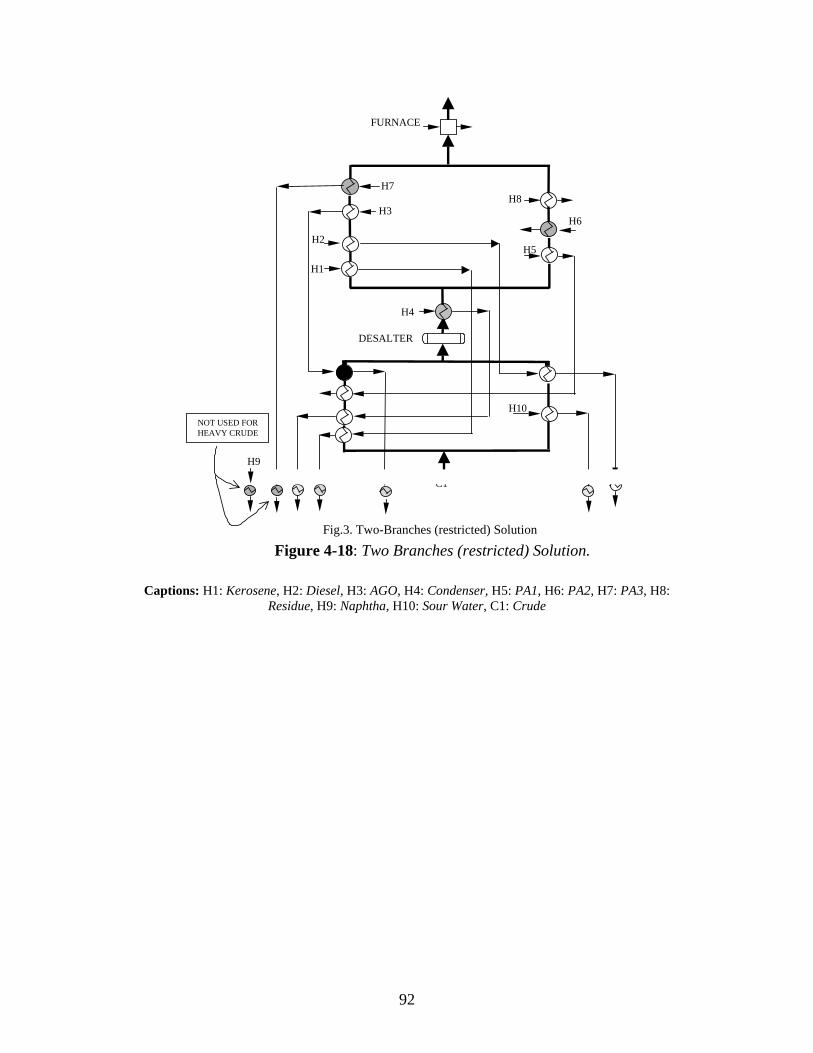
First, the design procedure was run restricting the design to have a maximum of two branches. The structure obtained uses 23 heat exchangers (Figure 4-17). Many of these heat exchangers are matches between hot streams and single or double branches in such a way that many hot streams use two heat exchangers above the desalter. This model contains too many heat exchangers and is still excessively complicated. Thus, the number of matches was restricted so that each hot stream matches only once above the desalter and once below it. In both cases the HRAT of 22.22 oC (40 oF) and an EMAT of 16.66 oC (30 oF) was used. Of these, only the EMAT is a constraint of importance in the model. Complexity pushes HRAT to higher values (larger energy consumption). The result is shown in figure 4-18. For comparison, the model was run restricting the solution to have one branch, obtaining the solution shown in figure 4-19. When noticing that this model rendered one cooler with a relatively small load cooling down the residue, the model was run again, forbidding this match. As expected, the energy consumption increased slightly for the light crude in what can be now considered for all practical purposes an alternative one-branch solution (Figure 4-20).
91
NOT USED FORHEAVY CRUDE
FURNACE
H7
H6
H10
H4
H2
C1
DESALTER
H3
H5
H8
H1
H9
Fig.2. Two-Branches (unrestricted) Solution
Figure 4-17: Two Branches (unrestricted) Solution.
Captions: H1: Kerosene, H2: Diesel, H3: AGO, H4: Condenser, H5: PA1, H6: PA2, H7: PA3, H8: Residue, H9: Naphtha, H10: Sour Water, C1: Crude
92
NOT USED FORHEAVY CRUDE
FURNACE
H8
H6
H7
H2
H10
H4
H1
C1
DESALTER
H9
H3
H5
Fig.3. Two-Branches (restricted) Solution Figure 4-18: Two Branches (restricted) Solution.
Captions: H1: Kerosene, H2: Diesel, H3: AGO, H4: Condenser, H5: PA1, H6: PA2, H7: PA3, H8: Residue, H9: Naphtha, H10: Sour Water, C1: Crude

93
Figure 4-19: One Branch Solution
Captions: H1: Kerosene, H2: Diesel, H3: AGO, H4: Condenser, H5: PA1, H6: PA2, H7: PA3, H8: Residue, H9: Naphtha, H10: Sour Water, C1: Crude
FURNACE
H8
H6
H7
H4
C1
DESALTER
H9
H3
H5
H1
H10
NOT USED FORHEAVY CRUDE
NOT USED FORLIGHT CRUDE
COOLING WATEREXCHANGER
H2

94
Figure 4-20: Alternative One Branch Solution
Captions: H1: Kerosene, H2: Diesel, H3: AGO, H4: Condenser, H5: PA1, H6: PA2, H7: PA3, H8: Residue, H9: Naphtha, H10: Sour Water, C1: Crude
The energy consumption of the light and heavy crudes, total number of exchangers for the different structures and annualized costs are shown in Table 4-18. In all the above solutions, no energy penalty was paid for a reduction of the number of heat exchangers. In other words, the models were run reducing the number of exchangers until a reduction triggered increased energy consumption, point at which the reduction was stopped.
The difference in energy expenditure between the unrestricted and restricted
structures is small. Thus, from the point of view of reduced complexity, and also cost, the restricted design should be adopted. In addition, the energy penalty for the simplicity obtained from the restricted case as compared with the optimal design is around 3.3 MW, a small value. Comparatively, the one branch solution has, as expected much higher
FURNACE
H8
H6
H7
H4
C1
DESALTER
H9
H3
H5
H1
H10
NOT USED FOR HEAVY CRUDE
NOT USED FOR LIGHT CRUDE
COOLING WATER
EXCHANGER
H2
H1: KEROSENE H2: DIESEL H3: ATM. GASOIL H4: CONDENSER H5: PUMP/A 1 H6: PUMP/A 2 H7: PUMP/A 3 H8: RESIDUE H9: NAPHTHA H10: SOUR WATER C1: CRUDE + WATER

95
energy consumption. However, it compensates with a smaller capital costs (less number of shells). The column on total costs should not be used to make conclusions, because the costs may not reflect the right energy to capital ratios. Rather, the operating costs should be analyzed comparatively.
Table 4-18. Comparison of Results
DESIGN Furnace Load
(Light /Heavy Crude) (MW)
Number of Units
Number of Shells
Operating Costs
(MM$/yr)
Fixed Costs (MM$
/yr)
Total Costs
(MM$/yr)
Optimal (Figure 4-11)
59.7 / 81.3 18 40 4.51 2.07 6.58
Two-Branches (Figure 4-17, unrestricted)
63.0 / 84.0 23 41 4.71 1.90 6.61
Two-Branches (Figure 4-18, restricted)
63.0 / 84.2 21 42 4.72 2.01 6.73
One Branch (Figure 4-19)
71.6 / 93.9 19 35 5.16 1.63 6.79
One Branch (Figure 4-20)
72.04 / 93.9 18 34 5.17 1.64 6.81
Plants with Vacuum Units This process was repeated for plants with vacuum units (Ji and Bagajewicz, 2002a,b). Table 5 compares the targeted furnace duty and the actual duty. Figure 4-21 shows the heat exchanger network. There are 9 exchangers (including the atmospheric furnace and the vacuum furnace) above the pre-flash drum, 13 exchangers below the pre-flash drum and 11 coolers, totaling 33 exchangers. In the light crude period, five exchangers are not used below the desalter. In the heavy crude period, three exchangers are idle above the desalter.
Table 4-19: Comparison of targeted furnace duty and actual furnace duty
Light crude Heavy crude Targeted furnace duty, MW 68.02 57.26 Actual furnace duty, MW 71.55 61.92
HRAT/EMAT=33.3 °C/22.2 °C
The total area for the two-branch design is 56576 m2 (Table 6). The total area for the HEN without restriction of splitting is 66988 m2. This estimate was obtained by simply calculating the area from the supply demand diagram and assuming vertical transfer. Therefore, the restriction of splitting reduces the total area by 15%. The observation is consistent with what was reported above.

96
H9
H3
ATMOSPHERICFURNACE
PREFLASHDRUM
H8
H5H12
H10
H4
H13
Not used forlight crude
Not used forheavy crude
VACUUMFURNACE
DESALTER
CRUDE OIL
H7
H11
H2
H1H6
COOLER
Figure 4-21: Two-branch Heat Exchanger Network. Complete Plant.

97
REFERENCES
1. Bagajewicz M. and J. Soto. Rigorous Procedure for the Design of Conventional Atmospheric Crude Fractionation Units Part II: Heat Exchanger Networks. Industrial and Engineering Chemistry Research. Vol. 40, No 2, pp. 627-634 (2001).
2. Bagajewicz M. and J. Soto. Rigorous Procedure for the Design of Conventional Atmospheric Crude Fractionation Units. Part III: Trade-Off between Complexity and Energy Savings. Industrial and Engineering Chemistry Research. 42, 6, pp. 1196-1203 (2003).
3. Bagajewicz M. and S. Ji. Rigorous Procedure for the Design of Conventional Atmospheric Crude Fractionation Units Part I: Targeting. Industrial and Engineering Chemistry Research. Vol. 40, No 2, pp. 617-626 (2001).
4. Bagajewicz M. and S. Ji. Rigorous Targeting Procedure for the Design of Crude Fractionation Units with Pre-Flashing or Pre-Fractionation. Industrial and Engineering Chemistry Research, 41, 12, pp. 3003-3011 (2002).
5. Ji S. and M. Bagajewicz. Design of Crude Distillation Plants with Vacuum Units. Part I: Targeting. Industrial and Engineering Chemistry Research. 41, 24, pp. 6094-6099 (2002a).
6. Ji S. and M. Bagajewicz. Design of Crude Distillation Plants with Vacuum Units. Part II: Heat Exchanger Network. Industrial and Engineering Chemistry Research. 41, 24, pp. 6100-6106 (2002b).
7. Ji S. and M. Bagajewicz. On the Energy Efficiency of Stripping-Type Crude Distillation. Industrial and Engineering Chemistry Research. 41, 23, pp. 5819-5825 (2002).
8. Papoulias S. and I. E. Grossmann. A Structural Optimization Approach in Process Synthesis-II: Heat Recovery Networks. Comput. Chem. Engng. 7, 707 (1983).
Recommended