ww.sciencedirect.com
wat e r r e s e a r c h 4 7 ( 2 0 1 3 ) 6 8 9 7e6 9 0 8
Available online at w
journal homepage: www.elsevier .com/locate/watres
Performance of human fecal anaerobe-associatedPCR-based assays in a multi-laboratory methodevaluation study
Blythe A. Layton a, Yiping Cao a, Darcy L. Ebentier b, Kaitlyn Hanley b,Elisenda Balleste c, Joao Brandao d, Muruleedhara Byappanahalli e,Reagan Converse f,g, Andreas H. Farnleitner h, Jennifer Gentry-Shields i,Maribeth L. Gidley j, Michele Gourmelon k, Chang Soo Lee l, Jiyoung Lee l,Solen Lozach k, Tania Madi m, Wim G. Meijer c, Rachel Noble f,Lindsay Peed n, Georg H. Reischer h, Raquel Rodrigues d, Joan B. Rose o,Alexander Schriewer p, Chris Sinigalliano q, Sangeetha Srinivasan o,Jill Stewart i, Laurie C. Van De Werfhorst r, Dan Wang s,Richard Whitman e, Stefan Wuertz p,t, Jenny Jay b, Patricia A. Holden r,Alexandria B. Boehm s, Orin Shanks n, John F. Griffith a,*a Southern California Coastal Water Research Project, 3535 Harbor Blvd Ste 110, Costa Mesa, CA 92626,
United Statesb UCLA Civil and Environmental Engineering, 5732H Boelter Hall, Los Angeles, CA 90095, United Statesc UCD School of Biomolecular and Biomedical Science, University College Dublin, Dublin 4, Irelandd Instituto Nacional de Saude, Dr. Ricardo Jorge, Avenida Padre Cruz, 1649-016 Lisboa, Portugale U.S. Geological Survey, Great Lakes Science Center, Lake Michigan Ecological Research Station,
1100 N. Mineral Springs Road, Porter, IN 46304, United Statesf UNC Chapel Hill Institute of Marine Sciences, 3431 Arendell Street, Morehead City, NC 28557, United Statesg Oak Ridge Institute for Science and Education, PO Box 117, Oak Ridge, TN 37831, United Statesh Environmental Microbiology and Molecular Ecology Group, Interuniversity Cooperation Centre for Water and
Health, Institute of Chemical Engineering, Vienna University of Technology, Gumpendorfer Strasse 1a/166-5-2,
A-1060 Vienna, Austriai Department of Environmental Sciences and Engineering, University of North Carolina, 135 Dauer Drive, Chapel Hill,
NC 27599-7431, United Statesj The Cooperative Institute for Marine and Atmospheric Studies, University of Miami, Miami, FL 33149, United Statesk Laboratoire de Microbiologie, MIC/LNR, Departement Ressources Biologiques et Environnement,
Unite Environnement, Microbiologie et Phycotoxines, Ifremer, ZI Pointe du diable, Plouzane, Francel College of Public Health, Division of Environmental Health Science, The Ohio State University, 406 Cunz Hall,
1841 Neil Avenue, Columbus, OH 43210, United Statesm Source Molecular Corporation, 4985 SW 74th Court, Miami, FL 33155, United Statesn U.S. Environmental Protection Agency, Office of Research and Development, National Risk Management Research
Laboratory, 26 West Martin Luther King Drive, Cincinnati, OH 45268, United Stateso Department of Fisheries and Wildlife, 13, Natural Resources, Michigan State University, East Lansing, MI 48824,
United Statesp Department of Civil & Environmental Engineering, University of California, Davis, One Shields Avenue, Davis,
CA 95616, United States
* Corresponding author. Tel.: þ1 714 755 3228.E-mail address: [email protected], [email protected]
0043-1354/$ e see front matter ª 2013 Elsevier Ltd. All rights reserved.http://dx.doi.org/10.1016/j.watres.2013.05.060
wat e r r e s e a r c h 4 7 ( 2 0 1 3 ) 6 8 9 7e6 9 0 86898
q National Oceanic and Atmospheric Administration, Atlantic Oceanographic and Meteorological Laboratory,
4301 Rickenbacker Causeway, Miami, FL 33149, United Statesr Earth Research Institute and Bren School of Environmental Science & Management, University of California,
Santa Barbara, CA 93106, United Statess Stanford University, Dept. of Civil & Environmental Engineering, 473 Via Ortega, Stanford, CA 94305, United
Statest Singapore Centre on Environmental Life Sciences Engineering (SCELSE), School of Biological Sciences SBS-B1N-27
and School of Civil and Environmental Engineering, Nanyang Technological University, 60 Nanyang Drive, Singapore
637551, Singapore
a r t i c l e i n f o
Article history:
Received 2 October 2012
Received in revised form
7 May 2013
Accepted 10 May 2013
Available online 5 July 2013
Keywords:
Microbial source tracking
qPCR
Water quality
Bacteroides
Bacteroidales
a b s t r a c t
A number of PCR-based methods for detecting human fecal material in environmental
waters have been developed over the past decade, but these methods have rarely received
independent comparative testing in large multi-laboratory studies. Here, we evaluated ten
of these methods (BacH, BacHum-UCD, Bacteroides thetaiotaomicron (BtH), BsteriF1, gyrB,
HF183 endpoint, HF183 SYBR, HF183 Taqman�, HumM2, and Methanobrevibacter smithii nifH
(Mnif)) using 64 blind samples prepared in one laboratory. The blind samples contained
either one or two fecal sources from human, wastewater or non-human sources. The assay
results were assessed for presence/absence of the human markers and also quantitatively
while varying the following: 1) classification of samples that were detected but not quan-
tifiable (DNQ) as positive or negative; 2) reference fecal sample concentration unit of
measure (such as culturable indicator bacteria, wet mass, total DNA, etc); and 3) human
fecal source type (stool, sewage or septage). Assay performance using presence/absence
metrics was found to depend on the classification of DNQ samples. The assays that per-
formed best quantitatively varied based on the fecal concentration unit of measure and
laboratory protocol. All methods were consistently more sensitive to human stools
compared to sewage or septage in both the presence/absence and quantitative analysis.
Overall, HF183 Taqman� was found to be the most effective marker of human fecal
contamination in this California-based study.
ª 2013 Elsevier Ltd. All rights reserved.
1. Introduction where the presence of human fecal pollution has been found
The search for highly specific, sensitive, and cost effective
human fecal-associated PCR-based assays has been a major
focus of microbial source tracking (MST) research over the last
decade. Many new methods have emerged as a result of that
effort (Field and Samadpour, 2007; Roslev and Bukh, 2011). It is
essential that MSTmethods be able to confirm the presence of
human fecal contamination in environmental waters because
of the ubiquity of fecal indicator bacteria (FIB) in non-human
sources, knowledge gaps regarding illness risk from recrea-
tional exposure to non-human fecal sources (Boehm and
Soller, 2011), and the need to prioritize investment in waste-
water infrastructure. Previously, library-based methods were
in common use, but these were largely supplanted by PCR-
based methods following a 2003 MST method evaluation
study (Griffith et al., 2003). Until now, a large-scale multiple-
laboratory MST method evaluation study has not been con-
ducted since PCR-based methods came to the fore.
The need for confidence in the performance of human
fecal-associated MST assays has recently become more ur-
gent. The United States Environmental Protection Agency’s
new criteria for recreational water quality offer beach man-
agers the possibility of using quantitative microbial risk
assessment (QMRA) to set site-specific criteria at beaches
sufficiently small through approved MST studies. Therefore it
is crucial to robustly characterize the performance of MST
methods that may be used to determine whether a beach is
contaminated with human fecal pollution.
The most comprehensive, multiple-laboratory PCR-based
MST method evaluation study to date is described in Boehm
et al. (2013). Several important issues from this study remain
open for further exploration in the present work. First, how
does alternate classification of detectable but not quantifiable
(DNQ) samplese as positive versus non-detecte change assay
performance in presence/absence metrics? DNQ data
handling often presents a trade-off between sensitivity and
specificity, and as there is currently no consensus in the field
regarding how to handle DNQ samples, it is important to
consider both approaches when judging assay performance.
Secondly, how did the assays perform, both qualitatively and
quantitatively, under all available challenge filter sample
units of measure? Characterization of challenge sample fecal
concentrations in different terms (such as 1mg of wet feces or
1 ng of total DNA) may produce variable performance results,
and every available characterization of the samples should be
considered in order to comprehensively compare perfor-
mance among assays. Third, how did the source of “target”
sample (human stools, sewage, or septage) influence assay

wat e r r e s e a r c h 4 7 ( 2 0 1 3 ) 6 8 9 7e6 9 0 8 6899
performance? Several factors may affect the performance
assessment of these targets, including different states of
decay and potential presence of non-human bacteria in
wastewater; thus, it is important to evaluate these “target”
sources separately. Lastly, how did the human-associated
assays perform with mixed-source samples? The
“doubleton” samples all contained a human stool, sewage, or
septage “target” source plus a non-human fecal source, and
thus offered the unique opportunity to investigate human-
associated assay sensitivity in the presence of non-target
feces.
The present work seeks to fill the above gaps by consid-
ering each of these issues in detail. Accordingly, the goals of
this paper are to evaluate the performance of ten human fecal
anaerobe-associated PCR-based assays under varying char-
acterizations of: 1) DNQ samples; 2) the challenge filter sample
concentration unit of measure; and 3) the human “target”
samples; and to evaluate the effect of combining human and
non-human fecal sources in a sample.
2. Methods
2.1. Sample creation and analysis
Briefly, 64 blind challenge samples were created by mixing
fresh feces (from chicken, cow, dog, deer, goose, gull, horse,
human, pig, or pigeon), sewage, or septage in artificial fresh-
water. All fecal, sewage and septage samples were obtained
from various sites across California. The filter set included 19
single-source (“singleton”) and 13 mixed-source (“doubleton”)
samples in duplicate. Each doubleton sample contained
human stools, septage, or sewage combined with one non-
human fecal source. Detailed methods for the creation of
the challenge filter samples can be found in Boehm et al.
(2013).
Seventeen laboratories from the United States and the
European Union contributed data to the study. The assay
naming conventions used here generally follow the original
publications (Table 1). The number of laboratories that per-
formed each method is as follows: BacH (1), BacHum-UCD (6),
BsteriF1 (4), BtH (1), gyrB (1), HF183 endpoint (7), HF183 SYBR
(4), HF183 Taqman� (5), HumM2 (6), and Mnif (5). The labora-
tories used six different DNA extraction methods: GeneRite
DNA-EZ (12), Qiagen DNeasy� (1), Qiagen QIAamp� (1), MP
Biomedicals FastDNA� SPIN (1), MoBio PowerWater� (1), and
phenol:chloroform extraction (1). Five laboratories involved in
planning the study agreed to standardize their methods of
DNA extraction (GeneRite DNA-EZ ST) and quantification
(NanoDrop), q/PCR chemistries (Applied Biosystems TaqMan�
Universal PCR Master Mix or TaKaRa Ex Taq� with original
authors’ primer/probe concentrations), and data processing
(described in detail in Ebentier et al. 2013). These standardized
operating protocols (SOPs) were made available to all partici-
pating laboratories, but adherence to the protocols was not
required. Details of the laboratory SOPs and supply vendors
are provided in the Supplemental Information (Section 1 and
Tables S1eS2). All data analyses in the present work were
performed in R (v 2.14.0) with RStudio (v 0.96). Details of each
analysis are described below.
2.2. Classification of DNQ
The presence/absence sensitivity and specificity metrics were
calculated in two ways: once with DNQ (detected, not quan-
tifiable) samples considered positive and a second time with
DNQ considered negative. All laboratories’ datawere analyzed
together as one dataset and only the singleton (single-source)
samples were included (every doubleton contained both a
human and non-human fecal source, so it was not possible to
independently evaluate sensitivity and specificity in the
doubletons). All positive results for the endpoint assay were
considered DNQ. The lower limit of quantification (LLOQ) for
qPCR assays was defined for each laboratory as the lowest
concentration on the standard curve where amplification was
observed in at least 50% of qPCR replicates. The LLOQ values
for each laboratory and assay are listed in Table S3. For sam-
ples within the range of quantification, the reported copy
numbers were used. Samples with a quantification threshold
cycle (Cq) greater than the laboratory-specific LLOQ were
classified as DNQ regardless of how these samples were
originally reported. DNQ samples were assigned a value of 150
copies/filter for quantitative analyses. This value was based
on three assumptions: 1) a theoretical minimum detection
limit of 3 copies per reaction (Bustin et al., 2009); 2) 2 ml tem-
plate total DNA per reaction; and 3) 100 ml of DNA extract per
filter. Assumptions 2 and 3 were valid for most laboratories
and assays. Sensitivity and specificity metrics were calculated
using the same equations and benchmarks described by
Boehm et al. (2013).
2.3. Challenge filter sample units of measure
The following units of measure were used to normalize the
singleton qPCR data: wet mass, total DNA, Enterococcus CFU,
Escherichia coli CFU, Enterococcus qPCR (Haugland et al., 2005), E.
coli 23S qPCR (Chern et al., 2011), and “general” Bacteroidales
qPCR by GenBac3 (Siefring et al., 2008), AllBac (Layton et al.,
2006), BacUni-UCD (Kildare et al., 2007), B. fragilis group
(Matsuki et al., 2002), and fecal Bacteroides (Converse et al., 2009).
The fecal source characterizations presented in Ervin et al.
(2013) were used for wet mass, Enterococcus CFU, E. coli CFU,
and E. coli 23S qPCR. Total DNA mass data were obtained from
the laboratories: a majority (13 of 17) measured total DNA
concentrations on each filter with a NanoDrop spectropho-
tometer. When values for total DNA yield were reported as
negative, “too low” or some other indication of data below the
detection limit, a value of 1 ng/filter was substituted. Paired
measurements (of human assay targets and DNA mass) per
filter were used to normalize the data. Some laboratories
measured and reported “general” qPCR assay characterizations
of the samples, including Entero1A (5), GenBac3 (3), AllBac (1),
BacUni-UCD (1), B. fragilis group (1) and fecal Bacteroides (1). The
general assay data were used to normalize the human-
associated qPCR data from those laboratories using paired
measurements (of human and general assay targets) per filter.
For each of the above units of measure, the assay with the
highest gene copy abundance among target samples (human
stools, sewage and septage taken together) was considered the
most sensitive, and the assay with the largest difference in
median gene copy abundance between target and non-target
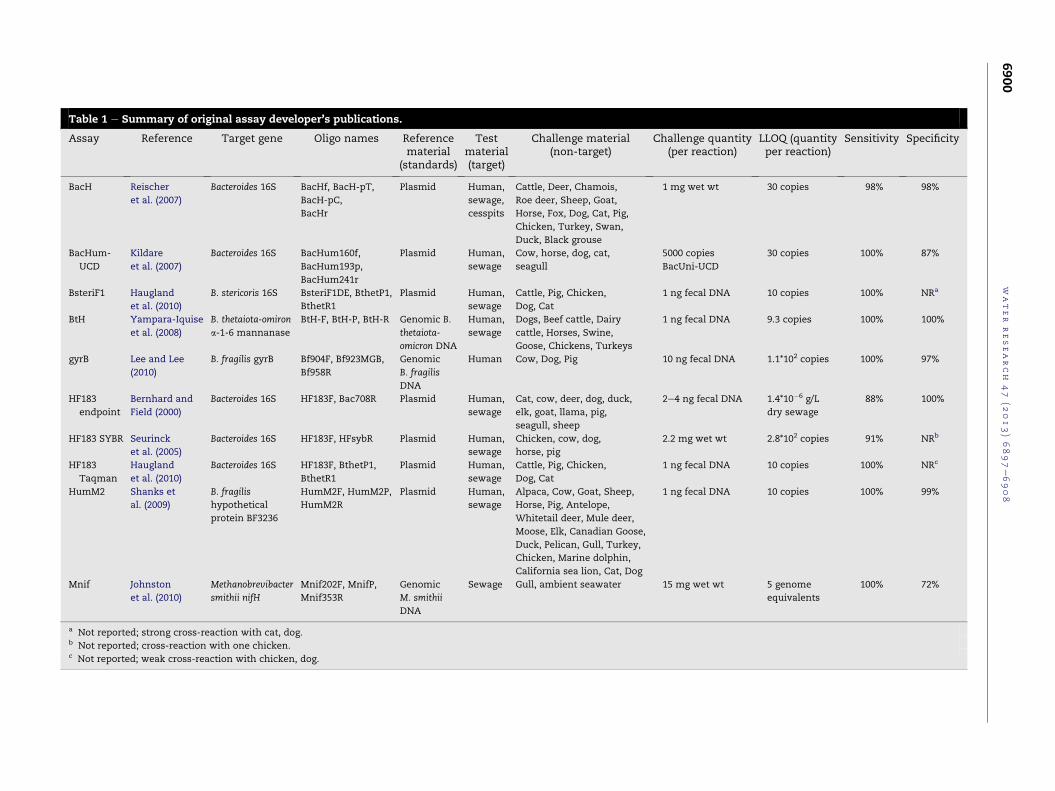
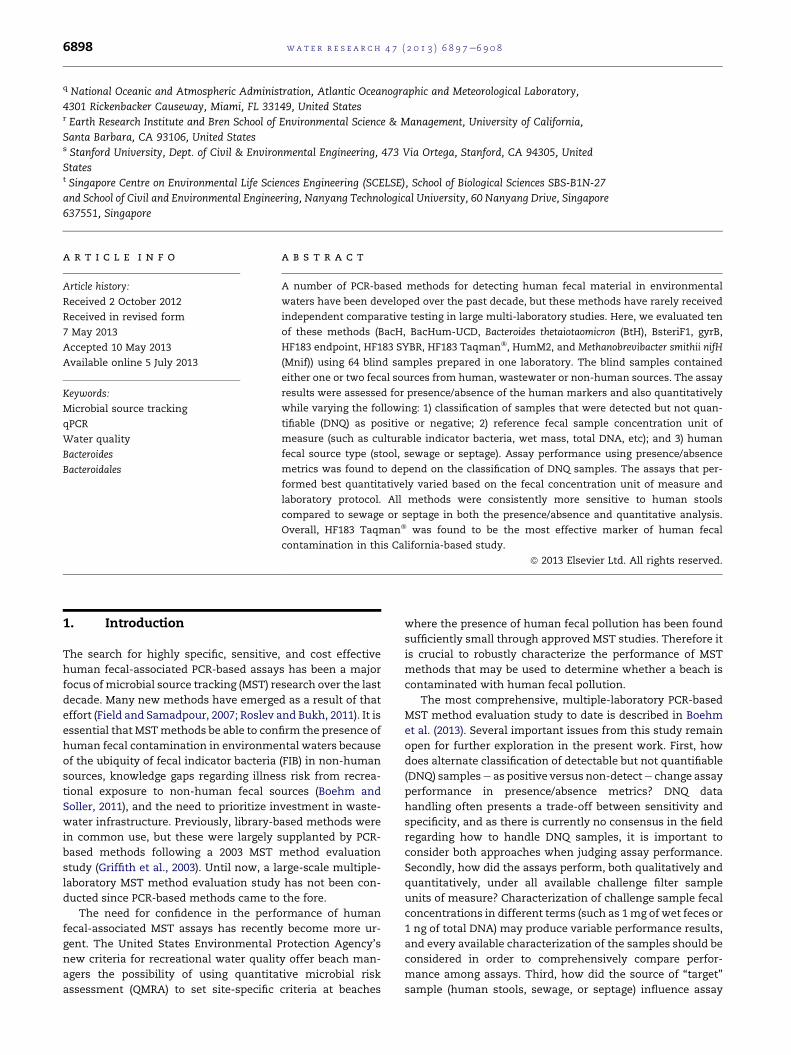
Table 1 e Summary of original assay developer’s publications.
Assay Reference Target gene Oligo names Referencematerial
(standards)
Testmaterial(target)
Challenge material(non-target)
Challenge quantity(per reaction)
LLOQ (quantityper reaction)
Sensitivity Specificity
BacH Reischer
et al. (2007)
Bacteroides 16S BacHf, BacH-pT,
BacH-pC,
BacHr
Plasmid Human,
sewage,
cesspits
Cattle, Deer, Chamois,
Roe deer, Sheep, Goat,
Horse, Fox, Dog, Cat, Pig,
Chicken, Turkey, Swan,
Duck, Black grouse
1 mg wet wt 30 copies 98% 98%
BacHum-
UCD
Kildare
et al. (2007)
Bacteroides 16S BacHum160f,
BacHum193p,
BacHum241r
Plasmid Human,
sewage
Cow, horse, dog, cat,
seagull
5000 copies
BacUni-UCD
30 copies 100% 87%
BsteriF1 Haugland
et al. (2010)
B. stericoris 16S BsteriF1DE, BthetP1,
BthetR1
Plasmid Human,
sewage
Cattle, Pig, Chicken,
Dog, Cat
1 ng fecal DNA 10 copies 100% NRa
BtH Yampara-Iquise
et al. (2008)
B. thetaiota-omiron
a-1-6 mannanase
BtH-F, BtH-P, BtH-R Genomic B.
thetaiota-
omicron DNA
Human,
sewage
Dogs, Beef cattle, Dairy
cattle, Horses, Swine,
Goose, Chickens, Turkeys
1 ng fecal DNA 9.3 copies 100% 100%
gyrB Lee and Lee
(2010)
B. fragilis gyrB Bf904F, Bf923MGB,
Bf958R
Genomic
B. fragilis
DNA
Human Cow, Dog, Pig 10 ng fecal DNA 1.1*102 copies 100% 97%
HF183
endpoint
Bernhard and
Field (2000)
Bacteroides 16S HF183F, Bac708R Plasmid Human,
sewage
Cat, cow, deer, dog, duck,
elk, goat, llama, pig,
seagull, sheep
2e4 ng fecal DNA 1.4*10�6 g/L
dry sewage
88% 100%
HF183 SYBR Seurinck
et al. (2005)
Bacteroides 16S HF183F, HFsybR Plasmid Human,
sewage
Chicken, cow, dog,
horse, pig
2.2 mg wet wt 2.8*102 copies 91% NRb
HF183
Taqman
Haugland
et al. (2010)
Bacteroides 16S HF183F, BthetP1,
BthetR1
Plasmid Human,
sewage
Cattle, Pig, Chicken,
Dog, Cat
1 ng fecal DNA 10 copies 100% NRc
HumM2 Shanks et
al. (2009)
B. fragilis
hypothetical
protein BF3236
HumM2F, HumM2P,
HumM2R
Plasmid Human,
sewage
Alpaca, Cow, Goat, Sheep,
Horse, Pig, Antelope,
Whitetail deer, Mule deer,
Moose, Elk, Canadian Goose,
Duck, Pelican, Gull, Turkey,
Chicken, Marine dolphin,
California sea lion, Cat, Dog
1 ng fecal DNA 10 copies 100% 99%
Mnif Johnston
et al. (2010)
Methanobrevibacter
smithii nifH
Mnif202F, MnifP,
Mnif353R
Genomic
M. smithii
DNA
Sewage Gull, ambient seawater 15 mg wet wt 5 genome
equivalents
100% 72%
a Not reported; strong cross-reaction with cat, dog.b Not reported; cross-reaction with one chicken.c Not reported; weak cross-reaction with chicken, dog.
water
research
47
(2013)6897e6908
6900

Table 2 e Performance of human-associated assays insingleton samples among all labs, calculated with DNQ(detected, not quantifiable) samples as positive ornegative, with presence/absence determined on a per-filter basis.
Assay Sensitivity Specificity
Humanna
DNQþ DNQ� Non-human na
DNQþ DNQe
BacH 12 100% 75% 26 77% 85%
BacHum-
UCD
72 97% 97% 156 37% 67%
BsteriF1 48 100% 96% 104 44% 61%
BtH 12 100% 92% 26 54% 96%
gyrB 12 92% 50% 26 58% 96%
HF183
endpoint
84 75% NA 182 96% NA
HF183
SYBR
48 100% 92% 104 78% 89%
HF183
Taqman
60 100% 95% 130 46% 92%
HumM2 72 93% 67% 156 75% 94%
Mnif 60 78% 60% 130 68% 76%
a Values for n vary among assays because the methods were per-
formed by different numbers of laboratories; see Section 2.1.
wat e r r e s e a r c h 4 7 ( 2 0 1 3 ) 6 8 9 7e6 9 0 8 6901
samples was considered themost specific. Note that these per-
formance metrics differ from those used in Boehm et al. (2013).
Because performance outcomes can change under
different characterizations of fecal concentration, it was
necessary to select a primary unit of measure by which to
judge quantitative assay performance. We chose to focus on
total DNA mass on each challenge filter as measured by
NanoDrop spectrophotometry. We defined quantitative
benchmarks for sensitivity and specificity based on copies per
nanogram of total DNA: an assay was quantitatively sensitive
if themedian abundance in every target source (human stools,
sewage and septage considered separately) was greater than
10 copies/ng, and an assay was quantitatively specific if the
interquartile ranges of copies/ng did not overlap between
target and non-target sources.
To study the effect of challenge filter sample units of
measure on the presence/absence performance metrics, we
chose a balanced subset of the data and performed an in silico
dilution experiment. This subset consisted of assays run by
the method developer’s laboratory (BacH, BacHum-UCD,
BsteriF1, gyrB, HumM2, HF183 Taqman and Mnif). In this
subset, the assays were performed under optimal conditions
(in the hands of their developer’s lab) and the n for all assays
was the same. Presence/absence method performance in this
subset was evaluated using the same challenge filter sample
units of measure that the method developers used when the
assays were first published (Table 1). This was done by in silico
dilution or addition of the appropriate amount of fecal mate-
rial and calculating what the copy numbers would have been
based on the observed amplification with the actual challenge
filter samples. For this exercise, a limit of detection (LOD) of 10
copies per reaction was applied: amplification below this level
was considered negative and anything above 10 copies was
considered positive.
2.4. Doubleton analyses
To determine the effect of mixed fecal sources on assay per-
formance, sensitivity was evaluated in the doubleton samples
with respect to the non-human source present and the esti-
mated relative contributions of total DNA from each source.
The proportion of total DNA contribution from each fecal
source was estimated using a mass ratio approach. The me-
dian NanoDropmeasurements on the singleton samples were
multiplied by the volumetric proportions used to create the
doubleton samples (see Boehm et al. (2013) for sample crea-
tion details), and the ratio of target:non-target DNA on each
doubleton filter was estimated from those values. Presence/
absence sensitivity (with DNQ values considered positive) was
calculated for every assay according to doubleton type and
compared to the target:non-target DNA ratios.
3. Results
3.1. Performance by DNQ classification
None of the assays met the 80% benchmark used by Boehm
et al. (2013) and the USEPA (2005) for both specificity and
sensitivity when DNQ was considered positive (Table 2). With
DNQ negative, BtH, HF183 SYBR and HF183 Taqman met the
benchmark for both sensitivity and specificity metrics. Assay
sensitivity was high but specificity was low when DNQ results
were regarded as positive. All assays except HF183 endpoint
and Mnif were at least 80% sensitive with DNQ positive. The
only assay that was at least 80% specificwith DNQ positivewas
HF183 endpoint; however, HF183 SYBR, BacH and HumM2were
not appreciably behind the mark at 78%, 77% and 75%,
respectively. When DNQ was negative, sensitivity decreased in
all assays except BacHum-UCD, and all assays were considered
specific except BacHum-UCD, BsteriF1 and Mnif. Note that the
results presented in Table 2 use a “per filter” characterization of
presence/absence in the challenge filter samples and consider
all laboratories’ data together as one dataset.
3.2. Performance by challenge filter sample unit ofmeasure
The presence/absence specificities of HF183 Taqman and
BacHum-UCD under their developer’s challenge filter sample
units of measure were starkly different from the “per filter”
specificity results (both 96% in developers’ lab versus 46% and
37% across all labs, respectively, DNQ positive). In general, the
assays performed well with their developers’ execution and
test sample quantities (Table 3). However, in our study the
assays often performed worse than reported in their original
publications (Table 1), except for BacHum-UCD under its
original challenge sample units of measure (Table 3). Inter-
estingly, BacHum-UCD was the only assay that showed
excellent sensitivity using the units of 5000 copies of BacUni-
UCD per reaction, which was the benchmark used to develop
the BacHum-UCD assay (Kildare et al., 2007).
When the challenge filter samples were characterized by
total DNA mass and all laboratories’ data were analyzed
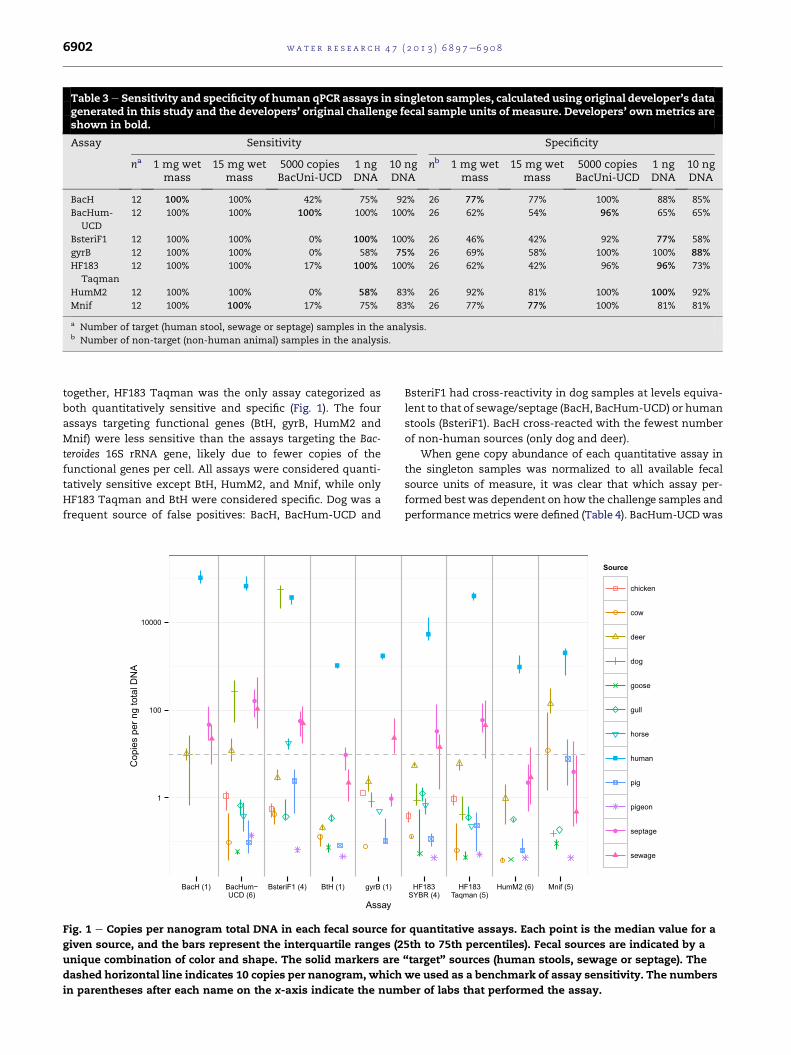
Table 3e Sensitivity and specificity of human qPCR assays in singleton samples, calculated using original developer’s datagenerated in this study and the developers’ original challenge fecal sample units of measure. Developers’ ownmetrics areshown in bold.
Assay Sensitivity Specificity
na 1 mg wetmass
15 mg wetmass
5000 copiesBacUni-UCD
1 ngDNA
10 ngDNA
nb 1 mg wetmass
15 mg wetmass
5000 copiesBacUni-UCD
1 ngDNA
10 ngDNA
BacH 12 100% 100% 42% 75% 92% 26 77% 77% 100% 88% 85%
BacHum-
UCD
12 100% 100% 100% 100% 100% 26 62% 54% 96% 65% 65%
BsteriF1 12 100% 100% 0% 100% 100% 26 46% 42% 92% 77% 58%
gyrB 12 100% 100% 0% 58% 75% 26 69% 58% 100% 100% 88%
HF183
Taqman
12 100% 100% 17% 100% 100% 26 62% 42% 96% 96% 73%
HumM2 12 100% 100% 0% 58% 83% 26 92% 81% 100% 100% 92%
Mnif 12 100% 100% 17% 75% 83% 26 77% 77% 100% 81% 81%
a Number of target (human stool, sewage or septage) samples in the analysis.b Number of non-target (non-human animal) samples in the analysis.
wat e r r e s e a r c h 4 7 ( 2 0 1 3 ) 6 8 9 7e6 9 0 86902
together, HF183 Taqman was the only assay categorized as
both quantitatively sensitive and specific (Fig. 1). The four
assays targeting functional genes (BtH, gyrB, HumM2 and
Mnif) were less sensitive than the assays targeting the Bac-
teroides 16S rRNA gene, likely due to fewer copies of the
functional genes per cell. All assays were considered quanti-
tatively sensitive except BtH, HumM2, and Mnif, while only
HF183 Taqman and BtH were considered specific. Dog was a
frequent source of false positives: BacH, BacHum-UCD and
1
100
10000
BacH (1) BacHum−UCD (6)
BsteriF1 (4) BtH (1) gyrB (1)
Assay
Cop
ies
per n
g to
tal D
NA
Fig. 1 e Copies per nanogram total DNA in each fecal source fo
given source, and the bars represent the interquartile ranges (2
unique combination of color and shape. The solid markers are
dashed horizontal line indicates 10 copies per nanogram, which
in parentheses after each name on the x-axis indicate the num
BsteriF1 had cross-reactivity in dog samples at levels equiva-
lent to that of sewage/septage (BacH, BacHum-UCD) or human
stools (BsteriF1). BacH cross-reacted with the fewest number
of non-human sources (only dog and deer).
When gene copy abundance of each quantitative assay in
the singleton samples was normalized to all available fecal
source units of measure, it was clear that which assay per-
formed best was dependent on how the challenge samples and
performancemetrics were defined (Table 4). BacHum-UCDwas
HF183SYBR (4)
HF183Taqman (5)
HumM2 (6) Mnif (5)
Source
chicken
cow
deer
dog
goose
gull
horse
human
pig
pigeon
septage
sewage
r quantitative assays. Each point is the median value for a
5th to 75th percentiles). Fecal sources are indicated by a
“target” sources (human stools, sewage or septage). The
we used as a benchmark of assay sensitivity. The numbers
ber of labs that performed the assay.
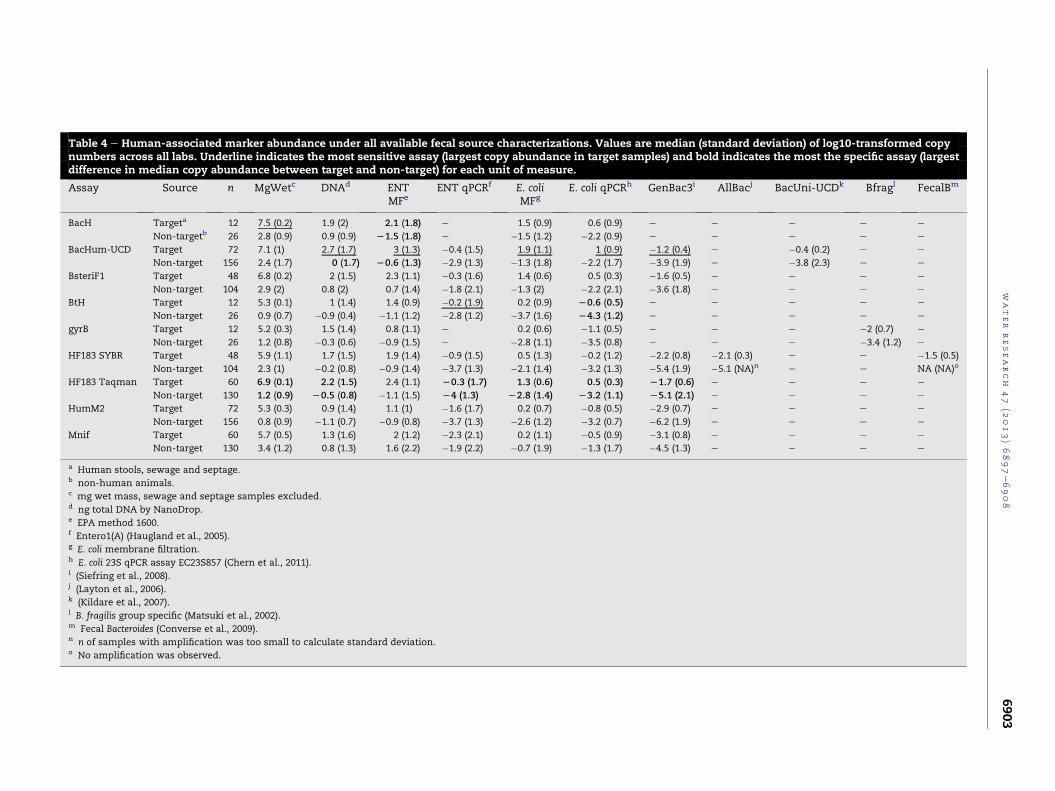
Table 4 e Human-associated marker abundance under all available fecal source characterizations. Values are median (stan rd deviation) of log10-transformed copynumbers across all labs. Underline indicates the most sensitive assay (largest copy abundance in target samples) and bold i icates the most the specific assay (largestdifference in median copy abundance between target and non-target) for each unit of measure.
Assay Source n MgWetc DNAd ENTMFe
ENT qPCRf E. coliMFg
E. coli qPCRh GenBac3i A acj BacUni-UCDk Bfragl FecalBm
BacH Targeta 12 7.5 (0.2) 1.9 (2) 2.1 (1.8) e 1.5 (0.9) 0.6 (0.9) e e e e e
Non-targetb 26 2.8 (0.9) 0.9 (0.9) L1.5 (1.8) e �1.5 (1.2) �2.2 (0.9) e e e e e
BacHum-UCD Target 72 7.1 (1) 2.7 (1.7) 3 (1.3) �0.4 (1.5) 1.9 (1.1) 1 (0.9) �1.2 (0.4) e �0.4 (0.2) e e
Non-target 156 2.4 (1.7) 0 (1.7) L0.6 (1.3) �2.9 (1.3) �1.3 (1.8) �2.2 (1.7) �3.9 (1.9) e �3.8 (2.3) e e
BsteriF1 Target 48 6.8 (0.2) 2 (1.5) 2.3 (1.1) �0.3 (1.6) 1.4 (0.6) 0.5 (0.3) �1.6 (0.5) e e e e
Non-target 104 2.9 (2) 0.8 (2) 0.7 (1.4) �1.8 (2.1) �1.3 (2) �2.2 (2.1) �3.6 (1.8) e e e e
BtH Target 12 5.3 (0.1) 1 (1.4) 1.4 (0.9) �0.2 (1.9) 0.2 (0.9) L0.6 (0.5) e e e e e
Non-target 26 0.9 (0.7) �0.9 (0.4) �1.1 (1.2) �2.8 (1.2) �3.7 (1.6) L4.3 (1.2) e e e e e
gyrB Target 12 5.2 (0.3) 1.5 (1.4) 0.8 (1.1) e 0.2 (0.6) �1.1 (0.5) e e e �2 (0.7) e
Non-target 26 1.2 (0.8) �0.3 (0.6) �0.9 (1.5) e �2.8 (1.1) �3.5 (0.8) e e e �3.4 (1.2) e
HF183 SYBR Target 48 5.9 (1.1) 1.7 (1.5) 1.9 (1.4) �0.9 (1.5) 0.5 (1.3) �0.2 (1.2) �2.2 (0.8) �2. (0.3) e e �1.5 (0.5)
Non-target 104 2.3 (1) �0.2 (0.8) �0.9 (1.4) �3.7 (1.3) �2.1 (1.4) �3.2 (1.3) �5.4 (1.9) �5. (NA)n e e NA (NA)o
HF183 Taqman Target 60 6.9 (0.1) 2.2 (1.5) 2.4 (1.1) L0.3 (1.7) 1.3 (0.6) 0.5 (0.3) L1.7 (0.6) e e e e
Non-target 130 1.2 (0.9) L0.5 (0.8) �1.1 (1.5) L4 (1.3) L2.8 (1.4) L3.2 (1.1) L5.1 (2.1) e e e e
HumM2 Target 72 5.3 (0.3) 0.9 (1.4) 1.1 (1) �1.6 (1.7) 0.2 (0.7) �0.8 (0.5) �2.9 (0.7) e e e e
Non-target 156 0.8 (0.9) �1.1 (0.7) �0.9 (0.8) �3.7 (1.3) �2.6 (1.2) �3.2 (0.7) �6.2 (1.9) e e e e
Mnif Target 60 5.7 (0.5) 1.3 (1.6) 2 (1.2) �2.3 (2.1) 0.2 (1.1) �0.5 (0.9) �3.1 (0.8) e e e e
Non-target 130 3.4 (1.2) 0.8 (1.3) 1.6 (2.2) �1.9 (2.2) �0.7 (1.9) �1.3 (1.7) �4.5 (1.3) e e e e
a Human stools, sewage and septage.b non-human animals.c mg wet mass, sewage and septage samples excluded.d ng total DNA by NanoDrop.e EPA method 1600.f Entero1(A) (Haugland et al., 2005).g E. coli membrane filtration.h E. coli 23S qPCR assay EC23S857 (Chern et al., 2011).i (Siefring et al., 2008).j (Layton et al., 2006).k (Kildare et al., 2007).l B. fragilis group specific (Matsuki et al., 2002).m Fecal Bacteroides (Converse et al., 2009).n n of samples with amplification was too small to calculate standard deviation.o No amplification was observed.
water
research
47
(2013)6897e6908
6903
dand
llB
1
1

Table 5 e Sensitivity of human-associated assays insingleton human, sewage and septage samplescalculatedwith detected, not quantifiable (DNQ) values aspositive or negative on a per-filter basis.
Assay na Human Sewage Septage
DNQþ DNQe DNQþ DNQe DNQþ DNQe
BacH 4 100% 100% 100% 50% 100% 75%
BacHum-
UCD
24 100% 100% 92% 92% 100% 100%
BsteriF1 16 100% 100% 100% 88% 100% 100%
BtH 4 100% 100% 100% 75% 100% 100%
gyrB 4 100% 100% 100% 50% 75% 0%
HF183
endpoint
28 96% NA 57% NA 71% NA
HF183 SYBR 16 100% 100% 100% 81% 100% 94%
HF183
Taqman
20 100% 100% 100% 85% 100% 100%
HumM2 24 100% 100% 83% 46% 96% 54%
Mnif 20 95% 95% 55% 20% 85% 65%
a Number of singleton samples in each target source (varies by
number of laboratories running each assay).
human
septage
sewage
0.2
0.4
0.6
0.8
1.0
0.2
0.4
0.6
0.8
1.0
0.2
0.4
0.6
0.8
1.0
0.01 0.1 1
Estimated target:nontarget
Sens
itivi
ty
Fig. 2 e Presence/absence per-filter sensitivity (DNQ positive) in
ratio. The three target sources present in the doubletons are org
indicates the non-target source in the doubleton, and the assays
the number of measurements that were used to calculate the sen
horizontal positions of the points were “jittered” to make more
sensitivity of any assay in the target singletons (DNQ positive).
wat e r r e s e a r c h 4 7 ( 2 0 1 3 ) 6 8 9 7e6 9 0 86904
the most sensitive assay using the total DNA mass, E. coli CFU,
E. coli qPCR and GenBac3 measurements. BtH was the most
sensitive assay using the Enterococcus qPCR copy units, but was
less sensitive in other quantitative measures. BacH was the
most sensitive assay only under the wet mass unit of measure,
which was the same fecal unit used to develop that assay.
HF183 Taqman was the most specific assay in six of the seven
units of measure where it was possible to make a comparison:
milligrams of wet feces, mass of total DNA, E. coli CFU, E. coli
qPCR, Enterococcus qPCR, and GenBac3. The only fecal source
characterization for which HF183 Taqman was not the most
specific assay was Enterococcus CFU, where BacHum-UCD
excelled.
3.3. Performance by target source
The sensitivity of each assay differed for each of the three
“target” sources: human stools, sewage and septage. In almost
every case, sensitivity was greatest in human stools, followed
by septage, and least sensitive in sewage samples (the
exception was gyrB, which had greater sensitivity in sewage
10 100
DNA ratio
Assay
BacH
BacHum−UCD
BsteriF1
BtH
gyrB
HF183 endpoint
HF183 SYBR
HF183 Taqman
HumM2
Mnif
Nontarget
chicken
cow
dog
goose
gull
horse
pig
n
2
8
14
doubletons versus the estimated target:non-target DNA
anized into the horizontal panels. The shape of each point
are differentiated by colors. The size of each point indicates
sitivity value for that point, which ranged from 2 to 14. The
of the data visible. The dashed lines represent the lowest

wat e r r e s e a r c h 4 7 ( 2 0 1 3 ) 6 8 9 7e6 9 0 8 6905
than septage; Table 5). The presence/absence metrics were
also greatly dependent on DNQ classification. With DNQ
positive, five assays were perfectly sensitive (100%) to all three
target sources: BacH, BsteriF1, BtH, HF183 SYBR and HF183
Taqman. No assay was 100% sensitive to all three targets with
DNQ negative, though BacHum-UCD, BsteriF1, HF183 SYBR
and HF183 Taqman met the 80% benchmark. In quantitative
terms, every assay was orders of magnitude more sensitive
(by copies per nanogram of total DNA) to human stools than to
septage or sewage (Fig. 1). BacH was the most sensitive of all
assays to human stools, and BacHum-UCDwasmost sensitive
of all assays to sewage and septage.
3.4. Performance in doubleton samples
In the doubletons containing sewage, a decrease in
target:non-target DNA ratio appeared to decrease sensitivity
in the samples containing gull feces (bottompanel, Fig. 2). This
change was especially noticeable for Mnif, HumM2, gyrB and
HF183 SYBR. Sensitivity was also low in the chicken/sewage
samples for Mnif and HF183 endpoint. For the doubleton
samples containing human stools (top panel), sensitivity
remained consistently high; only HF183 endpoint showed a
slight decrease in sensitivity at lower target:non-target DNA
ratios. The doubletons containing septage consisted of only
one sample type: 10% septage:90% horse. For these samples,
all assays were considered sensitive except Mnif.
4. Discussion
4.1. DNQ classification
The classification of DNQ samples as positive or negative
dramatically affected the performance of the assays in pres-
ence/absence metrics, and this has important implications for
local beach management applications. Changing the DNQ
classification from positive to negative decreased sensitivity
slightly but improved specificity substantially for all assays
(Table 2). The assays that were judged as acceptably sensitive
or specific with the presence/absence metrics differed slightly
from Boehm et al. (2013) because here we considered only
singletons and pooled all labs’ data together. However, variable
performance was observed among laboratories and this vari-
abilitymay skew the overall DNQ classification results (Fig. S1).
The variable results among laboratories may be a product of
the different LLOQvalues obtained by using different types and
quantities of standard reference material, Cq threshold set-
tings, and other variations in method protocols.
The treatment of DNQ samples in the MST literature is
mixed. For example, some studies have definedDNQ values as
negative (Stapleton et al., 2009), while others have regarded
DNQ amplification as a positive detection (Kelty et al., 2012);
still others established a lower limit of detection for the qPCR
but did not differentiate between LLOQ and LOD (Sauer et al.,
2011). For SYBR assays, most groups consider DNQ samples
negative, due to the difficulty in validating melt curves for
such low amplification. Information on DNQ handling is often
not reported at all. To our knowledge, this work and the other
manuscripts from the present study (Raith et al., 2013;
Sinigalliano et al., 2013) are the first to comprehensively
examine the effects of varying DNQ classification on MST
assay performance.
In our analysis, we found that assay specificity was supe-
rior when DNQ results were treated as negative. One possible
explanation is that most human-associated genetic markers
are not strictly found in human sources; instead, they are
typically found at a higher abundance in human sources
(Shanks et al., 2010). Thus, the more sensitive the method is,
themore likely it is that cross-reactivitywill be observed in the
DNQ range. In environmental samples, DNQ measurements
may result from dilution or degradation of a human fecal
source or from cross-reactivity. Experts in the field have not
yet reached consensus regarding how to classify DNQ results
obtained in MST field studies (Stewart et al., 2013). In practice,
it may be beneficial to perform both a human bacteria-
associated assay (highly sensitive, less specific) and a
human viral assay (highly specific, less sensitive); however,
the optimal method for concentrating human viruses from
environmental water samples is yet to be determined (see
Harwood et al., 2013).
4.2. Challenge filter sample units of measure
The amount of fecal matter on a filter can be described using
several units of measure, and we found that changing the
challenge filter sample units of measure can change which
assays performed best. The relative quantities of fecal mate-
rial in our challenge filter samples changed considerably
among fecal sources when different units of measure were
used to describe fecal concentrations. For example, one fecal
source may have low Enterococcus levels, but a high wet mass
compared to another source (Ervin et al. 2013). Accordingly,
the assay that performed best on a “per unit” basis depended
on which unit of measure was used. Data from all labs were
used in this analysis, even though there were differing sizes of
datasets and clear lab-to-lab variation (see Section 4.6), and
our results should be interpreted with those factors in mind.
To our knowledge, the present work and other manuscripts
from this study (Boehm et al., 2013; Raith et al., 2013;
Sinigalliano et al., 2013) are the first to examine the effects
of changing fecal units of measure on the performance out-
comes of molecular MST methods.
We focused on total DNA mass as the primary challenge
filter sample unit of measure. The amount of fecal matter
varied substantially from filter to filter, both within a given
fecal sourceandacross sources (Ervinet al., 2013), yet itwasnot
possible to directly quantify the fecalmaterial on each filter for
every unit of measure. Total DNA mass was the only unit of
measure with measurements on individual filters using the
same quantification method from a majority of laboratories
(832 total DNA measurements). Further, because total DNA
yield varied extensively among laboratories (Figure S2),
normalizing to totalDNAminimizedbias andput theassayson
the most level playing field possible (see Kelty et al., 2012).
When the data were normalized to ng total DNA, HF183
Taqman was the only assay categorized as both sensitive and
specific. Numerous studies from around the world have
demonstrated the success of the original HF183 endpoint PCR
assay (e.g. Griffith et al., 2003; Gawler et al., 2007; Ahmed et al.,

wat e r r e s e a r c h 4 7 ( 2 0 1 3 ) 6 8 9 7e6 9 0 86906
2012), andmanyqPCRassayshavebeendeveloped to target the
same region of the Bacteroides 16S rRNA gene (see Supple-
mental Information). In the present work, the HF183 endpoint
assay wasmuch less sensitive to sewage than the HF183 qPCR
assays (Table 5), suggesting that a qPCR version of thismethod
is preferable where sewage contamination is a concern.
4.3. Influence of target source
Assay sensitivity varied among the three “target” sources
(human stools, sewage or septage). While every assay was
highly or perfectly sensitive to human stools, successwasmore
varied with sewage and septage sources. There are several
possible explanations. Firstly, the sewage and septage chal-
lenge filter samples had very low quantities of fecal material
compared to thehuman stool samples (Ervin et al., 2013), which
affects sensitivity on a “per filter” basis. Secondly, sewage and
septage are mixed sources with fecal inputs from humans as
well as other animal species. Themixednature of these sources
could affect sensitivity both in terms of decreased amount of
target per unit of fecal material as well as possible cross-
reactivity to the non-human inputs. Lastly, the assays in this
studywere initially designed to be human fecal-associated, not
necessarily sewage or septage-associated (though many were
validatedwith sewage samples). Given the differences between
stool samples and sewage/septage, there is a need for methods
that can discriminate sewage and septage, such as community
analysis (Cao et al., 2013). In consideration of the differences
among target sources, Table 4 was recreated with the stool and
sewage/septage target sources analyzed separately (Table S4).
Almost every assay had lower sensitivity to sewage than
septage (Table 5, DNQ negative). Septic tanks may be more
hospitable environments for fecal anaerobes than sewerage
systems, and thus the microbes targeted by the assays in this
study may be more numerous in septage samples than
sewage. This hypothesis is supported by the greater copy
numbers of general Bacteroidales per total DNA mass
observed in septage versus sewage samples (Fig. S3). Further,
it has been previously shown that septage has higher con-
centrations than sewage of E. coli uidA, Enterococcus 16S rRNA
and BtH gene copies (Srinivasan et al., 2011), and that only a
small percentage of microorganisms in sewage are fecal-
derived (McLellan et al., 2010).
Our findings contrast with those of some of the original
assay publications. For example, Kildare et al. (2007) found the
BacHum-UCD marker to be less prevalent in human stools
than wastewater samples, though gene copy abundance in
these sources was not reported. Similarly, researchers in
France found HF183 SYBR to be less prevalent in stools than
wastewater (Mauffret et al., 2012). In the present study,
HumM2 and HF183 Taqman were orders of magnitude less
sensitive to sewage but substantially more abundant in
human stools than reported by Shanks et al. (2009, 2010).
The discrepancies between our results and those of previ-
ous studiesmay due to differences in thewastewater samples.
In the present work, we sampled a relatively small number of
treatment plants (n ¼ 9), some of which receive industrial
wastewater (up to 20% of total input volume and as much as
50% during certain times of day; C. McGee, pers. comm.).
Stapleton et al. (2009) found several orders ofmagnitude fewer
gene copies of human Bacteroides in industrial wastewater
compared to sewage. In addition, the microbial community
present in the sewerage infrastructure (biofilms) may be quite
different among locations due to a number of factors. Thus it is
possible that the microbial profile of the sewage influent used
in the present study may vary considerably from those found
elsewhere, which could explain some of the contrasting re-
sults. Before thesemethods are employed in localMST studies,
management agencies may benefit from performing small
studies to establish the assays’ sensitivity to the wastewater
sources present in their watersheds.
4.4. Doubletons
In environmental water samples, there will be numerous
sources of bacterial DNA, including multiple fecal hosts and
indigenous microbes. The doubleton challenge samples repre-
sent an idealized model of very a simple two-host system. In
our analysis,weuncovered an interesting effect of gull feces on
sensitivity to sewage (Fig. 2). It appears that gull fecesdecreased
sensitivity to sewage in several assays, yet this effect was not
observed in the sewage/pig samples or in the human/gull
samples. To our knowledge, no other method evaluation
studies have tested these assays against a sewage/gull matrix.
This finding has implications for application of these assays at
beaches with large native seagull populations; however, not
every assay was affected and the number of samples in this
category was relatively small. Further study is needed before
definite recommendations can be made on this issue.
4.5. Effect of individual laboratory performance
An important source of variability in assay performance is the
effect of individual laboratories, whether due to differing
protocols or varying levels of experience with the technology.
The sources of inter-laboratory variability in assay perfor-
mance include: DNA purification approach and efficiency,
DNA yield measurements, qPCR chemistry, type of qPCR
standard reference material, qPCR instrument, laboratory
infrastructure (i.e. spatial separation of tasks) and technician
skill level. Even with standardized protocols, laboratories may
produce different results (Pan et al., 2010). In the present
study, there are several instances of assay performance
differing across laboratories (Fig. S1). These differences are
often driven by DNQ classification, which reflects the varying
LLOQ values among laboratories (Table S3). Issues associated
with repeatability among laboratories in this study are
explored in depth in Ebentier et al. (2013). It is clear that SOPs
e which should include everything from laboratory setup to
data handling and stringent quality assurance guidelines e
must be established for accurate performance assessment
and successful implementation of these methods.
Another important limitation of this work is the imbalance
in size of the datasets between assays (ranging from 1 to 7
laboratories), which creates a statistical bias in the perfor-
mancemetrics. This bias is exacerbated by the clear lab-to-lab
variability in performance. This bias and variability make it
difficult to compare performance metrics across assays, and
could be why the overall performance in the present study
often does not match the original reports. Method
wat e r r e s e a r c h 4 7 ( 2 0 1 3 ) 6 8 9 7e6 9 0 8 6907
performance needs to be determined with an unbiased data-
set where lab-to-lab variability is not a factor (e.g. Table 3).
5. Conclusions
� HF183 Taqman consistently excelled across numerous per-
formance benchmarks
� In practice, it may be beneficial to use two assays targeting
different genes and/or bacterial species, such as HF183
Taqman with BtH or HumM2
� Further work is needed to determinewhether the additional
uncertainty associated with using multiple human-
associated assays adds value to source tracking efforts
� While these assays performed well with fresh fecal pollu-
tion sources from California in an artificial water source,
several issues still need to be thoroughly addressed prior to
implementation in local management settings: persistence
and decay, standardization of protocols, performance with
reference feces from different geographical areas and ani-
mal species, and potential influence of the environmental
sample matrix on amplification
Acknowledgments
The authors are deeply grateful to Meredith Raith for her vital
contribution to sample creation, data generation and data
analysis. SteveWeisberg and Chuck Hagedorn helped develop
the manuscript. We also greatly appreciate the students and
staff of all labs that participated in the SIPPmethod evaluation
study.Work in the Farnleitner Lab was funded by the Austrian
Science Fund (FWF) projects # P22309-B20 and DK-plus
#W1219-N22.Work in the Rose Labwas funded by theNational
Oceanic and Atmospheric Administration (NA04OAR4600199).
Funding for themethod evaluation study was through a Clean
Beach Initiative Grant from the California State Water Re-
sources Control Board. This article is Contribution 1758 of the
U.S. Geological Survey Great Lakes Science Center. Any use of
trade, product, or firm names is for descriptive purposes only
and does not imply endorsement by the U.S. Government.
Appendix A. Supplementary data
Supplementary data related to this article can be found at
http://dx.doi.org/10.1016/j.watres.2013.05.060.
r e f e r e n c e s
Ahmed, W., Masters, N., Toze, S., 2012. Consistency in the hostspecificity and host sensitivity of the Bacteroides HF183 markerfor sewage pollution tracking. Letters in Applied Microbiology55 (4), 283e289.
Bernhard, A.E., Field, K., 2000. A PCR assay to discriminate humanand ruminant feces on the basis of host differences in
Bacteroides-Prevotella genes encoding 16S rRNA. Applied andEnvironmental Microbiology 66 (10), 4571e4574.
Boehm, A.B., Soller, J.A., 2011. Risks associated with recreationalwaters: pathogens and fecal indicators. In: Meyers, R.A. (Ed.),EncyclopediaofSustainabilityScienceandTechnology.Springer.
Boehm, A.B., Van De Werfhorst, L.C., Griffith, J.F., Holden, P.A.,Jay, J.A., Shanks, O.C., Wang, D., Weisberg, S.B., 2013.Performance of forty-one microbial source tracking methods: atwenty-seven lab evaluation study. Water Research 47 (18),6812e6828.
Bustin, S.A., Benes, V., Garson, J.A., Hellemans, J., Huggett, J.,Kubista, M., Mueller, R., Nolan, T., Pfaffl, M.W., Shipley, G.L.,Vandesompele, J., Wittwer, C.T., 2009. The MIQE guidelines:minimum information for publication of quantitative real-time PCR experiments. Clinical Chemistry 55 (4), 611e622.
Cao, Y., Van De Werfhorst, L.C., Dubinsky, E.A., Badgley, B.D.,Sadowsky, M.J., Andersen, G.L., Griffith, J.F., Holden, P.A., 2013.Evaluation of molecular community analysis methodsfor discerning fecal sources and human waste. WaterResearch 47 (18), 6849e6861.
Chern, E.C., Siefring, S., Paar, J., Doolittle, M., Haugland, R.A., 2011.Comparison of quantitative PCR assays for Escherichia colitargeting ribosomal RNA and single copy genes. Letters inApplied Microbiology 52 (3), 298e306.
Converse, R., Blackwood, A.D., Kirsb, M., Griffith, J.F., Noble, R.,2009. Rapid QPCR-based assay for fecal Bacteroides spp. as atool for assessing fecal contamination in recreational waters.Water Research 43 (19), 4828e4837.
Ebentier, D.L., Hanley, K.T., Cao, Y., Badgley, B.D., Boehm, A.B.,Ervin, J.S., Goodwin, K.D., Gourmelon, M., Griffith, J.F.,Holden, P.A., Kelty, C.A., Lozach, S., McGee, C.D., Peed, L.A.,Raith, M.R., Sadowsky, M.J., Scott, E., Santo Domingo, J.,Sinigalliano, C., Shanks, O.C., Van De Werfhorst, L.C.,Wang, D., Wuertz, S., Jay, J.A., 2013. Evaluation of therepeatability and reproducibility of a suite of qPCR-basedmicrobial source tracking methods. Water Research 47 (18),6839e6848.
Ervin, J.S., Russell, T.L., Layton, B.A., Yamahara, K.M., Wang, D.,Sassoubre, L.M., Cao, Y., Kelty, C.A., Sivaganesan, M.,Boehm, A.B., Holden, P.A., Weisberg, S.B., Shanks, O.C., 2013.Characterization of fecal concentrations in human and otheranimal sources by physical, culture, and quantitative real-time PCR methods. Water Research 47 (18), 6873e6882.
Field, K., Samadpour, M., 2007. Fecal source tracking, theindicator paradigm, and managing water quality. WaterResearch 41 (16), 3517e3538.
Gawler, A.H., Beecher, J.E., Brandao, J., Carroll, N.M., Falcao, L.,Gourmelon, M., Masterson, B., Nunes, B., Porter, J., Rince, A.,Rodrigues, R., Thorp, M., Walters, J.M., Meijer, W.G., 2007.Validation of host-specific bacteriodales 16S rRNA genes asmarkers to determine the origin of faecal pollution in Atlanticrim countries of the European Union. Water Research 41 (16),3780e3784.
Griffith, J.F., Weisberg, S., McGee, C., 2003. Evaluation of microbialsource tracking methods usingmixed fecal sources in aqueoustest samples. Journal of Water and Health 1 (7), 141e151.
Harwood, V.J., Boehm, A.B., Sassoubre, L.M., Vijayavel, K.,Stewart, J.R., Fong, T.-T., Caprais, M.P., Converse, R.R.,Diston, D., Ebdon, J., Fuhrman, J.A., Gourmelon, M., Gentry-Shields, J., Griffith, J.F., Kashian, D.R., Noble, R.T., Taylor, H.,Wicki, M., 2013. Performance of viruses and bacteriophages forfecal source determination in a multi-laboratory, comparativestudy. Water Research 47 (18), 6829e6943.
Haugland, R., Siefring, S., Wymer, L., Brenner, K., Dufour, A., 2005.Comparison of Enterococcus measurements in freshwater attwo recreational beaches by quantitative polymerase chainreaction and membrane filter culture analysis. WaterResearch 39 (4), 559e568.

wat e r r e s e a r c h 4 7 ( 2 0 1 3 ) 6 8 9 7e6 9 0 86908
Haugland, R.A., Varma, M., Sivaganesan, M., Kelty, C., Peed, L.,Shanks, O.C., 2010. Evaluation of genetic markers from the 16SrRNA gene V2 region for use in quantitative detection ofselected Bacteroidales species and human fecal waste byqPCR. Systematic and Applied Microbiology 33 (6), 348e357.
Johnston, C., Ufnar, J.A., Griffith, J.F., Gooch, J.A., Stewart, J.R.,2010. A real-time qPCR assay for the detection of the nifH geneof Methanobrevibacter smithii, a potential indicator of sewagepollution. Journal of Applied Microbiology 109 (6), 1946e1956.
Kelty, C.A., Varma, M., Sivaganesan, M., Haugland, R.A.,Shanks, O.C., 2012. Distribution of genetic markerconcentrations for fecal indicator bacteria in sewage andanimal feces. Applied and Environmental Microbiology 78 (12),4225e4232.
Kildare, B.J., Leutenegger, C.M., McSwain, B.S., Bambic, D.G.,Rajal, V.B., Wuertz, S., 2007. 16S rRNA-based assays forquantitative detection of universal, human-, cow-, and dog-specific fecal Bacteroidales: a Bayesian approach. WaterResearch 41 (16), 3701e3715.
Layton, A., McKay, L., Williams, D., Garrett, V., Gentry, R.,Sayler, G., 2006. Development of Bacteroides 16S rRNA geneTaqMan-based real-time PCR assays for estimation of total,human, and bovine fecal pollution in water. Applied andEnvironmental Microbiology 72 (6), 4214e4224.
Lee, C.S., Lee, J., 2010. Evaluation of new gyrB-based real-time PCRsystem for the detection of B. fragilis as an indicator of human-specific fecal contamination. Journal of MicrobiologicalMethods 82 (3), 311e318.
Matsuki, T., Watanabe, K., Fujimoto, J., Miyamoto, Y., Takada, T.,Matsumoto, K., Oyaizu, H., Tanaka, R., 2002. Development of 16SrRNA-gene-targetedgroup-specificprimers for thedetectionandidentification of predominant bacteria in human feces. Appliedand Environmental Microbiology 68 (11), 5445e5451.
Mauffret, A., Caprais, M.P., Gourmelon, M., 2012. Relevance ofBacteroidales and F-specific RNA bacteriophages for efficientfecal contamination tracking at the level of a catchment inFrance. Applied and Environmental Microbiology 78 (15),5143e5152.
McLellan, S.L., Huse, S.M., Mueller-Spitz, S.R.,Andreishcheva, E.N., Sogin, M.L., 2010. Diversity andpopulation structure of sewage-derived microorganisms inwastewater treatment plant influent. EnvironmentalMicrobiology 12 (2), 378e392.
Pan, Y., Bodrossy, L., Frenzel, P., Hestnes, A.G., Krause, S., Luke, C.,Meima-Franke, M., Siljanen, H., Svenning, M.M., Bodelier, P.L.E.,2010. Impacts of inter- and intralaboratory variations on thereproducibility of microbial community analyses. Applied andEnvironmental Microbiology 76 (22), 7451e7458.
Raith, M.R., Kelty, C.A., Griffith, J.F., Schriewer, A., Wuertz, S.,Mieszkin, S., Gourmelon, M., Reischer, G.H., Farnleitner, A.H.,Ervin, J., Holden, P.A., Jay, J.A., Boehm, A.B., Rose, J.B.,Meijer, W.G., Sivaganesan, M., Shanks, O.C., 2013. Comparisonof PCR and quantitative real-time PCR methods for thecharacterization of ruminant and cattle fecal pollutionsources. Water Research 47 (18), 6921e6928.
Reischer, G., Kasper, D., Steinborn, R., Farnleitner, A., Mach, R.,2007. A quantitative real-time PCR assay for the highlysensitive and specific detection of human faecal influence inspring water from a large alpine catchment area. Letters inApplied Microbiology 44 (4), 351e356.
Roslev, P., Bukh, A.S., 2011. State of the art molecular markers forfecal pollution source tracking in water. Applied Microbiologyand Biotechnology 89 (5), 1341e1355.
Sauer, E.P., VandeWalle, J.L., Bootsma, M.J., McLellan, S.L., 2011.Detection of the human specific Bacteroides genetic markerprovides evidence of widespread sewage contamination ofstormwater in the urban environment. Water Research 45 (14),4081e4091.
Seurinck, S., Defoirdt, T., Verstraete, W., Siciliano, S., 2005.Detection and quantification of the human-specific HF183Bacteroides 16S rRNA genetic marker with real-time PCR forassessment of human faecal pollution in freshwater.Environmental Microbiology 7 (2), 249e259.
Shanks, O.C., Kelty, C.A., Sivaganesan, M., Varma, M.,Haugland, R.A., 2009. Quantitative PCR for genetic markersof human fecal pollution. Applied and EnvironmentalMicrobiology 75 (17), 5507e5513.
Shanks, O.C., White, K., Kelty, C.A., Sivaganesan, M., Blannon, J.,Meckes, M., Varma, M., Haugland, R.A., 2010. Performance ofPCR-based assays targeting Bacteroidales genetic markers ofhuman fecal pollution in sewage and fecal samples.Environmental Science and Technology 44 (16), 6281e6288.
Siefring, S., Varma, M., Atikovic, E., Wymer, L., Haugland, R.A.,2008. Improved real-time PCR assays for the detection of fecalindicator bacteria in surface waters with different instrumentand reagent systems. Journal of Water and Health 6 (2),225e237.
Sinigalliano, C.D., Ervin, J.S., Van De Werfhorst, L.C.,Badgley, B.D., Balleste, E., Bartkowiak, J., Boehm, A.B.,Byappanahalli, M.N., Goodwin, K.D., Gourmelon, M.,Griffith, J.F., Holden, P.A., Jay, J.A., Layton, B.A., Lee, C., Lee, J.,Meijer, W.G., Noble, R.T., Raith, M.R., Ryu, H., Sadowsky, M.J.,Schriewer, A., Wang, D., Wanless, D., Whitman, R.L.,Wuertz, S., Santo Domingo, J.W., 2013. Multi-laboratoryevaluations of the performance of Catellicoccusmarimammalium PCR assays developed to target gull fecalsources. Water Research 47 (18), 6883e6896.
Srinivasan, S., Aslan, A., Xagoraraki, I., Alocilja, E., Rose, J.B., 2011.Escherichia coli, enterococci, and Bacteroides thetaiotaomicronqPCR signals through wastewater and septage treatment.Water Research 45 (8), 2561e2572.
Stapleton, C.M., Kay, D., Wyer, M.D., Davies, C., Watkins, J.,Kay, C., McDonald, A.T., Porter, J., Gawler, A., 2009. Evaluatingthe operational utility of a Bacteroidales quantitative PCR-based MST approach in determining the source of faecalindicator organisms at a UK bathing water. Water Research 43(19), 4888e4899.
Stewart, J.R., Boehm, A.B., Dubinsky, E.A., Fong, T.-T.,Goodwin, K.D., Griffith, J.F., Noble, R.T., Shanks, O.C.,Vijayavel, K., Weisberg, S.B., 2013. Recommendationsfollowing a multi-laboratory comparison of microbial sourcetracking methods. Water Research 47 (18), 6829e6938.
USEPA, 2005. Microbial Source Tracking Guide Document(No. EPA/600-R-05-064). U.S. Environmental ProtectionAgency, Office of Research and Development, National RiskManagement Research Laboratory, Cincinnati, OH.
Yampara-Iquise, H., Zheng, G., Jones, J.E., Carson, C.A., 2008. Useof a Bacteroides thetaiotaomicron-specific alpha-1-6, mannanasequantitative PCR to detect human faecal pollution in water.Journal of Applied Microbiology 105 (5), 1686e1693.
Recommended