
PERFORMANCE HIGHLIGHTS2019-20
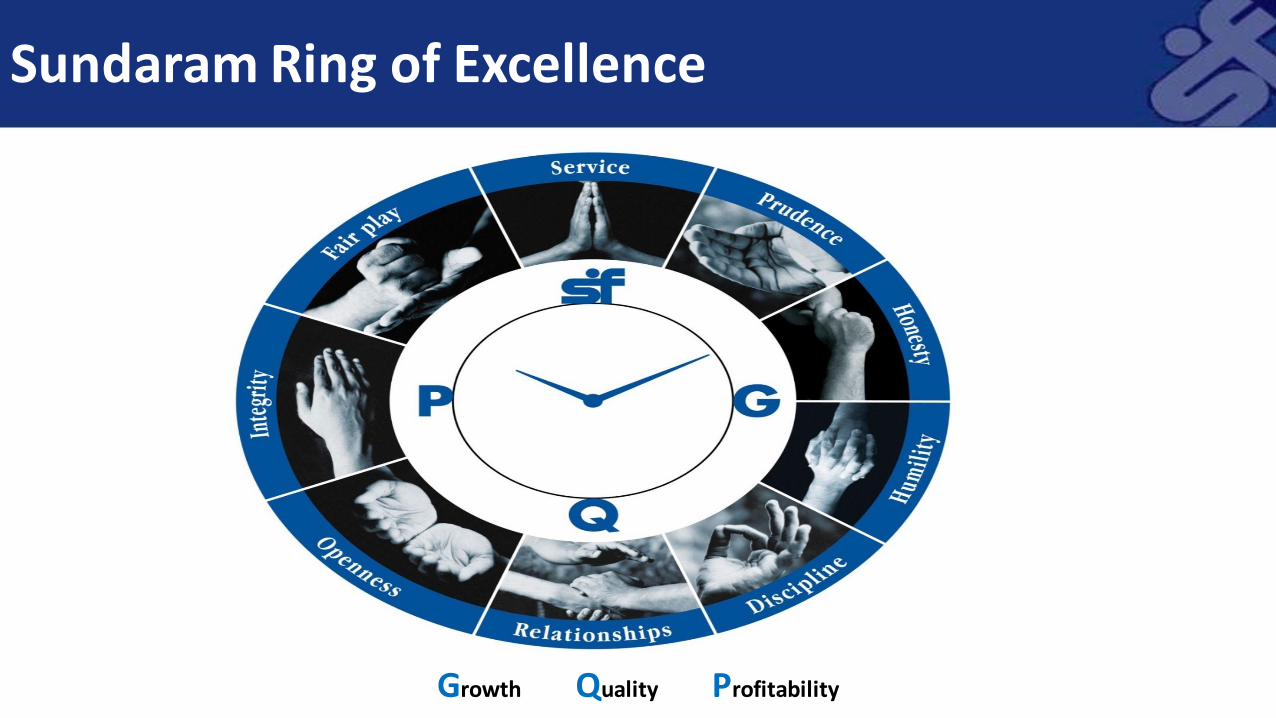
Sundaram Ring of Excellence
Growth Quality Profitability
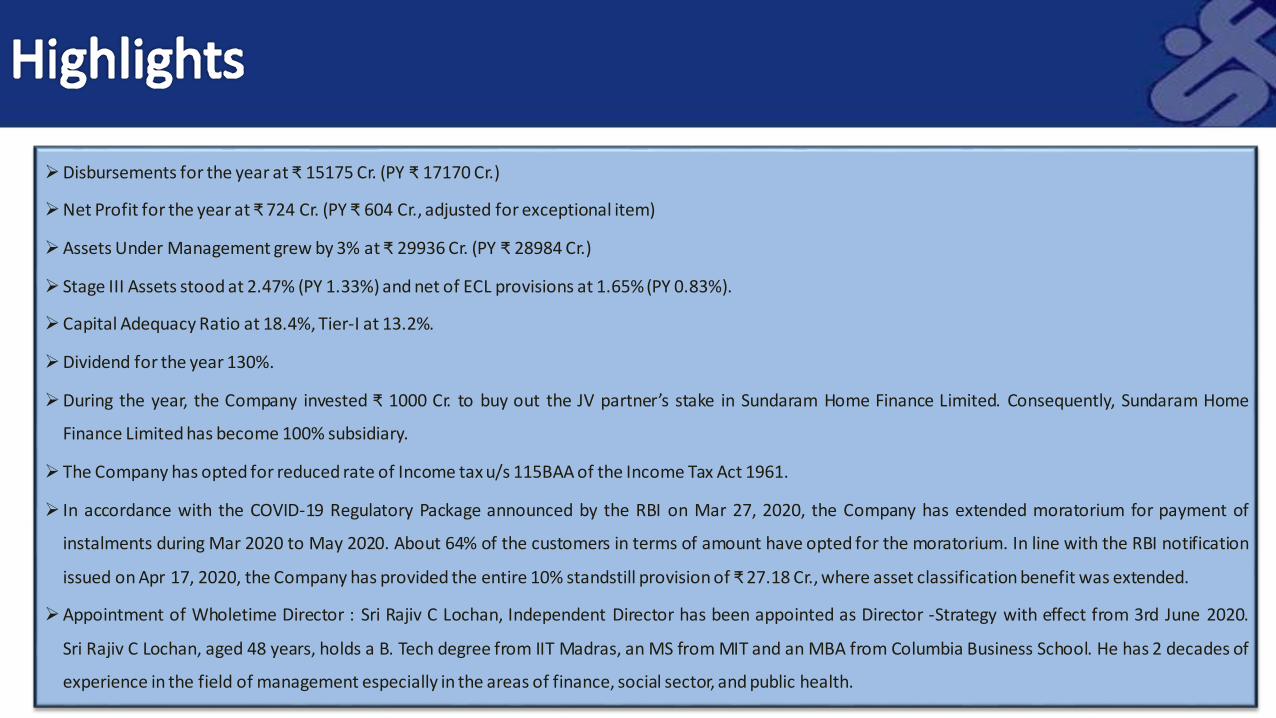
Disbursements for the year at ₹ 15175 Cr. (PY ₹ 17170 Cr.)
Net Profit for the year at ₹ 724 Cr. (PY ₹ 604 Cr., adjusted for exceptional item)
Assets Under Management grew by 3% at ₹ 29936 Cr. (PY ₹ 28984 Cr.)
Stage III Assets stood at 2.47% (PY 1.33%) and net of ECL provisions at 1.65% (PY 0.83%).
Capital Adequacy Ratio at 18.4%, Tier-I at 13.2%.
Dividend for the year 130%.
During the year, the Company invested ₹ 1000 Cr. to buy out the JV partner’s stake in Sundaram Home Finance Limited. Consequently, Sundaram Home
Finance Limited has become 100% subsidiary.
The Company has opted for reduced rate of Income tax u/s 115BAA of the Income Tax Act 1961.
In accordance with the COVID-19 Regulatory Package announced by the RBI on Mar 27, 2020, the Company has extended moratorium for payment of
instalments during Mar 2020 to May 2020. About 64% of the customers in terms of amount have opted for the moratorium. In line with the RBI notification
issued on Apr 17, 2020, the Company has provided the entire 10% standstill provision of ₹ 27.18 Cr., where asset classification benefit was extended.
Appointment of Wholetime Director : Sri Rajiv C Lochan, Independent Director has been appointed as Director -Strategy with effect from 3rd June 2020.
Sri Rajiv C Lochan, aged 48 years, holds a B. Tech degree from IIT Madras, an MS from MIT and an MBA from Columbia Business School. He has 2 decades of
experience in the field of management especially in the areas of finance, social sector, and public health.
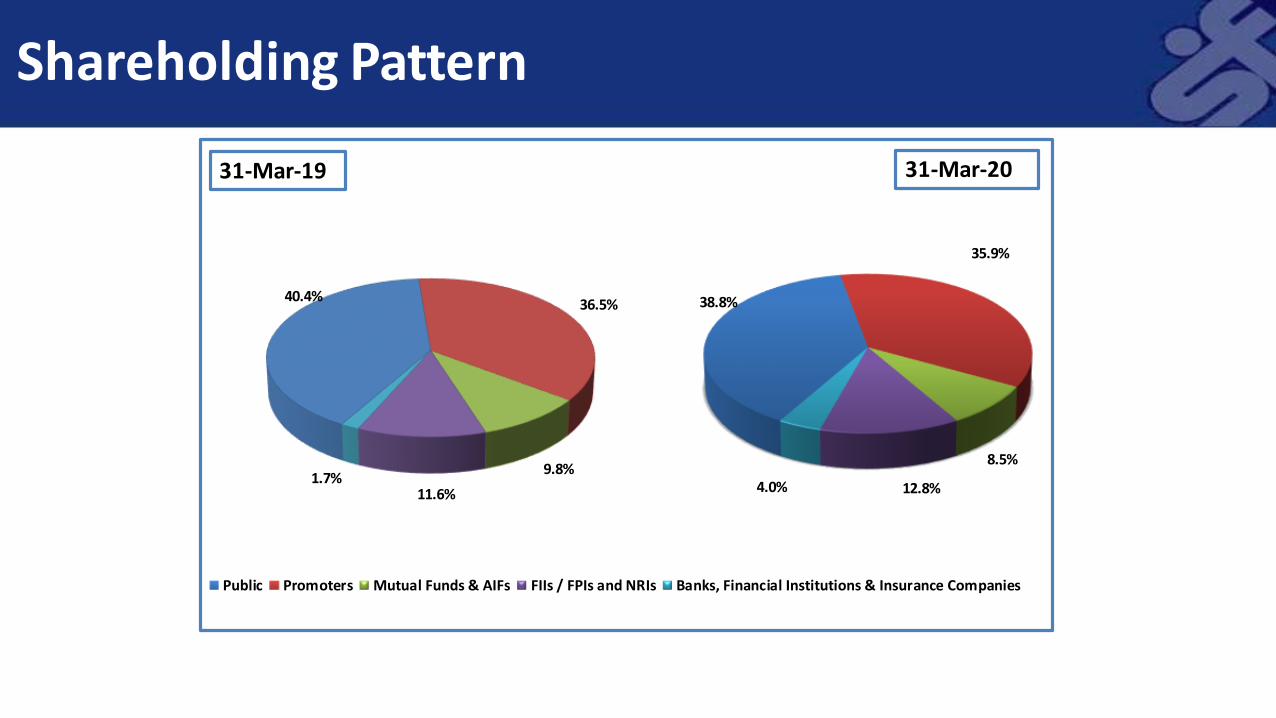
Shareholding Pattern
38.8%
35.9%
8.5%
12.8%4.0%
Public Promoters Mutual Funds & AIFs FIIs / FPIs and NRIs Banks, Financial Institutions & Insurance Companies
31-Mar-19
40.4%36.5%
9.8%
11.6%1.7%
31-Mar-20
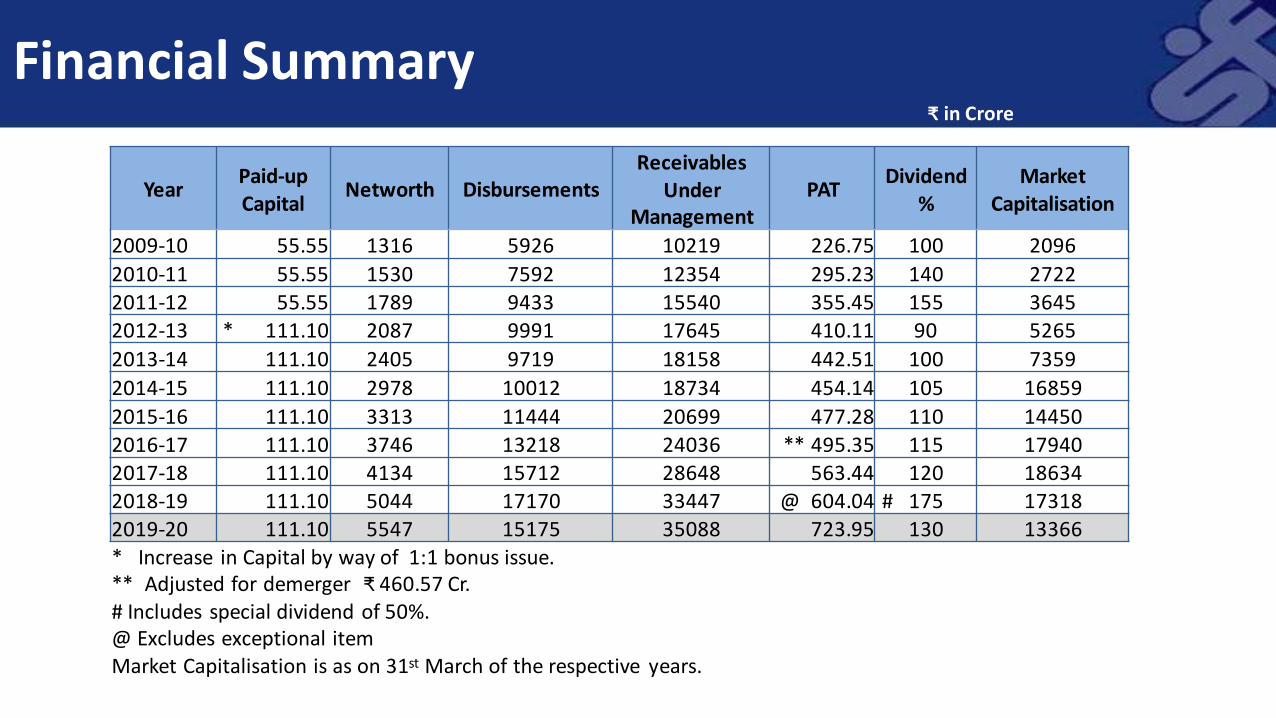
Financial Summary₹ in Crore
YearPaid-up Capital
Networth DisbursementsReceivables
Under Management
PATDividend
%Market
Capitalisation
2009-10 55.55 1316 5926 10219 226.75 100 2096
2010-11 55.55 1530 7592 12354 295.23 140 2722
2011-12 55.55 1789 9433 15540 355.45 155 3645
2012-13 * 111.10 2087 9991 17645 410.11 90 5265
2013-14 111.10 2405 9719 18158 442.51 100 7359
2014-15 111.10 2978 10012 18734 454.14 105 16859
2015-16 111.10 3313 11444 20699 477.28 110 14450
2016-17 111.10 3746 13218 24036 ** 495.35 115 17940
2017-18 111.10 4134 15712 28648 563.44 120 18634
2018-19 111.10 5044 17170 33447 @ 604.04 # 175 17318
2019-20 111.10 5547 15175 35088 723.95 130 13366
* Increase in Capital by way of 1:1 bonus issue.** Adjusted for demerger ₹ 460.57 Cr.# Includes special dividend of 50%.@ Excludes exceptional itemMarket Capitalisation is as on 31st March of the respective years.

Profit & Loss Statement₹ in Crore
ParticularsQuarter Ended
March 2019Quarter Ended
March 20202018-19 2019-20
Revenue From Operations * 874.51 931.41 3286.02 3804.55
Other Income 7.43 11.61 20.56 84.85
Total Revenue 881.94 943.02 3306.58 3889.40
Finance cost 477.56 515.64 1766.47 2072.03
Operating expenses 138.21 146.13 537.50 585.85
Impairment on financial instruments 42.61 115.69 107.33 286.40
Total Expenses 658.38 777.46 2411.30 2944.28
Profit Before Tax and exceptional item 223.56 165.56 895.28 945.12Exceptional Item ** 592.43 - 592.43 -
Profit Before Tax 815.99 165.56 1487.71 945.12
Profit After Tax 674.75 130.89 1126.31 723.95
Other Comprehensive Income (net of taxes) 1.74 4.65 2.78 63.17
Total Comprehensive Income 676.49 135.54 1129.09 787.12
* Revenue from operations is net of depreciation on operating lease
During the year 2019-20, the Company has divested its entire holdings in Equifax Credit Information Services Pvt Ltd., resulting in a gain of ₹62.07Cr. (net of tax) accounted under other comprehensive income, as the said investment was measured at fair value through other comprehensive income.
**Exceptional item represents, profit on sale of stake in Royal Sundaram General Insurance Co. Limited to Ageas Insurance International N.V, TheNetherlands in February 2019. Hence, the profit numbers of the two years are not comparable on a like to like basis.

Balance Sheet₹ in Crore
Particulars 31-Mar-19 31-Mar-20
EQUITY AND LIABILITIES
Financial Liabilities 25530.90 27824.60Non Financial Liabilities 74.46 47.54Equity 5043.81 5547.37
Total - EQUITY AND LIABILITIES 30649.17 33419.51
ASSETS
Financial Assets 30081.43 32725.79Non Financial Assets 567.74 693.72
Total - ASSETS 30649.17 33419.51

Disbursements and AUM₹ in Crore
Growth
15712
17170
15175
18.9% 9.3% -11.6%
-15.0%
-10.0%
-5.0%
0.0%
5.0%
10.0%
15.0%
20.0%
25.0%
7000
9000
11000
13000
15000
17000
19000
2017-18 2018-19 2019-20
Disbursements
Growth
89.4%
95.2% 95.4%
10.6%
4.8%4.6%
24964
2898429936
20.4% 16.1% 3.3%
0.0%
5.0%
10.0%
15.0%
20.0%
25.0%
10000
15000
20000
25000
30000
35000
31-Mar-18 31-Mar-19 31-Mar-20
AUM
On Books Securitised

Disbursements
51.8%
24.7%
11.3%
7.0%5.2%
2019-20
CVs Cars Construction Equipment Tractors Others
₹ 15175 Cr.53.7%
24.6%
11.2%
5.3% 5.2%2018-19
CVs Cars Construction Equipment Tractors Others
₹ 17170 Cr.
Ass
et w
ise
61.8%21.1%
12.9%
4.2%
South North West East
₹ 15175 Cr.
Re
gio
n w
ise
65.6%
19.2%
11.6%
3.6%
South North West East
₹ 17170 Cr.

AUM
52.5%
24.9%
10.4%
6.2%6.0%
31-Mar-20
CVs Cars Construction Equipment Tractors Others
₹ 29936 Cr.52.5%
25.9%
9.7%
5.3%6.6%31-Mar-19
CVs Cars Construction Equipment Tractors Others
₹ 28984 Cr.
Ass
et w
ise
63.6%
19.9%
12.8%
3.7%
South North West East
₹ 29936 Cr.
Re
gio
n w
ise
65.3%
18.8%
12.4%
3.5%
South North West East
₹ 28984 Cr.

Funding Mix
36.7%
19.9%
24.2%
10.9%
8.3%
39.2%
25.4%
20.4%
11.6%
3.4%
45.7%
16.7% 16.7%
13.2%
7.7%
0.0%
5.0%
10.0%
15.0%
20.0%
25.0%
30.0%
35.0%
40.0%
45.0%
50.0%
Debentures Bank Borrowings * Securitisation Deposits Commercial Paper
31-Mar-18 31-Mar-19 31-Mar-20
TotalBorrowing
31-Mar-18 31-Mar-19 31-Mar-20
₹ 24085 Cr. ₹ 26673 Cr. ₹ 29007 Cr.
* Includes a) Term loans b) Commercial Papers and demand loans availed against the sanctioned limits.
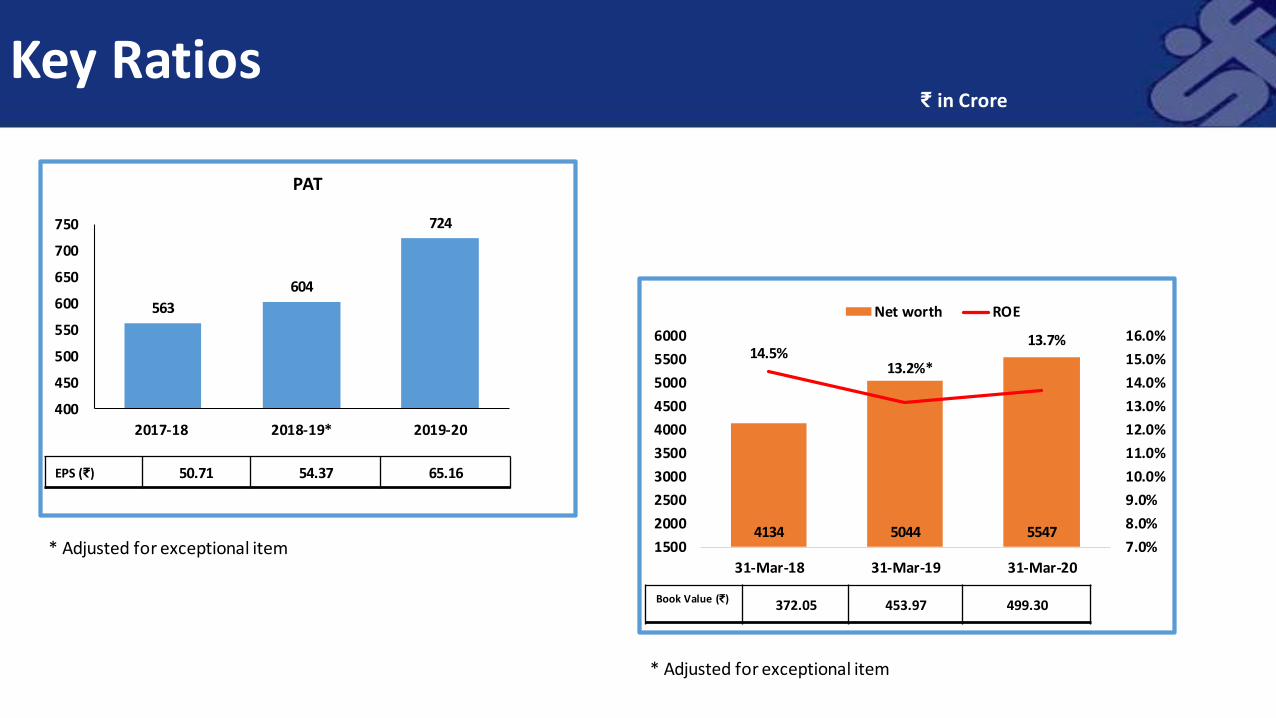
Key Ratios
EPS (₹) 50.71 54.37 65.16
₹ in Crore
Book Value (₹) 372.05 453.97 499.30
563
604
724
0
0.2
0.4
0.6
0.8
1
1.2
400
450
500
550
600
650
700
750
2017-18 2018-19* 2019-20
PAT
4134 5044 5547
14.5%13.2%*
13.7%
7.0%
8.0%
9.0%
10.0%
11.0%
12.0%
13.0%
14.0%
15.0%
16.0%
1500
2000
2500
3000
3500
4000
4500
5000
5500
6000
31-Mar-18 31-Mar-19 31-Mar-20
Net worth ROE
* Adjusted for exceptional item
* Adjusted for exceptional item

Key Ratios
* Assets includes securitised / assigned portfolio
5.1 5.0 4.9
18.0% 19.4%18.4%
0.0%
5.0%
10.0%
15.0%
20.0%
25.0%
3.0
3.5
4.0
4.5
5.0
5.5
31-Mar-18 31-Mar-19 31-Mar-20
Debt Equity CAR
35.1% 36.3% 34.4%
2.14%2.00% #
2.17%
0.00%
0.50%
1.00%
1.50%
2.00%
2.50%
25.0%
27.0%
29.0%
31.0%
33.0%
35.0%
37.0%
39.0%
2017-18 2018-19 2019-20
Cost to net Income ROA *
# Adjusted for exceptional item
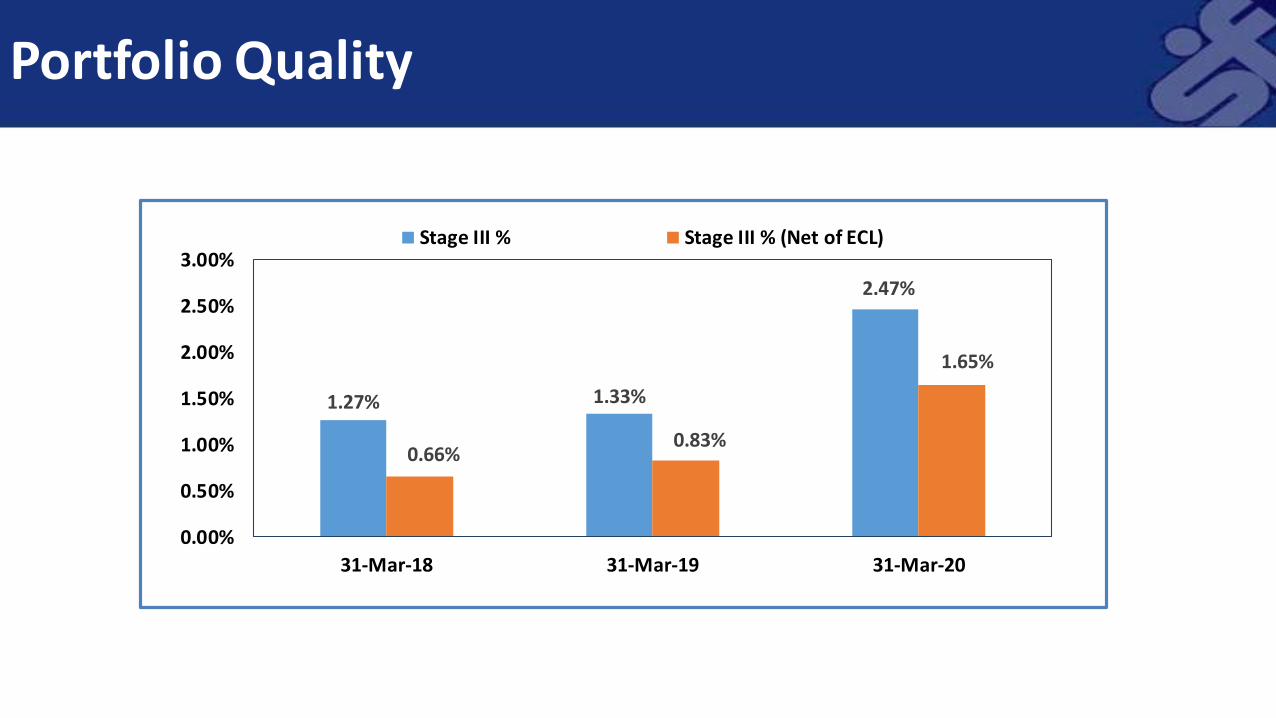
Portfolio Quality
1.27% 1.33%
2.47%
0.66%0.83%
1.65%
0.00%
0.50%
1.00%
1.50%
2.00%
2.50%
3.00%
31-Mar-18 31-Mar-19 31-Mar-20
Stage III % Stage III % (Net of ECL)

Instrument ICRA CRISIL
Deposits AAA (Stable) AAA (Stable)
Debentures AAA (Stable) AAA (Stable)
Subordinated Debentures AAA (Stable) AAA (Stable)
Long Term Loans AAA (Stable) AAA (Stable)
Working Capital Facilities AAA (Stable)
Commercial Paper A1+ A1+
Short Term Loans A1+
Credit Ratings

Branch Network
387161
68 42
337168
6441
South North West East
No. of Employees : 4213No. of Employees : 4055
31-Mar-19
No. of Branches : 610No. of Branches : 658
31-Mar-20
With the partial relaxation of the lock down, currently around 500 branches are in operation

Subsidiaries, Joint Ventures & Associates
Subsidiaries
Sundaram Home Finance Limited
Sundaram Finance Holdings Limited
Sundaram Business Services Limited
Sundaram Asset Management Company Limited
Sundaram Asset Management Singapore Pte. Limited
Sundaram Trustee Company Limited
Sundaram Alternate Assets Limited
Sundaram Fund Services Limited
LGF Services Limited
Joint Venture
Royal Sundaram General Insurance Co. Limited
Associates of a subsidiary companyAxles India LimitedTurbo Energy Private LimitedTransenergy LimitedSundaram Dynacast Private LimitedSundaram Hydraulics LimitedFlometallic India Private LimitedDunes Oman LLC (FZC)
Investments in Sundaram Home Finance Limited and Sundaram Fund Services Limited were accounted as Joint Venture in the previous year
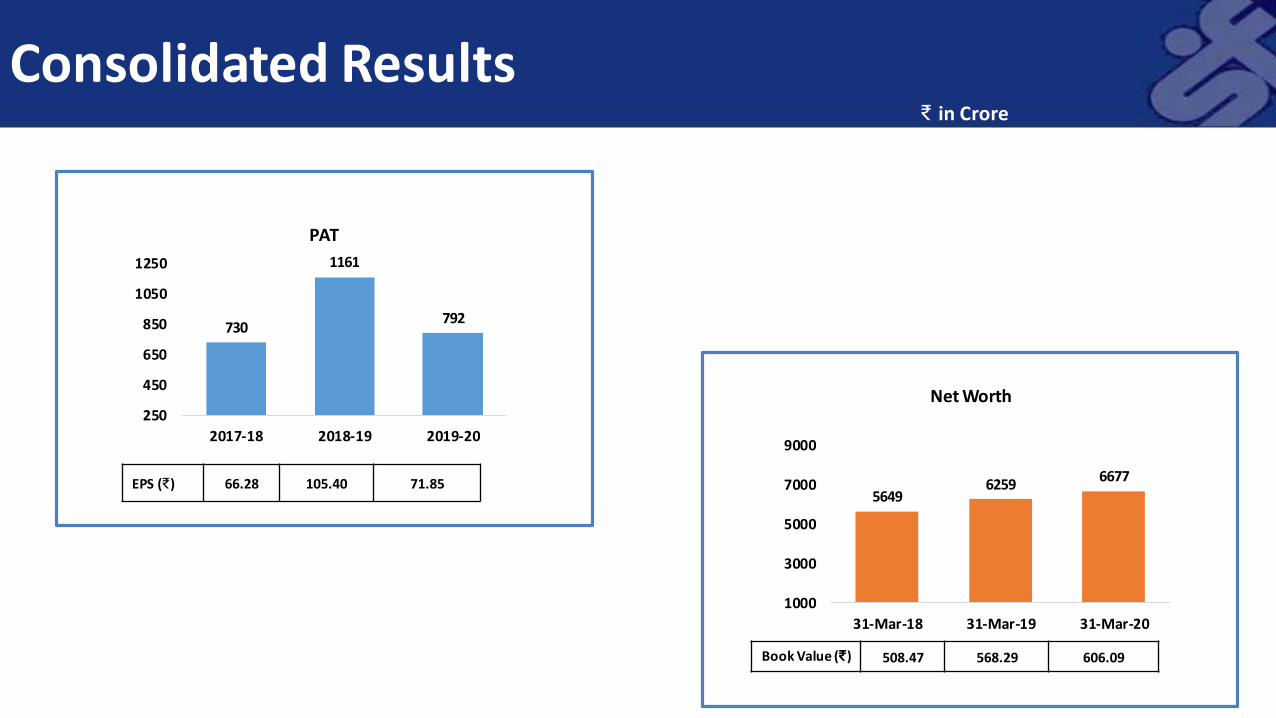
Consolidated Results₹ in Crore
EPS (₹) 66.28 105.40 71.85
Book Value (₹) 508.47 568.29 606.09
730
1161
792
250
450
650
850
1050
1250
2017-18 2018-19 2019-20
PAT
56496259
6677
1000
3000
5000
7000
9000
31-Mar-18 31-Mar-19 31-Mar-20
Net Worth

Consolidated Results₹ in Crore
Particulars Share of Net Worth Share in Profit31-Mar-19 31-Mar-20 2018-19 2019-20
Sundaram Finance Ltd. 5043.81 5547.37 1126.31 723.95Subsidiaries:Sundaram Finance Holdings Ltd. (Consolidated) 626.22 401.31 36.39 18.45Sundaram Asset Management Company Ltd. (Consolidated) 197.94 212.55 28.84 32.69
Sundaram Home Finance Ltd - 1421.07 - 165.89Sundaram Fund Services Ltd - 36.72 - 18.07Sundaram Trustee Company Ltd. 1.80 1.88 0.80 0.80LGF Services Ltd 3.67 3.61 0.25 0.11Sundaram Finance Employees Welfare Trust 13.86 16.16 1.89 2.30
Non-Controlling Interests in Subsidiaries 1738.91 1455.47 97.65 53.86
Joint Control EntitiesSundaram BNP Paribas Home Finance Ltd 639.21 - 72.88 -Royal Sundaram General Insurance Co. Ltd 551.12 544.96 56.63 (38.17)Sundaram BNP Paribas Fund Services Ltd 10.52 - (4.43) -
8827.08 9641.09 1417.21 977.95Adjustment arising out of Consolidation (828.87) (1508.80) (158.71) (132.55)
Total 7998.21 8132.30 1258.50 845.41

Sundaram Home Finance
# as per prudential norms * includes exceptional income (tax reversal of ₹ 60.25 Cr.)
Particulars 31-Mar-2019 31-Mar-2020Disbursements (₹ in Crore) 2449 2113-Housing 68.6% 71.4%-Non-Housing 31.4% 28.6%
AUM (₹ in Crore) 9064 9456-Housing 69.7% 70.5%-Non-Housing 30.3% 29.5%
PAT (₹ in Crore) 146 218*EPS (₹) 14.37 21.54Net worth (₹ in Crore) 1252 1421Book Value (₹) 123.66 140.35
Gross NPA # 2.95% 3.77%Net NPA – IndAS 0.93% 1.63%CAR # 23.5% 23.3%
Branches 115 115Employees 755 826
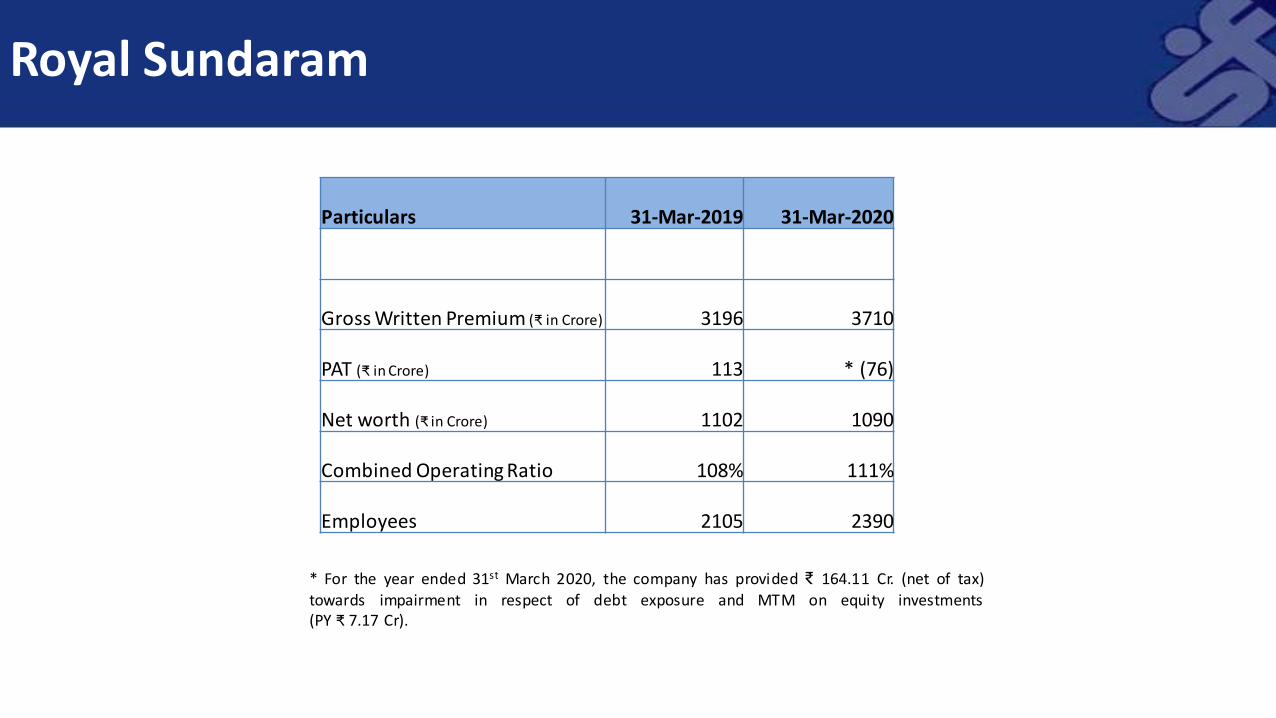
Royal Sundaram
Particulars 31-Mar-2019 31-Mar-2020
Gross Written Premium (₹ in Crore) 3196 3710
PAT (₹ in Crore) 113 * (76)
Net worth (₹ in Crore) 1102 1090
Combined Operating Ratio 108% 111%
Employees 2105 2390
* For the year ended 31st March 2020, the company has provided ₹ 164.11 Cr. (net of tax)towards impairment in respect of debt exposure and MTM on equity investments(PY ₹ 7.17 Cr).
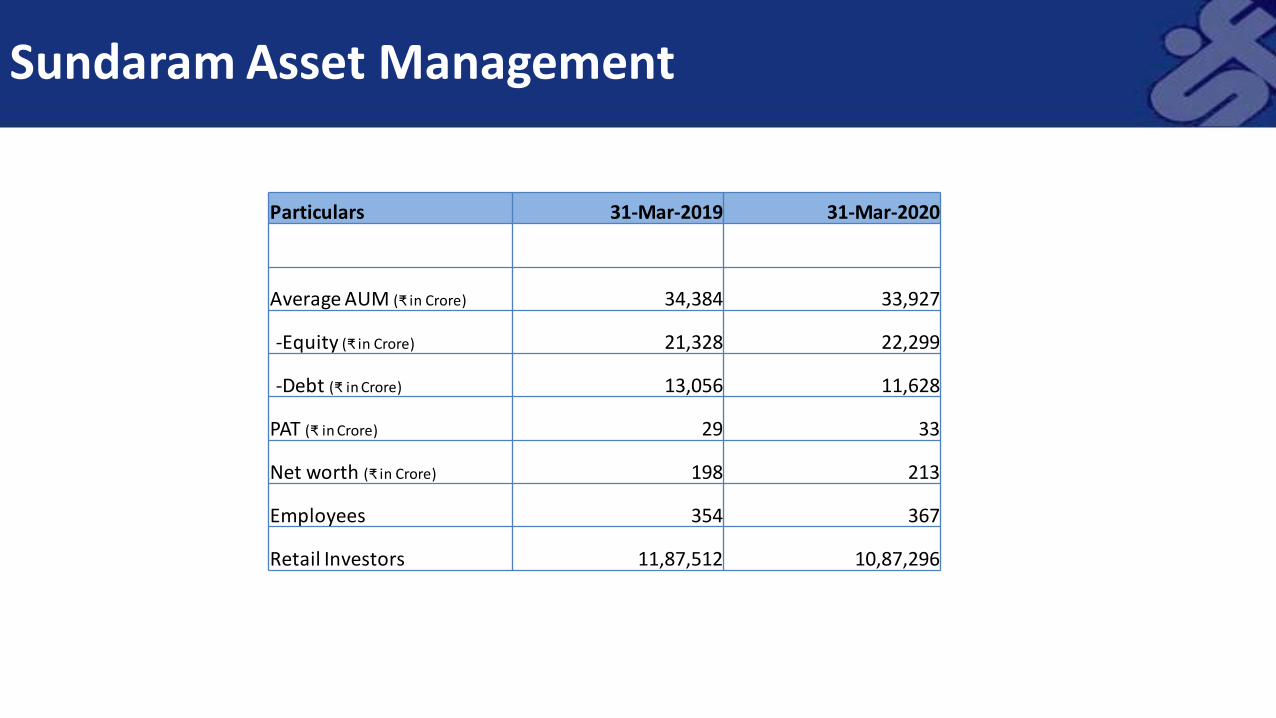
Sundaram Asset Management
Particulars 31-Mar-2019 31-Mar-2020
Average AUM (₹ in Crore) 34,384 33,927
-Equity (₹ in Crore) 21,328 22,299
-Debt (₹ in Crore) 13,056 11,628
PAT (₹ in Crore) 29 33
Net worth (₹ in Crore) 198 213
Employees 354 367
Retail Investors 11,87,512 10,87,296

Share Price MovementIn ₹
1615 16081686
1878
1677
16001514
1439
1559
1672 *1632 1631
1203
9174 9521 978910531
1011410714 10930 10863
11624 11789 1147412168
8598
5000
7000
9000
11000
13000
15000
17000
500
700
900
1100
1300
1500
1700
1900
Mar
-17
Jun
-17
Sep
-17
Dec
-17
Mar
-18
Jun
-18
Sep
-18
Dec
-18
Mar
-19
Jun
-19
Sep
-19
Dec
-19
Mar
-20
S &
P C
NX
Nif
ty
SFL
Clo
sin
g Sh
are
Pri
ce
SFL Closing Share Price S & P CNX Nifty
* Share price movement after 1st Feb 2018 is post demerger
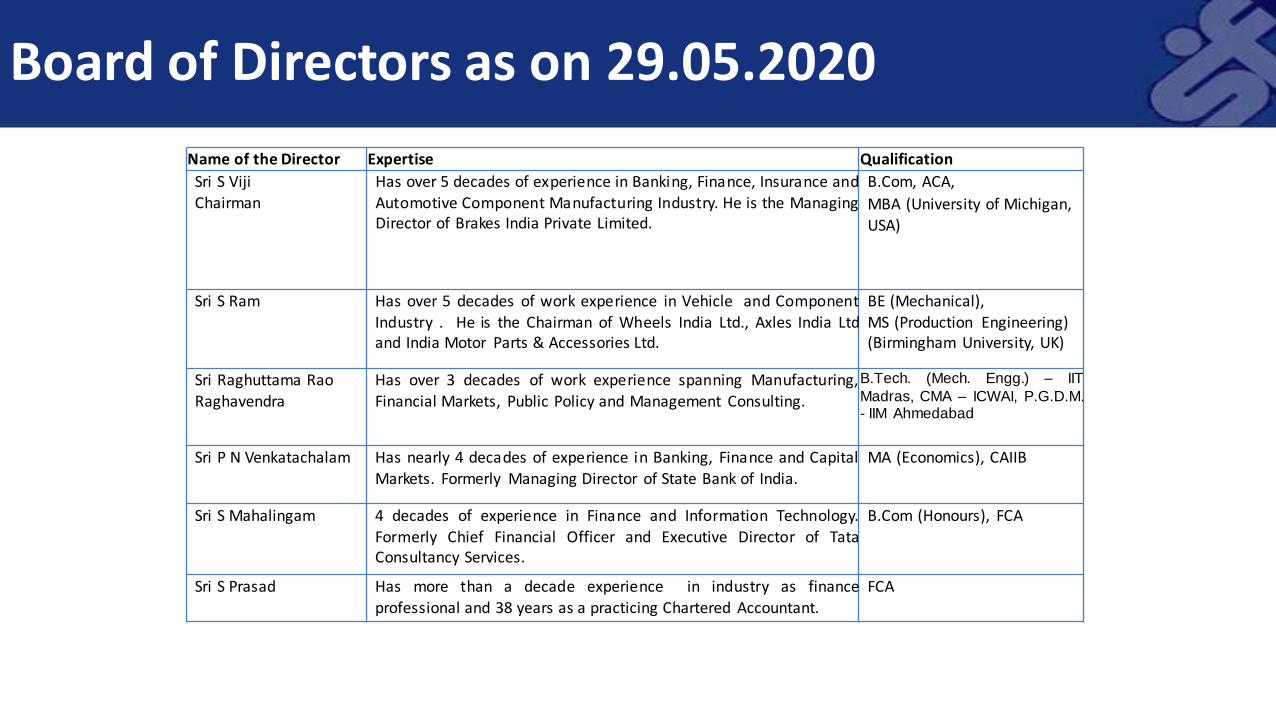
Name of the Director Expertise Qualification
Sri S VijiChairman
Has over 5 decades of experience in Banking, Finance, Insurance andAutomotive Component Manufacturing Industry. He is the ManagingDirector of Brakes India Private Limited.
B.Com, ACA,
MBA (University of Michigan, USA)
Sri S Ram Has over 5 decades of work experience in Vehicle and ComponentIndustry . He is the Chairman of Wheels India Ltd., Axles India Ltdand India Motor Parts & Accessories Ltd.
BE (Mechanical), MS (Production Engineering) (Birmingham University, UK)
Sri Raghuttama Rao Raghavendra
Has over 3 decades of work experience spanning Manufacturing,Financial Markets, Public Policy and Management Consulting.
B.Tech. (Mech. Engg.) – IIT
Madras, CMA – ICWAI, P.G.D.M.- IIM Ahmedabad
Sri P N Venkatachalam Has nearly 4 decades of experience in Banking, Finance and CapitalMarkets. Formerly Managing Director of State Bank of India.
MA (Economics), CAIIB
Sri S Mahalingam 4 decades of experience in Finance and Information Technology.Formerly Chief Financial Officer and Executive Director of TataConsultancy Services.
B.Com (Honours), FCA
Sri S Prasad Has more than a decade experience in industry as finance
professional and 38 years as a practicing Chartered Accountant.
FCA
Board of Directors as on 29.05.2020
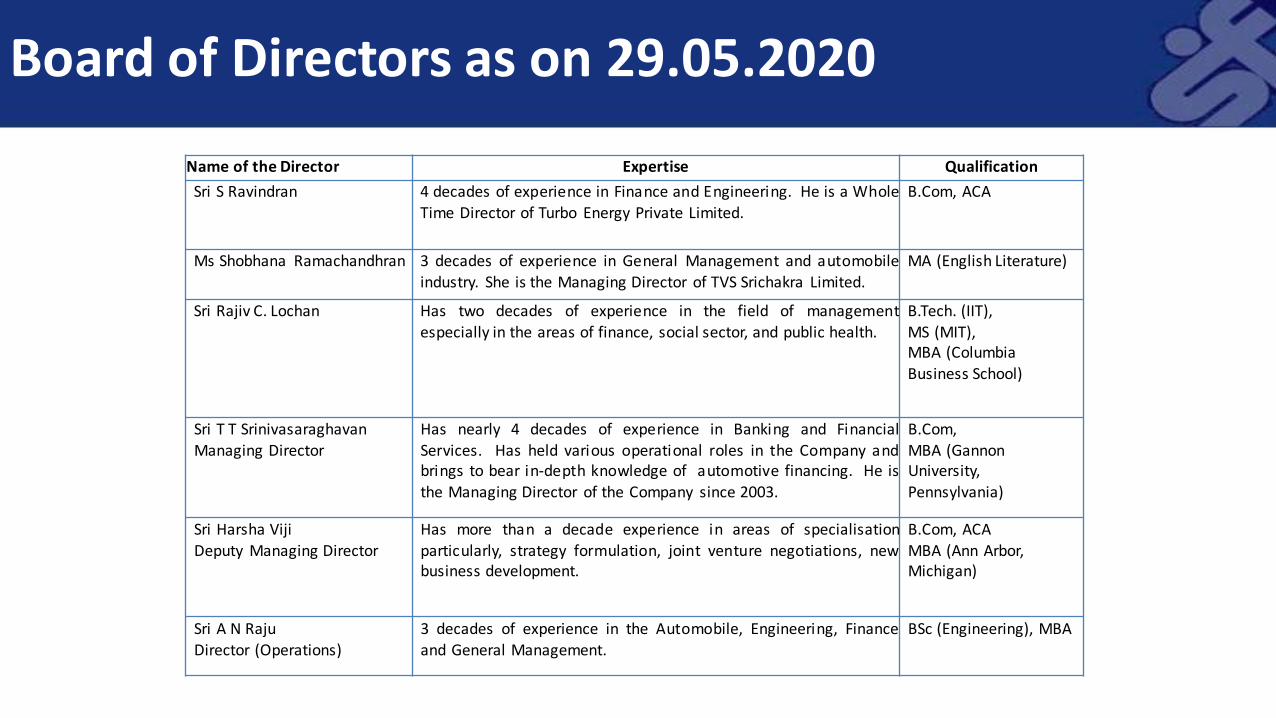
Name of the Director Expertise Qualification
Sri S Ravindran 4 decades of experience in Finance and Engineering. He is a WholeTime Director of Turbo Energy Private Limited.
B.Com, ACA
Ms Shobhana Ramachandhran 3 decades of experience in General Management and automobileindustry. She is the Managing Director of TVS Srichakra Limited.
MA (English Literature)
Sri Rajiv C. Lochan Has two decades of experience in the field of managementespecially in the areas of finance, social sector, and public health.
B.Tech. (IIT), MS (MIT), MBA (Columbia Business School)
Sri T T SrinivasaraghavanManaging Director
Has nearly 4 decades of experience in Banking and FinancialServices. Has held various operational roles in the Company andbrings to bear in-depth knowledge of automotive financing. He isthe Managing Director of the Company since 2003.
B.Com, MBA (Gannon University, Pennsylvania)
Sri Harsha Viji
Deputy Managing Director
Has more than a decade experience in areas of specialisation
particularly, strategy formulation, joint venture negotiations, newbusiness development.
B.Com, ACA
MBA (Ann Arbor, Michigan)
Sri A N RajuDirector (Operations)
3 decades of experience in the Automobile, Engineering, Financeand General Management.
BSc (Engineering), MBA
Board of Directors as on 29.05.2020
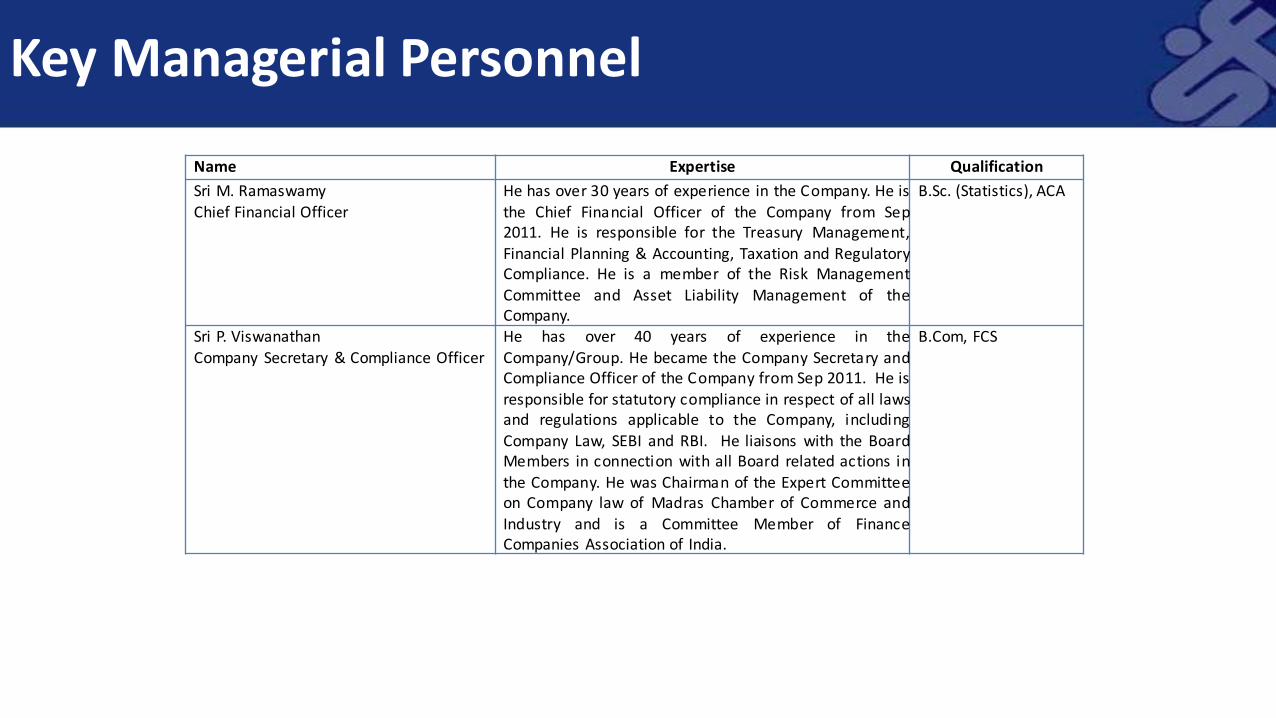
Name Expertise Qualification
Sri M. Ramaswamy
Chief Financial Officer
He has over 30 years of experience in the Company. He is
the Chief Financial Officer of the Company from Sep2011. He is responsible for the Treasury Management,Financial Planning & Accounting, Taxation and RegulatoryCompliance. He is a member of the Risk ManagementCommittee and Asset Liability Management of theCompany.
B.Sc. (Statistics), ACA
Sri P. ViswanathanCompany Secretary & Compliance Officer
He has over 40 years of experience in theCompany/Group. He became the Company Secretary andCompliance Officer of the Company from Sep 2011. He isresponsible for statutory compliance in respect of all lawsand regulations applicable to the Company, includingCompany Law, SEBI and RBI. He liaisons with the BoardMembers in connection with all Board related actions inthe Company. He was Chairman of the Expert Committeeon Company law of Madras Chamber of Commerce and
Industry and is a Committee Member of FinanceCompanies Association of India.
B.Com, FCS
Key Managerial Personnel

Disclaimer
This document is for information purposes only and is not and does not form part of an invitation/ offer / advertisement / advise topurchase or sell any securities of the Company.
The materials and information contained in the document are prepared by the Company and are correct and accurate, to the best of ourknowledge. No information contained herein has been independently verified by anyone else or approved by any regulatory authorities.No warranty is given as to their accuracy and the company does not accept any responsibility and shall not be liable for any direct orindirect loss caused, arising from and/or use of this document.
Forward-looking statements, if any, are subject to risks, uncertainties and assumptions that could cause actual results to differ materiallyfrom those contemplated by the relevant statement.
The contents of the website are subject to changes and reviews from time to time without notice. By accessing the site, you are deemedto accept the disclaimerclause.
Shri M RamaswamyChief Financial OfficerSundaram Finance Limited21, Patullos RoadChennai – 600002Phone(D) : 044 – 28881341Mail : [email protected]
Shri P ViswanathanSecretary & Compliance OfficerSundaram Finance Limited21, Patullos RoadChennai – 600002Phone(D) : 044 – 28881207Mail : [email protected]
Recommended


