POLICY PAPER 27/FACT SHEET 37
July 2016
With the adoption of the
Sustainable Development
Goals (SDGs), countries have
promised to achieve universal
completion of primary and
secondary education by 2030.
This paper, jointly released
by the UNESCO Institute
for Statistics (UIS) and the
Global Education Monitoring
(GEM) Report, illustrates the
magnitude of this challenge.
Globally, 263 million children,
adolescents and youth
between the ages of 6 and 17
are currently out of school,
according to a new set of UIS
indicators. A key obstacle
to achieving the target is
persistent disparities in
education participation linked
to sex, location and wealth,
especially at the secondary
level. Selected policy responses
to promote enrolment in
secondary education are
reviewed.
Leaving no one behind: How far on the way to universal primary and secondary education?
The challenge of getting all children and youth into school is immense The new global education goal, SDG 4, covers an ambitious range of targets, including the pledge to ‘ensure that all girls and boys complete free, equitable and quality primary and secondary education leading to relevant and effective learning outcomes’ and to ‘eliminate gender disparities in education and ensure equal access to all levels of education and vocational training for the vulnerable, including persons with disabilities, indigenous peoples and children in vulnerable situations’ by 2030 (United Nations, 2015).
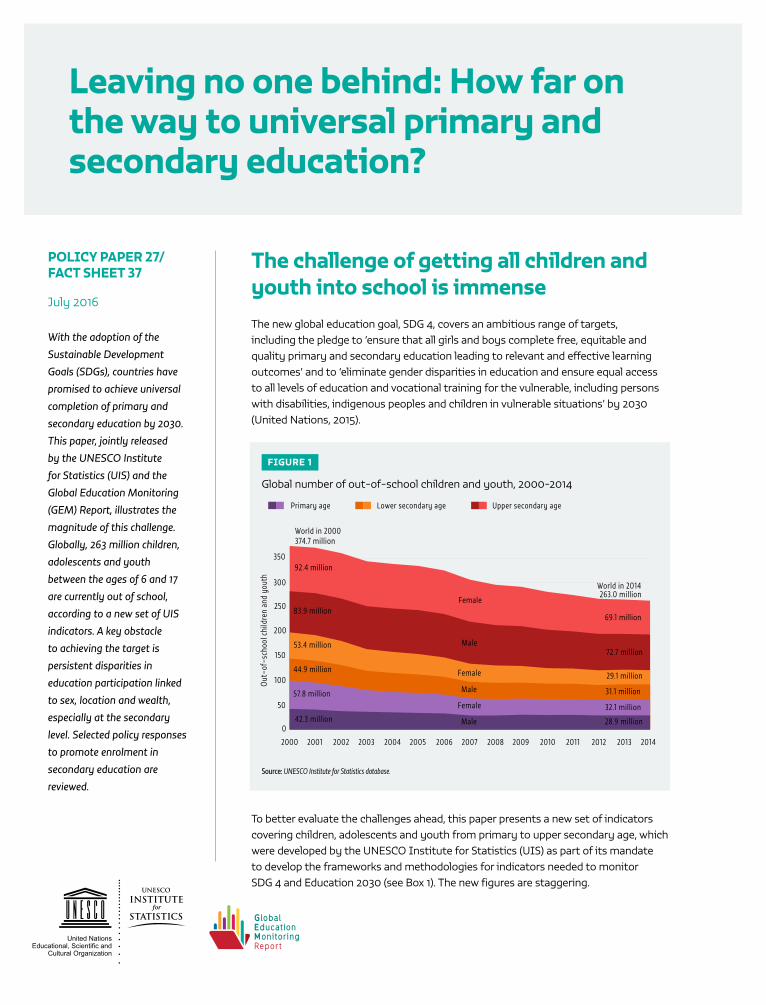
To better evaluate the challenges ahead, this paper presents a new set of indicators covering children, adolescents and youth from primary to upper secondary age, which were developed by the UNESCO Institute for Statistics (UIS) as part of its mandate to develop the frameworks and methodologies for indicators needed to monitor SDG 4 and Education 2030 (see Box 1). The new figures are staggering.
FIGURE 1
Global number of out−of−school children and youth, 2000−2014
Source: UNESCO Institute for Statistics database.
2000 2001 2002 2003 2004 2005 2006 2007 2008 2009 2010 2011 2012 2013 2014
0
50
100
150
200
250
300
350
Out
−of−
scho
ol c
hild
ren
and
yout
h
92.4 million
83.9 million
53.4 million
44.9 million
57.8 million
42.3 million
Female
Male
Female
Male
Female
Male
Primary age Lower secondary age Upper secondary age
374.7 millionWorld in 2000
World in 2014263.0 million
69.1 million
72.7 million
29.1 million
31.1 million
32.1 million
28.9 million

POLICY PAPER 27 / FACT SHEET 37 • Leaving no one behind: How far on the way to universal primary and secondary education? 2
About 263 million children and youth are out of school, according to UIS data. This number includes 61 million children of primary school age (about 6 to 11 years), 60 million young adolescents of lower secondary school age (about 12 to 14 years), and 142 million youth of upper secondary school age (about 15 to 17 years) for the school year ending in 2014.i
As shown in Figure 1, the numbers of excluded children and adolescents fell steadily between 2000 and 2007, but progress has since slowed down. The same trend can be observed in the percentages of out-of-school children, adolescents and youth (Figure 2). Between 2000 and 2007, the primary out-of-school rate fell from 15% to 10%, and declined only to 9% by 2014. The lower secondary out-of-school rate fell from 25% in 2000 to 18% in 2007 and 16% in 2014. Only the upper secondary out-of-school rate declined steadily over the
entire period, from 49% to 37%, a trend mirrored in the evolution of the number of out-of-school youth since 2000. Today, 1 out of 11 primary school age children, 1 out of 6 lower secondary school age adolescents, and 1 out of 3 upper secondary school
age youth are not in school.
Global averages mask gender inequalities
In 2000, 54% of the 375 million out-of-school children, adolescents and youth were female. By 2014, there was virtually no difference in the global rates: 19% of girls of primary and secondary age were out of school, compared to
18% of boys. However, these global averages mask considerable differences at regional and country levels. For example, a closer look at the data shows that girls are more likely to remain excluded from education while out-of-school boys stand a greater chance of eventually entering school.
Youth are more likely to be out of school Out-of-school rates for youth of upper secondary school age are far greater than those for children and adolescents of primary and lower secondary school age. Figure 3 presents the regions of the world sorted by the primary out-of-school rate. Globally, lower-secondary-age adolescents are nearly twice as likely to be out of school (16%) as primary-age children (9%). Upper-secondary-age youth are four times as likely to be out of school (37%) as children of primary school age.
BOX 1
A new generation of data to monitor SDG 4 – Education 2030To help transform the new global education goal into reality, the UIS is responsible for the collection, analysis and dissemination of data needed to monitor progress and better target policies and resources (UNESCO, 2015). Clearly, no single organization can produce all the indicators for SDG 4 and the Education 2030 Agenda. The UIS is therefore working closely with countries and partners to develop standards and methodologies to produce a new generation of cross-nationally comparable education data with a specific focus on learning and equity. To learn more, see the video on Getting Education Data Right and the new series of briefs, Meet the Education 2030 Data (http://on.unesco.org/meet-sdg4-data).
FIGURE 2
Global out−of−school rate, primary and secondary school age, 2000−2014
Source: UNESCO Institute for Statistics database.
Both sexes Male Female
50
40
30
20
10
0
2000 2001 2002 2003 2004 2005 2006 2007 2008 2009 2010 2011 2012 2013 2014
1215
18
2225
28
45
49
52
Out
−of−
scho
ol ra
te (%
)
89
10
16
373738
Upper secondary out−of−school rate
Lower secondary out−of−school rate
Primary out−of−school rate
About 263 million children and youth are out of school

POLICY PAPER 27 / FACT SHEET 37 • Leaving no one behind: How far on the way to universal primary and secondary education? 3
This increase in out-of-school rates with age is found in all regions to varying degrees. In Southern Asia and sub-Saharan Africa, at least half of all youth are not in school. In Southern Asia, youth of upper secondary age are eight times as likely to not be in school as children of primary age.
To correctly interpret these figures, it is important to consider the characteristics that set this age group apart. For example, while primary and lower secondary education are compulsory in nearly all countries, the same is not true for upper secondary education. In addition, youth of upper secondary age are often of legal working age and thus have both a right to employment and a right to education.
Moreover, the indicator does not reflect the activity status or reasons why individuals in each age group fail to participate in education. To
obtain a more detailed picture of their situation, it is necessary to analyse the upper secondary out-of-school rate in combination with labour market data and other sources of information (see page 14). The high upper secondary out-of-school numbers are also a result of the complete lack of education among many youth. In 2005, about 75 million – or 1 out of 9 children of primary age – were out of school (Figure 1). These children are now in the age range of upper secondary education and many have never attended school, highlighting the urgency of achieving universal primary education. While it is important to address the needs of upper-secondary-age youth, it is essential that these efforts not divert resources from primary and lower secondary education. The following sections take a closer look at the data by age group.
FIGURE 3
Out−of−school rate by region and age group, 2014
Note: For Oceania, only the primary out−of−school rate is available and the data refer to 2013. Upper secondary data for the Caucasus and Central Asia refer to 2012.Source: UNESCO Institute for Statistics database.
15 25
3 717
32
85
1437
64
166
824
6 2050
1116
3312
2134
589 16
37
0 10 20 30 40 50
Primary age Lower secondary age Upper secondary age
Northern AfricaEastern Asia
Developed regions
South-Eastern Asia
Caucasus and Central Asia
Latin America and the Caribbean
Southern Asia
Western Asia
OceaniaSub-Saharan Africa
World
Out-of-school rate (%)
Primary out-of-school rates and numbers The global number of out-of-school children of primary school age has remained almost the same for the past five years, according to UIS data. Of the 61 million out-of-school children, 34 million or more than half live in sub-Saharan Africa, due in part to high population growth rates in the region (Table 1). Southern Asia has the second highest number of out-of-school children with 11 million.
Primary out-of-school rates and numbers, 2014
Region
Out-of-school rate (%) Out-of-school number (millions)
Both sexes Male Female Both sexes Male FemaleCaucasus and Central Asia 5.7 5.4 6.1 0.3 0.3 0.2Developed regions 3.1 3.4 2.9 2.3 1.3 1.1Eastern Asia 3.0 3.0 3.0 2.9 1.6 1.4Latin America and the Caribbean 6.0 6.2 5.8 3.6 1.9 1.7Northern Africa 0.9 1.0 0.7 0.2 0.1 0.1Oceania 11.5 8.9 14.3 0.2 0.1 0.1South-Eastern Asia 5.2 5.3 5.1 3.3 1.7 1.6Southern Asia 6.2 5.8 6.8 11.4 5.5 5.9Sub-Saharan Africa 21.2 19.2 23.3 34.2 15.6 18.6Western Asia 10.7 7.8 13.7 2.6 1.0 1.6World 8.9 8.1 9.7 60.9 28.9 32.1
TABLE 1
Note: Data for Oceania refer to 2013. Source: UNESCO Institute for Statist ics database.

POLICY PAPER 27 / FACT SHEET 37 • Leaving no one behind: How far on the way to universal primary and secondary education? 4
Sub-Saharan Africa also has the highest rate of exclusion, with 21% of children of primary school age denied the right to education, followed by Oceania (12%) and Western Asia (11%) (Figure 4). These three regions also have the widest gender gaps. In sub-Saharan Africa, 23% of all girls and 19% of all boys are out of school. In Oceania and Western Asia, the out-of-school rates are 14% (female) and 9% (male), and 14% (female) and 8% (male), respectively.
Six countries are home to more than one-third of all out-of-school children, according to UIS data (Figure 5). Nigeria has 8.7 million out-of-school children of primary age (Figure 5) followed by Pakistan (5.6 million), India (2.9 million), Sudan (2.7 million), Ethiopia (2.1 million) and
Indonesia (2.0 million). Countries with large numbers of children out of school for which precise data are unavailable, such as Afghanistan or the Democratic Republic of the Congo, are not presented. However, estimates for these countries are incorporated into the global figures.
In 2014, areas in 32 countries affected by armed conflict were home to 21.5 million or 35% of the global number of out-of-school children. In addition, 15 million or 25% of out-of-school adolescents of lower secondary age and 26 million or 18% of all out-of-school youth of upper secondary age lived in conflict-affected areas. In Western Asia, the most affected region, 89%
of out-of-school children, adolescents and youth lived in conflict-affected countries. In these countries, conflict is an obstacle to data collection and refugees and internally displaced children, adolescents and youth are often not covered in official statistics (Box 2).
According to current international standards, children of primary school age or older enrolled in pre-primary education are considered out of school. In more than 80% of countries with data, the proportion of primary-age children in pre-primary education is less than 2%. However, in a small number of countries, including Ghana, Kenya and Liberia, up to 1 out of 10 primary-age children are enrolled in pre-primary education.
More girls than boys will never go to school
When assessing the number of children out of school it is important to remember that each of these children has varying exposure to education. Some out-of-school children have attended school in the past but dropped out,
FIGURE 4
Out−of−school rate by region and sex, 2014
Note: Data for Oceania refer to 2013.Source: UNESCO Institute for Statistics database.
Both sexes Male Female
Northern Africa
Eastern Asia
Developed regionsSouth-Eastern Asia
Caucasus and Central Asia
Latin America and the Caribbean
Southern Asia
Western Asia
Oceania
Sub-Saharan AfricaWorld
Out-of-school rate (%)
0 5 10 15 20
11
13333 33
55
56
5 66
66
66
7
811
1412
9 1421
1923
98
10
FIGURE 5
Out−of−school children of primary school age in selected countries, 2014 or latest year
Note: Data for Brazil, India, Syrian Arab Republic, Uganda, United Republic of Tanzania and Yemen refer to 2013. Data for Kenya and Sudan refer to 2012. Data for Angola and South Sudan refer to 2011. Data for Bangladesh and Nigeria refer to 2010.Source: UNESCO Institute for Statistics database.
8.7
Brazil
Out-of-school children (millions)
Indonesia
BangladeshIndia
Pakistan
UgandaAngola
SenegalMozambiqueCôte d'Ivoire
KenyaBurkina FasoSouth Sudan
MaliNiger
United Republic of TanzaniaEthiopia
SudanNigeria
Syrian Arab RepublicYemen
0.9
2.0
0.92.9
5.6
0.50.60.60.7
0.9
1.01.0
1.01.0
1.21.7
2.12.7
0.60.6
0 1 2 3 4 5 6 7 8

POLICY PAPER 27 / FACT SHEET 37 • Leaving no one behind: How far on the way to universal primary and secondary education? 5
some will attend school in the future and some will never go to school. According to UIS estimates, 41% or 25 million of all out-of-school children of primary school age have never attended school and will probably never start if current trends continue. About 20% of these children attended school in the past but could not continue their education, and 39% are likely to start late and will be overage for their grade (Figure 6).
Girls are more likely than boys to remain completely excluded from education, despite the efforts and progress made over the past two decades. According to UIS data, 15 million girls of primary school age will never have the opportunity to learn to read and write in primary school, compared to about 10 million boys.ii
Across sub-Saharan Africa, 9 million girls will never attend school compared to 6 million boys. In total, 34 million children between the ages of 6 and 11 are out of school across the region. One-third of these children will start at a later age, but almost half will remain entirely excluded, with girls facing the biggest barriers.
The gender gap is even wider in Southern Asia, where four out of five out-of-school girls will never enter the formal education system, compared to two out of five out-of-school boys. About 5 million girls compared to 2 million boys are permanently excluded from education. More than half of the 11 million out-of-school children in the region will never enrol. About 12% of out-of-school children began primary school but dropped out and 26% are likely to enter school late.
South-Eastern Asia is the only region where out-of-school boys are more likely than out-of-school girls to never enter school. Girls not in school have the highest proportion of early school leavers among all regions with data.
Challenges also remain for children enrolled in school, as many are at risk of dropping out for various reasons. In Eastern Asia, Northern Africa, South-Eastern Asia and Western Asia, at least one-third of out-of-school children left school early (Figure 6).
Lower secondary out-of-school rates and numbers
The global number of out-of-school adolescents of lower secondary school age (60 million) is nearly identical to the number for primary school age. However, the global lower secondary out-of-school rate (16%) is twice as high as the primary out-of-school rate. The large majority of these adolescents live in two regions: sub-Saharan Africa (24 million) and Southern Asia (21 million). Eastern and South-Eastern Asia combined account for another 8 million out-of-school adolescents (Table 2).
The regions with the highest percentages of out-of-school adolescents are sub-Saharan Africa (34%), Southern Asia (20%), Western Asia (16%) and South-Eastern Asia (14%) (Figure 7). At the global level, male and female out-of-school rates are identical, but this average hides differences between regions. In Western Asia, 20% of adolescent girls remain excluded from education compared to 13% of boys. In sub-Saharan Africa, the female rate is 36% compared to 32% for males. To a lesser extent, boys face a disadvantage in Latin America and the Caribbean, South-Eastern Asia and Southern Asia.
BOX 2
Missing: Refugees and internally displaced children not reflected by global dataEstimates of the global number of out-of-school children and youth would most likely increase if more reliable data were available for forcibly displaced children and youth. Worldwide there are approximately 20 million refugees and more than 30 million internally displaced persons, half of which are estimated to be under the age of 18. Little is known of the educational needs and current provision of educational services for the children of refugees. At best, only partial evidence is available – barely enough to confirm the dire situation but insufficient to provide a more precise global number of children and youth excluded from education.
The United Nations High Commissioner for Refugees (UNHCR) estimates that half of refugees of primary school age and three-quarters of refugees of secondary school age are not in school (UNESCO and UNHCR, 2016). But this estimate is based on incomplete information due to conditions on the ground. In the case of the Syrian Civil War, at least 50 different stakeholders across the region are trying to provide education services to displaced children, including ministries of education, international organizations and civil society organizations (http://data.unhcr.org/syrianrefugees/regional.php).
In some contexts, refugees are integrated into national education systems, but in others they are excluded, depending on their nationality. Moreover, refugees and internally displaced persons are mobile, making it difficult to track their education over time across different systems. Despite these difficult conditions, UNHCR is trying to steadily integrate refugee children into national education systems. This marks a positive step forward, but continued tracking of educational progress is crucial to target ongoing support to students and their families.

POLICY PAPER 27 / FACT SHEET 37 • Leaving no one behind: How far on the way to universal primary and secondary education? 6
For this age group, the countries with the largest out-of-school populations are India (11.1 million), Pakistan (5.5 million), Ethiopia (3.6 million), Bangladesh (2.2 million), and Indonesia and Myanmar (1.9 million each) (Figure 8). However, the picture is incomplete because some countries with a large number of out-of-school children of primary school age – including Kenya, Nigeria, South Sudan and United Republic of Tanzania – are unable to report reliable data for adolescents of lower secondary school age. When examining these figures, it is important to note that many young people in this
age group who are in school are not attending lower secondary education. Of the 84% of lower-secondary-age adolescents in formal education worldwide, nearly one-fifth are in primary education, often due to late
FIGURE 6
School exposure of out−of−school children of primary school age by region, 2014
Note: No data are available for Oceania.Source: UNESCO Institute for Statistics database.
0
Sub-Saharan Africa
Southern Asia
Latin America and the Caribbean
South-Eastern Asia
Eastern Asia
Western Asia
Developed regions
Caucasus and Central Asia
Northern Africa
World
MFMF
MFMF
MFMF
Left school Likely to enter school in the future
Unlikely to ever enter school
Out-of-school children (millions)
0 20 40 60 80 100%
171817
3742
33
4541
50
1214
26
1044
9
6242
81
1723
11
7167
75
1210
14
840
7651
35
5141
17
25
7
3932
48
4453
33
1715
19
4862
40 31
3131
29
217
1411
17
8183
78
565
121112
6978
61
2011
27
2834
15 60
5146
2220
25
2019
21
3947
32
4135
47
34.215.6
18.6
11.45.55.9
3.61.91.7
3.31.71.6
2.91.61.4
2.61.01.6
2.31.31.1
0.30.20.2
0.20.10.1
60.928.9
32.1
FIGURE 7
Lower secondary out−of−school rate by region and sex, 2014
Note: Male and female data for Developed regions refer to 2013. Male and female data for the Caucasus and Central Asia refer to 2010.Source: UNESCO Institute for Statistics database.
Out-of-school rate (%)
Northern Africa
Eastern Asia
Developed regions
South-Eastern Asia
Caucasus and Central Asia
Latin America and the Caribbean
Southern Asia
Western Asia
Both sexes
Sub-Saharan Africa
World
Male Female
0 5 10 15 20 25 30
222
44
5556
777
88
714
1513
1613
2020
2118
3432
161616
36
MFMF
MFMF
MFMF
MFMF
MFMF
MFMF
MFMF
MFMF
MFMF
MFMF
MFMF
MFMF
MFMF
MFMF
MFMF
MFMF
MFMF
35

POLICY PAPER 27 / FACT SHEET 37 • Leaving no one behind: How far on the way to universal primary and secondary education? 7
entry. Overage enrolment is especially widespread in sub-Saharan Africa, where on average about half of all pupils of lower secondary age are enrolled in primary school.
Upper secondary out-of-school rates and numbers
Out-of-school rates and numbers are far higher among youth of upper secondary age than younger cohorts. In total, 142 million upper-secondary-age youth were not in school in 2014, 21 million more than the combined number of out-of-school children and adolescents of primary and lower secondary age (Table 3). Out of these, 69 million live in Southern Asia, 35 million in sub-Saharan Africa, 10 million in South-Eastern Asia, 9 million in Eastern Asia and 8 million in Latin America and the Caribbean.
From a regional perspective, 58% of all youth between the ages of about 15 and 17 are out of school in sub-Saharan Africa, followed by Southern Asia (50%), South-Eastern Asia (37%) and Western Asia (33%) (Figure 9). Only the developed regions have a relatively low out-of-school rate, but even here where the upper secondary level is largely considered part of compulsory education, 8% of youth are not in school.
Gender disparities vary by region. Overall, young women face greater gender barriers than young men. Young women are more likely to be out of school in the Caucasus and Central Asia, Northern Africa, Southern Asia, sub-Saharan Africa and Western Asia. Young men face a disadvantage in the developed regions, Eastern Asia, and Latin America and the Caribbean.
Southern Asia has the largest number of out-of-school youth, due mainly to three countries. In India, 47 million youth of upper secondary age are not in school, representing nearly half of the population for
Lower secondary out-of-school rates and numbers, 2014
Region
Out-of-school rate (%) Out-of-school number (millions)
Both sexes Male Female Both sexes Male FemaleCaucasus and Central Asia 4.4 3.7 4.6 0.3 0.1 0.2Developed regions 2.1 2.2 2.0 1.0 0.5 0.5Eastern Asia 6.6 6.6 6.6 3.2 1.7 1.5Latin America and the Caribbean 7.7 8.0 7.3 2.8 1.5 1.3Northern Africa 5.4 5.2 5.7 0.5 0.3 0.3OceaniaSouth-Eastern Asia 14.2 15.2 13.1 5.1 2.8 2.3Southern Asia 19.6 21.4 17.7 20.7 11.8 8.9Sub-Saharan Africa 34.1 31.8 36.5 24.3 11.4 12.8Western Asia 16.5 13.1 20.0 2.5 1.0 1.5World 16.0 16.0 16.0 60.2 31.1 29.1
Note: Male and female data for Caucasus and Central Asia refer to 2010. Male and female data for developed regions refer to 2013. No data are available for Oceania. Source: UNESCO Institute for Statist ics database.
TABLE 2
FIGURE 8
Out−of−school adolescents of lower secondary age in selected countries, 2014 or latest year
Note: Data for Brazil, Burkina Faso, India, and Syrian Arab Republic refer to 2013. Data for Ethiopia, Mexico, Sudan, and Yemen refer to 2012. Data for Bangladesh and Uganda refer to 2010.Source: UNESCO Institute for Statistics database.
Out−of−school adolescents (millions)
BrazilMexico
MyanmarIndonesia
AfghanistanBangladesh
PakistanIndia
Syrian Arab Republic
Ethiopia
GuineaMali
Uganda
CameroonMozambique
Niger
Yemen
0.71.0
1.9
0.9
0.5
0.8
1.23.6
1.00.7
0 1 2 3 4 5 6 7 8
Sudan
1.9
2.25.5
0.70.6
0.7
9 10 11
0.80.9
11.1
Burkina Faso

POLICY PAPER 27 / FACT SHEET 37 • Leaving no one behind: How far on the way to universal primary and secondary education? 8
that age group. Pakistan (10 million) and Bangladesh (8 million) also have large out-of-school populations (Figure 10). Some countries with large out-of-school numbers for younger age groups are not represented, including Ethiopia, Nigeria and Sudan, due to lack of data. Over-age enrolment is also common among pupils of upper secondary school age. Approximately one-quarter of the 63% of upper-secondary-age youth enrolled in school worldwide are in primary or lower secondary education, due to late entry, repetition or a combination of the two. Interventions designed to reduce the out-of-school rate must therefore be combined with efforts to ensure that all children start school on time, that repetition is minimized, and that every child completes primary, lower secondary and upper secondary education.
Disparities in school attendance increase from primary to secondary educationInclusion is central to the 2030 Agenda for Sustainable Development: no goal will be considered met unless it has been met by everybody. This point is reiterated by the 2016 meeting of the High Level Political Forum, which will commence implementation of a global follow-up and review mechanism for the SDGs.
Achieving a target on average is not sufficient. While gender parity in secondary school enrolment has been achieved globally, almost one in two countries fail to achieve parity, underlining the need to examine data from different angles.
Governments have committed to measure disparities between different population groups defined by region, ethnicity, language, disability or any other potential marker of disadvantage. At the global level, options are more limited as data currently exist on only three individual characteristics comparable across countries: sex,
FIGURE 9
Upper secondary out−of−school rate by region and sex, 2014
Note: Data for the Caucasus and Central Asia refer to 2013.Source: UNESCO Institute for Statistics database.
Out-of-school rate (%)
Northern Africa
Eastern Asia
Developed regions
South-Eastern Asia
Caucasus and Central Asia
Latin America and the Caribbean
Southern Asia
Western Asia
Sub-Saharan Africa
World
89
716
1023
17
1221
2425
2325
2427
3330
35373737
373738
5049
5158
5561
0 10 20 30 40 5060
Both sexes Male Female
Region
Out-of-school rate (%) Out-of-school number (millions)
Both sexes Male Female Both sexes Male FemaleCaucasus and Central Asia 16.2 16.9 15.5 0.6 0.3 0.3Developed regions 7.9 8.5 7.3 3.4 1.9 1.5Eastern Asia 17.0 21.2 12.4 9.0 5.9 3.1Latin America and the Caribbean 23.9 24.9 22.8 7.6 4.0 3.6Northern Africa 25.2 23.8 26.6 2.4 1.1 1.2OceaniaSouth-Eastern Asia 36.7 36.8 36.5 10.4 5.3 5.1Southern Asia 49.9 48.7 51.2 68.7 35.1 33.7Sub-Saharan Africa 57.7 54.6 60.8 34.8 16.7 18.1Western Asia 32.6 29.8 35.5 4.4 2.1 2.4World 37.2 36.9 37.5 141.8 72.7 69.1
Note: Data for Caucasus and Central Asia refer to 2012. No data are available for Oceania. Source: UNESCO Institute for Statist ics database.
Upper secondary out-of-school rates and numbers, 2014
TABLE 3

POLICY PAPER 27 / FACT SHEET 37 • Leaving no one behind: How far on the way to universal primary and secondary education? 9
location and wealth – and their combinations (for a new initiative on harmonizing indicators related to inequalities, see Box 3).
These dimensions present striking inequalities, emphasizing the extent of the work needed to achieve equal access to all levels of education for vulnerable populations by 2030 – the focus of Target 4.5 in the new agenda.
Large disparities in education attendance by wealth highlight the challenges ahead
The Inter-agency and Expert Group on SDG Indicators has proposed the parity index as the global measure to monitor Target 4.5 on inequality in
education. The parity index is the ratio between the indicator values of two groups. It ranges from 0 (extreme inequality at the expense of one group) over 1 (parity) to infinity (extreme inequality at the expense of the other group). The index will be monitored for each of three characteristics: sex, location and wealth. For example, if 50% of the poorest and 100% of the richest children attend school, then the wealth parity index of the attendance rate is 0.50. Parity is considered achieved if the index is between 0.97 and 1.03.
This measure was proposed primarily because it is the easiest to communicate and has been effective in describing gender disparities over the past two decades.
Among children of primary school age in five world regions, wealth parity in terms of school attendance exists only in Latin America and the Caribbean, and is close to achievement in Eastern and South-Eastern Asia. In Northern Africa and Western Asia, and Southern Asia, the wealth parity index is just over 0.90, while in sub-Saharan Africa it is only 0.65 (Figure 11).
Disparities widen in school attendance for adolescents of lower secondary and youth of upper secondary school age in particular. In Eastern and South-Eastern Asia, the wealth parity index is 0.89 among adolescents of lower secondary school age, but only 0.63 among youth of upper secondary school age. Among the latter group, the lowest parity index
BOX 3
Measuring equity with disaggregated data for the SDGsMany indicators for monitoring SDG 4 are meant to be disaggregated by sex, location, household wealth, disability status, and other personal and household characteristics. In response to this call for a greater focus on equity and data disaggregation in the SDGs, the UIS together with UNICEF, the World Bank and other partners established the Inter-agency Group on Education Inequality Indicators (IAG-EII) in 2016.
The main objective of the IAG-EII is to generate consensus and promote common methodologies related to the production and use of household survey data for monitoring education targets at the global, regional and national level. It aims to harmonise approaches for use in the analysis and reporting of indicators. The IAG will help to complement evidence available through administrative data and increase the visibility of population groups not presently reflected in official statistics. An additional benefit will be the growing legitimacy of equity-related survey-based indicators to serve the 2030 education agenda, with a particular emphasis on the use of such data by countries.
FIGURE 10
Out−of−school youth of upper secondary age in selected countries, 2014 or latest year
Note: Data for Ghana and Nepal refer to 2015. Data for Brazil, Burkina Faso, India, Syrian Arab Republic, Turkey and Zimbabwe refer to 2013. Data for Kenya, Mexico, Morocco, and Yemen refer to 2012. Data for Angola, Bangladesh, and Uganda refer to 2010. Source: UNESCO Institute for Statistics database.
BrazilMexico
MoroccoEgypt
MyanmarMalaysia
Indonesia
Nepal
Syrian Arab Republic
Uganda
Guinea
Mali
Zimbabwe
Cameroon
MozambiqueNiger
Angola
Ghana
Burkina Faso
Iran (Islamic Republic)
BangladeshPakistan
India
Kenya
TurkeyYemen
1.83.0
0.81.1
1.01.2
4.0
1.01.11.2
7.810.4
46.8
0.50.60.70.70.70.80.80.90.91.01.1
0.90.91.1
0 105 15 20 25 30 35 4045
Out−of−school youth (millions)
Afghanistan

POLICY PAPER 27 / FACT SHEET 37 • Leaving no one behind: How far on the way to universal primary and secondary education? 10
value was observed in sub-Saharan Africa (0.55).
Gender disparities differ for poor and rich children and adolescents
Gender disparities in education participation have decreased significantly since 2000, with rapid convergence towards parity at the global level. However, this masks two opposing trends. The first concerns differences across individual countries, particularly in secondary education, where large disparities exist at the expense of females in poorer countries and at the expense of males in richer countries.
The second less-recognized trend concerns the difference in gender balance within countries between the poorest and richest children, adolescents and youth. For all regions reviewed here, except sub-Saharan Africa, the richest enjoy gender parity in education attendance for youth of primary,
lower secondary and upper secondary school age.
However, among the poorest there are large disparities at the expense of girls in three of the five regions, which increase at higher education levels (Figure 12). For example, in Northern Africa and Western Asia, there is gender parity in attendance for children of primary school age, but the gender parity index falls sharply to 0.85 for adolescents of lower secondary school age and to 0.77 for youth of upper secondary school age.
Disparities affect various aspects of education participation
Disparities affecting participation in education also occur at the transition from primary to lower secondary and then to upper secondary education. These occur for different reasons. For example, the probability of starting
FIGURE 11
Wealth parity index for three indicators of participation in education, by region, 2008–2014
Note: Only low- and middle-income countries in the respective regions are included in the calculations. Source: GEM Report team analysis using household surveys.
Primary age Lower secondary age Upper secondary age0.5
0.6
0.7
0.8
0.9
1.0
Wea
lth p
arity
inde
x
Parity
Latin America and the Caribbean
Southern Asia
Eastern and South-Eastern Asia
Northern Africa and Western Asia
Sub-Saharan Africa
FIGURE 12
Gender parity index for three indicators of participation in education among the poorest and richest females and males, selected regions, 2008–2014
Note: Only low- and middle-income countries in the respective regions are included in the calculations.Source: GEM Report team analysis using household survey.
0.6
0.7
0.8
0.9
1.0
1.1
In s
choo
l (pr
imar
y ag
e)
In s
choo
l (lo
wer
sec
onda
ry a
ge)
In s
choo
l (up
per s
econ
dary
age
)
Sub-Saharan Africa Northern Africa and Western Asia
Southern Asia Latin America and the Caribbean
Eastern and South-Eastern Asia
Poorest
Richest
Parity
Gend
er p
arity
inde
x
In s
choo
l (pr
imar
y ag
e)
In s
choo
l (lo
wer
sec
onda
ry a
ge)
In s
choo
l (up
per s
econ
dary
age
)
In s
choo
l (pr
imar
y ag
e)
In s
choo
l (lo
wer
sec
onda
ry a
ge)
In s
choo
l (up
per s
econ
dary
age
)
In s
choo
l (pr
imar
y ag
e)
In s
choo
l (lo
wer
sec
onda
ry a
ge)
In s
choo
l (up
per s
econ
dary
age
)
In s
choo
l (pr
imar
y ag
e)
In s
choo
l (lo
wer
sec
onda
ry a
ge)
In s
choo
l (up
per s
econ
dary
age
)(In school)

POLICY PAPER 27 / FACT SHEET 37 • Leaving no one behind: How far on the way to universal primary and secondary education? 11
school on time or the probability of repeating a grade affect whether students are the right age for their grade. These factors in turn affect the probability that they will continue their education.
In all five regions reviewed, the wealth parity index indicates disparity at the expense of the poorest adolescents (Figure 13). Such disparities are generally stronger in the transition from lower to upper secondary education.iii In Latin America and the Caribbean, the wealth parity index was 0.88 for the transition from primary to lower secondary education and 0.81 for the transition from lower to upper secondary education. Eastern and South-Eastern Asia has the lowest disparity for the transition to lower secondary education, but the second highest disparity for transition to upper secondary education.
Over-age attendance risks reducing participation in secondary education
Being over-age as a result of late entry to school and/or repetition is strongly linked to leaving school, especially at secondary level. Over-age attendance is a particular concern for girls’ education in some countries. The percentage of students at least two years older than their grade is already high from the first grade, but increases as students repeat and fall further behind. However, in Ghana the percentage of over-age girls was 57% among grade 5 students, but only 50% among grade 8 students. In Malawi, it was 51% in grade 6, but 34% in grade 8, while the percentage of over-age boys remained the same or even increased. Since students rarely skip grades, this suggests that those over-age are more likely to drop out (Figure 14a).
Household surveys also provide other characteristics of over-age students, and tend to show that late entry is more common among poor households. For example, in Haiti, 36% of the poorest 60% of students, but only 21% of the richest 40%, entered primary school at least two years later than the official school entrance age in 2012. The size of the gap doubles by grade 4, when 75% of the poorest students are over-age, making them more likely to repeat school and fall behind (Figure 14b).
In Swaziland, the gap on entry into primary school between the poorest and richest children is not significant. However, it increases rapidly by grade 5 at which point 54% of the poorest 60% are over-age, compared with 30% of the richest 40%. From grade 6 onwards, the share of the over-age among the poorest begins to decrease, suggesting that they are more likely to leave school.
FIGURE 13
Wealth parity index of the transition rate to lower and upper secondary education, selected regions, 2008–2014
Note: See endnote (iii). Only low- and middle-income countries in the respective regions are included in the calculations.Source: GEM Report team analysis using household surveys.
Parity
0.9
0.8
0.7
South-Eastern Asia
Southern Asia Latin America and the Caribbean
Northern Africa and Western Asia
Sub-Saharan Africa
Transition rate into lower secondary Transition rate into upper secondary
Wea
lth p
arity
inde
x
1 .0

POLICY PAPER 27 / FACT SHEET 37 • Leaving no one behind: How far on the way to universal primary and secondary education? 12
Responding to the challenge of getting all adolescents and youth into secondary schoolThe effort to get all adolescents and youth into secondary education by 2030 represents an extraordinary challenge. According to the Global Education Monitoring Report team, US$39 billion will be needed every year to fill the funding gap and achieve this target in low and lower-middle-income countries (UNESCO, 2015).Several policy options could take countries closer to the target. These include measures to increase supply, notably classroom construction and improvements in school infrastructure related to water, sanitation and accessibility, as well as measures to increase demand, such as removal of fees, unconditional and conditional cash transfers, scholarships or ease of restrictions to progression.
The following sections highlight four policy options with particular relevance to secondary education: (i) extending the coverage of compulsory education to at least nine years and beyond; (ii) raising the minimum age for admission to employment and enforcing the implementation of conventions on child labour; (iii) providing financial support to poor families to cover the direct and indirect costs of schooling; and (iv) making secondary education more relevant to young people.
Extending compulsory education to nine years and beyond
The Education 2030 Framework for Action called on countries to ‘ensure the provision of 12 years of free, publicly funded, equitable quality primary and secondary education, of which at least nine years are compulsory’. While most countries provide at least nine years of compulsory primary and secondary education, upper secondary education is not compulsory in many countries, especially in Africa and Asia (Figure 15).
FIGURE 14
Percentage of students who are overage
Source: GEM Report team analysis using DHS and MICS surveys.
a. By grade and sex, Ghana 2011 and Malawi 2010 b. By grade and wealth, Haiti 2012 and Swaziland 2010
0
10
20
30
40
50
60
70
80
0
10
20
30
40
50
60
70
80
1 2 3 4 5 6 7 8 1 2 3 4 5 6 7 8 1 2 3 4 5 6 7 8 9 1 2 3 4 5 6 7 8 9
Male
Female
Poorest 60%
Richest 40%
Ghana Malawi Haiti Swaziland
Stud
ent a
t lea
st tw
o ye
ars
olde
r tha
n of
ficia
l age
for g
rade
(%)
Stud
ent a
t lea
st tw
o ye
ars
olde
r tha
n of
ficia
l age
for g
rade
(%)

POLICY PAPER 27 / FACT SHEET 37 • Leaving no one behind: How far on the way to universal primary and secondary education? 13
Extending compulsory schooling laws has historically proven effective in high-income countries, especially for disadvantaged individuals. An analysis of 12 European countries, including Belgium, Ireland and Spain, showed that an increase in compulsory education by one year increased attainment by 0.4 years for females and 0.3 years for males at the bottom 10% in terms of ability. The impact of compulsory schooling laws on educational attainment remained significant for females across the ability scale (Brunello et al., 2009).
In Turkey, the extension of compulsory schooling from five to eight years in 1997 increased the number of years of schooling attained at age 17 by about 1.3 years for rural men and about 1.5 years for rural women. The policy reduced the urban-rural gap in completed years of schooling at age 17 by 0.5 years for men and 0.7 to 0.8 years for women (Kirdar et al., 2015).
However, reforms to extend compulsory education can be limited by high-stakes assessments at the end of the primary and lower secondary education cycle designed to certify and select students to continue to the next cycle. In some countries, such exams have contributed to increased grade repetition and lower levels of transition to higher education levels. In the United Republic of Tanzania, for example, fewer than half of grade 7 children passed the Primary School Leaving Examination in 2010. Only 41% of those who reached the last grade of primary school in 2009 made the transition to secondary education (UNICEF, 2011). To smooth the transition to secondary school, some countries have abolished examinations at the end of the primary and lower secondary cycle. In the Gambia, where examinations at the end of primary education were discontinued in 2002, enrolment in lower secondary education increased from 44% in 2002 to 63% in 2004 (UNESCO, 2012). Similarly, Fiji phased out standardized examinations at the end of lower secondary education in 2010 (Fiji Government, 2010). This partly explains the increase in survival to the last grade of lower secondary from 79% to 87% between 2008 and 2012, as well as the increase in the upper secondary enrolment rate by nearly 10 percentage points from 54% to 63% over this period.
Addressing the challenge of working children, adolescents and youth In 2012, the International Labour Organization (ILO) put the number of child labourers aged 5–17 at 168 million, a significant decline from 246 million in 2000.iv Combining work and school, while an improvement over
FIGURE 15
Duration of compulsory education (excluding pre-primary education), 2014
Note: The depiction and use of boundaries and related data shown on this map are not warranted to be error free nor do they necessarily imply official endorsement or acceptance by UNESCO.Source: UNESCO Institute for Statistics.
No compulsory education
5-6 years 7-8 years 9-10 years 11-13 years No data

POLICY PAPER 27 / FACT SHEET 37 • Leaving no one behind: How far on the way to universal primary and secondary education? 14
non-attendance, still hurts eventual educational attainment and learning outcomes. The more hours children and adolescents work per week, the more likely they are to lag behind.
Age-for-grade data show that children who work and attend school lag behind their non-working peers in terms of grade progression at age 13 in many countries. This is likely due to repetition arising from poorer performance, higher incidence of late entry and higher absenteeism (Understanding Children’s Work, 2015).
The availability and enforcement of legislation can reduce child labour and improve education outcomes. At present, 168 countries have ratified the 1973 Minimum Age Convention of the ILO and 179 countries have ratified the 1999 ILO Worst Forms of Child Labour Convention. A study using data from the Trends in International Mathematics and Science Study (TIMSS) showed that the negative link between student employment and academic performance was smaller among students whose countries had ratified the ILO Minimum Age Convention by the year they began their schooling, probably due to labour protection in these countries (Byun et al., 2014).
Governments committed to ensuring that all adolescents and youth complete secondary education need to monitor trends in child labour, including through learning assessments. An expansion of technical support to national statistical offices or other government bodies would also help to establish reliable country-level mechanisms to monitor the evolution of child labour and its impact on schooling.
Providing generous incentives for poor adolescents and youth to continue their education On paper, most countries provide free secondary education. However, indicators based on legal and policy documents have limitations. Even when fees are abolished, families are still burdened with multiple costs. The share of total education expenditure borne by households at each education level is a stronger indication of the extent to which education is free. Social protection programmes, such as cash transfers, family or child allowances, have been used to reduce direct and opportunity costs for vulnerable children and prevent them from having to work (Bruns et al., 2012; Evans et al., 2009).
FIGURE 16
Percentage of children, adolescents and youth by schooling and employment status, selected countries, circa 2000 and 2010
Source: Understanding Children’s Work (2015).
Only employment
100
80
60
40
20
0
2001
20
11
2000
20
10
2000
20
10
2000
20
11
2000
20
10
2004
20
11
2000
20
11
2001
20
11
2000
20
11
2001
20
11
2001
20
11
2001
20
11
Cam
eroo
n
Buru
ndi
Sier
ra L
eone
Sene
gal
Togo
Mal
awi
Guat
emal
a
Colo
mbi
a
Viet
Nam
El S
alva
dor
Braz
il
Ecua
dor
2001
20
11
2000
20
10
2000
20
10
2000
20
10
2000
20
11
2000
20
11
2001
20
11
2006
20
11
2000
20
11
2004
20
11
2003
20
19
2001
20
11
2001
20
11
2001
20
11
2001
20
11
2001
20
10
Cam
eroo
n
Togo
Sier
ra L
eone
Buru
ndi
Sene
gal
Viet
Nam
Colo
mbi
a
Ugan
da
Guat
emal
a
Mal
awi
Boliv
ia
Colo
mbi
a
El S
alva
dor
Braz
il
Indo
nesi
a
Ecua
dor
Children aged 7 to 11 Adolescents aged 12 to 14 Youth aged 15 to 17
Neither employment nor schooling Employment and schooling Only schooling
POLICY PAPER 27 / FACT SHEET 37 • Leaving no one behind: How far on the way to universal primary and secondary education? 15
There has been a clear increase in social protection programmes with education-related objectives. Out of 94 social protection programmes with information on age or grade-level targeting, 55% were directed at both primary and secondary school age children, 24% explicitly targeted primary school children, and 20% explicitly targeted secondary school-age adolescents and youth. Many programmes have increased their emphasis on the older age group. For instance, the highest age of eligibility for the child support grant in South Africa, first introduced in 1998, was extended from 7 years to 14 years, 15 years and ultimately 18 years following strong civil society campaigns (Garcia-Jaramillo and Maranti, 2015).
Cash transfers to vulnerable households are often conditional on school attendance. Flagship programmes in middle-income countries such as Brazil, Colombia, Mexico and the Philippines now reach over 50% of poor households (Stampini and Tornarolli, 2012; Chaudhury et al., 2013). Programmes in low-income countries, especially in sub-Saharan Africa, have also expanded, but are typically smaller in scale and tend to provide unconditional grants (Garcia and Moore, 2012; Gentilini et al., 2014).
Many programmes that target primary and secondary school-age children tend to have a larger impact on secondary than primary school attendance (Independent Evaluation Group, 2011). For example, the Bolsa Familia programme in Brazil reduced dropout rates by 7.8 percentage points. The equivalent programme in Colombia helped increase secondary school attendance by 17.5 percentage points for rural adolescents and 7.8 percentage points for urban adolescents – and eventually heightened the probability of graduation, especially for girls (Garcia-Jaramillo and Maranti, 2015).
Making secondary education more attractive to disadvantaged youth The disconnect between what students are taught and what they perceive as relevant for their lives can reduce their interest in education. More diversified secondary education curricula reflecting wider student interests can help keep youth in education. The European Commission’s Working Group on School Policy (2014–2015) recommended ‘engaging and relevant curricula’ as a key mechanism to prevent early school leaving, with an emphasis on curricula that allow more learner-centred approaches and collaborative teaching and learning (European Commission, 2015).
Curriculum diversification should not occur at the expense of foundation skills essential for success in the job market and schooling. A core curriculum at lower secondary education can empower all learners with the necessary skills – an approach adopted by many countries around the world. For example, Botswana reformed its basic education system to ensure a core curriculum for all lower secondary students, including subjects such as languages, sciences, agriculture and technology (UNESCO, 2012). In contrast, tracking lower secondary school-age students by academic and vocational programmes seems to have a negative impact on completion rates (European Commission/EACEA/Eurydice/Cedefop, 2014).
In order to benefit from secondary level curricula, students must possess the necessary skills from previous education stages. Due to the poor quality of previous schooling or education interruptions, many disadvantaged students enter secondary education with learning deficits that hinder learning, reduce motivation and push them to drop out. More personalized support or counselling can help such students catch up with their more privileged peers and fully participate in secondary schooling. In South Africa, IkamvaYouth, a non-profit organization, provides tutoring to disadvantaged students through peer-to-peer learning. In 2015, it covered 11 townships and about 1,400 students. A survey of alumni indicated that they are five times more likely to complete secondary school and hold a tertiary-level qualification than their peers (Spaull, 2015; IkamvaYouth, 2016). In Portugal, the Educational Territories of Priority Intervention Programme (Territórios Educativos de Intervenção Prioritária, TEIP) aims to minimize the risk of early leaving among disadvantaged students through a diversified programme that includes tutorials and additional learning time within targeted schools. In 2011/12, more than two-thirds of TEIP schools had dropout rates lower than the national average and over 99% of TEIP students did not interrupt their school progression following basic education. The programme covered 16% of schools in 2014 (ICF, 2013; European Commission, 2015b).

Leaving no one behind: How far on the way to universal primary and secondary education? 16
No more broken promises The numbers are staggering – 263 million children, adolescents and youth are excluded from education. More than half of all excluded children and youth are between the ages of 15 and 17. While it is essential to meet their specific needs, every stakeholder must ensure that resources are not diverted from primary and lower secondary education, and that interventions needed to reach the most marginalized children obtain the necessary financing. The international community cannot break yet another promise and deny children their basic human right to education: currently 25 million children are expected to never attend school. It is essential to bridge the annual financing gap needed to provide 12 years of quality education to all children and youth, including marginalized groups. There are no shortcuts.
UNESCO Institute for Statistics (UIS)C.P. 6128 Succursale Centre-villeMontreal, Quebec H3C 3J7 CanadaTel: +1-514-343-6880Fax: +1-514-343-5740Email: [email protected]://www.uis.unesco.org
The UIS is the o�cial source of education data used to monitor SDG 4-Education 2030. The UNESCO eAtlas of Out-of-School Children lets you explore the data with interactive maps at http://on.unesco.org/oosc-map.
Go straight to the source of the data at http://www.uis.unesco.org
Global Education Monitoring Report c/o UNESCO 7, place de Fontenoy 75352 Paris 07 SP, France Email: [email protected] Tel: +33 (1) 45 68 07 41 Fax: +33 (1) 45 68 56 41 www.unesco.org/gemreport
Developed by an independent team and published by UNESCO, the Global Education Monitoring Report is an authoritative reference that aims to inform, in�uence and sustain genuine commitment towards the global education targets in the new Sustainable Development Goals (SDGs) framework.
© UNESCO ED/GEMR/MRT/2016/PP/27 REV4
i The average school ages corresponding to each level of education are based on data for individual countries. ii The UIS produces annual data on the number of out-of-school children and estimates concerning their likelihood to start school in the future. It is important to note that the numbers of girls and boys likely to remain excluded from education can vary considerably from year to year due to fluctuations in underlying population estimates. iii The transition rate is calculated as a ratio of two completion rates. For example, the transition rate to lower secondary education is calculated as the first grade of lower secondary school completion rate
age of entry in the first grade of lower secondary education) divided by the last grade of primary school completion rate (among those aged 3 to 5
grade of primary education). iv Child labour refers to work undertaken by childrenbelow the appropriate legal minimum working age, based on the ILO Minimum Age Convention, 1973 (No. 138), as well as the worst forms of child labour defined by the Worst Forms of Child Labour Convention, 1999 (No. 182).
References to this policy paper can be found here: https://en.unesco.org/gem-report/sites/gemreport/files/LeavingNoOneBehindReference.pdf
Recommended