
AFRL-AFOSR-VA-TR-2016-0188
Measurement and control of attosecond pulses
Paul CorkumNATIONAL RESEARCH COUNCIL OF CANADA
Final Report05/05/2016
DISTRIBUTION A: Distribution approved for public release.
AF Office Of Scientific Research (AFOSR)/ RTB1Arlington, Virginia 22203
Air Force Research Laboratory
Air Force Materiel Command

REPORT DOCUMENTATION PAGE Form Approved OMB No. 0704-0188
The public reporting burden for this collection of information is estimated to average 1 hour per response, including the time for reviewing instructions, searching existing data sources, gathering and maintaining the data needed, and completing and reviewing the collection of information. Send comments regarding this burden estimate or any other aspect of this collection of information, including suggestions for reducing the burden, to the Department of Defense, Executive Service Directorate (0704-0188). Respondents should be aware that notwithstanding any other provision of law, no person shall be subject to any penalty for failing to comply with a collection of information if it does not display a currently valid OMB control number.
PLEASE DO NOT RETURN YOUR FORM TO THE ABOVE ORGANIZATION. 1. REPORT DATE (DD-MM-YYYY)
25-04-2016 2. REPORT TYPE
Final 3. DATES COVERED (From - To)
Dec 15, 2012 - Dec 14, 2015
4. TITLE AND SUBTITLE Measurement and Control of Attosecond Pulses
5a. CONTRACT NUMBER
5b. GRANT NUMBER
FA9550-13-1-0010
5c. PROGRAM ELEMENT NUMBER
6. AUTHOR(S) Dr. Paul Corkum
5d. PROJECT NUMBER
5e. TASK NUMBER
5f. WORK UNIT NUMBER
7. PERFORMING ORGANIZATION NAME(S) AND ADDRESS(ES) National Research Council of Canada
100 Sussex Drive,
Ottawa, ON,. Canada K1A 0R6
8. PERFORMING ORGANIZATION REPORT NUMBER
9. SPONSORING/MONITORING AGENCY NAME(S) AND ADDRESS(ES) USAF, AFRL DUNS 143574726
AF OFFICE OF SCIENTIFIC RESEARCH
875 N. RANDOLPH ST. ROOM 3112
ARLINGTON VA 22203
10. SPONSOR/MONITOR'S ACRONYM(S)
AFOSR
11. SPONSOR/MONITOR'S REPORT NUMBER(S)
12. DISTRIBUTION/AVAILABILITY STATEMENT Distribution A -- approved for Public Release
13. SUPPLEMENTARY NOTES
14. ABSTRACT Aim 1. To measure simultaneously the spatial and the temporal structure of an isolated attosecond pulse while also simplifying attosecond
metrology so it becomes more widely accessible. Result: This goal was completely accomplished.
Aim 2: To exploit few-cycle infrared radiation to create shorter duration attosecond pulses. Result: We currently reach photon energies > 500 eV
but without phase control for the 1.8 μm driver.
Aim 3: To compare attosecond gating methods, selecting the most efficient way to produce the highest power or the shortest duration attosecond
pulses. Results: We have adapted the attosecond lighthouse to gases and confirmed isolated attosecond pulse production with an IR driver.
Aim 4: To use the quantum path interference, present in any attosecond pulse, to resolve the strongly-driven attosecond time-scale electron
dynamics in selected ions. Results: After discussions with the Program Manager, this aim have been modified to concentrate on harmonics
generation in solids.
15. SUBJECT TERMS high harmonics, soft X-rays, intense laser pulses, molecules, orbital imaging, polar molecules, tunnelling.
16. SECURITY CLASSIFICATION OF: 17. LIMITATION OF ABSTRACT
SAR
18. NUMBER OF PAGES
19a. NAME OF RESPONSIBLE PERSON Dr. Paul Corkum a. REPORT
U
b. ABSTRACT
U
c. THIS PAGE
U 19b. TELEPHONE NUMBER (Include area code)
(613) 993-7390
Standard Form 298 (Rev. 8/98) Prescribed by ANSI Std. Z39.18
Adobe Professional 7.0
Reset DISTRIBUTION A: Distribution approved for public release.

INSTRUCTIONS FOR COMPLETING SF 298
1. REPORT DATE. Full publication date, including day, month, if available. Must cite at least the year and be Year 2000 compliant, e.g. 30-06-1998; xx-06-1998; xx-xx-1998.
2. REPORT TYPE. State the type of report, such as final, technical, interim, memorandum, master's thesis, progress, quarterly, research, special, group study, etc.
3. DATES COVERED. Indicate the time during which the work was performed and the report was written, e.g., Jun 1997 - Jun 1998; 1-10 Jun 1996; May - Nov 1998; Nov 1998.
4. TITLE. Enter title and subtitle with volume number and part number, if applicable. On classified documents, enter the title classification in parentheses.
5a. CONTRACT NUMBER. Enter all contract numbers as they appear in the report, e.g. F33615-86-C-5169.
5b. GRANT NUMBER. Enter all grant numbers as they appear in the report, e.g. AFOSR-82-1234.
5c. PROGRAM ELEMENT NUMBER. Enter all program element numbers as they appear in the report, e.g. 61101A.
5d. PROJECT NUMBER. Enter all project numbers as they appear in the report, e.g. 1F665702D1257; ILIR.
5e. TASK NUMBER. Enter all task numbers as they appear in the report, e.g. 05; RF0330201; T4112.
5f. WORK UNIT NUMBER. Enter all work unit numbers as they appear in the report, e.g. 001; AFAPL30480105.
6. AUTHOR(S). Enter name(s) of person(s) responsible for writing the report, performing the research, or credited with the content of the report. The form of entry is the last name, first name, middle initial, and additional qualifiers separated by commas, e.g. Smith, Richard, J, Jr.
7. PERFORMING ORGANIZATION NAME(S) AND
ADDRESS(ES). Self-explanatory.
8. PERFORMING ORGANIZATION REPORT NUMBER.
Enter all unique alphanumeric report numbers assigned by the performing organization, e.g. BRL-1234; AFWL-TR-85-4017-Vol-21-PT-2.
9. SPONSORING/MONITORING AGENCY NAME(S)
AND ADDRESS(ES). Enter the name and address of the organization(s) financially responsible for and monitoring the work.
10. SPONSOR/MONITOR'S ACRONYM(S). Enter, if available, e.g. BRL, ARDEC, NADC.
11. SPONSOR/MONITOR'S REPORT NUMBER(S).
Enter report number as assigned by the sponsoring/ monitoring agency, if available, e.g. BRL-TR-829; -215.
12. DISTRIBUTION/AVAILABILITY STATEMENT. Use agency-mandated availability statements to indicate the public availability or distribution limitations of the report. If additional limitations/ restrictions or special markings are indicated, follow agency authorization procedures, e.g. RD/FRD, PROPIN, ITAR, etc. Include copyright information.
13. SUPPLEMENTARY NOTES. Enter information not included elsewhere such as: prepared in cooperation with; translation of; report supersedes; old edition number, etc.
14. ABSTRACT. A brief (approximately 200 words) factual summary of the most significant information.
15. SUBJECT TERMS. Key words or phrases identifying major concepts in the report.
16. SECURITY CLASSIFICATION. Enter security classification in accordance with security classification regulations, e.g. U, C, S, etc. If this form contains classified information, stamp classification level on the top and bottom of this page.
17. LIMITATION OF ABSTRACT. This block must be completed to assign a distribution limitation to the abstract. Enter UU (Unclassified Unlimited) or SAR (Same as Report). An entry in this block is necessary if the abstract is to be limited.
Standard Form 298 Back (Rev. 8/98) DISTRIBUTION A: Distribution approved for public release.

1
Report on AFOSR project # FA9550-13-1-0010: Measurement and Control of Attosecond Pulses
PI: Paul Corkum
Joint Laboratory for Attosecond Science
University of Ottawa and National Research Council of Canada
This is a final report on the AFOSR project “Measurement and Control of Attosecond Pulses”.
The project began in January 2013 and terminated in December 2015.
Project goals.
1. To measure simultaneously the spatial and the temporal structure of an isolated attosecond
pulse while also simplifying attosecond metrology so it becomes more widely accessible.
Result: This goal was completely accomplished.
Publications:
a. K.T. Kim, C. Zhang, A.D. Shiner, S.E. Kirkwood, E. Frumker, G. Gariépy, A. Naumov, D.M.
Villeneuve and P.B. Corkum, “Manipulation of quantum paths for space-time
characterization of attosecond pulses”, Nature Physics 9, 159-163 (2013)
b. K.T. Kim, C. Zhang, A.D. Shiner, B.E. Schmidt, F. Legare, D.M. Villeneuve and P. B.
Corkum, “Petahertz optical oscilloscope”, Nature Photonics, 7, 958-962 (2013)
c. K.T. Kim, D. M. Villeneuve, P. B. Corkum, “Manipulating quantum paths for novel
attosecond measurement methods” Nature Photonics 8, 187-194 (2014)
d. Yijian Meng, Chunmei Zhang, Claude Marceau, A. Yu. Naumov, P. B. Corkum, and D. M.
Villeneuve, “Octave-spanning hyperspectral coherent diffractive imaging in the extreme
ultraviolet range”, Optics Express 23, 28960 (2015)
Summary of key findings: Metrology has been a major challenge for attosecond science.
Methods developed for optics cannot be directly extended, thereby making it necessary to
develop new methods. The current “gold standard” for attosecond metrology, attosecond
streaking, cannot be easily extended to low power attosecond pulses, or to very short
wavelength pulses. Here, we introduced a flexible and comprehensive new metrology. It
allows us to measure attosecond pulses with frequency extending to photon energies of 500 eV
and beyond. This new metrology is highly sensitive, allowing weak pulses to be characterized
for the first time while also providing the first space-time measurement ever made of an
attosecond pulse. We find that attosecond pulses are always space-time coupled.
We call this form of measurement “in-situ” because the pulse is measured in the nonlinear
medium as the pulse is being formed. While this may sound limiting, any further modification
of the spectral phase of any of the frequencies making up the pulse can be determined by
spectral interferometry – a linear measurement. Thus, when combined with spectral
interferometry, in-situ measurement becomes a comprehensive measurement method.
DISTRIBUTION A: Distribution approved for public release.

2
The development of the method for isolated attosecond pulses is reported in reference [1 (a)]
and reviewed in reference [1(c)]. Not only is the pulse measured, but simultaneously, we
measure the weak perturbing field as reported in reference [1(b)].
The concept behind in-situ measurement is illustrated in Figure 1. A weak beam is incident on
the nonlinear medium at a slight angle to the fundamental. It imposes a phased modification
on the re-collision electron wave packet and therefore on the attosecond pulse that it
produces. This modification deflects the beam and the deflection depends on the phase of the
perturbing beam relative to the fundamental. As the relative phase changes, the attosecond
beam changes direction. This change encodes the space-time structure of the pulse.
We have applied the in-situ measurement
method to the first measurement of an
isolated attosecond pulse from an infrared
(1.8 µm) driver. The space-time structure of
the pulse is shown in Fig 2. The gating
method was ultrafast wavefront rotation and
the gas was argon.
Figure 1: Illustration of the in-situ measurement method of attosecond pulse measurement.
Figure 2. The space (vertical axis) time
(horizontal axis) of an isolated attosecond
pulse produced by ultrafast wavefront
rotation with a few cycle 1.8 µm pulse
interacting with a jet of argon gas. Accepted
for publication in Scientific Reports (2016)
DISTRIBUTION A: Distribution approved for public release.

3
As I write this report, we are generalizing the in-situ method to allow single-shot time-resolved
pulse measurement.
Aim 2: To exploit few-cycle infrared radiation to create shorter duration attosecond pulses.
Result: We currently reach photon energies > 500 eV but without phase control for the 1.8 µm
driver. We obtain CEP control with lower energy driver pulses, but with them we cannot reach
500 eV. Once we combine these, we expect to produce and characterize pulse with durations <
50 as.)
Publications:
a. A.D. Shiner, C. Trallero-Herrero, N. Kajumba, B.E. Schmidt, J.B. Bertrand, Kyung Taec Kim,
H.-C. Bandulet, D. Comtois, J.-C Kieffer, D.M. Rayner, P.B Corkum, F. Légaré, D.M.
Villeneuve, “High harmonic cut-off energy scaling and laser intensity measurement with a
1.8 μm laser source” Journal of Modern Optics, DOI:10.1080/09500340.2013.765067
(2013).
b. C. Zhang, G. Vampa, D.M. Villeneuve and P.B. Corkum, “Attosecond lighthouse driven by
sub-two-cycle, 1.8 μm laser pulses” J. Phys. B.: At. Mol. Opt. Phys. 48, 061001 (2015).
Summary of key findings: Every method of generating isolated attosecond pulses requires
carrier-envelop-phase control. We
generate CEP controlled pulses for 1.8 µm
light by using an OPA in which the seed, at
the signal wavelength, is generated by
continuum generation. In this way the
idler is CEP stable. This pulse is then
frequency broadened in a hollow core fiber
and passed through fused quartz where
anomalous dispersion compresses it. We
achieve 600 µJ pulses with duration of less
than 13 fs. With this source we can
produce isolated attosecond pulses.
With 600 µJ pulses we can reach the water
window using neon gas and a thin jet with
high backing pressure. In Ottawa we are
unable to go further until we upgrade our
laser system – a process that is just
beginning. However in a related lab in
Montreal we can make high energy pulses
extending to greater than 500 eV photon
energy.
Figure 3: A FROG (Frequency Resolved Optical
Gating) trace of a 1.8 µm beam as it leaves the
hollow core optical fiber where it is spectrally
broadened and the quartz plate where it is
compressed.
DISTRIBUTION A: Distribution approved for public release.

4
As yet the Montreal system is not CEP stable. Once it is, we expect to reach pulses as short as
50 attoseconds, even without dispersion compensation.
Aim 3: To compare attosecond gating methods, selecting the most efficient way to produce the
highest power or the shortest duration attosecond pulses.
Results: We have adapted the attosecond lighthouse to gases and confirmed isolated
attosecond pulse production with an IR driver (to be published in Scientific Reports). We are
working on new method using a solid irradiated at high intensity to create a space-time coupled
pulses that then irradiate a gas jet.
Publications:
a. T.J. Hammond, K.T. Kim, C. Zhang, D.M. Villeneuve, and P.B. Corkum, “Controlling
attosecond angular streaking with second harmonic radiation” Optics Letters, 40, 1768,
(2015).
Summary of key findings: We have explored two new gating methods. Both are promising. In
one we use a fundamental beam that is space-time coupled. This creates a high harmonic train
in the medium but each pulse in the train is travelling in a different direction. Therefore, as the
beam propagates,
it separates into
independent
pulses. The
mechanism is
illustrated in Fig 4.
A CEP stable few
cycle pulse
irradiates a thin
wedge. Shown
here is the
arrangement that
we used for a 1.8
µm fundamental
beam.
This creates a
beam at the focus
that has a wave
front that changes
from one ½ cycle to
the next. When
Figure 4. A fundamental beam passes through a thin wedge thereby slightly
changing the direction of each color of light in the pulse. In the focus, where
the gas jet is placed, the beam wave front rotates as shown in the inset. This
creates a series of attosecond pulses. One of these pulses – an isolated
attosecond pulse, can be selected by a slit in the far field and measured by
streaking or by in-situ measurement.
DISTRIBUTION A: Distribution approved for public release.

5
the fundamental beam is converted to harmonics the higher frequency of the harmonics means
that the beam has lower divergence. The attosecond pulses that make up the harmonics,
therefore separate into individual attosecond pulses in the far field.
The train of pulses created in this way are shown in the plot of angle of the radiation (vertical
axis) as a function of the frequency.
Figure 5(a) shows the three pulses
created with the lighthouse method.
Figure 5(b) shows a single pulse
selected by an aperture in the far
field.
Figure 2 (page 2) is a space time
resolved pulse obtained with argon
gas. Krypton gas. It corresponds to
the measurement in Fig. 5(b) except
that Krypton gas was used for Fig 5.
We have extended this work neon
and to the water window, but we
have not measured the pulse
duration.
The second gating method also uses
a space-time coupled pulse. To
create it we use of the response of solids to intense light. Since we do not yet have well
prepared figures, I describe the method.
The fundamental pulse passes through a thin (about 200 µm) crystalline quartz plate. Its
intensity should be greater than 1013 W/cm2 but below about 4x10¹³ W/cm2 where multi-pulse
damage begins to appear. With a B integral of about 2 or 3, the beam begins to self-focus as it
passes through the material and simultaneously creates second harmonic light. Since only one
coherence length of the material can contribute to the second harmonic, the second harmonic
signal is space time focussed in exactly the same way as the fundamental. With appropriate
thickness of quartz, its phase can be tuned for double optical gating.
This space-time coupled, two-color pulse is then incident on a gas target placed some distance
away where it creates an isolated attosecond pulse in Xenon, Krypton and probably all rare
gases.
Aim 4: To use the quantum path interference, present in any attosecond pulse, to resolve the
strongly-driven attosecond time-scale electron dynamics in selected ions.
Figure 5: Beamlets as measured in the far field plotted
with their angle of propagation shown for each frequency.
Fig. 5 (a) shows the beamlets spread out along the
direction of the wavefront rotation while Fig 5 (b) shows
one beamlet that has been selected by the spectrometer
slit when the wavefront rotation was perpendicular.
DISTRIBUTION A: Distribution approved for public release.

6
Results: We have modified this aim to concentrate on solids. Therefore, we did not measure
quantum path interference in the X-A transition in the N2+ ion. However, we are currently using
strong field methods to study the X-A transition in N2+ using gain dynamics related to air lasing
on the B to X transition.
Publications (related to the original aim):
a. J.B Bertrand, H.J. Wörner, P. Salières, D.M. Villeneuve and P.B. Corkum, “Linked
attosecond phase interferometry for molecular frame measurements” Nature Physics 9,
174-178 (2013)
Summary of key findings: The issues that we proposed to study was to follow the dynamics
between the X and A states of Nitrogen molecular ions as the molecule responds to the strong
field during the first cycle following ionization. We expected to see sub-cycle dynamics in the
field needed to ionize N2. The observable was to be the interference pattern between the short
and long trajectory electrons which originate at different re-collision times which we expected to
change as we changed molecular alignment. We were hopeful for the experiment because in-situ
measurement offered us very good resolution of the interference between these two trajectories.
However the experiment required that we align the molecules. Combining alignment and in-situ
measurement proved to be difficult.
The X-A transitions in N2+ is also important for creating inversion for air lasing. We now know
that it is better to measure the X-A transition dynamics indirectly using gain dynamics on the B
to X transition because X-A coupling will strongly influence the rotational wave packets that are
imprinted on the gain. With that in mind, we are now studying the air lasing problem with the
technology of high harmonic generation.
Furthermore, we began to understand the deep connection between attosecond pulses made in the
gas phase and high harmonics formed in wide bandgap semiconducting material. After
discussions with the contract monitor, we replaced Aim
4 with the aim to study solid state harmonics.
Publications related to high harmonics from solids:
b. G. Vampa, T.J. Hammond, N. Thiré, B.E.
Schmidt, F. Légaré, C. R. McDonald, T. Brabec and
P.B. Corkum, “Linking high harmonics from gases and
solids” Nature 522, 462 (2015)
c. C.R. McDonald, G. Vampa, P.B. Corkum, and
T. Brabec, “Interband Block oscillation , Phys. Rev. A
92, 033845 (2015)
d. G. Vampa, T. J. Hammond, N. Thiré, B. E.
Schmidt, F. Légaré, C. R. McDonald, T. Brabec, D. D.
Klug, and P. B. Corkum, “All-Optical Reconstruction
of Crystal Band Structure”, Phys. Rev. Lett. 115,
193603 (2015)
Figure 6: Illustration of a two band
model describing the semiconducting
properties of ZnO (from Vampa et al.
Phys Rev Lett. 113 , 073901 (2014))
DISTRIBUTION A: Distribution approved for public release.
7
By studying a two-band model of a wide bandgap semiconductors, we have discovered that,
harmonics can have essentially the same origin in solids as in gases. The qualification
“essentially” only refers to the natural generalization that electron and hole motion in solids
takes the place of electrons and ions in gases and that the electrons and holes move with band
corrected masses in a semiconductor rather than with their real electron and ion mass in gases.
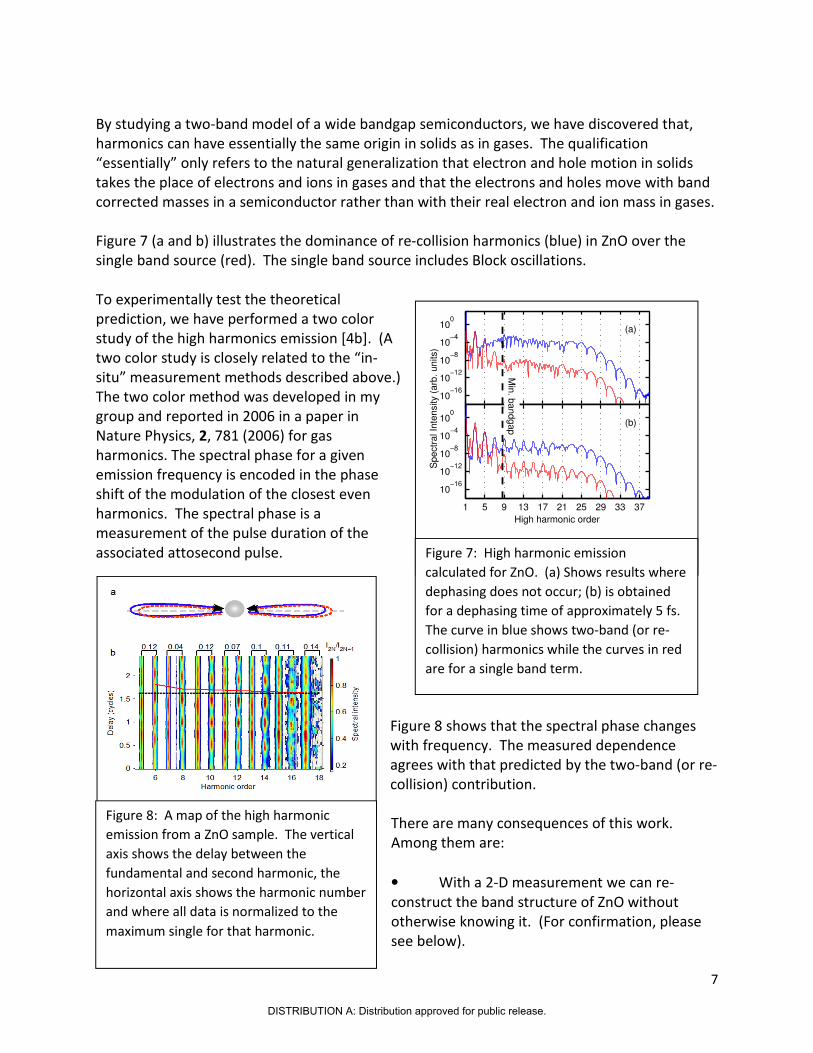
Figure 7 (a and b) illustrates the dominance of re-collision harmonics (blue) in ZnO over the
single band source (red). The single band source includes Block oscillations.
To experimentally test the theoretical
prediction, we have performed a two color
study of the high harmonics emission [4b]. (A
two color study is closely related to the “in-
situ” measurement methods described above.)
The two color method was developed in my
group and reported in 2006 in a paper in
Nature Physics, 2, 781 (2006) for gas
harmonics. The spectral phase for a given
emission frequency is encoded in the phase
shift of the modulation of the closest even
harmonics. The spectral phase is a
measurement of the pulse duration of the
associated attosecond pulse.
Figure 8 shows that the spectral phase changes
with frequency. The measured dependence
agrees with that predicted by the two-band (or re-
collision) contribution.
There are many consequences of this work.
Among them are:
• With a 2-D measurement we can re-
construct the band structure of ZnO without
otherwise knowing it. (For confirmation, please
see below).
10−16
10−12
10−8
10−4
100
(a)
1 5 9 13 17 21 25 29 33 37
10−16
10−12
10−8
10−4
100
High harmonic order
Spectr
al In
tensity (
arb
. units)
Min
. bandgap (b)
Figure 7: High harmonic emission
calculated for ZnO. (a) Shows results where
dephasing does not occur; (b) is obtained
for a dephasing time of approximately 5 fs.
The curve in blue shows two-band (or re-
collision) harmonics while the curves in red
are for a single band term.
Figure 8: A map of the high harmonic
emission from a ZnO sample. The vertical
axis shows the delay between the
fundamental and second harmonic, the
horizontal axis shows the harmonic number
and where all data is normalized to the
maximum single for that harmonic.
DISTRIBUTION A: Distribution approved for public release.

8
• Since we are transferring attosecond technology from gases to solids, measurements can
have a time resolution of < 1 femtosecond.
• High harmonic generation in solids is
highly sensitive to weak perturbing fields. This is
confirmed by our observation of even harmonics
with 2-nd harmonic intensity of only 10-5 of the
fundamental intensity. This implies that even
DC fields in semiconductor circuits imprint their
signature onto the emission.
• With short wavelength light produced
internal to a material, we can resolve spatial
structures up to about λ/2 of the highest
harmonic.
With the underlying physics confirmed, we have
tested all optical band reconstruction (as shown
in Figure 9 and reported in [4d]). The photon
energy of a harmonic determines the band gap
at the momentum at which the electron and
hole re-collide. If we can determine the
momentum at that point, then we have the
band differences. Effectively, the momentum is
determined by the 2-color map similar to the
one shown in Fig. 8
We have implemented this
procedure using theoretically
generated data, but once
obtained, treating the data as if
it were experimental. Figure
10 shows the results. The left
panel is the simulated two
color results. The spectral
phase change as a function of
frequency is clear from the
slope of the red points on the
figure, identifying maxima in
the even harmonic emission.
The middle curve isolates the
relative phase between the
fundamental and second
harmonic as a function of harmonic number. The final panel shows the retrieved curves (black)
and the target curve (red). The agreement is almost perfect.
8 12 16 20 24 28 32
0
2
4
6
8
10
12
Harmonic order
De
lay (
rad
)
A
Spectral intensity (arb. units)x10
−70 2 4
8 12 16 20 24 28 32
4
4.2
4.4
4.6
4.8
5
5.2
Harmonic order
Φo
sc(2
N)
(ra
d)
B
−0.1 0 0.1 0.2 0.3 0.4 0.5
12
16
20
24
28
32
Momentum (reciprocal lattice vectors)
Ba
nd
ga
p e
ne
rgy (
un
its o
f ω
)
C
Target
Retrieved
Target
Retrieved
4.1
5.4
6.8
8.1
9.5
10.8
Ba
nd
ga
p e
ne
rgy (
eV
)
Figure 9: An illustration of a two band model
of ZnO. The conventional method to
measure band structure is to determine
energy and direction of a photoelectron. We
propose to use the inverse process. We
measure the photon energy of the harmonics
to know band gap and the momentum is
determined by the two color (insitu)
technique.
Figure 10: Simulated band gap reconstruction. (A) The
simulated experimental data showing the harmonics on the
horizontal axis and the relative phase between the fundamental
and second harmonic along the vertical. (B) The relative phase
where each even harmonic peaks for a retrieved band gap and
the initial assumed one (target). (C) The band gap differential
as a function of k that we retrieve as well as the initially
assumed band structure.
DISTRIBUTION A: Distribution approved for public release.

9
To summarize our conclusions for solids, it is clear that harmonics from solids will have multiple
origins. For THz drivers, dephasing will forbid re-collision harmonics. For large band gap
dielectrics, localization will likewise forbid re-collision [4c]. However, for a large region
between, re-collision seems to play a dominant role.
We believe that this work has established an approach for future experiments in solids, and
that gas and solid experiments will begin to integrate. The spectral phase of the different
frequencies in the harmonic emission is an important parameter to measure and this
parameter can be used to identify the underlying physics. We also believe that this work opens
a new route for applying attosecond methods to solids. In the future we should be able to
study breakdown in solids with the precision that we now can in gases. This will be important
for laser machining.
Total publications: 11 (including 5 in Nature family; 2 in the Physical Review family)
DISTRIBUTION A: Distribution approved for public release.

Response ID:6168 Data
1.
1. Report Type
Final Report
Primary Contact E-mailContact email if there is a problem with the report.
Primary Contact Phone NumberContact phone number if there is a problem with the report
613-991-4185
Organization / Institution name
National Research Council Canada
Grant/Contract TitleThe full title of the funded effort.
Measurement and Control of Attosecond Pulses
Grant/Contract NumberAFOSR assigned control number. It must begin with "FA9550" or "F49620" or "FA2386".
FA9550-13-1-0010
Principal Investigator NameThe full name of the principal investigator on the grant or contract.
Dr. Paul Corkum
Program ManagerThe AFOSR Program Manager currently assigned to the award
Dr. Enrique Parra
Reporting Period Start Date
12/15/2012
Reporting Period End Date
12/14/2015
Abstract
Project goals.Aim 1. To measure simultaneously the spatial and the temporal structure of an isolated attosecond pulsewhile also simplifying attosecond metrology so it becomes more widely accessible. Result: This goal was completely accomplished.
Summary of key findings: Metrology has been a major challenge for attosecond science. Methodsdeveloped for optics cannot be directly extended, thereby making it necessary to develop new methods.The current "gold standard" for attosecond metrology, attosecondstreaking, cannot be easily extended to low power attosecond pulses, or to very short wavelength pulses.Here, we introduced a flexible and comprehensive new metrology. It allows us to measure attosecondpulses with frequency extending to photon energies of 500 eV and beyond. This new metrology is highlysensitive, allowing weak pulses to be characterized for the first time while also providing the first space-time measurement ever made of an attosecond pulse. We call this form of measurement "in-situ" becausethe pulse is measured in the nonlinear medium as the pulse is being formed. While this may sound limiting,any further modification of the spectral phase of any of the frequencies making up the pulse can bedetermined by spectral interferometry – a linear measurement. Thus, when combined with spectral
DISTRIBUTION A: Distribution approved for public release.

interferometry, in-situ measurement becomes a comprehensive measurement method.
Aim 2: To exploit few-cycle infrared radiation to create shorter duration attosecond pulses.Result: We currently reach photon energies > 500 eV but without phase control for the 1.8 µm driver. Weobtain CEP control with lower energy driver pulses, but with them we cannot reach 500 eV. Once wecombine these, we expect to produce and characterize pulse with durations < 50 as.
Summary of key findings: Every method of generating isolated attosecond pulses requires carrier-envelop-phase control. We generate CEP controlled pulses for 1.8 µm light by using an OPA in which the seed, atthe signal wavelength, is generated by continuum generation. In this way the idler is CEP stable. This pulseis then frequency broadened in a hollow core fiber and passed through fused quartz where anomalousdispersion compresses it. We achieve 600 µJ pulses with duration of less than 13 fs. With this source wecan produce isolated attosecond pulses. With 600 µJ pulses we can reach the water window using neongas and a thin jet with high backing pressure.
Aim 3: To compare attosecond gating methods, selecting the most efficient way to produce the highestpower or the shortest duration attosecond pulses.Results: We have adapted the attosecond lighthouse to gases and confirmed isolated attosecond pulseproduction with an IR driver. We are working on a new method using a solid irradiated at high intensity tocreate a space-time coupled pulses that then irradiate a gas jet.
Summary of key findings: We have explored two new gating methods. Both are promising. In one we use afundamental beam that is space-time coupled. We create a beam at the focus that has a wave front thatchanges from one half cycle to the next. When the fundamental beam is converted to harmonics the higherfrequency of the harmonics means that the beam has lower divergence. The attosecond pulses that makeup the harmonics, therefore, separate into individual attosecond pulses in the far field. The second gatingmethod also uses a space-time coupled pulse. To create it we use of the response of thin (about 200 µm)crystalline quartz plates to intense light. The resulting space-time coupled, two-color pulse is then incidenton a gas target placed some distance away where it creates an isolated attosecond pulse in xenon, kryptonand probably all rare gases.
Aim 4: To use the quantum path interference, present in any attosecond pulse, to resolve the strongly-driven attosecond time-scale electron dynamics in selected ions.Results: This aim has been modified to concentrate on high harmonics generation in solids.
Summary of key findings: We began to understand the deep connection between attosecond pulses madein the gas phase and high harmonics formed in wide bandgap semiconducting material. After discussionswith the Program Manager, we modified Aim 4 to study high harmonics generation within solids. Bystudying a two-band model of wide bandgap semiconductors, we have discovered that, harmonics canhave essentially the same origin in solids as in gases. The qualification "essentially" only refers to thenatural generalization that electron and hole motion in solids takes the place of electrons and ions in gasesand that the electrons and holes move with band-corrected masses in a semiconductor rather than withtheir real electron and ion mass in gases.
Distribution StatementThis is block 12 on the SF298 form.
Distribution A - Approved for Public Release
Explanation for Distribution StatementIf this is not approved for public release, please provide a short explanation. E.g., contains proprietary information.
SF298 FormPlease attach your SF298 form. A blank SF298 can be found here. Please do not password protect or secure the PDF
The maximum file size for an SF298 is 50MB.
DISTRIBUTION A: Distribution approved for public release.

Form SF298_FA9550-13-1-0010.pdf
Upload the Report Document. File must be a PDF. Please do not password protect or secure the PDF . Themaximum file size for the Report Document is 50MB.
Report on AFOSR project FA9550-13-1-0010 final.pdf
Upload a Report Document, if any. The maximum file size for the Report Document is 50MB.
Archival Publications (published) during reporting period:
1. K.T. Kim, C. Zhang, A.D. Shiner, S.E. Kirkwood, E. Frumker, G. Gariépy, A. Naumov, D.M. Villeneuve andP.B. Corkum, "Manipulation of quantum paths for space-time characterization of attosecond pulses", NaturePhysics 9, 159-163 (2013). 2. K.T. Kim, C. Zhang, A.D. Shiner, B.E. Schmidt, F. Legare, D.M. Villeneuve and P. B. Corkum, "Petahertzoptical oscilloscope", Nature Photonics, 7, 958-962 (2013).3. A.D. Shiner, C. Trallero-Herrero, N. Kajumba, B.E. Schmidt, J.B. Bertrand, Kyung Taec Kim, H.-C.Bandulet, D. Comtois, J.-C Kieffer, D.M. Rayner, P.B Corkum, F. Légaré, D.M. Villeneuve, "High harmoniccut-off energy scaling and laser intensity measurement with a 1.8 µm laser source" Journal of ModernOptics, DOI:10.1080/09500340.2013.765067 (2013). 4. J.B Bertrand, H.J. Wörner, P. Salières, D.M. Villeneuve and P.B. Corkum, "Linked attosecond phaseinterferometry for molecular frame measurements" Nature Physics 9, 174-178 (2013). 5. K.T. Kim, D. M. Villeneuve, P. B. Corkum, "Manipulating quantum paths for novel attosecondmeasurement methods" Nature Photonics 8, 187-194 (2014).6. Yijian Meng, Chunmei Zhang, Claude Marceau, A. Yu. Naumov, P. B. Corkum, and D. M. Villeneuve,"Octave-spanning hyperspectral coherent diffractive imaging in the extreme ultraviolet range", OpticsExpress 23, 28960 (2015). 7. C. Zhang, G. Vampa, D.M. Villeneuve and P.B. Corkum, "Attosecond lighthouse driven by sub-two-cycle,1.8 µm laser pulses" J. Phys. B.: At. Mol. Opt. Phys. 48, 061001 (2015). 8. T.J. Hammond, K.T. Kim, C. Zhang, D.M. Villeneuve, and P.B. Corkum, "Controlling attosecond angularstreaking with second harmonic radiation" Optics Letters, 40, 1768, (2015). 9. G. Vampa, T.J. Hammond, N. Thiré, B.E. Schmidt, F. Légaré, C. R. McDonald, T. Brabec and P.B.Corkum, "Linking high harmonics from gases and solids" Nature 522, 462 (2015)10. C.R. McDonald, G. Vampa, P.B. Corkum, and T. Brabec, "Interband Block oscillation , Phys. Rev. A 92,033845 (2015).G. Vampa, T. J. Hammond, N. Thiré, B. E. Schmidt, F. Légaré, C. R. McDonald, T. Brabec, D. D. Klug, and P. B. Corkum, "All-Optical Reconstruction of Crystal Band Structure", Phys. Rev. Lett. 115, 193603 (2015).
Changes in research objectives (if any):
After discussions with the Program Manager, Aim 4 have been modified to concentrate on harmonicsgeneration in solids.
Change in AFOSR Program Manager, if any:
Extensions granted or milestones slipped, if any:
AFOSR LRIR Number
LRIR Title
Reporting Period
Laboratory Task Manager
Program Officer
Research Objectives
Technical Summary
Funding Summary by Cost Category (by FY, $K)
DISTRIBUTION A: Distribution approved for public release.

Starting FY FY+1 FY+2
Salary
Equipment/Facilities
Supplies
Total
Report Document
Report Document - Text Analysis
Report Document - Text Analysis
Appendix Documents
2. Thank You
E-mail user
Apr 28, 2016 14:37:00 Success: Email Sent to: [email protected]
DISTRIBUTION A: Distribution approved for public release.
Recommended