Economic Policy 65th Panel Meeting
Hosted by the Central Bank of Malta
Valletta, 21-22 April 2017
The organisers would like to thank Central Bank of Malta for their support. The views expressed in this paper are those of the author(s) and not those of the supporting
organization.
Patent Boxes Design, Patents Location and Local R&D
Annette Alstadsæter (Norwegian University of Life Science)
Salvador Barrios (European Commission) Gaetan Nicodeme (European Commission and ULB)
Agnieszka Maria Skonieczna (European Commission) Antonio Vezzani (European Commission)
Patent Boxes Design, Patents Location and Local R&D
Annette Alstadsæter School of Economics and Business, Norwegian University of Life Science
Salvador Barrios European Commission, Joint Research Centre
Gaetan Nicodeme European Commission, ULB, CESifo and CEPR
Agnieszka Maria Skonieczna European Commission
Antonio Vezzani European Commission, Joint Research Centre
This version: 28 March 2017
Abstract 1 Patent boxes have been heavily debated for their role in corporate tax competition. This paper uses firm-level data for the period 2000-2012 for the top 2,000 corporate research and development (R&D) investors worldwide to consider the determinants of patent registration across a large sample of countries. Importantly, we disentangle the effects of corporate income taxation from the tax advantage of patent boxes. We also exploit a new and original dataset on patent box features such as the conditionality on performing research in the country, and their scope. We find that patent boxes have a considerable effect on attracting patents, mostly because of their favourable tax treatment, especially for high-value patents. Patent boxes with a large scope in terms of tax base definition also have stronger effects on the location of patents. The size of the tax advantage offered through patent box regimes is found not to shift the location of inventors towards the country offering the advantage, whereas R&D development conditions tend to attenuate this adverse effect.
Key words: Corporate taxation, patent boxes, location, patents, R&D, nexus approach
JEL classification: F21, F23, H25, H73, O31, O34
1 We are thankful to Nicola Fuchs-Schündeln, 4 anonymous referees, Maarten Buis, Irem Guceri, David Hannigan, Shafik Hebous, Andrea Ichino, Henrik Paulander, Eric Strobl, Sara Riscado as well as the participants in the 2015 PSE CESifo conference, in the ninth annual tax symposium of the Oxford University Centre for Business Taxation and at the 71st Annual Congress of the International Institute of Public Finance for valuable comments and suggestions. The findings, interpretations and conclusions expressed in this paper are entirely those of the authors and should not be attributed to the European Commission. Possible errors and omissions are those of the authors and theirs only.
1. Introduction
A growing number of developed economies have recently implemented patent box
regimes. Patent boxes are output-related tax incentives that apply reduced rates to income
earned from exploiting intellectual property (CPB, 2015). It is called a box because there is a
box to tick on the tax form. In other words, a patent box is a special tax regime that grants
preferential tax treatment to corporate revenues from intellectual property (IP).
The use of such schemes has raised suspicion about yet another tax competition
device. In July 2013, the German finance minister, Wolfgang Schäuble, publicly criticised
patent box regimes as ‘going against the European spirit’, suggesting that they should simply
be banned.2 Such concerns appear justified by anecdotal evidence. For instance, Pfizer’s
widely discussed and failed attempt to takeover Astra Zeneca appeared to be essentially tax
motivated.3 The company resulting from this merger would have been incorporated in the UK
taking advantage of a reduced corporate tax rate of 10% (instead of a standard rate of 21%)
over future profits generated from patents. Similarly, the UK company GlaxoSmithKline has
recently centralised all its vaccine-related IP in Belgium mainly for fiscal reasons while
carrying its physical capital investment at home.4 In another notable case, the hotel
reservation company Booking.com was expected to reduce its tax rate by around 4 percentage
points thanks to the Dutch patent box regime.5 These examples seem to suggest that the
decisions on patent registration by firms may have little to do with developing research and
innovation but a lot to do with tax planning, echoing Minister Schäuble’s worries that patent
boxes are simply there ‘to attract companies’. Such concerns were also voiced in the context
of the Organisation for Economic Cooperation and Development (OECD) Base Erosion and
Profit Shifting (BEPS) discussion and in the EU code of conduct on business taxation.6 The
need to align taxation with ‘substantial’ research activity being developed by companies is
now indeed seen as a key factor to ensure that such preferential regimes reach their goal of
fostering innovation and economic growth.7
2 Breidthardt, A., ‘Germany calls on EU to ban “patent box” tax breaks’, Reuters, 9 July 2013, http://uk.reuters.com/article/2013/07/09/uk-europe-taxes-idUKBRE9680KY20130709 3 Financial Times, 29 April, 2014 4 See Financial Times, 12 March 2014 and "GSK renforce le rôle de la Belgique comme QG mondial", L'Echo, 7 April 2015. 5 Breidthardt, A., ‘Germany calls on EU to ban “patent box” tax breaks’, Reuters, 9 July 2013, http://uk.reuters.com/article/2013/07/09/uk-europe-taxes-idUKBRE9680KY20130709 6 OCDE (2014), pages 27-53. 7 Van der Made (2014, 2015).
In this paper, we provide novel empirical evidence on the determinants of the
geographical distribution of patent applications made by the 2,000 top corporate R&D
investors. We focus on both tax and non-tax features of patent box regimes that might affect
patent registration and local R&D activity. Our sample covers patents registered in 33 host
countries8 for 3 sectors of activity (the pharmaceutical industry, the car industry and the
Information and Communications Technology, ICT) that have been particularly active in
global patenting in the past decades, by parent companies located in 39 home countries9
during the period 2000-2012. We disentangle the general effects of the corporate income tax
(CIT) rate from tax and non-tax characteristics of patent boxes such as their scope and
eligibility conditions, and investigate whether or not these characteristics influence local
research activity. Importantly, our firm-level data includes 12 countries with patent boxes, of
which 10 have introduced a patent box within the period 2000-2012.
To the best of our knowledge, this is the first attempt to analyse the various specific
designs of patent boxes and to test their impacts on patent location and local inventorship. Our
results suggest that patent boxes have a strong effect on attracting high-value patents, mainly
owing to the favourable tax treatment they offer. Patents are also found to be more sensitive to
the tax advantages offered by patent boxes when these have a large scope in terms of IP
covered, and when they grant their benefit to pre-existing patents, acquired patents and/or
embedded royalties. Interestingly, our results suggest that the tax advantages of patent boxes
do not stimulate local innovative activities, given our finding that they fail to incentivize
companies to develop local research. Nevertheless, our results suggest that the imposition of
local R&D development conditions in the patent box regime has the potential to attenuate the
fiscal effect of patent boxes.
There is to date little empirical evidence on the impacts of patent boxes on R&D and
patent location. A negative relationship between the level of the corporate income tax rate and
the amounts of both a firm’s intangible assets and its patents has been documented by
Dischinger and Riedel (2011), Ernst and Spengel (2011), Karkinsky and Riedel (2012), Böhm
et al. (2014), Ernst et al. (2014), Griffith et al. (2014) and Bösenberg and Egger (2016). For
example, Karkinsky and Riedel (2012) estimate that a percentage point increase in the
8 The EU28 (except Bulgaria, Latvia and Malta), Canada, China, Japan, the Republic of Korea, Lichtenstein, Norway, Switzerland, and the USA 9 The EU28 (except Bulgaria, Cyprus, Czech Republic, Estonia, Greece, Croatia, Lithuania, Latvia, Malta, Poland, Romania, Slovak Republic), Australia, Bermuda, Brazil, Canada, Cayman Island, China, Curacao, Hong Kong, India, Israel, Japan, Republic of Korea, Lichtenstein, Mexico, Norway, Russia, Saudi Arabia, Switzerland, Singapore, Taiwan, Thailand, Turkey, and the USA.
corporate tax rate reduces patent applications filed at the location by around 3.5%. Böhm et
al. (2014) and Griffith et al (2014) show in addition that the quality of an intangible asset and
the anti-avoidance framework (e.g. controlled foreign company rules) play a role in the
location decisions. Böhm et al. (2014) and Ernst et al. (2014) suggest that low income tax
rates attract particularly patents with high earning potential. However, these papers use older
data that do not cover the introduction of the many recent patent boxes and often mainly
analyse the effect of the (effective) CIT rate on the patent location choices. For instance,
Griffith et al. (2014) use data extending till 2005 to simulate the impact of recent preferential
tax regimes for patent income and conclude that they are likely to result in substantial revenue
losses for all countries. More recently, Bradley et al. (2015) use more recent data extending
from 1990 to 2012 for 268 patent inventor country and 213 patent owner country. Using OLS,
for the log of total patents per country and year, they find that a one-percentage point
reduction in the patent box tax rate increases patent applications by 3%. They however find
no effect of patent box regimes on attracting foreign patents, indicating that the increase
derives from domestic owners and inventors.
The rising concerns surrounding patent boxes are part of a long-standing discussion on tax
competition. This literature usually advocates for an increased global coordination of
corporate tax policies. Countries around the world have always been eager to be attractive to
foreign portfolio and physical investment, thus triggering a race to the bottom in corporate
taxation, realising the theoretical predictions of Zodrow and Mieszkowski (1986) and Wilson
(1986).10 In the OECD, the average CIT rates fell from 48.5% in 1985 to 28.7% in 2007,
while in the EU (EU-15) the fall was from 48.7% in 1985 to 28.8% in 2007. Recently,
however, this race to the bottom seems to have levelled off. The EU-15 average moved from
27.5% in 2008 to 26.3% in 2015 and the OECD average changed from 27.6% to 26.4% over
the same period.11 At the same time, many EU Member States narrowed their tax base in
corporate taxation with a view to stimulating investment.12 Tax competition thus seems to
have changed its nature, moving from a focus on statutory rates to one on tax bases.13 Patent
10 See Devereux et al. (2008) for an empirical analysis. Data on corporate tax rates can be found in, inter alia, European Commission (2014b) and OECD (2015a). 11 The EU-28 average moved from 22.7% in 2008 to 22.1% in 2015. The OECD data are for those that were members in 1985. 12 See Garnier et al (2014) for a recent review on policy measures at EU level. 13 The literature on the economic effects of harmful tax practices is summarized in Nicodeme (2009). Two strands are opposed with, on the one hand, authors that consider that these practices are parasitic and increase tax competition (e.g. Slemrod and Wilson, 2006) and, on the other hand, authors that argue that such practices increase economic efficiency by allowing states to offer preferential regimes to mobile activities (e.g. Keen, 2001).
boxes are an important driver of these recent developments, with EU countries being
especially active. Figure 1 shows that the number of patent boxes in the EU has grown from 2
in 1995 to 11 in 2015 with a clear acceleration in recent years. The tax reduction that patent
boxes offer varies across countries but the average tax advantage over the period has been
about a 75% reduction in the CIT rate (17.9 percentage points).
Theoretically, there are a number of reasons for suggesting that patent boxes do not
necessarily serve the goal of boosting local R&D activity. First, unlike expense-based tax
incentives for R&D, such schemes do not reward firms for the social benefits that they cannot
appropriate. Instead, they award additional tax benefits to a successful innovation that already
enjoys IP protection. Un-patentable research efforts with potentially higher social spillovers
are less attractive and thus become indirectly discriminated against. Second, patent boxes also
rank very low in terms of good tax incentive practices such as their scope (determining the
size of the tax base), their targeting and their organisational practices (CPB, 2015).14
In our regressions, we provide evidence that under patent box regimes taxation matters
less and that the presence of a patent box has a distinctive effect going beyond the positive
influence of low tax rate on patent registration. This way, we show that a distinction between
countries that have a low tax rate under the general regime and countries that have a low rate
because of a patent box is useful. In robustness regressions we then test whether the tax
advantage offered by patent boxes as a different effect than the standard CIT rate and we test
whether its effect is affected by the characteristics of patent boxes.
In particular, the patent box schemes came under the scrutiny of the EU and OECD
because of the apparent lack of linkage between the tax advantage offered and the presence of
research or innovation activity. Discussions at both the OECD and the EU have led to an
agreement on the requirement to establish a nexus between the income derived from IP and
the expenditure incurred to develop this asset, for the income to qualify for the patent box
preferential regime (OECD, 2014).15 The existence of development conditions in some patent
boxes may shed light on the potential effect of the nexus condition developed by the OECD
and the EU, notably with regard to its effect on patent location, tax revenues and local R&D.
Our finding that the tax-sensitivity of patent location is reduced when such specific
14 CPB (2015) reviews the economic literature on the determinants of R&D activity to benchmark the tax schemes. Patent boxes are found to have several non-recommended practices such as being related to output or having weak targeting. 15 In the EU, an agreement on a modified nexus approach requires that Member States with patent boxes that do not meet this condition close them to new entrants by 30 June 2016 and abolish them by the 30 June 2021 (van der Made, 2015).
conditionality is imposed would suggest that the nexus approach could (at least partly) inhibit
the still dominant tax competition dimension of patent boxes.
The remainder of the paper is organised as follows. Section 2 describes patent box
regimes and their characteristics and details the nexus approach chosen by developed
economies. Section 3 explains our patent data and section 4 discusses our empirical strategy.
Next, section 5 describes our identification strategy. Section 6 presents our empirical results
before concluding in section 7.
2. Patents, patent box design and local R&D
2.1 Who patents and why?
A patent is a ‘legal title that gives inventors the right, for a limited period (usually 20
years), to prevent others from making, using or selling their invention without their
permission in the countries for which the patent has been granted’.16 Before moving into the
analysis on the location of patents, it is useful to understand why companies patent their
inventions in the first place and why it is strategically important to locate patent for fiscal
reason, in particular for large multinationals. The patent system is territorial, and a patent is
valid for the geographical area for which it is granted. This has the effect of dividing world
markets into protected trade areas (Greenhalgh and Rogers, 2010).17 Holders of a patent
issued by a patent office have a given period of time (12 months) to file a patent application
abroad and still claim priority for the existing application.
Large R&D-intensive firms tend to patent more, whereas process-oriented innovators
patent less than product-oriented innovators (Peeters and van Pottelsberghe, 2006). Many
sectors are not patent-active, and patenting firms represent a small part of the population of
firms, e.g. only between 1.6% in Ireland and 8.8% in Germany (OECD, 2013). Hall et al.
(2013) find that even among firms that conduct R&D in the UK, only 4% patent. The share of
patenting firms is much lower than one might expect given that around 20% of firms that
invest in R&D report product innovations. Findings are similar for the USA as only 5.5% of
US manufacturing firms own a patent (Balasubramanian and Sivadasan, 2011). Regressing by
sector is hence justified by the heterogeneity of the determinants of patent registration across
sectors. This derives from sectorial differences in the economic, tax and patenting 16 Definition according to the European Patent Office: http://www.epo.org/service-support/glossary.html. 17 This means, for instance, that a US company holding a US patent (granted by the United States Patent and Trademark Office, USTPO) would need to file for patent/register with the European Patent Office (EPO) or a national patent office to obtain a patent that also covers European countries
perspectives. Computers, electronics, machinery, chemicals and pharmaceuticals are the
sectors with the highest patenting activities (OECD, 2013). ICT, pharma and car sectors are
the most patent- and R&D-intensive companies in our sample. Empirical evidence suggests
that, for many sectors patents, are an ineffective way to appropriate returns, and secrecy and
lead times are used extensively (Arundel, 2001; Hanel 2008; Hall et al., 2013). This does not
necessarily mean that different means of appropriation are substitutes, as for non-patentable
inventions such as software in Europe. Firms can combine formal (patents, copyrights,
trademarks) and informal (secrecy, lead times) means of appropriation and treat them as
complements to protect different elements of their innovation (Hall et al., 2013, 2014). This
is important for our work, as the evidence presented in this paper suggests that many patent
boxes apply to IP, which is much broader than patents.
Furthermore, even for large, R&D-intensive firms coming from sectors where patents are
used intensively, differences in strategy remain (Dernis et al., 2015). We are interested in
these differences, as we expect that responses to patent boxes will vary across sector. Griffith
et al (2014) already show higher sensitivity to tax in certain broad categories of industries.
Indeed, patent value, R&D intensity, and organisational structure of MNEs will vary across
sectors. Intensity in intangible assets will vary per industry and will be an important element
in firm decision making over how to organise tax planning activities. Beer and Loeperick
(2015) show that intangible asset endowment of subsidiaries and the supply-chain complexity
of multinationals explain aggregate profit-shifting trends. Their paper reveals noticeable
differences in both intangible endowments of affiliates across different sectors as well as a
major variance in the complexity of the MNE groups these affiliates belong to. According to
their classification, pharmaceuticals and ICT are top or above the median in terms of
intangible endowment, while motor vehicles have much smaller share of intangibles in total
assets, but the complexity of their supply chain is high.
Another difference relates to the motives for patenting, which can differ across sectors.
For example, they may depend on whether an industry mainly produces ‘discrete’ or
‘complex’ products (Cohen et al, 2000). The most important objective behind patenting is to
prevent third parties from exploiting the protected invention. However, strategic patenting
seems increasingly important and may also provide signals to rivals, potential negotiation
leverage and boost to reputation, but also incentives for R&D employees and the
measurement of performance (Blind et al., 2006). Such strategic motives can affect the
sensitivity of patents to tax. For example, there is limited incentive to exploit a patent which is
deployed for blocking a competitor. There is an interest to keep a patent at a location it was
invented if it is used as a tool for motivating employees or measuring performance.
2.2 Patent Boxes: a European story.
The European patent system, which is more specifically considered in this paper, is rather
complex. The patent applicant have a choice between following the national procedure in
each state for which (s)he seeks protection or taking the European route via the European
Patent Office (EPO), which in a single procedure confers protection in all the designated
contracting states. However, the EPO applicant will still need to validate the European patent
in the designated states within a short time limit after the EPO grants the patent (usually 3
months). This could entail a substantial cost due to a number of requirements, such as
payment of the fees and translations.18 The patent can also be owned by someone outside
Europe (home country) or developed by someone residing outside Europe (host country).
Patent boxes first appeared in France and Ireland as early as the 1970s. Interestingly,
Ireland is, to date, the only country that has abolished its patent box for budgetary reasons
(2010), but has reintroduced such regime as from 2016.19
The name ‘patent boxes’ can be deceptive, as many patent boxes have a much larger
scope than just patentable rights, as summarised in Table 1. Patent boxes are also very
heterogeneous in their design. These differences are shown in more detail in Table 2.20 We
focus on five design characteristics that are expected to make the tax advantage more or less
pronounced: (a) which IP rights qualify for the patent box (the scope); (b) the treatment of
existing patents; (c) the treatment of acquired patents; (d) the treatment of embedded
royalties; and (e) the existence of development conditions.
First, patent box regimes diverge in their scope. All patent boxes cover patents and often
rights equivalent to patents such as supplementary protection certificates. Besides patents,
patent boxes can also cover designs and, to a lesser extent, trademarks. In addition, they often
18 Patenting in the EU is expected to become less complex and costly thanks to the introduction of the European patent with unitary effect, the so-called "unitary patent" (European Commission, 2011). Such patent will be yet another option for users besides already-existing national and "classical" European patents. It will enable a unitary effect in 25 EU states without the need for subsequent validation. However, the system is not yet in force. The unitary patent may be requested from the date of the entry into force of the Agreement on a Unified Patent Court. 25 EU Member States signed the agreement on 19 February 2013. It will need to be ratified by at least 13 states, including France, Germany and the United Kingdom to enter into force. 19 At a rate of 6.25%, that is half of the standard 12.5% corporate income tax rate. 20 In our analysis, we do not include Israel and Turkey that offer some tax advantages with an IP-related component, but these tax schemes are much broader and apply in special economic zones only. Turkey and Israel are also not in our sample. Italy also introduced a patent box regime in 2015 that will offer a 50% exemption as of 2017 (30% and 40% in 2015 and 2016 respectively) but is outside our sample.
consider copyrights, sometimes with a restriction to software, probably to compensate for the
fact that software is not patentable in Europe unlike in the USA. Firms often combine
different forms of IP, even for the same invention (Hall et al, 2014). This implies that the
advantage conferred by patent boxes with a wide IP scope could be more generous than
intended by policymakers and would over-subsidise the same invention.
Second, the effects of a patent box on tax revenues depend on its provisions. Existing (i.e.
prior) patents may in some cases also benefit from the lower tax rates of patent boxes, as in
the systems put in place in Cyprus, France, Hungary, Malta, Spain, the UK, Ireland (up to
2010), Liechtenstein and the Nidwalden canton in Switzerland. This represents a windfall
gain to firms with existing patents, as after-tax income from their existing patents in that
jurisdiction increases with no further action required.
Third, the treatment of acquired patents differs across patent boxes. A majority of patent
boxes allow patents acquired from related or third parties, whereas only a small number of
countries allow the use of acquired patents on condition that the acquirer further develops
these patents.
Fourth, patent boxes also vary in the treatment of embedded royalties. The three
‘narrowest’ patent boxes in terms of coverage (in the UK, Belgium and The Netherlands)
include only income from patents under their IP tax rules (as shown in Table 1). However, at
the same time, these patent boxes also include the embedded royalties in the calculation of
eligible income.21 This means that the income from the sale of products that include patented
items and the notional royalty from using patented industrial processes, fall under the patent
box, implicitly increasing the coverage (and cost in terms of tax expenditures) of the IP boxes.
For instance, Evers et al. (2014) find that the treatment of expenses relating to IP income is
generally more decisive for the effective tax burden than the nominal IP Box tax rate. The
treatment of expenses can be so generous that IP Boxes provide negative effective tax rates.
In these cases unprofitable investment projects are subsidised by the patent box regime. It is
also important to note that other elements of the tax system need to be in place to make such
schemes beneficial for tax-planning purposes, namely an extensive network of bilateral
treaties, weak CFC legislation, flexible transfer pricing rules and flexibility of the tax
administration (e.g. advance rulings). In addition, some countries offer standard corporate tax
rates below the tax advantage offered by a patent box and could be more attractive for
companies that prefer to book their full profits in such jurisdictions. 21 Embedded royalties also exist in broader patent boxes such as in Luxembourg, Liechtenstein and Nidwalden canton in Switzerland.
In the next section, we examine the fifth important characteristic of patents, the possible
imposition of development conditions.
2.3 Patent Boxes and the link with local R&D.
Current patent boxes approach the question of the link with underlying research activity -
thanks to which an IP right originated - in different ways. In half of the cases considered in
this paper, the patent boxes do not require any development work by the taxpaying company
in question. Patent boxes in The Netherlands, Belgium, the United Kingdom, Ireland (up to
2010), Spain, Portugal and China contain(ed) provisions specifying the link with the
underlying research activity.22 In the EU, this is usually done in the form of a development
condition that requires at least part of the patent to be developed by the beneficiary corporate
group within the Single Market. However, these conditions differ in their definition and
strength. For instance, the Belgian patent box requires that the qualifying patent shall have
been developed fully or partially by the taxpaying company in an R&D center that qualifies as
a branch of activity. In the Netherlands, the patent box applies to intangible assets that the
company has developed itself. It also covers intangible assets that are in large part the result
of R&D work, conditional on the taxpaying company receiving a declaration from the Dutch
Research Agency (Schellekens, 2013). This declaration in turn links the R&D activity with
the use of the Dutch payroll deduction scheme for researchers. Under the UK patent box a
company or group must have performed qualifying development in relation to the IP right,
and the rules include provisions against full outsourcing (HMRC, 2010). Nevertheless, an
additional 'active ownership condition' potentially limits the constraining aspect of the
development condition. In such case, another company within a group could have fully
developed the IP right, while the company that pays tax in the UK actively manages the IP
portfolio.
Generally, development conditions often contain qualitative terms such as ‘substantial’ or
‘significant’ work that are open to interpretation and have to be assessed on a case-by-case
basis.23 It is also worth mentioning that in the specific case of the EU, its Member States
cannot restrict the benefits of R&D tax incentives to activities performed in their territory as
22 China has a preferential rate for new high-technology enterprises, which need to meet a number of requirements to qualify to profit from the rate (e.g. level of R&D expenses). 23 In our sample, only China applies the territorial restrictions so that most of the related R&D must be done in China.
this would infringe upon the freedom of establishment and prevent companies from
conducting their R&D elsewhere in the EU.24
3. Patent data.
This paper uses the patent applications of world corporate R&D investors from 39 home
countries25 in 33 different host countries26 over the period 2000-2012. The analysis is based
on the top 2,000 worldwide corporate R&D investors as reported by the EU Industrial R&D
Scoreboard (European Commission, 2013), which ranks the companies that invested the
largest amounts of R&D in 201227. Altogether, these companies accounted for about 90% of
global business R&D spending.28
The Scoreboard data are drawn from the latest available company accounts reported in the
ORBIS database as provided by Bureau Van Dijk Electronic Publishing. ORBIS contains
ownership, balance-sheet accounting and financial information about firms located
worldwide. The patents filed by these companies at the European Patent Office (EPO) are
from the Patstat29 database in the framework of a JRC-OECD joint project (see Dernis et al.,
2015). This project has carried out a matching on a by-country basis using a series of string-
matching algorithms contained in the Imalinker system (Idener Multi Algorithm Linker)
developed for the OECD by IDENER, Seville (2013).30 To ensure a high quality of the
matching, threshold values for string matching have been set in order to minimize both false
positives and false negatives. After the matching procedure, results for 10% of companies
were inspected manually. In particular, matches for the 2.5% of companies with the highest 24 See Baxter and Fournier European Court of Justice cases, C-254/97 and C-39/04. 25 Home countries: Australia, Austria, Belgium, Bermuda, Brazil, Canada, Cayman Island, China, Curacao, Denmark, Finland, France, Germany, Hong Kong, Hungary, India, Israel, Italy, Ireland, Japan, Republic of Korea, Lichtenstein, Luxembourg, Mexico, Netherlands, Norway, Portugal, Russia, Saudi Arabia, Slovenia, Spain, Switzerland, Singapore, Sweden, Taiwan, Thailand, Turkey, United Kingdom, and the USA. 26 Host countries: Austria, Belgium, Canada, China, Croatia, Cyprus, Czech Republic, Denmark, Estonia, Finland, France, Germany, Greece, Hungary, Ireland, Italy, Japan, The Republic of Korea, Lichtenstein, Lithuania, Luxembourg, Netherlands, Norway, Poland, Portugal, Romania, Slovakia, Slovenia, Spain, Sweden, Switzerland, United Kingdom, and the USA. 27 This has implications for the interpretation of our results as we de facto exclude companies not engaging in R&D activity. Hence, our results shall be interpreted as the various effects of patent boxes on patent location of companies engaging in R&D activities rather than their effect on companies starting research ex-nihilo. 28 The EU Industrial R&D Investment Scoreboard sample is assembled by the Joint Research Centre of the European Commission. For more information on the sample of firms included in the R&D Scoreboard, see http://iri.jrc.ec.europa.eu/scoreboard.html. 29 PATSTAT is the European Patent Office’s Worldwide Patent Statistical Database, which contains data about 70 million applications from more than 80 countries. See more details at http://www.epo.org. 30 Overall, in 2012 the top R&D investors controlled more than 500,000 subsidiaries (defined as firms more than 50% owned by the parent), including ‘branches’, which account for about 34% of all subsidiaries. Patent applications have been aggregated at the group level. A more extensive description of the approach used to perform the matching between Orbis and PATSTAT can be found in Dernis et al. (2015). For a description of Imalinker, see http://www.idener.es/?portfolio=imalinker.
(and lowest) patent/R&D ratios were manually adjusted. Moreover, another 5% of companies
were randomly checked; random checks confirmed the goodness of matching. Overall, 97%
of the top-performing companies could be matched to at least one patent applicant.
The characteristics of innovations vary across sectors and so does the influence of taxation
on the patent location choices, as discussed in section 2.1. Therefore, to account for this
heterogeneity we adopt a sectorial approach to our regressions. Our regressions in section 6
confirm this heterogeneity. We identify three sectors of interest: the car industry (ICB code
3350), the ICT industry (ICB code 9500) and the pharmaceutical industry (ICB code 4570),
together with their subsectors. Focussing on these three sectors allows covering 60% of total
patents and those sectors are also the top R&D investors in the 2012 scoreboard.
Patent applications pertain to different technological fields.31 Globally, in our full sample,
chemistry counts for close to a quarter of all applications, very closely followed by electrical
engineering; about a fifth of all applications are related to mechanical engineering and
instruments. The remainder, ‘other fields’ counts for the remaining 9% of patent applications.
Their distribution, however, differs widely across sectors. As shown in Table 3, each sector
focuses mainly on one specific technology field, but not exclusively. In the car industry,
63.98% of the 88,826 patent applications are related to mechanical engineering technology. In
the ICT sector, electrical engineering accounts for 81% of all applications and in the
pharmaceutical sector, chemistry has the lion’s share with 79.5%. These differences justify a
sectorial approach.32
An important characteristic of the patent box data is that it is highly skewed. Companies
in many instances do not register their patent just in a given year and country. In addition,
when they do register, they usually do it for one single patent only. However, a few
companies sometimes register a very large number of patents in a given year and in a given
country. Figure 2 shows the very skewed distribution of patents across companies considered
in our empirical analysis. The large multinationals included in our sample have a patenting
behaviour that differs from other companies with a large number of patent registrations. We
find a positive and significant correlation between company size (measured by total
employment) and patent registrations. Hence, the nature of our data on patent application is
likely to have a bearing on the econometric strategy used for estimating the impact of taxation
31 The Industry Classification Benchmark (ICB) is a classification widely used by stock exchanges such as the NASDAQ and the NYSE. 32 Moreover, to ensure consistency, our econometric estimations are run considering only the patents registered under the most frequent technology by sector.
and patent boxes on patent registrations. These issues are discussed in the next section dealing
with our econometric approach.
4. Empirical strategy.
We follow the structural model proposed by Griffith et al. (2014) and consider the payoff
𝜋𝜋𝑖𝑖,𝑗𝑗,𝑡𝑡 of a firm i from registering a patent in a specific location j at time t as being determined
by industry and country-specific characteristics such that
( )tjitjtjtji XETRf ,,,,,, ,, επ = (1)
where the company i will register its patent in country j if its expected payoff is higher
than the expected payoff in any other alternative location k, that is tktj ,, ππ > . This probability
is a function f of the effective tax rate (ETR) in country j at time t – i.e. the statutory CIT rate
minus the possible tax rebate granted via the patent box to income-related patents - and of
other country-specific and time-specific characteristics Xj,t that can influence patent
registration. We also assume that payoffs are uncorrelated such that the error term tji ,,ε
follows a normal distribution with zero mean and unitary standard deviation N(0,1). Griffith
et al. (2014) suggest however that the expected payoffs of registering patents in two different
locations can be correlated, hence invalidating the previous assumption such that
( ) 0, ,, ≠tktjCov ππ . The possibility for a non-zero correlation in expected patents payoffs is
dealt with by Griffith et al. (2014) by estimating a mixed multinomial logit model where the
effects of taxation are assumed to vary across ideas, which the authors define as industry/firm
size categories. Using such a mixed multinomial logit approach allows estimating the degree
of heterogeneity in the effect of a specific variable, including the tax rate, along the
industry/firm size dimensions. It can be used when patent registrations made by a given
company i occur only once in a given year and a given country. To compare our results with
those of Griffith et al. (2014), we run some regressions with this technique.
However, we have seen from our sample data that some companies often register more
than one patent in a given country and year. Hence, it could be preferable to take advantage of
this additional information and to use the total number of patents registered as dependent
variable instead of zero-one dummy to estimate the probability of registering a patent
(Hausman et al., 1984). The model to be estimated becomes:
tjijttjtjtji XETRn ,,,,,, εϕφβλ ++++= (2)
Where the dependent variable is the number n of patents registered by a company i in a
given country j in year t. φt and ϕj are respectively time and country fixed effects.
In this model, the parameters λ and β could in principle be estimated via a standard OLS.
We run some regressions using this technique, similar to Bradley et al. (2015)33. It is however
known that OLS models assumptions do not hold in cases where the dependent variable is
discrete outcome, as in our case. As put by Karkinsky and Riedel (2012), the "OLS approach
however does not account for the fact that the patent variable is restricted to positive values".
An alternative solution is then to use a Poisson model. However, the problem of over-
dispersion arises in that case. This problem typically characterises patent registration data
from large companies as in some industries only a handful of them generate a very large
number of patents. To overcome these problems, a negative binomial model provides a better
alternative than the Poisson model. This is also the preferred option of Karkinsky and Riedel
(2012).
The negative binomial model preserves the conditional mean assumption of the Poisson
model but it allows for a larger variation of outcomes than a Poisson and one can specify a so-
called over-dispersion parameter that represents an objective proxy of the cause of this over-
dispersion (Long and Freese 2014). In our negative binomial model and in line with the
observation of our data sample, we assume that the latent heterogeneity inducing an over-
dispersion in patent registrations is the firm size (represented by the number of employees).34
We incorporate this parameter as exposure variable in the marginal negative binomial
distribution and the model can be easily estimated using maximum likelihood (Greene, 2008).
We next also consider an alternative mixed negative binomial model in order to account
for unobserved heterogeneity and to estimate fixed and random effects on the effective tax
variable, which reflects the fact that firms do not behave similarly to fiscal conditions. This
mixed model allows us checking whether our main results hold when using a specification
including random effects comparable to Griffith et al. (2014).
Next, as in Griffith et al. (2014) we must consider the influence of additional non-tax
factors on the location choice for patents registration. These controls are embodied in the set
of variables X of equation (2). We first control for the size of the market measured by the log
of GDP (in Euros) of the country of potential application by the variable GDP level. We also
control for the innovation potential of the country, captured by private business R&D
33 Although these authors use the log of the total number of patent applications per (owner or inventor) country and per year. 34 See also Cohen et al. (2000) for evidence of this relationship.
expenditures in percentage of GDP, Business R&D/GDP. We moreover include a control for
the degree of IP protection in the potential countries of location of patents, with the index
variable IP protection. For this variable, we take a widely used index developed by Ginarte
and Park (1997) and subsequently updated by Park (2008). Finally, We also control for
research activities related to the patents considered in our data. The Real Research Activity
variable measures whether or not any of the inventors of a given patent reside in the country
where the patent is registered according to the Patstat database. Since we use a count model,
the Real Research Activity is measured by the number of patents where at least one of the
inventors resides in the country where the patent was registered, as a percentage of the total
number of patents registered in that country by a given firm. All four controls variables also
used by Griffith et al (2014), are expected to exert a positive effect on patent applications.
5. Identification strategy
Before discussing the estimation results, we should note that our identification strategy
hinges on the assumption that governments’ decisions to set-up a patent box regime or to
change the characteristics of existing one are exogenous to the conditions of R&D activities in
their country. However, despite the fact that these tax policy decisions are unlikely to be
frequent (which lends some support to the exogeneity assumption), we cannot not fully rule
out the possibility for these changes to be endogenous. Indeed, the presence of patent boxes or
of some of their features (such as the existence of a development condition) may be chosen by
governments because of existing business R&D activities. The causation can go in both
directions of attracting patents or retaining existing ones.
Our approach looks at annual microeconomic decisions of multinationals to register
patents through different subsidiaries potentially located in 33 countries as a response to
macroeconomic decisions on patent boxes and tax rates set by governments. These latter are
however not immediately adjusted on the basis of current firms' decisions. Our data on patent
boxes indeed suggest that - at least for the period considered - patent box regimes seldom
change once in force in a given country (with a few exceptions such as the recent change in
tax rebate in the Spanish scheme). However, in order to test more thoroughly whether our
identification strategy is valid we have run a set of logistic regressions at the country level to
check whether local business R&D activities had a bearing on the presence of patent boxes
and features. In particular, we have estimated regressions where the presence of a patent box
(and the presence of development conditions) represented by a dummy variable is used as
dependent variables and the Business R&D expenditures (BERD) as share of GDP was used
as explanatory variable. In addition, we have also tested as dependent variable a dummy
variable indicating the presence of development conditions (conditional of course on the
existence of a patent box regime). We also include time and country fixed effects.
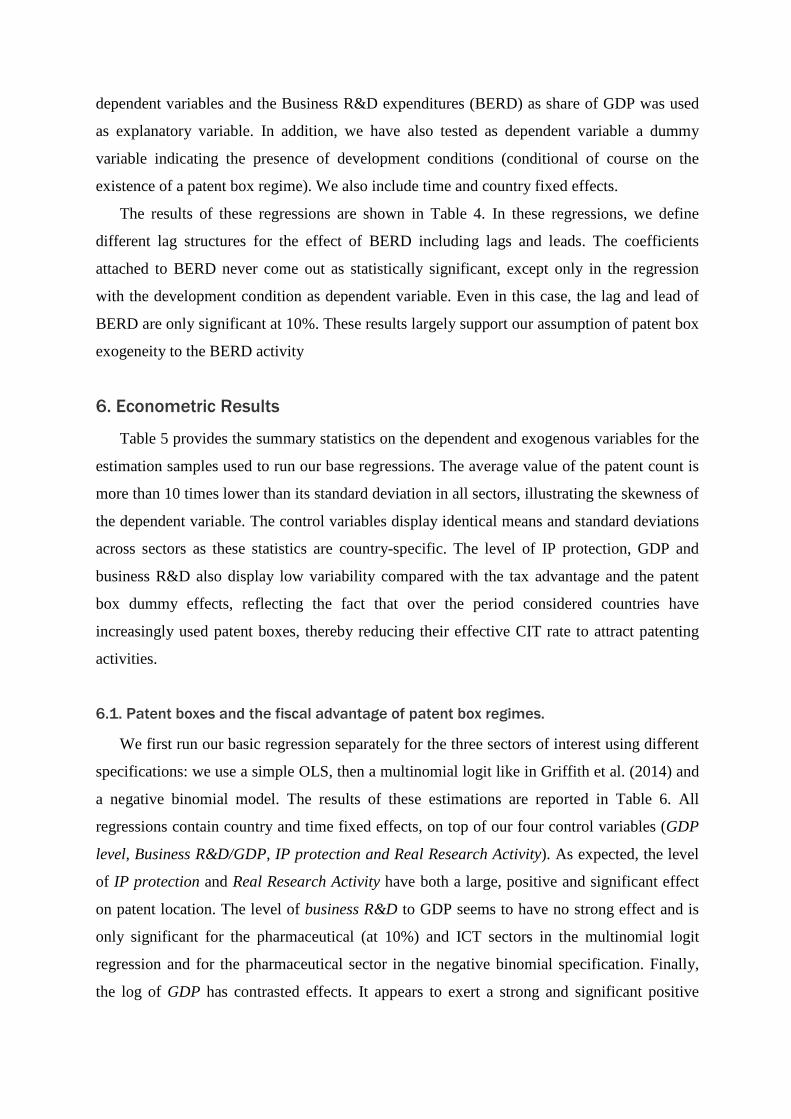
The results of these regressions are shown in Table 4. In these regressions, we define
different lag structures for the effect of BERD including lags and leads. The coefficients
attached to BERD never come out as statistically significant, except only in the regression
with the development condition as dependent variable. Even in this case, the lag and lead of
BERD are only significant at 10%. These results largely support our assumption of patent box
exogeneity to the BERD activity
6. Econometric Results
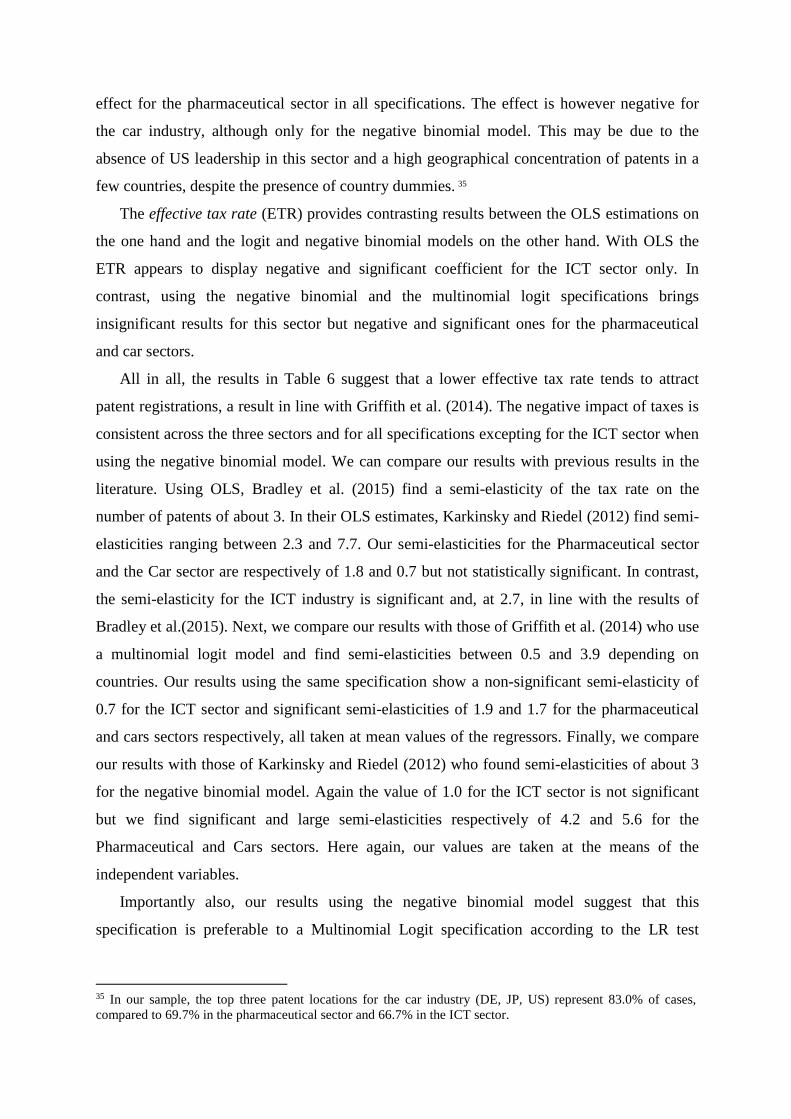
Table 5 provides the summary statistics on the dependent and exogenous variables for the
estimation samples used to run our base regressions. The average value of the patent count is
more than 10 times lower than its standard deviation in all sectors, illustrating the skewness of
the dependent variable. The control variables display identical means and standard deviations
across sectors as these statistics are country-specific. The level of IP protection, GDP and
business R&D also display low variability compared with the tax advantage and the patent
box dummy effects, reflecting the fact that over the period considered countries have
increasingly used patent boxes, thereby reducing their effective CIT rate to attract patenting
activities.
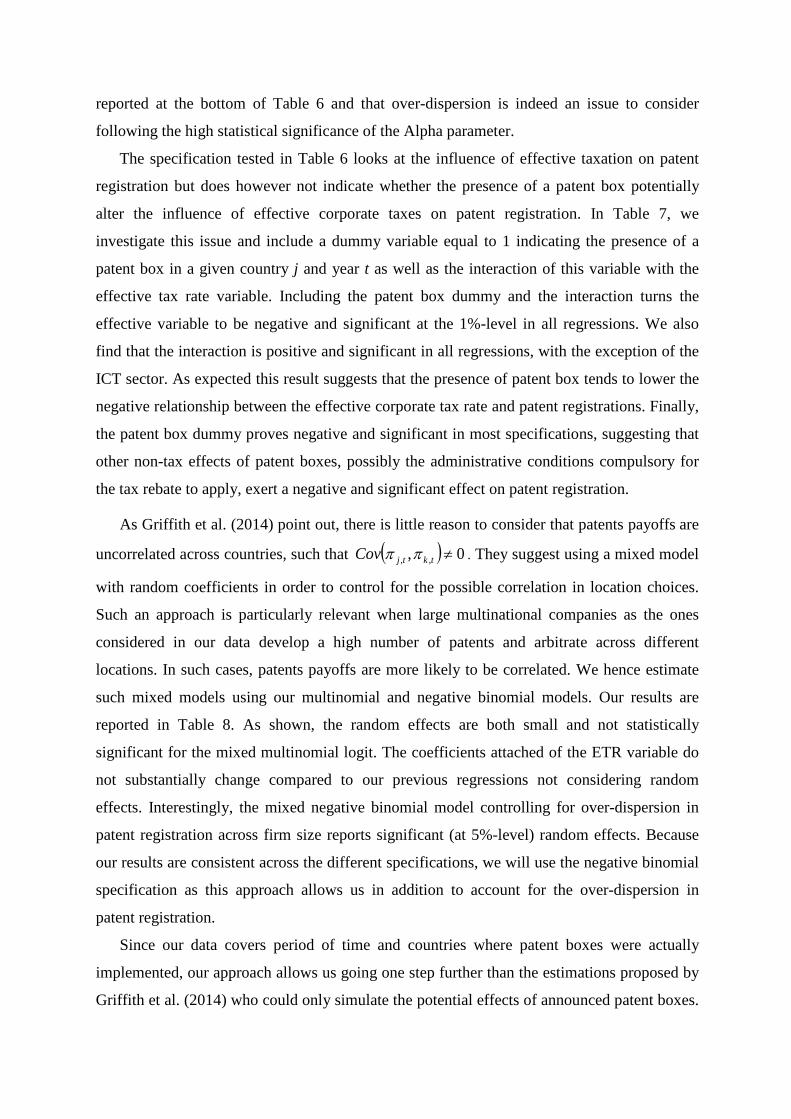
6.1. Patent boxes and the fiscal advantage of patent box regimes.
We first run our basic regression separately for the three sectors of interest using different
specifications: we use a simple OLS, then a multinomial logit like in Griffith et al. (2014) and
a negative binomial model. The results of these estimations are reported in Table 6. All
regressions contain country and time fixed effects, on top of our four control variables (GDP
level, Business R&D/GDP, IP protection and Real Research Activity). As expected, the level
of IP protection and Real Research Activity have both a large, positive and significant effect
on patent location. The level of business R&D to GDP seems to have no strong effect and is
only significant for the pharmaceutical (at 10%) and ICT sectors in the multinomial logit
regression and for the pharmaceutical sector in the negative binomial specification. Finally,
the log of GDP has contrasted effects. It appears to exert a strong and significant positive
effect for the pharmaceutical sector in all specifications. The effect is however negative for
the car industry, although only for the negative binomial model. This may be due to the
absence of US leadership in this sector and a high geographical concentration of patents in a
few countries, despite the presence of country dummies. 35
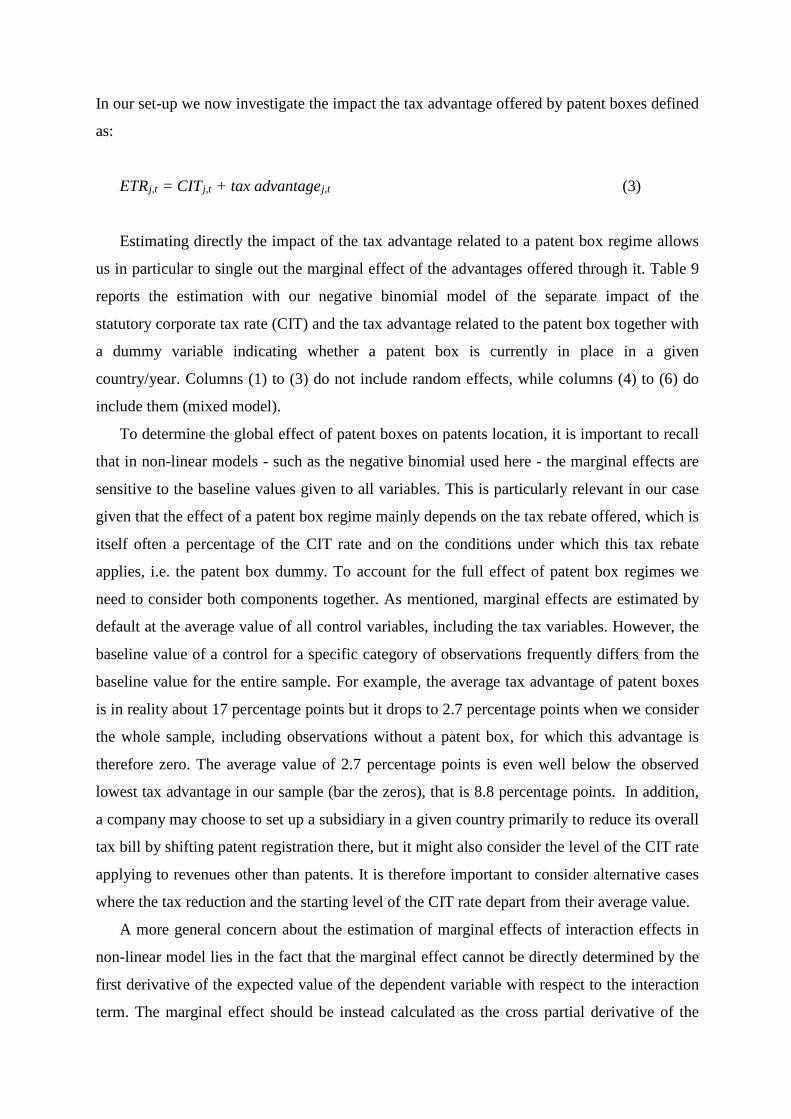
The effective tax rate (ETR) provides contrasting results between the OLS estimations on
the one hand and the logit and negative binomial models on the other hand. With OLS the
ETR appears to display negative and significant coefficient for the ICT sector only. In
contrast, using the negative binomial and the multinomial logit specifications brings
insignificant results for this sector but negative and significant ones for the pharmaceutical
and car sectors.
All in all, the results in Table 6 suggest that a lower effective tax rate tends to attract
patent registrations, a result in line with Griffith et al. (2014). The negative impact of taxes is
consistent across the three sectors and for all specifications excepting for the ICT sector when
using the negative binomial model. We can compare our results with previous results in the
literature. Using OLS, Bradley et al. (2015) find a semi-elasticity of the tax rate on the
number of patents of about 3. In their OLS estimates, Karkinsky and Riedel (2012) find semi-
elasticities ranging between 2.3 and 7.7. Our semi-elasticities for the Pharmaceutical sector
and the Car sector are respectively of 1.8 and 0.7 but not statistically significant. In contrast,
the semi-elasticity for the ICT industry is significant and, at 2.7, in line with the results of
Bradley et al.(2015). Next, we compare our results with those of Griffith et al. (2014) who use
a multinomial logit model and find semi-elasticities between 0.5 and 3.9 depending on
countries. Our results using the same specification show a non-significant semi-elasticity of
0.7 for the ICT sector and significant semi-elasticities of 1.9 and 1.7 for the pharmaceutical
and cars sectors respectively, all taken at mean values of the regressors. Finally, we compare
our results with those of Karkinsky and Riedel (2012) who found semi-elasticities of about 3
for the negative binomial model. Again the value of 1.0 for the ICT sector is not significant
but we find significant and large semi-elasticities respectively of 4.2 and 5.6 for the
Pharmaceutical and Cars sectors. Here again, our values are taken at the means of the
independent variables.
Importantly also, our results using the negative binomial model suggest that this
specification is preferable to a Multinomial Logit specification according to the LR test
35 In our sample, the top three patent locations for the car industry (DE, JP, US) represent 83.0% of cases, compared to 69.7% in the pharmaceutical sector and 66.7% in the ICT sector.
reported at the bottom of Table 6 and that over-dispersion is indeed an issue to consider
following the high statistical significance of the Alpha parameter.
The specification tested in Table 6 looks at the influence of effective taxation on patent
registration but does however not indicate whether the presence of a patent box potentially
alter the influence of effective corporate taxes on patent registration. In Table 7, we
investigate this issue and include a dummy variable equal to 1 indicating the presence of a
patent box in a given country j and year t as well as the interaction of this variable with the
effective tax rate variable. Including the patent box dummy and the interaction turns the
effective variable to be negative and significant at the 1%-level in all regressions. We also
find that the interaction is positive and significant in all regressions, with the exception of the
ICT sector. As expected this result suggests that the presence of patent box tends to lower the
negative relationship between the effective corporate tax rate and patent registrations. Finally,
the patent box dummy proves negative and significant in most specifications, suggesting that
other non-tax effects of patent boxes, possibly the administrative conditions compulsory for
the tax rebate to apply, exert a negative and significant effect on patent registration.
As Griffith et al. (2014) point out, there is little reason to consider that patents payoffs are
uncorrelated across countries, such that ( ) 0, ,, ≠tktjCov ππ . They suggest using a mixed model
with random coefficients in order to control for the possible correlation in location choices.
Such an approach is particularly relevant when large multinational companies as the ones
considered in our data develop a high number of patents and arbitrate across different
locations. In such cases, patents payoffs are more likely to be correlated. We hence estimate
such mixed models using our multinomial and negative binomial models. Our results are
reported in Table 8. As shown, the random effects are both small and not statistically
significant for the mixed multinomial logit. The coefficients attached of the ETR variable do
not substantially change compared to our previous regressions not considering random
effects. Interestingly, the mixed negative binomial model controlling for over-dispersion in
patent registration across firm size reports significant (at 5%-level) random effects. Because
our results are consistent across the different specifications, we will use the negative binomial
specification as this approach allows us in addition to account for the over-dispersion in
patent registration.
Since our data covers period of time and countries where patent boxes were actually
implemented, our approach allows us going one step further than the estimations proposed by
Griffith et al. (2014) who could only simulate the potential effects of announced patent boxes.
In our set-up we now investigate the impact the tax advantage offered by patent boxes defined
as:
ETRj,t = CITj,t + tax advantagej,t (3)
Estimating directly the impact of the tax advantage related to a patent box regime allows
us in particular to single out the marginal effect of the advantages offered through it. Table 9
reports the estimation with our negative binomial model of the separate impact of the
statutory corporate tax rate (CIT) and the tax advantage related to the patent box together with
a dummy variable indicating whether a patent box is currently in place in a given
country/year. Columns (1) to (3) do not include random effects, while columns (4) to (6) do
include them (mixed model).
To determine the global effect of patent boxes on patents location, it is important to recall
that in non-linear models - such as the negative binomial used here - the marginal effects are
sensitive to the baseline values given to all variables. This is particularly relevant in our case
given that the effect of a patent box regime mainly depends on the tax rebate offered, which is
itself often a percentage of the CIT rate and on the conditions under which this tax rebate
applies, i.e. the patent box dummy. To account for the full effect of patent box regimes we
need to consider both components together. As mentioned, marginal effects are estimated by
default at the average value of all control variables, including the tax variables. However, the
baseline value of a control for a specific category of observations frequently differs from the
baseline value for the entire sample. For example, the average tax advantage of patent boxes
is in reality about 17 percentage points but it drops to 2.7 percentage points when we consider
the whole sample, including observations without a patent box, for which this advantage is
therefore zero. The average value of 2.7 percentage points is even well below the observed
lowest tax advantage in our sample (bar the zeros), that is 8.8 percentage points. In addition,
a company may choose to set up a subsidiary in a given country primarily to reduce its overall
tax bill by shifting patent registration there, but it might also consider the level of the CIT rate
applying to revenues other than patents. It is therefore important to consider alternative cases
where the tax reduction and the starting level of the CIT rate depart from their average value.
A more general concern about the estimation of marginal effects of interaction effects in
non-linear model lies in the fact that the marginal effect cannot be directly determined by the
first derivative of the expected value of the dependent variable with respect to the interaction
term. The marginal effect should be instead calculated as the cross partial derivative of the
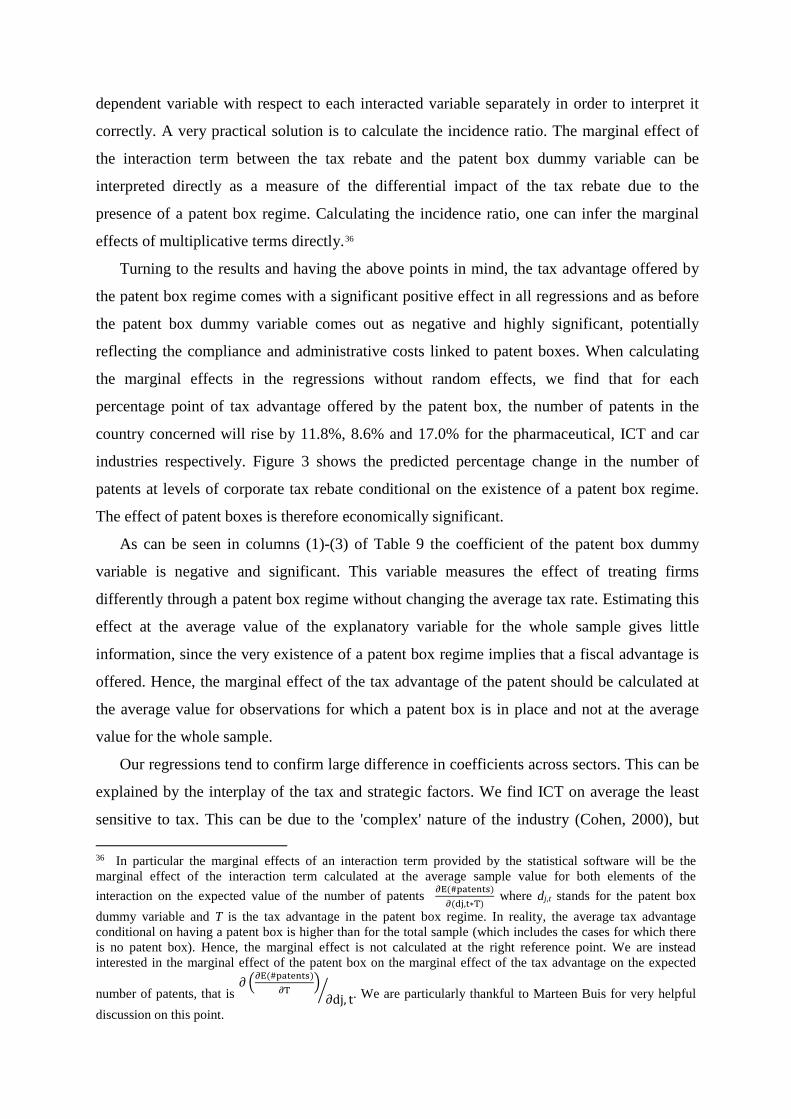
dependent variable with respect to each interacted variable separately in order to interpret it
correctly. A very practical solution is to calculate the incidence ratio. The marginal effect of
the interaction term between the tax rebate and the patent box dummy variable can be
interpreted directly as a measure of the differential impact of the tax rebate due to the
presence of a patent box regime. Calculating the incidence ratio, one can infer the marginal
effects of multiplicative terms directly.36
Turning to the results and having the above points in mind, the tax advantage offered by
the patent box regime comes with a significant positive effect in all regressions and as before
the patent box dummy variable comes out as negative and highly significant, potentially
reflecting the compliance and administrative costs linked to patent boxes. When calculating
the marginal effects in the regressions without random effects, we find that for each
percentage point of tax advantage offered by the patent box, the number of patents in the
country concerned will rise by 11.8%, 8.6% and 17.0% for the pharmaceutical, ICT and car
industries respectively. Figure 3 shows the predicted percentage change in the number of
patents at levels of corporate tax rebate conditional on the existence of a patent box regime.
The effect of patent boxes is therefore economically significant.
As can be seen in columns (1)-(3) of Table 9 the coefficient of the patent box dummy
variable is negative and significant. This variable measures the effect of treating firms
differently through a patent box regime without changing the average tax rate. Estimating this
effect at the average value of the explanatory variable for the whole sample gives little
information, since the very existence of a patent box regime implies that a fiscal advantage is
offered. Hence, the marginal effect of the tax advantage of the patent should be calculated at
the average value for observations for which a patent box is in place and not at the average
value for the whole sample.
Our regressions tend to confirm large difference in coefficients across sectors. This can be
explained by the interplay of the tax and strategic factors. We find ICT on average the least
sensitive to tax. This can be due to the 'complex' nature of the industry (Cohen, 2000), but 36 In particular the marginal effects of an interaction term provided by the statistical software will be the marginal effect of the interaction term calculated at the average sample value for both elements of the interaction on the expected value of the number of patents ∂E(#patents)
∂(dj,t∗T) where dj,t stands for the patent box
dummy variable and T is the tax advantage in the patent box regime. In reality, the average tax advantage conditional on having a patent box is higher than for the total sample (which includes the cases for which there is no patent box). Hence, the marginal effect is not calculated at the right reference point. We are instead interested in the marginal effect of the patent box on the marginal effect of the tax advantage on the expected
number of patents, that is ∂ �∂E(#patents)
∂T�∂dj, t� . We are particularly thankful to Marteen Buis for very helpful
discussion on this point.
also to the fact that R&D and product cycles can be much shorter in ICT. For example, Bilir
(2014) finds that firms with short life-cycle technologies are insensitive to the strength of IP
rights at a location, because offshore imitation is less likely to succeed before obsolescence.
There may be less interest in tax gains from patents which protect short-lived technology if a
complex tax planning need to be organised first. On the other hand, R&D cycles in new drugs
and cars can be rather long and they are more of a 'discrete industry' (Cohen, 2000). Motor
vehicles and chemicals (subsector of pharma) also seem to have a more complex supply
chains which will suggest higher sensitivity to tax (Beer and Loeperick, 2015).
As a robustness check, we also estimate our model by analysing whether or not firms
could respond heterogeneously to the tax advantage offered by patent boxes. We therefore run
the mixed-effects version of the negative binomial model by estimating the random effects.
The last three columns of Table 9 report the results of the mixed negative binomial estimation
with a random effect estimated for the tax advantage variable. These results are qualitatively
similar to the ones obtained with the negative binomial model with the addition that now the
statutory corporate tax rate appears to be significant for the ICT sector as well. We now find a
lower coefficient for the tax advantage in the pharmaceutical industry and a significantly
higher coefficient in the ICT and car industries. More interestingly, the random term on the
tax advantage displays a significant coefficient in the ICT and car industry. This coefficient is
however not significantly different from zero in the pharmaceutical industry. The random
components are nonetheless small, indicating that although firms may indeed be
heterogeneous in terms of their reaction to tax rebates on patent boxes, this heterogeneity is
small compared with the average effect of patent boxes (i.e. the so-called fixed effect in the
mixed-model terminology). The fact that our regressions are estimated for each sector
separately can explain this result because, within each sector, firms are more homogeneous in
terms of technologies used and importance of the fiscal dimension for research activities. In
the extensions of our empirical analysis presented in the following sections, we will use the
negative binomial model without the random term, which is also computationally less
demanding, since the model with the random effect does not appear to modify our results
significantly.37
6.2. Patent value.
37 As additional robustness check we also verified whether the effect of patent boxes could come with a lag given that the effect of patent box may take time before becoming tangible in order for firms to adapt to such policy change. The results of these regressions showed no significant differences with the results reported here.
Innovation outcome distributions are highly skewed with major innovations capturing the
lion's share of value creation (Scherer and Harhoff, 2000). Patent value can serve as a proxy
for innovations with high earning potential, the holy grail of innovation policy. The role
played by ideas and patent value is therefore quite fundamental in the analysis of patent
boxes. The motives for different patent registration choices are likely to be correlated within
ideas, and so is the potential influence of tax determinants, since firms are likely to decide on
the geographical registration of their patent portfolio strategically, depending on the market
potential of new ideas embedded in patents. Griffith et al. (2014) use a group variable based
on the simultaneity between industry and the network of inventors of patents registered by a
single firm to identify idea membership. Such a measure could nevertheless be regarded as
somewhat restrictive, since it excludes patents registered by different firms but relating to the
same idea or invention, as well as patents relating to the same idea or invention but registered
at different times. There are also two reasons for using an alternative measure of patent value.
First, competing firms are also likely to compete for similar ideas. Second, firms may attempt
to protect ideas or to generate revenues from a given idea by registering patents at successive
times. To account for these possibilities, we use instead an indicator variable based on the
information provided by the International Patent Documentation, i.e. the so-called INPADOC
family group, produced by the European Patent Office. The INPADOC family groups indicate
if a given patent registration corresponds to the same priority and invention. Using
information based on INPADOC membership is likely to provide an accurate measure of the
value of the patent given that it is not exclusive in terms of the time of registration and firm
ownership of the patent. We defined high-value patents as those belonging to the top quartile
by sector in terms of INPADOC family size. In line with our approach, patent’s family size is
also a preferred value measure of Böhm et al (2014). In Figure 4, we report the weighted
average of the statutory and effective tax rates (i.e. including the patent box rebate whenever
in place), using as weight the total number of patents registered. As one can see, high-value
patents tend to be located in countries with lower corporate taxation and with a larger gap
between the standard CIT rate and the effective tax rate. This descriptive evidence thus
suggests that firms have exploited the tax advantage offered by patent boxes especially for
high-value patents.
To confirm these results, we have run regressions separately for high-value patents,
defined as patents belonging to the top quartile in terms of patent family size as defined
above, and compared the results with the regressions covering the remaining patents. The
results of these additional regressions are reported in Table 10. The effects of both the
statutory CIT rate and the tax advantage in the patent box regime are different between the
two groups of regression. The negative coefficients obtained for the statutory CIT rate are
larger in absolute terms for high-value patents, and the tax advantage coefficients are always
larger, although not always clearly so. Since these additional regressions are run over different
sample sizes, we have tested the significance of the difference in the coefficients estimated
using a Wald test. The results of these tests are reported in the last row of Table 10 showing
that the null hypothesis of equal coefficients can be rejected. These results therefore suggest
that high-value patents tend to be significantly more sensitive to taxes.
6.3. Patent box characteristics.
Next, we are interested in whether or not the specific characteristics of patent boxes have
an effect on patent location and whether these effects vary across sectors. Given the high
multicollinearity in some of the patent box characteristics38, not all these characteristics were
included in the regression. To test the effects of characteristics, we have identified five
dimensions of patent boxes and we add dummy variables reflecting these specific features of
the patents as described in Tables 1 and 2. These regressions are run conditionally to the
existence of the patent box regime, i.e. they are run for countries/years in which a patent box
regime was in place. In doing, so we can interpret our estimates in terms of marginal effect of
a given patent box characteristic for a baseline average effect of the patent box as presented in
Table 9.
The first set of characteristics considered are dummy variables respectively for whether or
not acquired patents, embedded royalties and existing patents (i.e. patents prior to the creation
of the patent box) qualify for the tax advantages of patent boxes. The results of these
regressions are reported in the first three columns of Tables 11-13 for each sector separately.
We focus on the coefficient obtained on the tax advantage interacted with the specific patent
box characteristic without making any inference on the separate dummy variables since, as
discussed earlier, such discussion is best made for other than average values of the control
variables. We find the tax advantage in the acquired patents characteristics to be positive and
significant in all three sectors, suggesting that the presence of this characteristic increases the
sensitivity of patents to taxation.39 A similar finding is shown for the embedded royalties
characteristic with the exception of the pharmaceutical sector where the interaction is not
statistically significant. For the existing patents condition, the results are contrasted. The 38 An unreported correlation matrix shows a degree of correlation between the various characteristics. 39 Note that as we observe patent applications we cannot see changes in legal ownership of patents in our data.
interaction turns out to be insignificant for the pharmaceutical industry, positive and
significant for the ICT and negative and significant for the Cars industry. The result on the
existing patents condition for the car industry might reflect the dominant role played by large
car producers with high patenting activity, such as Germany and Japan, where strategic
market considerations might prevail over tax advantage when deciding about the location of a
patent registration.
Next, in regressions 4 of Tables 11-13, we look at the effect of having patent boxes
offering a tax advantage to a larger range of rights than just patents (see Table 1 for details).
In all three sectors, the coefficient is positive and significant, indicating a higher sensitivity to
taxation. Finally, in regressions 5 of the Tables 11-13, we consider the role played by
development conditions whereby countries grant tax rebate conditional on R&D activities
being developed within the country. Controlling for the development conditions dummy
variable makes the tax advantage to be insignificant in the car sector, but it makes it negative
and significant for the Pharmaceutical and ICT sectors. The effect of development condition
thus appears to be rather heterogeneous across sectors. It indicates that the imposition of
development conditions can potentially decrease the tax sensitivity of patents registration.
The results for the acquired and existing patents characteristics can be explained by the
fact that patents are not developed in isolation but are usually part of a patent portfolio
strategy by firms. Acquired patents can raise the value of other (including) future patents in a
portfolio. To achieve this multinationals build up higher-value and better-matching patent
portfolio (see Bösenberg and Egger, 2016).
6.4. Effects of patent boxes on research activity.
We now consider the interaction between patent box regimes and local R&D activities as
this is an often advocated justification for granting preferential tax treatment. We define a
measure of local R&D activity based on information for the total number of inventors (of
patents) registered by each multinationals in each country and year. This is measured at
company level to allow us linking the presence of patent boxes with patent registrations and
local innovative activity with precision. We are interested in testing two arguments put
forward in the patent box policy debate: (i) to what extent the tax rebate granted by a patent
box is effectively promoting local inventorship in the foreign affiliate of the multinationals,
and (ii) how effective are development conditions included in some patent box regimes in
ensuring that the tax rebate is effectively fostering R&D in the country where the patent is
being registered. A first option for measuring the impact of patent boxes on local R&D
activities by foreign affiliates could be to simply consider the change in the total number of
inventors associated to patents registered by a multinational in a given country. However in
doing so we could possibly capture cases where the innovative activity of a given
multinational is globally increasing (or decreasing) and wrongly attribute the change in
foreign affiliate R&D activities to the existence of a patent box regime. We must therefore
build a dependent variable that distinguishes the changes in R&D activities both at the
multinational group level and in the host countries where patents are registered. To validate
the argument of fostering local research activities, our dependent variable should therefore
capture a positive change in local R&D in the country of the patent measured as an increase in
the number of inventors in the country of registration (i.e. the host country) and a decreasing
or stable number of inventors in the multinational group globally. This indicator is
transformed into a dummy variable taking the value 1 if those two conditions hold (i.e.
increase in the number of host country researchers and a decrease or stabilisation in the total
number of researchers within the corporate group). Indeed, although we do not observe
whether the inventors actually move from one country to another, we can reasonably assume
that such simultaneous rise and fall in the number of inventors in two different parts of the
(company) group indicates an inventor shift. This binary variable is used as dependent
variable to assess its determinants through logistic regressions. These regressions are
performed at the company-level. As control variables, we use the same as the previous
specifications with two exceptions. First, we need to remove the Real Research Activity
variable as this variable could be endogenous in this specification. We then check if including
this dummy back in the regression alters our results. Secondly, we include a binary variable
indicating the presence of development conditions in the patent box regime. Given that our
explanatory variables are defined on a company-level basis and that the some independent
variables are defined at country level, we cluster our observation at the level of the parent
company, following Moulton (1990).
The estimations reported in Table 14 provide the results of the logistic regressions for the
probability of performing an inventor shift. Regressions (1)-(3) do not control for the real
activity variable while regressions (4)-(6) do control for this variable. Our results are similar
in both specifications as the CIT and tax advantage in the patent box regime display negative
and significant coefficients with very close values in both specifications. Our results suggest
that the tax advantage linked to the patent box does decrease the probability of moving
inventors to the patent box country. The fiscal advantage of patent boxes does thus not
promote the relocation of researchers. These results suggest that firms could be principally
interested in the tax rebate when registering a patent in a country with a patent box regime,
rather than in setting (extending) R&D facilities there. However, the dummy variable
indicating the presence of a development condition has a strong effect in reversing this
tendency. Countries including a specific local development condition have a higher
probability of experiencing an inventor shift and is perhaps more likely to promote local R&D
activities in their favour, as reflected by the positive and significant coefficient attached to the
development condition variable. This result also holds independently of controlling for the
local research activity variable.
7. Conclusions
This paper analyses how the implementation of patent boxes affects the patent-filing
strategies of top corporate R&D investors across countries. For this, we use a recent and rich
firm-level dataset for the 2000-2012 period on the top 2,000 corporate R&D investors from
39 countries, considering their ownership structure, and analyse the determinants of patent
registration across a large sample of 33 host countries.
For the first time, we disentangle the effect of three key characteristics of patent boxes:
the corporate income taxation; the tax advantage of registering patents in a patent box
country; and other characteristics of the patent boxes that define both their scope (i.e. the tax
base) and non-fiscal characteristics such as local R&D development conditionality.
Patent boxes exert a strong effect on attracting patents, mostly due to the specific
favourable tax treatment that they bring about. However, this effect varies across sectors and
with the specific characteristics of the patents. High-value patents are shown to be more
influenced in their location choices by the tax advantage offered by patent boxes than patents
of lower value. The possibility to grant the patent box tax regime to patents that have been
acquired, existed previously or contain embedded royalties seems to make patent location
even more sensitive to the tax advantages offered by patent boxes. The same can be said of
patent boxes broadening their scope to other rights such as trademarks, design and models,
copyrights or domain names. Our results also suggest that in the majority of cases, the
existence of a patent box regime incentivises multinationals to shift the location of their
patents without a shift of inventors. We find that the size of the tax advantage is negatively
correlated with the local R&D. This suggests that the effects of patent boxes are mainly of a
tax nature.
An interesting development of patent boxes concerns the possibility of imposing
development conditions for the patent to qualify for the advantageous tax regime. This is the
case in several countries. These conditions provide a proxy for the possible effect of
conditionality clause discussed at the EU and OECD, i.e. the so-called nexus approach. Our
results show that such specific condition appears to dampen the dominant effects of the tax
advantage of the patent box regime on patent locations while encouraging local inventorship.
Future challenges, such as the need to reach a common agreement on the definition and
measurement of R&D activities as well as their link to patenting activities, will of course
emerge in case such clauses are implemented.
Patent boxes are a relatively recent development among the tools offered to companies to
boost R&D activities. They have been criticised for offering additional tax advantages to
income already profiting from an IP protection and having potentially little effect on the level
of R&D. Their development has raised concerns over the fact that they could exert a
significant effect on patent location without any change in the real research activity, targeting
only the tax benefits. Our results confirm these fears, with the tax attractiveness of patent
boxes being greater the broader their scope. Recent debates on the potentially harmful
consequences of patent boxes have addressed the possibility of linking the advantages of
patent to the requirement of a real research activity by the taxpayer that receives tax benefits.
Our results suggest that it has the potential to decrease the still dominant tax effects of patent
boxes on patent location and to raise the level of local inventorship. The nexus approach
therefore offers some potential to mitigate the role of patent boxes as new tax competition
tools.
References Acca (2013) Online article. "Boxing clever". Accessed at:
http://accainpractice.newsweaver.co.uk/accainpractice/zcqzzffe7i61j5koh51mtg?a=1&p=29856495&t=17227014
Arundel, A. (2001), The relative effectiveness of patents and secrecy for appropriation, Research Policy, 30(4): 611-624.
Balasubramanian, N. and J. Sivadasan (2011), What Happens When Firms Patent? New Evidence from U.S. Economic Census Data, The Review of Economics and Statistics, 93(1): 126-146.
Becker, B. and N. Pain (2008), What Determines Industrial R&D Expenditure in the UK?. Manchester School, 76(1): 66-87.
Becker, J. and C. Fuest, 2007. Quality versus quantity — the composition effect of corporate taxation on foreign direct investment. CESifo Working Paper Series 2126.
Becker, J., Fuest, C. and N. Riedel (2012), Corporate Tax Effects on the Quality and Quantity of FDI, European Economic Review, 56(8): 1495–1511.
Beer, S. and Loeperick, J. ( 2015) Profit shifting: drivers of transfer (mis)pricing and the potential of countermeasures, International Tax and Public Finance, June 2015, Volume 22, Issue 3, pp 426–451
Bilir, K. (2014) Patent Laws, Product Life-Cycle Lengths, and Multinational Activity. American Economic Review 2014, 104(7): 1979–2013
Blind, K., Edler J., Frietsch, R., Schmoch, U. (2006). Motives to patent: Empirical evidence from Germany, Research Policy 35: 655–672.
Bloom, N., R. Griffith and J. van Reenen (2002), Do R&D Tax Credits Work? Evidence from a Panel of Countries 1979-1997, Journal of Public Economics 85: 1-31.
Bloom, N. and R. Griffith (2001), The Internationalisation of UK R&D, Fiscal Studies 22 (3): 337-355. Böhm, T., Karkinsky, T. and N. Riedel (2014), The Impact of Corporate Taxes on R&D and Patent
Holdings, mimeo. Bösenberg, S., and P. Egger (2016). R&D Tax Incentives and the Emergence and Trade of Ideas, Economic
Policy, 63rd Panel Meeting, De Nederlandsche Bank, Netherlands. Bradley, S., Dauchy, E. and L. Robinson (2015), Cross-country evidence on the preliminary effects of
patent box regimes on patent activity and ownership, National Tax Journal, 68(4): 1047-1071. Buettner, T. and M. Ruf (2007), Tax Incentives and the Location of FDI: Evidence from a Panel of German
Multinationals, International Tax and Public Finance 14: 151-164. Cao, Fuli (2011), Corporate Income tax law and Practice in the People's Republic of China, Oxford
University press. Cohen, W. M., Nelson, R. R., & Walsh, J. P. (2000). Protecting their intellectual assets: Appropriability
conditions and why US manufacturing firms patent (or not), NBER Working Paper 7552. National Bureau of Economic Research.
Council of the European Union, Code of Conduct (Business Taxation)- Draft Report to the Council, doc 16100/14, FISC 216, ECOFIN 1105,2014.
CPB (2015), "Study on R&D Tax Incentives", Taxation Papers, 52. Dernis H., Dosso M., Hervás F., Millot V., Squicciarini M. and Vezzani A. (2015). World Corporate Top
R&D Investors: Innovation and IP bundles. A JRC and OECD common report. Luxembourg: Publications Office of the European Union.
Desai, M. A. and J. R. Hines (2002), Expectations and Expatriations: Tracing the Causes and Consequences of Corporate Inversions, National Tax Journal, 55(3): 409-40.
Devereux, M.P., Lockwood, B. and M. Redoano (2008), Do Countries Compete over Corporate Tax Rates?, European Economic Review, 92(5-6): 1210-1235.
Dischinger, M., and Riedel, N. (2011), Corporate taxes and the location of intangible assets within multinational firms. Journal of Public Economics 95: 691–707.
Ernst, C. and C. Spengel (2011), Taxation, R&D Tax Incentives and Patent Application in Europe, Centre for European Economic Research, ZEW Discussion Paper, No.11-024.
Ernst, C., K. Richter and N. Riedel (2014): Corporate taxation and the quality of research and development, International Tax and Public Finance 1-26.
European Commission (2013). The 2013 EU Industrial R&D Investment Scoreboard, Luxembourg: Publications Office of the European Union.
European Commission (2014a), EU R&D Scoreboard, The 2014 EU Industrial R&D investment scoreboard, Institute for Prospective Technological Studies, Joint Research Centre, European Commission.
European Commission (2014b), Taxation Trends in the EU, Brussels. Evers, L., Miller, H. and C. Spengel (2014), Intellectual Property Box Regimes: Effective Tax Rates and
Tax Policy Considerations, International Tax and Public Finance,1-29. Financial Times, 12 March 2014, Tanya Powley: “Aerospace and automotive are UK manufacturing’s star
performers”. Financial Times, 29 April, 2014, Vanessa Houlder, “Patent box holds key of Pfizer-AZ deal’s attraction”. Fuest, C., Spengel, C., Finke, K., Heckemeyer, J.H. and H. Nusser (2013), Profit Shifting and “Aggressive”
Tax Planning by Multinational Firms: Issues and Options for Reform, World Tax Journal (3). Garnier, G. , Gyorgy, E., Heineken, K, Mathe, M., Puglisi, L., Rua, S., Skonieczna, A. and A. Van Mierlo,
(2014) A Wind of Change? Reforms of Tax Systems since the Launch of Europe2020, Reflets et Perspectives de la Vie Economique, 53(2): 75-111.
Ginarte, J.C. and Park,W.G., (1997). "Determinants of patent rights: a cross- national study", Research Policy 26: 283–301.
Greene, W. (2008). Functional forms for the negative binomial model for count data. Economics Letters, 99(3): 585-590.
Greenhalgh and Rogers. (2010). Innovation, Intellectual Property, and Economic Growth. Princeton University Press.
Griffith, G., H. Miller and M. O'Connell (2014), "Ownership of intellectual property and corporate taxation", Journal of Public Economics 112: 12-23.
Hall, B. H. and D. Harhoff (2012), Recent Research on the Economics of Patents, Annual Review of Economics, 4(1): 541-565.
Hall, B. H., Lotti, F. and J. Mairesse (2013), Evidence on the impact of R&D and ICT investments on innovation and productivity in Italian firms, Economics of Innovation and New Technology, 22(3): 300–328.
Hall, B. H., C. Helmers, M. Rogers, and V. Sena. (2014), The Choice between Formal and Informal Intellectual Property: A Review, Journal of Economic Literature 2014, 52(2): 375–423.
Hanel, P. (2008), “The use of intellectual property rights an innovation by manufacturing firms in Canada”, Economics of Innovation and New Technologies, 17: 285-309.
Hausman, J. B. H. Hall and Z. Griliches, (1984) Econometric Models for Count Data with an Application to the Patents-R & D Relationship, Econometrica 52 (4): 909-938
International Bureau of Fiscal Documentation, online tax database. Kamran, L (2014). Patent Laws, Product Life-Cycle Lengths, and Multinational Activity. American
Economic Review 2014, 104(7): 1979–2013. Karkinsky, T. and N. Riedel (2012), Corporate Taxation and the Location of Patents within Multinational
Firms, Journal of International Economics, 88(1): 176-185. Keen, M. (2001), Preferential tax regimes can make tax competition less harmful, National Tax Journal,
54(4): 757-762. Long, J.S. and J. Freese (2014), Regression Models for Categorical Dependent Variables Using Stata. 3rd
ed. College Station, TX: Stata Press. Moulton, B. R. (1990). An illustration of a pitfall in estimating the effects of aggregate variables on micro
units. The Review of Economics and Statistics, pp. 334-338.
Nicodeme, G. (2009), On recent developments in fighting harmful tax practices, National Tax Journal, 62(4): 755-771.
Obuoforibo, B. (2013), The technical aspects of the UK patent box rules, European Taxation, 53(10): 1-11. OECD (2014), Countering Harmful Tax Practices more Effectively, taking into account Transparency and
Substance, OECD/G20 Base Erosion and Profit Shifting Project, Action 5 OECD (2015a), OECD Tax Database. OECD (2015b) Action 5: Agreement on Modified Nexus Approach for IP Regimes. OECD/G20 Base
Erosion and Profit Shifting Project. Park, W.G. (2008), "International patent protection: 1960–2005", Research Policy: 37(4): 761-766. Peeters, C. and B. van Pottelsberghe (2006), Innovation strategy and the patenting behavior of firms,
Journal of Evolutionary Economics, 16(1): 109-135. PwC (2013) European patent box regimes. Japan External Trade organisation.
https://www.jetro.go.jp/ext_images/world/europe/ip/pdf/european_patent_box_regimes_en.pdf Rabe-Hesketh, S., and A. Skrondal. (2012), Multilevel and Longitudinal Modeling Using Stata. 3rd ed.
College Station, TX: Stata Press. Sanz-Gómez, R., (2015), " The OECD’s Nexus Approach to IP Boxes: A European Union Law
Perspective", WU International Taxation Research Paper 2015 - 12, Wien University. Schellekens, M. (2013), The Netherlands as an Innovation Hub: An Appraisal of the Innovation Box
Regime. European Taxation, 2013 (Volume 53), No. 10. Scherer, F.M., and D. Harhoff (2000). Technology policy for a world of skew-distributed
outcomes. Research Policy, 29(4): 559-566. Siedschlag, I., Smith, D., Turcu, C. and X. Zhang (2013), What determines the location choice of R&D
activities by multinational firms? Research Policy 42: 1420– 143. Slemrod, J. and J.D. Wilson (2006), Tax competition with parasitic tax havens, NBER Working Papers,
12225, Cambridge, M.A. Squicciarini, M. and H. Dernis (2013), "A Cross-Country Characterisation of the Patenting Behaviour of
Firms based on Matched Firm and Patent Data", OECD Science, Technology and Industry Working Papers 2013/05, Organisation for Economic Cooperation and Development, OECD, Paris.
Van der Made, B. (2014), Update on the EU Code of Conduct Group, International Tax Review, 26 February 2014, http://www.internationaltaxreview.com/Article/3313023/EU-Update-on-the-EU-Code-of-Conduct-Group-Business-Taxation.html
Van der Made, B. (2015), Update on the EU Code of Conduct Group, International Tax Review, 24 February 2015, http://www.internationaltaxreview.com/Article/3430573/EU-Update-on-patent-boxes-and-the-EU-Code-of-Conduct-Group-Business-Taxation.html
Wilson, J.D. (1986), A theory of interregional tax competition, Journal of Urban Economics, 19(3): 296-315.
Wilson, J.D. (2009), Beggar Thy Neighbor? The In-State, Out-of-State, and Aggregate Effects of R&D Tax Credits, The Review of Economics and Statistics 91(2): 431-436.
Zodrow, G.R. and P. Mieszkowski (1986), Pigou, Tiebout, property taxation, and the underprovision of local public goods, Journal of Urban Economics, 19(3): 356-370.
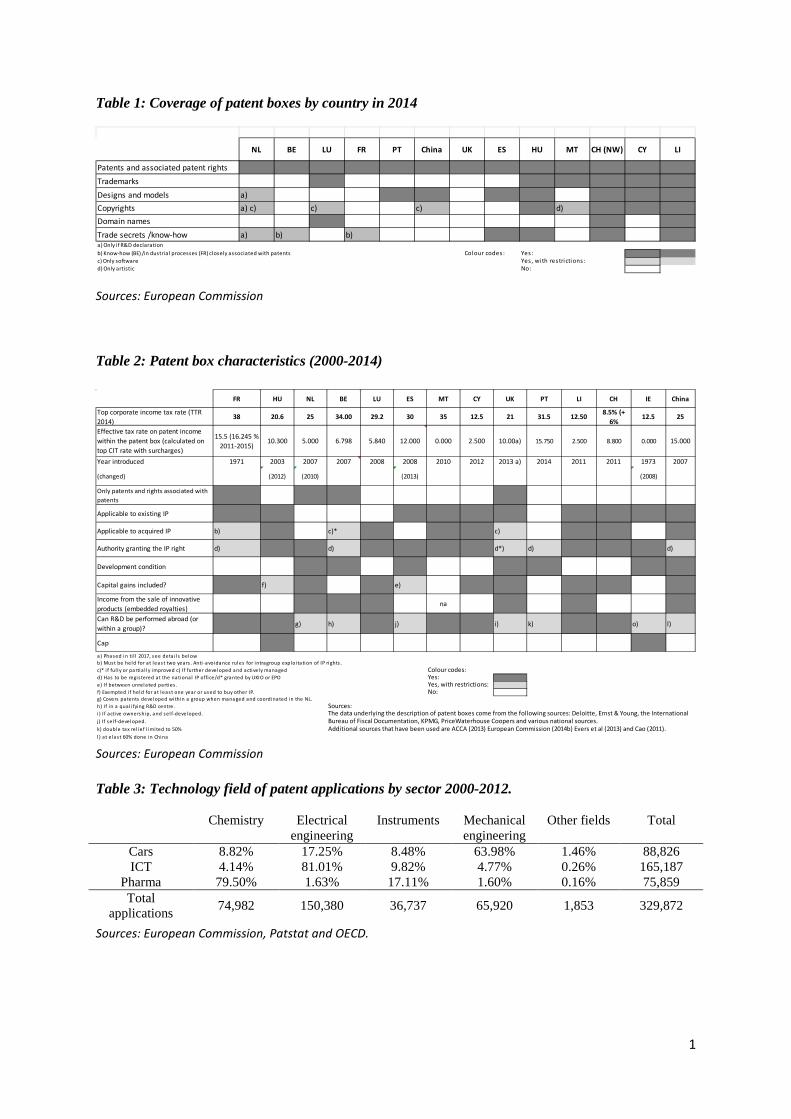
1
Table 1: Coverage of patent boxes by country in 2014
Sources: European Commission
Table 2: Patent box characteristics (2000-2014)
Sources: European Commission
Table 3: Technology field of patent applications by sector 2000-2012.
Chemistry Electrical engineering
Instruments Mechanical engineering
Other fields Total
Cars 8.82% 17.25% 8.48% 63.98% 1.46% 88,826 ICT 4.14% 81.01% 9.82% 4.77% 0.26% 165,187
Pharma 79.50% 1.63% 17.11% 1.60% 0.16% 75,859 Total
applications 74,982 150,380 36,737 65,920 1,853 329,872
Sources: European Commission, Patstat and OECD.
NL BE LU FR PT China UK ES HU MT CH (NW) CY LI
Patents and associated patent rightsTrademarksDesigns and models a)Copyrights a) c) c) c) d)Domain names Trade secrets /know-how a) b) b)a) Only if R&D declarationb) Know-how (BE) /in dustrial processes (FR) closely associated with patentsc) Only softwared) Only artistic
Yes , with restrictions :No:
Yes :Colour codes :
FR HU NL BE LU ES MT CY UK PT LI CH IE China
Top corporate income tax rate (TTR 2014)
38 20.6 25 34.00 29.2 30 35 12.5 21 31.5 12.50 8.5% (+ 6%
12.5 25
Effective tax rate on patent income within the patent box (calculated on top CIT rate with surcharges)
15.5 (16.245 % 2011-2015)
10.300 5.000 6.798 5.840 12.000 0.000 2.500 10.00a) 15.750 2.500 8.800 0.000 15.000
Year introduced 1971 2003 2007 2007 2008 2008 2010 2012 2013 a) 2014 2011 2011 1973 2007
(changed) (2012) (2010) (2013) (2008)
Only patents and rights associated with patents
Applicable to existing IP
Applicable to acquired IP b) c)* c)
Authority granting the IP right d) d) d*) d) d)
Development condition
Capital gains included? f) e)
Income from the sale of innovative products (embedded royalties)
na
Can R&D be performed abroad (or within a group)? g) h) j) i) k) o) l)
Cap
a) Phased in ti l l 2017, see deta i l s belowb) Must be held for at least two years . Anti -avoidance rules for intragroup exploi tation of IP rights .c)* i f ful ly or partia l ly improved c) If further developed and actively managed Colour codes:d) Has to be regis tered at the national IP office/d* granted by UKIO or EPOe) If between unrelated parties .f) Exempted i f held for at least one year or used to buy other IP.g) Covers patents developed within a group when managed and coordinated in the NL. h) If in a qual i fying R&D centre. Sources: i ) If active ownership, and sel f-developed. The data underlying the description of patent boxes come from the following sources: Deloitte, Ernst & Young, the Internationalj) If sel f-developed. Bureau of Fiscal Documentation, KPMG, PriceWaterhouse Coopers and various national sources. k) double tax rel ief l imited to 50% Additional sources that have been used are ACCA (2013) European Commission (2014b) Evers et al (2013) and Cao (2011).l ) at elast 60% done in China
Yes:Yes, with restrictions:No:
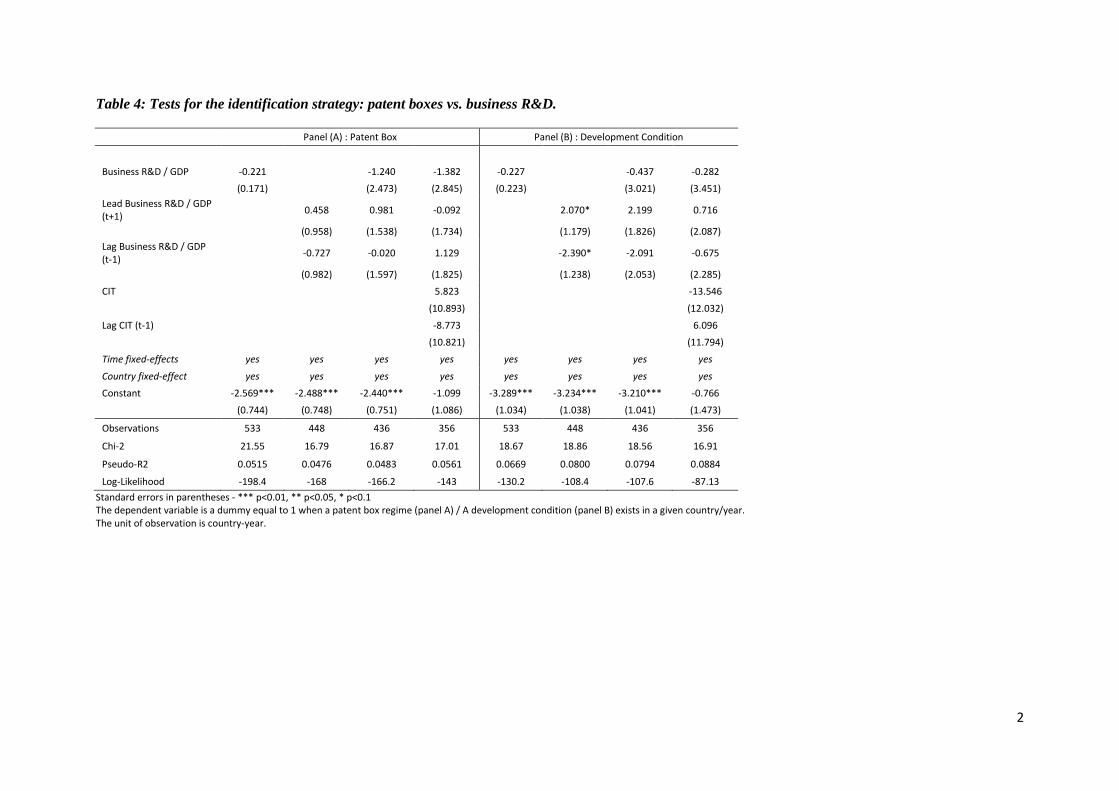
2
Table 4: Tests for the identification strategy: patent boxes vs. business R&D.
Panel (A) : Patent Box Panel (B) : Development Condition
Business R&D / GDP -0.221 -1.240 -1.382 -0.227 -0.437 -0.282
(0.171) (2.473) (2.845) (0.223) (3.021) (3.451) Lead Business R&D / GDP (t+1) 0.458 0.981 -0.092 2.070* 2.199 0.716
(0.958) (1.538) (1.734) (1.179) (1.826) (2.087) Lag Business R&D / GDP (t-1) -0.727 -0.020 1.129 -2.390* -2.091 -0.675
(0.982) (1.597) (1.825) (1.238) (2.053) (2.285)
CIT 5.823 -13.546
(10.893) (12.032)
Lag CIT (t-1) -8.773 6.096
(10.821) (11.794)
Time fixed-effects yes yes yes yes yes yes yes yes
Country fixed-effect yes yes yes yes yes yes yes yes Constant -2.569*** -2.488*** -2.440*** -1.099 -3.289*** -3.234*** -3.210*** -0.766
(0.744) (0.748) (0.751) (1.086) (1.034) (1.038) (1.041) (1.473)
Observations 533 448 436 356 533 448 436 356
Chi-2 21.55 16.79 16.87 17.01 18.67 18.86 18.56 16.91
Pseudo-R2 0.0515 0.0476 0.0483 0.0561 0.0669 0.0800 0.0794 0.0884
Log-Likelihood -198.4 -168 -166.2 -143 -130.2 -108.4 -107.6 -87.13 Standard errors in parentheses - *** p<0.01, ** p<0.05, * p<0.1 The dependent variable is a dummy equal to 1 when a patent box regime (panel A) / A development condition (panel B) exists in a given country/year. The unit of observation is country-year.
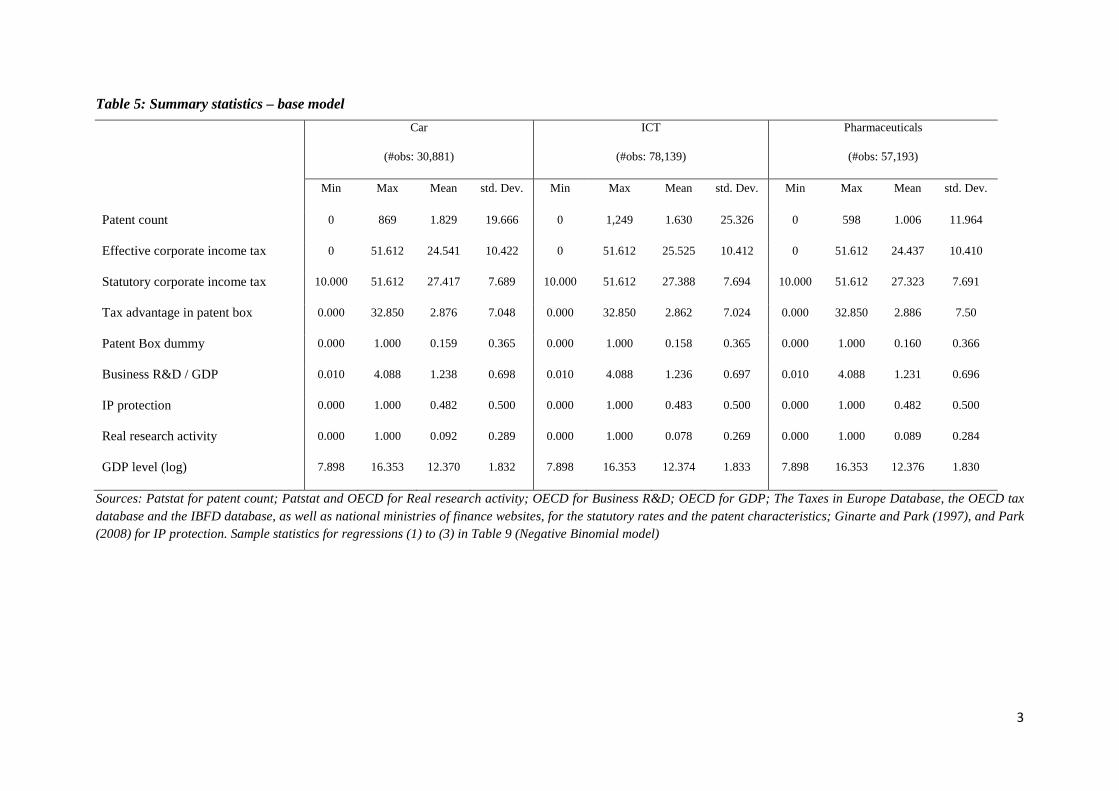
3
Table 5: Summary statistics – base model
Car
(#obs: 30,881)
ICT
(#obs: 78,139)
Pharmaceuticals
(#obs: 57,193)
Min Max Mean std. Dev. Min Max Mean std. Dev. Min Max Mean std. Dev.
Patent count 0 869 1.829 19.666 0 1,249 1.630 25.326 0 598 1.006 11.964
Effective corporate income tax 0 51.612 24.541 10.422 0 51.612 25.525 10.412 0 51.612 24.437 10.410
Statutory corporate income tax 10.000 51.612 27.417 7.689 10.000 51.612 27.388 7.694 10.000 51.612 27.323 7.691
Tax advantage in patent box 0.000 32.850 2.876 7.048 0.000 32.850 2.862 7.024 0.000 32.850 2.886 7.50
Patent Box dummy 0.000 1.000 0.159 0.365 0.000 1.000 0.158 0.365 0.000 1.000 0.160 0.366
Business R&D / GDP 0.010 4.088 1.238 0.698 0.010 4.088 1.236 0.697 0.010 4.088 1.231 0.696
IP protection 0.000 1.000 0.482 0.500 0.000 1.000 0.483 0.500 0.000 1.000 0.482 0.500
Real research activity 0.000 1.000 0.092 0.289 0.000 1.000 0.078 0.269 0.000 1.000 0.089 0.284
GDP level (log) 7.898 16.353 12.370 1.832 7.898 16.353 12.374 1.833 7.898 16.353 12.376 1.830
Sources: Patstat for patent count; Patstat and OECD for Real research activity; OECD for Business R&D; OECD for GDP; The Taxes in Europe Database, the OECD tax database and the IBFD database, as well as national ministries of finance websites, for the statutory rates and the patent characteristics; Ginarte and Park (1997), and Park (2008) for IP protection. Sample statistics for regressions (1) to (3) in Table 9 (Negative Binomial model)
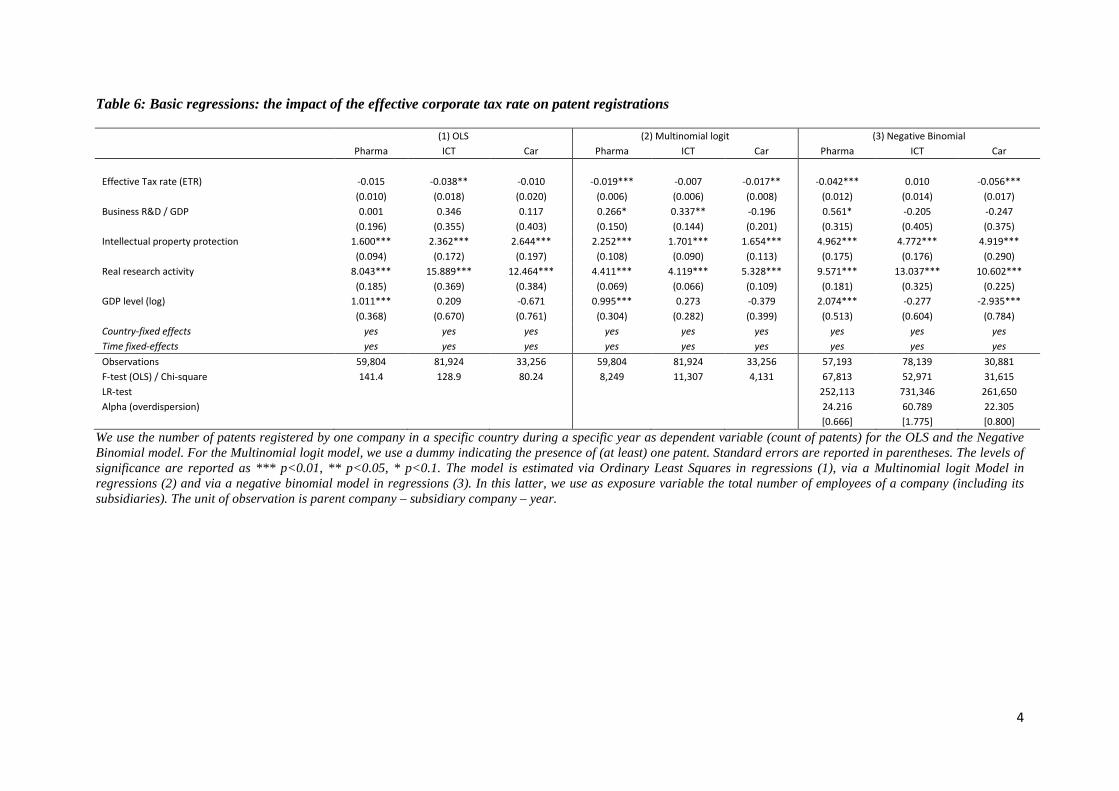
4
Table 6: Basic regressions: the impact of the effective corporate tax rate on patent registrations
(1) OLS (2) Multinomial logit (3) Negative Binomial
Pharma ICT Car Pharma ICT Car Pharma ICT Car Effective Tax rate (ETR) -0.015 -0.038** -0.010 -0.019*** -0.007 -0.017** -0.042*** 0.010 -0.056***
(0.010) (0.018) (0.020) (0.006) (0.006) (0.008) (0.012) (0.014) (0.017) Business R&D / GDP 0.001 0.346 0.117 0.266* 0.337** -0.196 0.561* -0.205 -0.247
(0.196) (0.355) (0.403) (0.150) (0.144) (0.201) (0.315) (0.405) (0.375) Intellectual property protection 1.600*** 2.362*** 2.644*** 2.252*** 1.701*** 1.654*** 4.962*** 4.772*** 4.919***
(0.094) (0.172) (0.197) (0.108) (0.090) (0.113) (0.175) (0.176) (0.290) Real research activity 8.043*** 15.889*** 12.464*** 4.411*** 4.119*** 5.328*** 9.571*** 13.037*** 10.602***
(0.185) (0.369) (0.384) (0.069) (0.066) (0.109) (0.181) (0.325) (0.225) GDP level (log) 1.011*** 0.209 -0.671 0.995*** 0.273 -0.379 2.074*** -0.277 -2.935***
(0.368) (0.670) (0.761) (0.304) (0.282) (0.399) (0.513) (0.604) (0.784) Country-fixed effects yes yes yes yes yes yes yes yes yes Time fixed-effects yes yes yes yes yes yes yes yes yes Observations 59,804 81,924 33,256 59,804 81,924 33,256 57,193 78,139 30,881 F-test (OLS) / Chi-square 141.4 128.9 80.24 8,249 11,307 4,131 67,813 52,971 31,615 LR-test 252,113 731,346 261,650 Alpha (overdispersion) 24.216 60.789 22.305 [0.666] [1.775] [0.800]
We use the number of patents registered by one company in a specific country during a specific year as dependent variable (count of patents) for the OLS and the Negative Binomial model. For the Multinomial logit model, we use a dummy indicating the presence of (at least) one patent. Standard errors are reported in parentheses. The levels of significance are reported as *** p<0.01, ** p<0.05, * p<0.1. The model is estimated via Ordinary Least Squares in regressions (1), via a Multinomial logit Model in regressions (2) and via a negative binomial model in regressions (3). In this latter, we use as exposure variable the total number of employees of a company (including its subsidiaries). The unit of observation is parent company – subsidiary company – year.
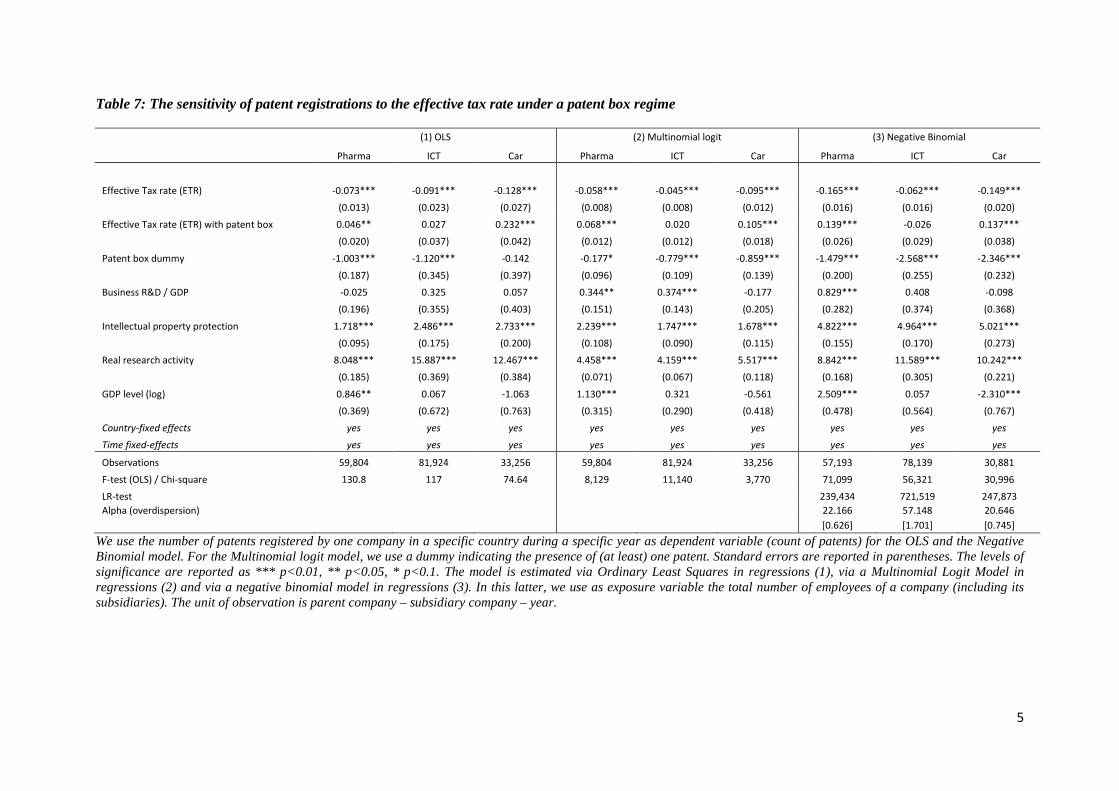
5
Table 7: The sensitivity of patent registrations to the effective tax rate under a patent box regime
(1) OLS (2) Multinomial logit (3) Negative Binomial
Pharma ICT Car Pharma ICT Car Pharma ICT Car
Effective Tax rate (ETR) -0.073*** -0.091*** -0.128*** -0.058*** -0.045*** -0.095*** -0.165*** -0.062*** -0.149***
(0.013) (0.023) (0.027) (0.008) (0.008) (0.012) (0.016) (0.016) (0.020)
Effective Tax rate (ETR) with patent box 0.046** 0.027 0.232*** 0.068*** 0.020 0.105*** 0.139*** -0.026 0.137***
(0.020) (0.037) (0.042) (0.012) (0.012) (0.018) (0.026) (0.029) (0.038)
Patent box dummy -1.003*** -1.120*** -0.142 -0.177* -0.779*** -0.859*** -1.479*** -2.568*** -2.346***
(0.187) (0.345) (0.397) (0.096) (0.109) (0.139) (0.200) (0.255) (0.232)
Business R&D / GDP -0.025 0.325 0.057 0.344** 0.374*** -0.177 0.829*** 0.408 -0.098
(0.196) (0.355) (0.403) (0.151) (0.143) (0.205) (0.282) (0.374) (0.368)
Intellectual property protection 1.718*** 2.486*** 2.733*** 2.239*** 1.747*** 1.678*** 4.822*** 4.964*** 5.021***
(0.095) (0.175) (0.200) (0.108) (0.090) (0.115) (0.155) (0.170) (0.273)
Real research activity 8.048*** 15.887*** 12.467*** 4.458*** 4.159*** 5.517*** 8.842*** 11.589*** 10.242***
(0.185) (0.369) (0.384) (0.071) (0.067) (0.118) (0.168) (0.305) (0.221)
GDP level (log) 0.846** 0.067 -1.063 1.130*** 0.321 -0.561 2.509*** 0.057 -2.310***
(0.369) (0.672) (0.763) (0.315) (0.290) (0.418) (0.478) (0.564) (0.767)
Country-fixed effects yes yes yes yes yes yes yes yes yes Time fixed-effects yes yes yes yes yes yes yes yes yes
Observations 59,804 81,924 33,256 59,804 81,924 33,256 57,193 78,139 30,881
F-test (OLS) / Chi-square 130.8 117 74.64 8,129 11,140 3,770 71,099 56,321 30,996
LR-test
239,434 721,519 247,873 Alpha (overdispersion) 22.166 57.148 20.646 [0.626] [1.701] [0.745]
We use the number of patents registered by one company in a specific country during a specific year as dependent variable (count of patents) for the OLS and the Negative Binomial model. For the Multinomial logit model, we use a dummy indicating the presence of (at least) one patent. Standard errors are reported in parentheses. The levels of significance are reported as *** p<0.01, ** p<0.05, * p<0.1. The model is estimated via Ordinary Least Squares in regressions (1), via a Multinomial Logit Model in regressions (2) and via a negative binomial model in regressions (3). In this latter, we use as exposure variable the total number of employees of a company (including its subsidiaries). The unit of observation is parent company – subsidiary company – year.
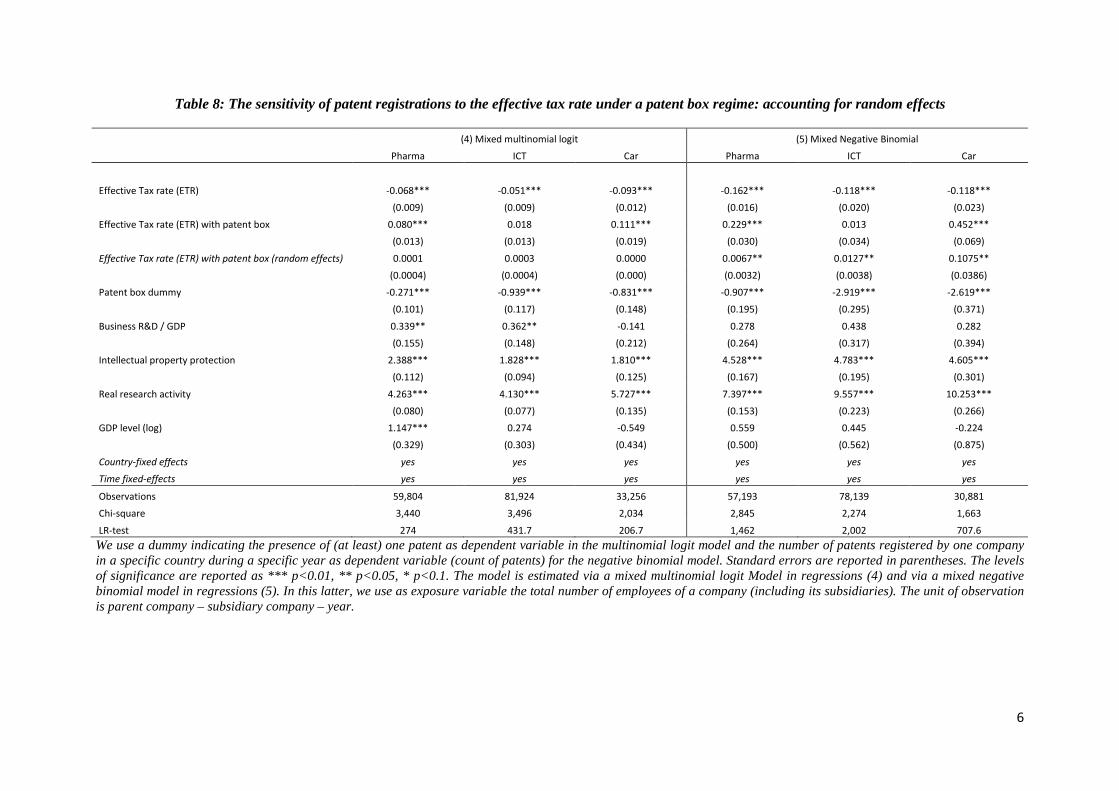
6
Table 8: The sensitivity of patent registrations to the effective tax rate under a patent box regime: accounting for random effects
(4) Mixed multinomial logit (5) Mixed Negative Binomial
Pharma ICT Car Pharma ICT Car
Effective Tax rate (ETR) -0.068*** -0.051*** -0.093*** -0.162*** -0.118*** -0.118***
(0.009) (0.009) (0.012) (0.016) (0.020) (0.023)
Effective Tax rate (ETR) with patent box 0.080*** 0.018 0.111*** 0.229*** 0.013 0.452***
(0.013) (0.013) (0.019) (0.030) (0.034) (0.069)
Effective Tax rate (ETR) with patent box (random effects) 0.0001 0.0003 0.0000 0.0067** 0.0127** 0.1075**
(0.0004) (0.0004) (0.000) (0.0032) (0.0038) (0.0386)
Patent box dummy -0.271*** -0.939*** -0.831*** -0.907*** -2.919*** -2.619***
(0.101) (0.117) (0.148) (0.195) (0.295) (0.371)
Business R&D / GDP 0.339** 0.362** -0.141 0.278 0.438 0.282
(0.155) (0.148) (0.212) (0.264) (0.317) (0.394)
Intellectual property protection 2.388*** 1.828*** 1.810*** 4.528*** 4.783*** 4.605***
(0.112) (0.094) (0.125) (0.167) (0.195) (0.301)
Real research activity 4.263*** 4.130*** 5.727*** 7.397*** 9.557*** 10.253***
(0.080) (0.077) (0.135) (0.153) (0.223) (0.266)
GDP level (log) 1.147*** 0.274 -0.549 0.559 0.445 -0.224
(0.329) (0.303) (0.434) (0.500) (0.562) (0.875)
Country-fixed effects yes yes yes yes yes yes Time fixed-effects yes yes yes yes yes yes
Observations 59,804 81,924 33,256 57,193 78,139 30,881
Chi-square 3,440 3,496 2,034 2,845 2,274 1,663
LR-test 274 431.7 206.7 1,462 2,002 707.6 We use a dummy indicating the presence of (at least) one patent as dependent variable in the multinomial logit model and the number of patents registered by one company in a specific country during a specific year as dependent variable (count of patents) for the negative binomial model. Standard errors are reported in parentheses. The levels of significance are reported as *** p<0.01, ** p<0.05, * p<0.1. The model is estimated via a mixed multinomial logit Model in regressions (4) and via a mixed negative binomial model in regressions (5). In this latter, we use as exposure variable the total number of employees of a company (including its subsidiaries). The unit of observation is parent company – subsidiary company – year.
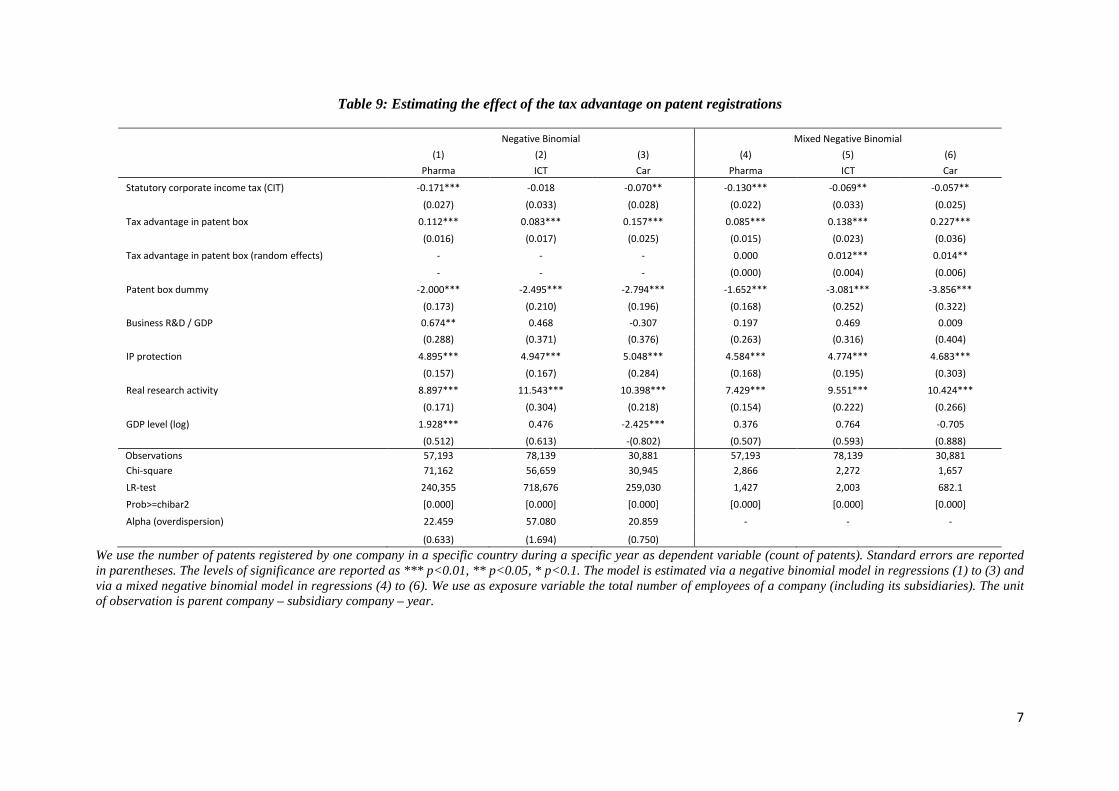
7
Table 9: Estimating the effect of the tax advantage on patent registrations
Negative Binomial Mixed Negative Binomial
(1) Pharma
(2) ICT
(3) Car
(4) Pharma
(5) ICT
(6) Car
Statutory corporate income tax (CIT) -0.171*** -0.018 -0.070** -0.130*** -0.069** -0.057**
(0.027) (0.033) (0.028) (0.022) (0.033) (0.025)
Tax advantage in patent box 0.112*** 0.083*** 0.157*** 0.085*** 0.138*** 0.227***
(0.016) (0.017) (0.025) (0.015) (0.023) (0.036)
Tax advantage in patent box (random effects) - - - 0.000 0.012*** 0.014**
- - - (0.000) (0.004) (0.006)
Patent box dummy -2.000*** -2.495*** -2.794*** -1.652*** -3.081*** -3.856***
(0.173) (0.210) (0.196) (0.168) (0.252) (0.322)
Business R&D / GDP 0.674** 0.468 -0.307 0.197 0.469 0.009
(0.288) (0.371) (0.376) (0.263) (0.316) (0.404)
IP protection 4.895*** 4.947*** 5.048*** 4.584*** 4.774*** 4.683***
(0.157) (0.167) (0.284) (0.168) (0.195) (0.303)
Real research activity 8.897*** 11.543*** 10.398*** 7.429*** 9.551*** 10.424***
(0.171) (0.304) (0.218) (0.154) (0.222) (0.266)
GDP level (log) 1.928*** 0.476 -2.425*** 0.376 0.764 -0.705
(0.512) (0.613) -(0.802) (0.507) (0.593) (0.888)
Observations 57,193 78,139 30,881 57,193 78,139 30,881 Chi-square 71,162 56,659 30,945 2,866 2,272 1,657
LR-test 240,355 718,676 259,030 1,427 2,003 682.1
Prob>=chibar2 [0.000] [0.000] [0.000] [0.000] [0.000] [0.000]
Alpha (overdispersion) 22.459 57.080 20.859 - - -
(0.633) (1.694) (0.750)
We use the number of patents registered by one company in a specific country during a specific year as dependent variable (count of patents). Standard errors are reported in parentheses. The levels of significance are reported as *** p<0.01, ** p<0.05, * p<0.1. The model is estimated via a negative binomial model in regressions (1) to (3) and via a mixed negative binomial model in regressions (4) to (6). We use as exposure variable the total number of employees of a company (including its subsidiaries). The unit of observation is parent company – subsidiary company – year.
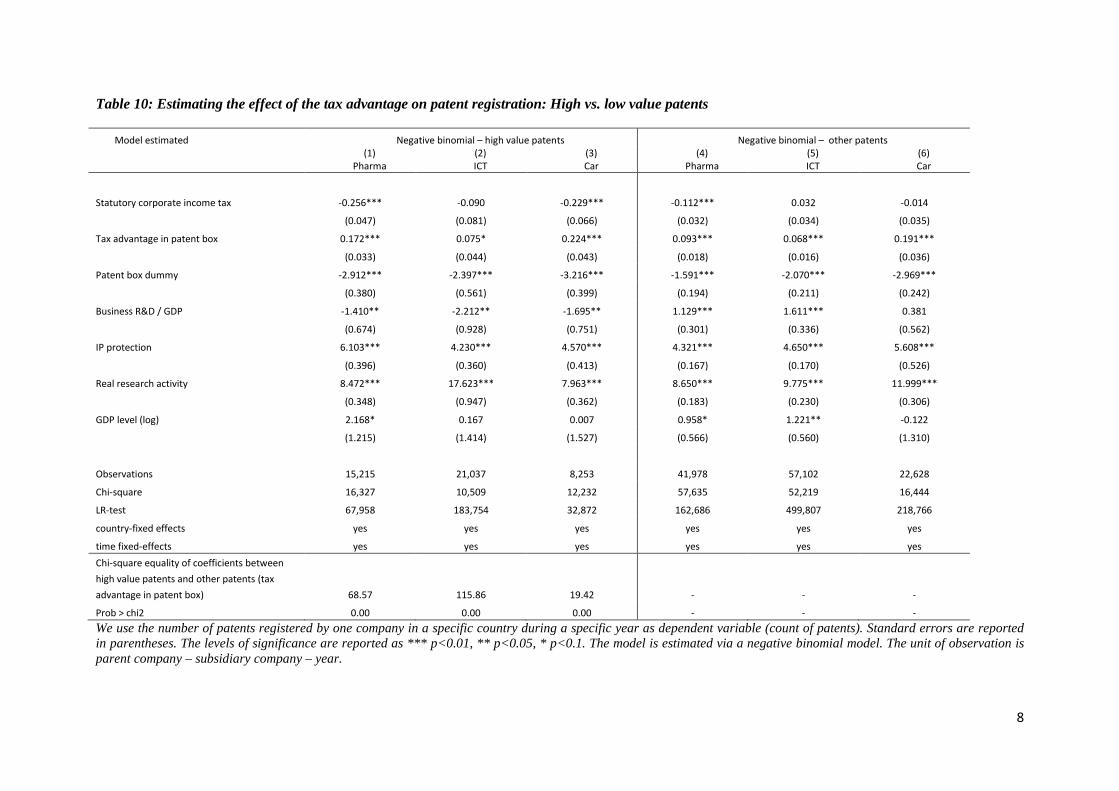
8
Table 10: Estimating the effect of the tax advantage on patent registration: High vs. low value patents
Model estimated Negative binomial – high value patents Negative binomial – other patents
(1)
Pharma (2) ICT
(3) Car
(4) Pharma
(5) ICT
(6) Car
Statutory corporate income tax -0.256*** -0.090 -0.229*** -0.112*** 0.032 -0.014
(0.047) (0.081) (0.066) (0.032) (0.034) (0.035)
Tax advantage in patent box 0.172*** 0.075* 0.224*** 0.093*** 0.068*** 0.191***
(0.033) (0.044) (0.043) (0.018) (0.016) (0.036)
Patent box dummy -2.912*** -2.397*** -3.216*** -1.591*** -2.070*** -2.969***
(0.380) (0.561) (0.399) (0.194) (0.211) (0.242)
Business R&D / GDP -1.410** -2.212** -1.695** 1.129*** 1.611*** 0.381
(0.674) (0.928) (0.751) (0.301) (0.336) (0.562)
IP protection 6.103*** 4.230*** 4.570*** 4.321*** 4.650*** 5.608***
(0.396) (0.360) (0.413) (0.167) (0.170) (0.526)
Real research activity 8.472*** 17.623*** 7.963*** 8.650*** 9.775*** 11.999***
(0.348) (0.947) (0.362) (0.183) (0.230) (0.306)
GDP level (log) 2.168* 0.167 0.007 0.958* 1.221** -0.122
(1.215) (1.414) (1.527) (0.566) (0.560) (1.310)
Observations 15,215 21,037 8,253 41,978 57,102 22,628
Chi-square 16,327 10,509 12,232 57,635 52,219 16,444
LR-test 67,958 183,754 32,872 162,686 499,807 218,766
country-fixed effects yes yes yes yes yes yes
time fixed-effects yes yes yes yes yes yes Chi-square equality of coefficients between high value patents and other patents (tax advantage in patent box) 68.57 115.86 19.42 - - -
Prob > chi2 0.00 0.00 0.00 - - - We use the number of patents registered by one company in a specific country during a specific year as dependent variable (count of patents). Standard errors are reported in parentheses. The levels of significance are reported as *** p<0.01, ** p<0.05, * p<0.1. The model is estimated via a negative binomial model. The unit of observation is parent company – subsidiary company – year.
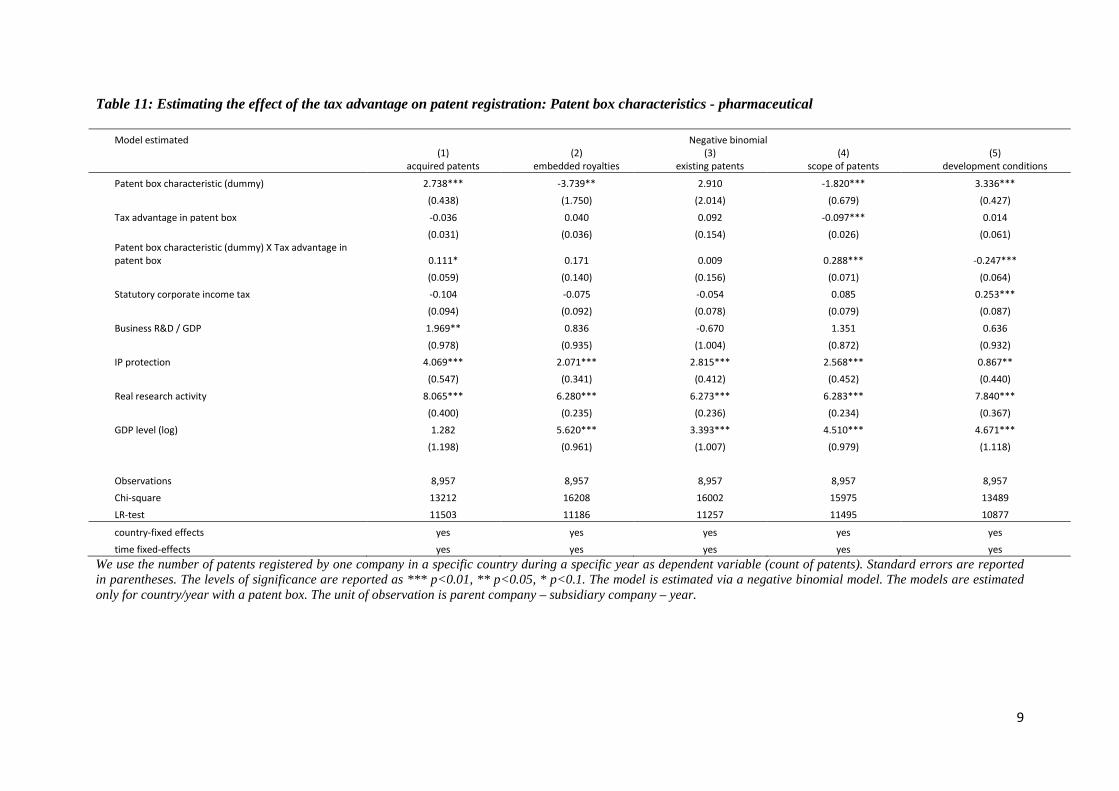
9
Table 11: Estimating the effect of the tax advantage on patent registration: Patent box characteristics - pharmaceutical
Model estimated Negative binomial
(1) acquired patents
(2) embedded royalties
(3) existing patents
(4) scope of patents
(5) development conditions
Patent box characteristic (dummy) 2.738*** -3.739** 2.910 -1.820*** 3.336***
(0.438) (1.750) (2.014) (0.679) (0.427)
Tax advantage in patent box -0.036 0.040 0.092 -0.097*** 0.014
(0.031) (0.036) (0.154) (0.026) (0.061) Patent box characteristic (dummy) X Tax advantage in patent box 0.111* 0.171 0.009 0.288*** -0.247***
(0.059) (0.140) (0.156) (0.071) (0.064)
Statutory corporate income tax -0.104 -0.075 -0.054 0.085 0.253***
(0.094) (0.092) (0.078) (0.079) (0.087)
Business R&D / GDP 1.969** 0.836 -0.670 1.351 0.636
(0.978) (0.935) (1.004) (0.872) (0.932)
IP protection 4.069*** 2.071*** 2.815*** 2.568*** 0.867**
(0.547) (0.341) (0.412) (0.452) (0.440)
Real research activity 8.065*** 6.280*** 6.273*** 6.283*** 7.840***
(0.400) (0.235) (0.236) (0.234) (0.367)
GDP level (log) 1.282 5.620*** 3.393*** 4.510*** 4.671***
(1.198) (0.961) (1.007) (0.979) (1.118)
Observations 8,957 8,957 8,957 8,957 8,957
Chi-square 13212 16208 16002 15975 13489
LR-test 11503 11186 11257 11495 10877
country-fixed effects yes yes yes yes yes
time fixed-effects yes yes yes yes yes We use the number of patents registered by one company in a specific country during a specific year as dependent variable (count of patents). Standard errors are reported in parentheses. The levels of significance are reported as *** p<0.01, ** p<0.05, * p<0.1. The model is estimated via a negative binomial model. The models are estimated only for country/year with a patent box. The unit of observation is parent company – subsidiary company – year.
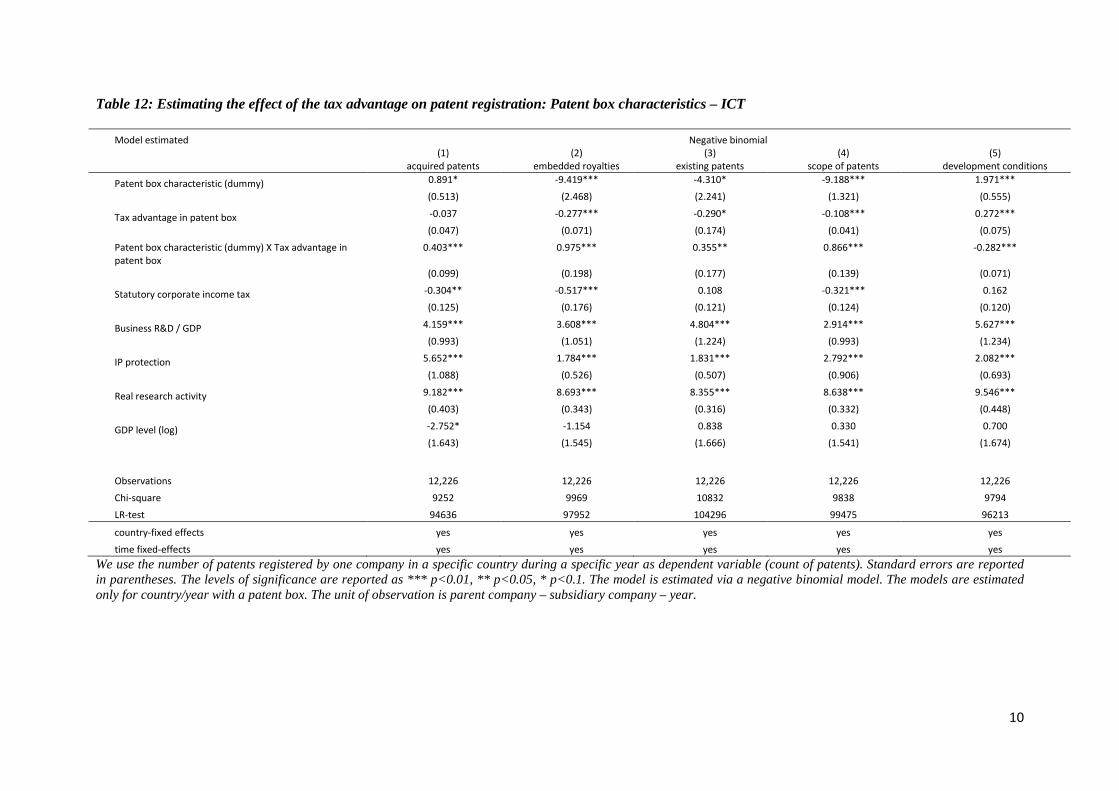
10
Table 12: Estimating the effect of the tax advantage on patent registration: Patent box characteristics – ICT
Model estimated Negative binomial
(1) acquired patents
(2) embedded royalties
(3) existing patents
(4) scope of patents
(5) development conditions
Patent box characteristic (dummy) 0.891* -9.419*** -4.310* -9.188*** 1.971***
(0.513) (2.468) (2.241) (1.321) (0.555)
Tax advantage in patent box -0.037 -0.277*** -0.290* -0.108*** 0.272***
(0.047) (0.071) (0.174) (0.041) (0.075)
Patent box characteristic (dummy) X Tax advantage in patent box
0.403*** 0.975*** 0.355** 0.866*** -0.282***
(0.099) (0.198) (0.177) (0.139) (0.071)
Statutory corporate income tax -0.304** -0.517*** 0.108 -0.321*** 0.162
(0.125) (0.176) (0.121) (0.124) (0.120)
Business R&D / GDP 4.159*** 3.608*** 4.804*** 2.914*** 5.627***
(0.993) (1.051) (1.224) (0.993) (1.234)
IP protection 5.652*** 1.784*** 1.831*** 2.792*** 2.082***
(1.088) (0.526) (0.507) (0.906) (0.693)
Real research activity 9.182*** 8.693*** 8.355*** 8.638*** 9.546***
(0.403) (0.343) (0.316) (0.332) (0.448)
GDP level (log) -2.752* -1.154 0.838 0.330 0.700
(1.643) (1.545) (1.666) (1.541) (1.674)
Observations 12,226 12,226 12,226 12,226 12,226
Chi-square 9252 9969 10832 9838 9794
LR-test 94636 97952 104296 99475 96213
country-fixed effects yes yes yes yes yes
time fixed-effects yes yes yes yes yes We use the number of patents registered by one company in a specific country during a specific year as dependent variable (count of patents). Standard errors are reported in parentheses. The levels of significance are reported as *** p<0.01, ** p<0.05, * p<0.1. The model is estimated via a negative binomial model. The models are estimated only for country/year with a patent box. The unit of observation is parent company – subsidiary company – year.
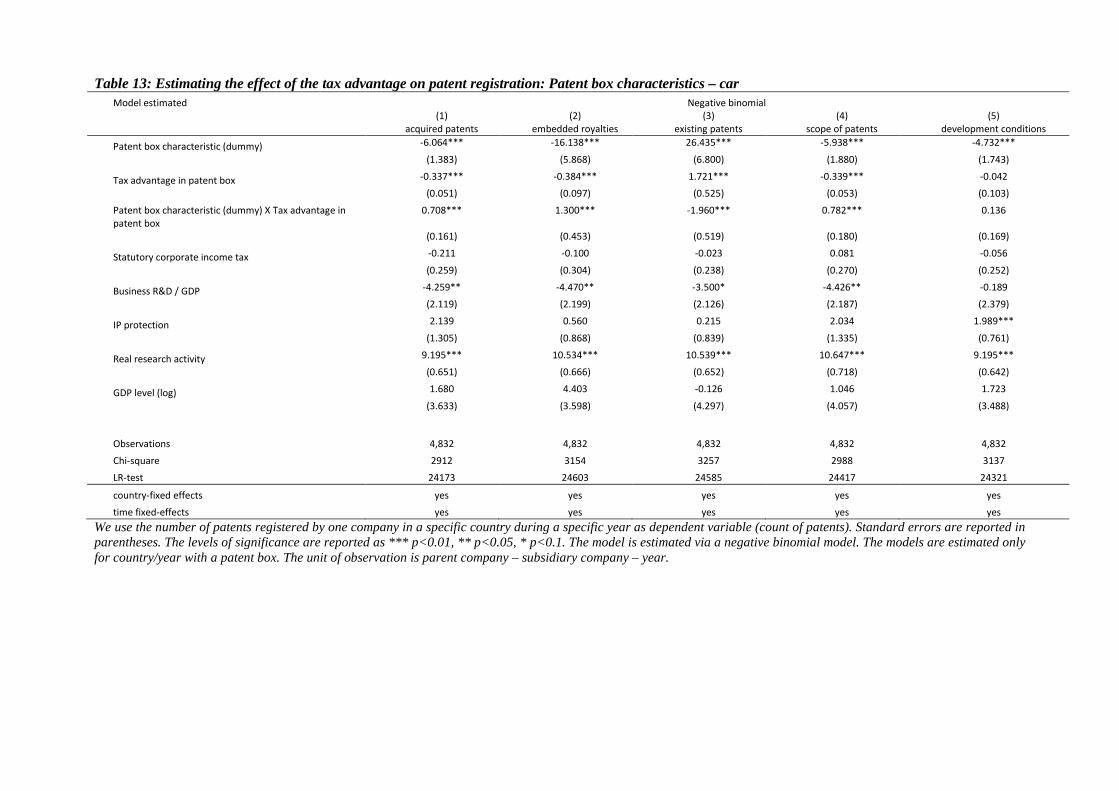
Table 13: Estimating the effect of the tax advantage on patent registration: Patent box characteristics – car Model estimated Negative binomial
(1) acquired patents
(2) embedded royalties
(3) existing patents
(4) scope of patents
(5) development conditions
Patent box characteristic (dummy) -6.064*** -16.138*** 26.435*** -5.938*** -4.732***
(1.383) (5.868) (6.800) (1.880) (1.743)
Tax advantage in patent box -0.337*** -0.384*** 1.721*** -0.339*** -0.042
(0.051) (0.097) (0.525) (0.053) (0.103)
Patent box characteristic (dummy) X Tax advantage in patent box
0.708*** 1.300*** -1.960*** 0.782*** 0.136
(0.161) (0.453) (0.519) (0.180) (0.169)
Statutory corporate income tax -0.211 -0.100 -0.023 0.081 -0.056
(0.259) (0.304) (0.238) (0.270) (0.252)
Business R&D / GDP -4.259** -4.470** -3.500* -4.426** -0.189
(2.119) (2.199) (2.126) (2.187) (2.379)
IP protection 2.139 0.560 0.215 2.034 1.989***
(1.305) (0.868) (0.839) (1.335) (0.761)
Real research activity 9.195*** 10.534*** 10.539*** 10.647*** 9.195***
(0.651) (0.666) (0.652) (0.718) (0.642)
GDP level (log) 1.680 4.403 -0.126 1.046 1.723
(3.633) (3.598) (4.297) (4.057) (3.488)
Observations 4,832 4,832 4,832 4,832 4,832
Chi-square 2912 3154 3257 2988 3137
LR-test 24173 24603 24585 24417 24321
country-fixed effects yes yes yes yes yes
time fixed-effects yes yes yes yes yes We use the number of patents registered by one company in a specific country during a specific year as dependent variable (count of patents). Standard errors are reported in parentheses. The levels of significance are reported as *** p<0.01, ** p<0.05, * p<0.1. The model is estimated via a negative binomial model. The models are estimated only for country/year with a patent box. The unit of observation is parent company – subsidiary company – year.
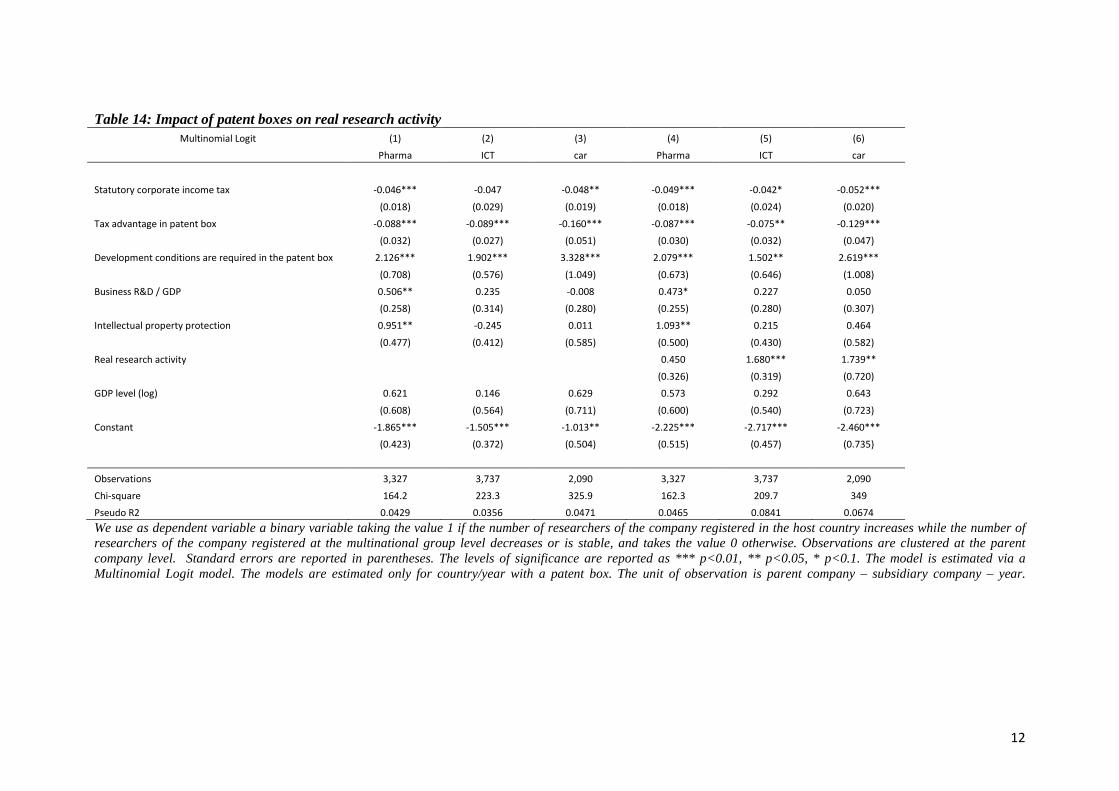
12
Table 14: Impact of patent boxes on real research activity
We use as dependent variable a binary variable taking the value 1 if the number of researchers of the company registered in the host country increases while the number of researchers of the company registered at the multinational group level decreases or is stable, and takes the value 0 otherwise. Observations are clustered at the parent company level. Standard errors are reported in parentheses. The levels of significance are reported as *** p<0.01, ** p<0.05, * p<0.1. The model is estimated via a Multinomial Logit model. The models are estimated only for country/year with a patent box. The unit of observation is parent company – subsidiary company – year.
Multinomial Logit (1) (2) (3) (4) (5) (6)
Pharma ICT car Pharma ICT car
Statutory corporate income tax -0.046*** -0.047 -0.048** -0.049*** -0.042* -0.052***
(0.018) (0.029) (0.019) (0.018) (0.024) (0.020)
Tax advantage in patent box -0.088*** -0.089*** -0.160*** -0.087*** -0.075** -0.129***
(0.032) (0.027) (0.051) (0.030) (0.032) (0.047)
Development conditions are required in the patent box 2.126*** 1.902*** 3.328*** 2.079*** 1.502** 2.619***
(0.708) (0.576) (1.049) (0.673) (0.646) (1.008)
Business R&D / GDP 0.506** 0.235 -0.008 0.473* 0.227 0.050
(0.258) (0.314) (0.280) (0.255) (0.280) (0.307)
Intellectual property protection 0.951** -0.245 0.011 1.093** 0.215 0.464
(0.477) (0.412) (0.585) (0.500) (0.430) (0.582)
Real research activity
0.450 1.680*** 1.739**
(0.326) (0.319) (0.720)
GDP level (log) 0.621 0.146 0.629 0.573 0.292 0.643
(0.608) (0.564) (0.711) (0.600) (0.540) (0.723)
Constant -1.865*** -1.505*** -1.013** -2.225*** -2.717*** -2.460***
(0.423) (0.372) (0.504) (0.515) (0.457) (0.735)
Observations 3,327 3,737 2,090 3,327 3,737 2,090
Chi-square 164.2 223.3 325.9 162.3 209.7 349
Pseudo R2 0.0429 0.0356 0.0471 0.0465 0.0841 0.0674

13
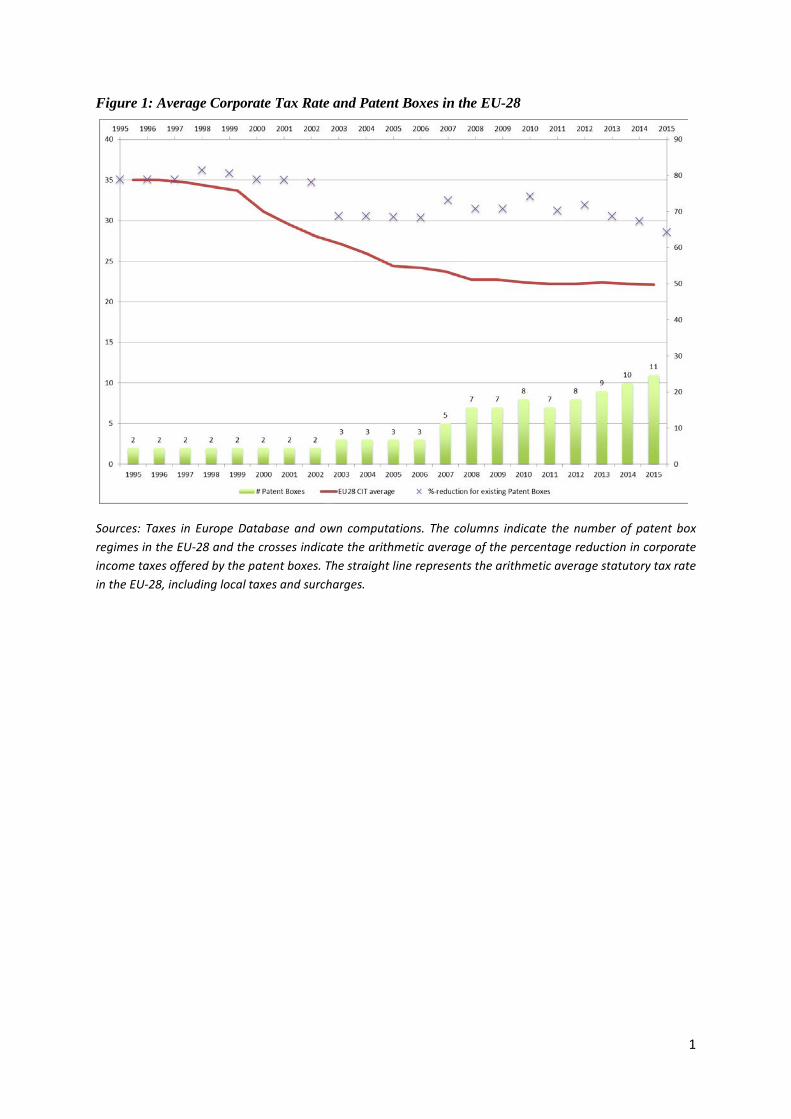
1
Figure 1: Average Corporate Tax Rate and Patent Boxes in the EU-28
Sources: Taxes in Europe Database and own computations. The columns indicate the number of patent box regimes in the EU-28 and the crosses indicate the arithmetic average of the percentage reduction in corporate income taxes offered by the patent boxes. The straight line represents the arithmetic average statutory tax rate in the EU-28, including local taxes and surcharges.
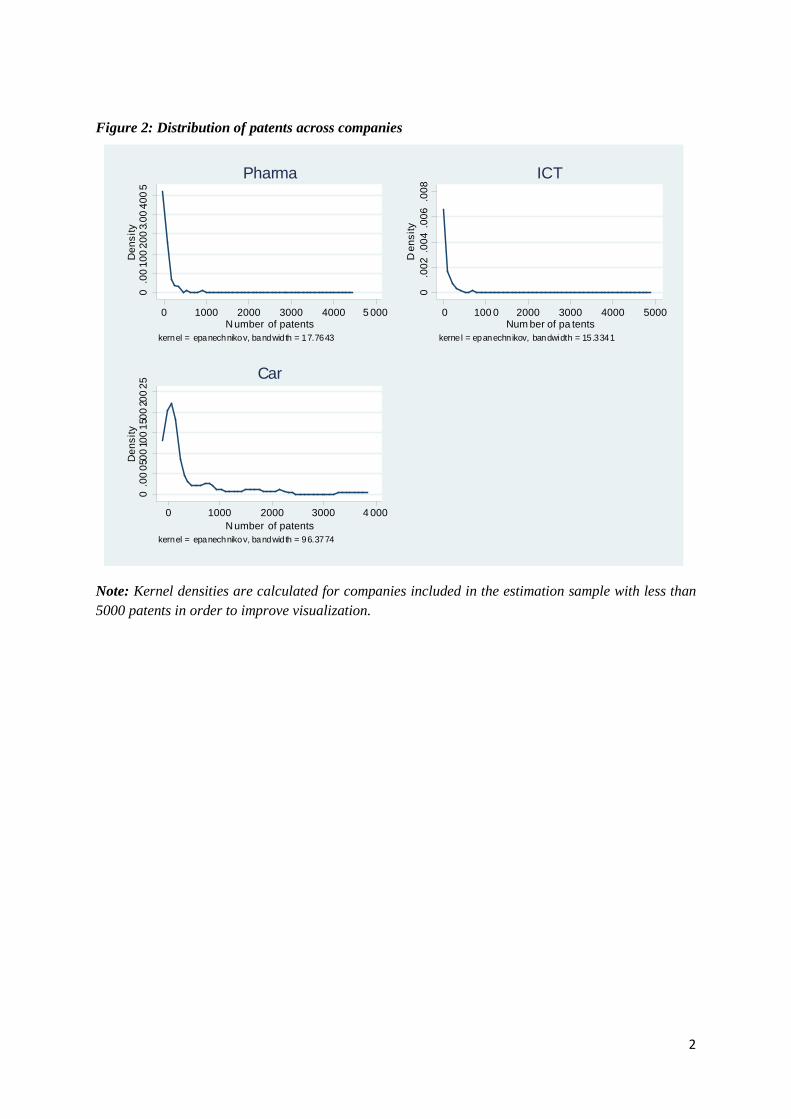
2
Figure 2: Distribution of patents across companies
Note: Kernel densities are calculated for companies included in the estimation sample with less than 5000 patents in order to improve visualization.
0.0
01.0
02.0
03.
004.0
05
Den
sity
0 1000 2000 3000 4000 5 000Number of patents
kernel = epanechnikov, bandwidth = 17.7643
Pharma
0.0
02.0
04.0
06.0
08D
ensi
ty
0 100 0 2000 3000 4000 5000Num ber of pa tents
kernel = epanechnikov, bandwidth = 15.3341
ICT
0.0
005
.00
1.00
15.0
02.0
025
Den
sity
0 1000 2000 3000 4 000Number of patents
kernel = epanechnikov, bandwidth = 96.3774
Car
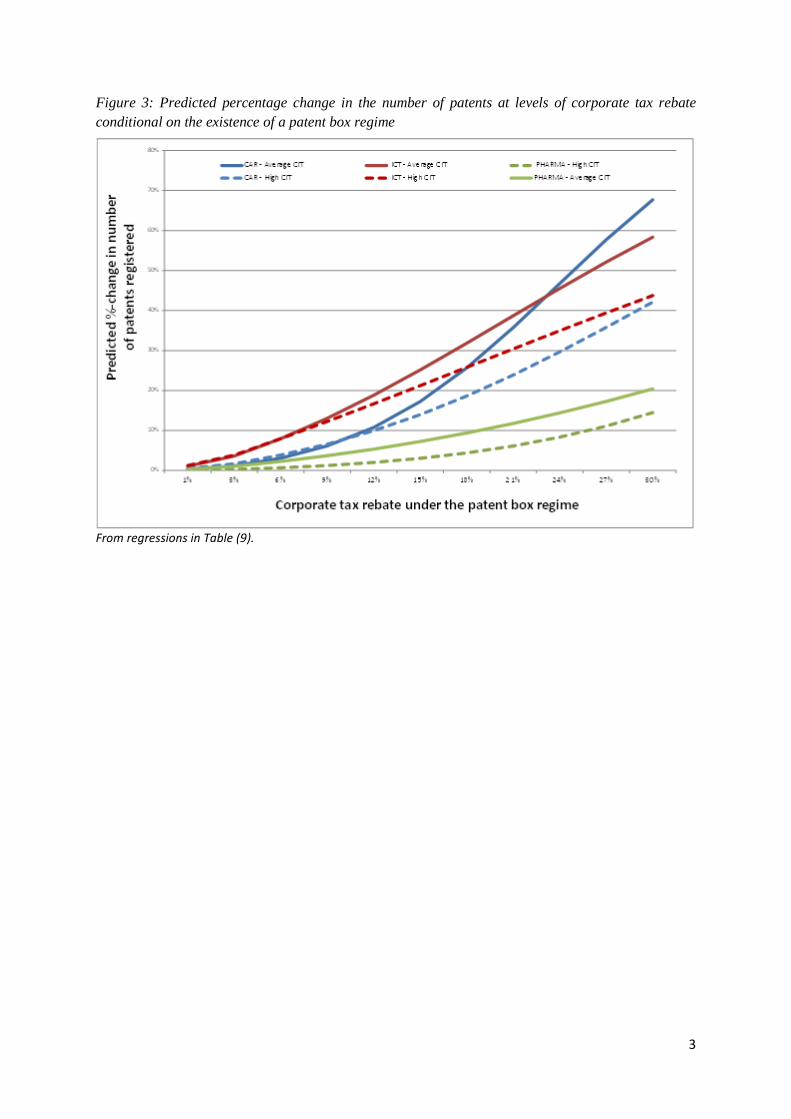
3
Figure 3: Predicted percentage change in the number of patents at levels of corporate tax rebate conditional on the existence of a patent box regime
From regressions in Table (9).
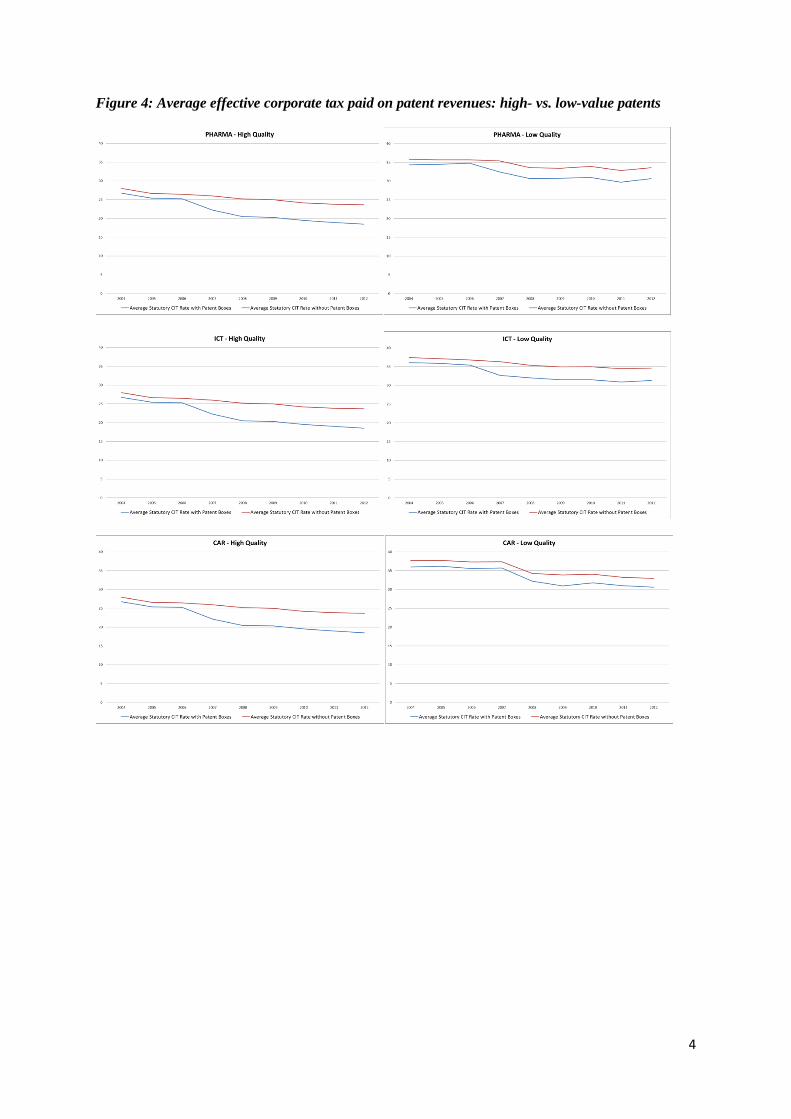
4
Figure 4: Average effective corporate tax paid on patent revenues: high- vs. low-value patents
Recommended