New Jersey
DEPARTM ENT OF
EDUCATION
1
Partnership for Assessment of Readiness
for College and Careers (PARCC):
Spring 2016 Results
Peter Shulman, Deputy Commissioner
Laura Morana, Acting Chief Academic Officer
Presentation to the New Jersey State Board
November 2, 2016

New Jersey
DEPARTM ENT OF
EDUCATION
2
Spring 2016 PARCC Results Show Promise
Students’ scores improved across the assessments
and grade levels indicating more students are on track
to being college and career ready
Thousands more students took the assessments,
providing more representative data of overall student
performance
Educators are seeing value in the assessment by using
PARCC data to align instruction to the New Jersey
Student Learning Standards
New Jersey
DEPARTM ENT OF
EDUCATION
3
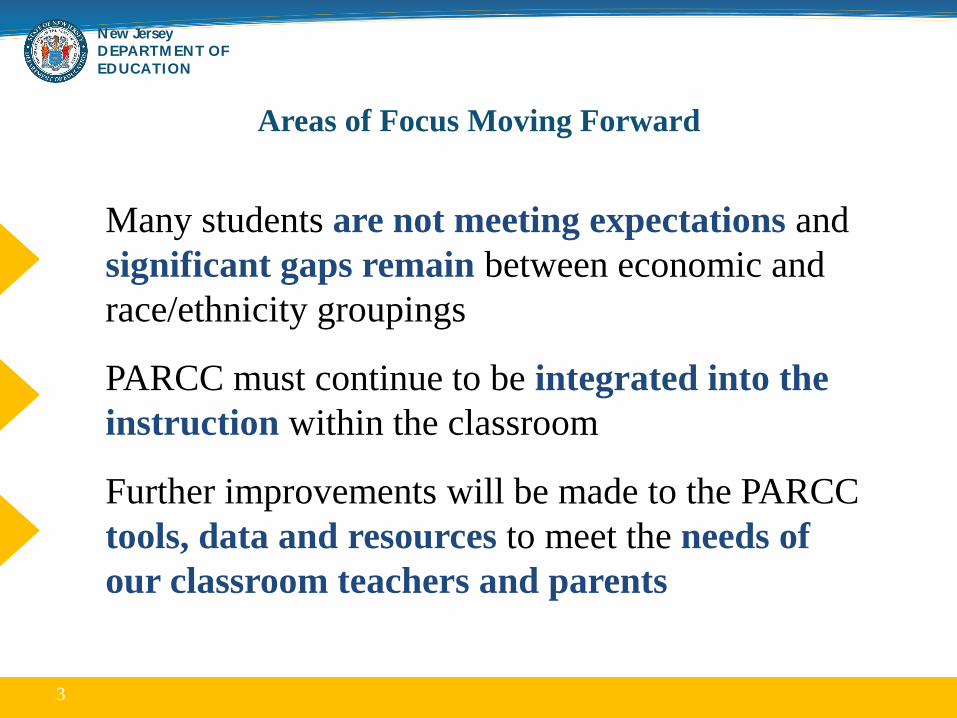
Areas of Focus Moving Forward
Many students are not meeting expectations and
significant gaps remain between economic and
race/ethnicity groupings
PARCC must continue to be integrated into the
instruction within the classroom
Further improvements will be made to the PARCC
tools, data and resources to meet the needs of
our classroom teachers and parents

New Jersey
DEPARTM ENT OF
EDUCATION
4
Historical Context
Since the 1980’s,
New Jersey has
assessed its
students’ progress
toward the state
standards, and will
continue to raise
the bar on student
expectations
In 2010, higher-
quality academic
standards were
adopted (further
enhanced in 2016);
and in 2015, New
Jersey transitioned
to the educator-
developed PARCC
assessments
Multiple research
studies have
validated PARCC as
a high-quality
assessment that is a
more accurate
predictor of college
and career readiness

New Jersey
DEPARTM ENT OF
EDUCATION
5
New Jersey Student
Learning Standards
Formative Assessments
Summative Assessments
Diagnostic Assessment
Interim Assessments
PARCC is Part of a Coherent Assessment System
Monitors student learning to
provide ongoing feedback that
can be used by educators
Indicates a student’s mastery of
standards throughout the school yearAssesses what students already know
and/or what they still need to learn
Provides a benchmark for how a student is
progressing towards meeting expectations
on the summative assessments
New Jersey Educators collect information from multiple sources as a well-designed assessment system

New Jersey
DEPARTM ENT OF
EDUCATION
6
Assessments are Part of the Cycle of Teaching and Learning
New Jersey Student Learning Standards provide goals for student learning. Curriculum,
instruction, and assessments support the teaching and learning of the standards.
Assessments are just one component of the Cycle of Teaching and
Learning, which is based on the New
Jersey Student Learning Standards

New Jersey
DEPARTM ENT OF
EDUCATION
7
PARCC Refresher
PARCC is administered in New Jersey in grades 3 through 11 in
English Language Arts/Literacy (ELA/L), and in math, grades 3-8 and
Algebra I, Geometry and Algebra II
Over 800,000 students took over 1.6 million PARCC assessments
PARCC is a criterion-referenced assessment that has a scale from
650-850. Students are grouped into 5 different performance-level
categories based on their scale score:
Level 1 = Did Not Yet Meet Expectations
Level 2 = Partially Met Expectations
Level 3 = Approached Expectations
Level 4 = Met Expectations
Level 5 = Exceeded Expectations
Students that score in levels 4 or 5 are considered on track to being
college and career ready

New Jersey
DEPARTM ENT OF
EDUCATION
8
Key Themes: Spring 2016 PARCC Administration
Administrative changes in response to parents and educators:
‒ Two testing windows condensed to one
‒ Fewer test questions and less testing time
‒ Results and resources sent months earlier to schools and families
Students progress was evident across grade levels and subject areas, as well as
race/ethnicity and economic groups
‒ Students in the primary grades are benefiting considerably from higher-
quality standards
‒ Matched data sets show significant annual increases for the same students
who took the tests both years
‒ High school students took advantage of the flexibility offered by the NJDOE
by taking an AP/IB test in lieu of the PARCC Grade 11 ELA/L
The vast achievement gaps between economic and race/ethnicity groupings remain a
concern

New Jersey
DEPARTM ENT OF
EDUCATION
9
Comparison of New Jersey’s Spring 2015 and Spring 2016
PARCC Results: English Language Arts/LiteracyNot YetMeeting
Expectations(Level 1)
Partially Meeting Expectations
(Level 2)
Approaching Expectations
(Level 3)
Meeting Expectations
(Level 4)
Exceeding Expectations
(Level 5)
% Change in Level 1 and
Level 2
% Change in Level 4 and Level
5(College and
Career Ready)2015 2016 2015 2016 2015 2016 2015 2016 2015 2016
Grade 3 15.1% 13.5% 17.8% 16.0% 23.7% 23.0% 38.6% 41.3% 4.9% 6.2% 3.4% 4.1%
Grade 4 7.8% 8.2% 14.5% 13.5% 26.6% 24.8% 39.4% 40.8% 11.7% 12.7% 0.6% 2.4%
Grade 5 7.2% 6.7% 15.1% 14.7% 26.1% 25.3% 45.1% 46.4% 6.4% 6.9% 0.9% 1.7%
Grade 6 7.9% 7.5% 15.5% 14.1% 27.8% 26.2% 39.7% 41.3% 9.1% 11.0% 1.9% 3.5%
Grade 7 10.8% 9.5% 14.5% 12.5% 23.1% 21.6% 33.9% 35.6% 17.7% 20.7% 3.3% 4.7%
Grade 8 11.5% 10.1% 14.6% 13.0% 22.3% 21.7% 39.1% 40.7% 12.5% 14.5% 3.0% 3.6%
Grade 9 17.6% 12.9% 19.0% 15.0% 23.6% 23.1% 30.3% 35.8% 9.5% 13.2% 8.7% 9.2%
Grade 10 25.3% 20.9% 17.7% 14.2% 20.3% 20.4% 25.6% 31.0% 11.0% 13.4% 7.8% 7.7%
Grade 11* 16.7% 18.5% 18.7% 18.1% 23.5% 23.3% 30.1% 31.7% 10.9% 8.4% 1.1% 0.9%
*Grade 11 does not include students who took an AP/IB test.
Notes: Data shown is preliminary. Percentages may not total 100 due to rounding.
Since last year, a higher percent of students in grades 3 through 10 achieved levels 4 and 5,
which means a higher percent of students are on the path to being college and career ready.
Also, there is a significant decline in the percent of students in levels 1 and 2.
New Jersey
DEPARTM ENT OF
EDUCATION
10
Comparison of New Jersey’s Spring 2015 and Spring 2016
PARCC Results: MathematicsNot Yet Meeting
Expectations(Level 1)
Partially Meeting Expectations
(Level 2)
Approaching Expectations
(Level 3)
Meeting Expectations
(Level 4)
Exceeding Expectations
(Level 5)
% Change in Level 1 and
Level 2
% Change in Level 4 and Level
5(College and
Career Ready)2015 2016 2015 2016 2015 2016 2015 2016 2015 2016
Grade 3 8.3% 8.1% 18.5% 15.9% 28.3% 24.3% 36.9% 39.0% 8.0% 12.7% 2.8% 6.8%
Grade 4 7.2% 8.0% 21.9% 18.6% 30.3% 26.8% 36.3% 41.2% 4.3% 5.4% 2.5% 5.9%
Grade 5 6.1% 6.2% 20.7% 18.3% 32.1% 28.2% 34.9% 38.4% 6.1% 8.8% 2.3% 6.2%
Grade 6 7.6% 8.9% 21.4% 19.1% 30.2% 29.1% 34.8% 35.6% 6.0% 7.3% 1.0% 2.2%
Grade 7 7.7% 9.0% 22.3% 20.1% 33.3% 32.3% 33.0% 33.5% 3.8% 5.2% 0.9% 1.9%
Grade 8* 21.9% 21.5% 26.2% 25.3% 28.4% 27.5% 23.0% 24.9% 0.5% 0.7% 1.3% 2.1%
Algebra I 13.8% 12.8% 25.3% 21.3% 25.0% 24.8% 32.9% 37.3% 3.1% 3.9% 5.0% 5.2%
Algebra II 31.7% 33.5% 24.5% 22.6% 19.9% 18.8% 22.3% 22.7% 1.6% 2.4% 0.1% 1.1%
Geometry 12.4% 10.5% 35.6% 31.1% 29.7% 31.4% 19.5% 23.2% 2.9% 3.8% 6.3% 4.6%
*Approximately 30,000 New Jersey students in grade 8 participated in the PARCC Algebra I assessment. Thus, PARCC Math 8 outcomes are not
representative of grade 8 performance as a whole. Notes: Data shown is preliminary. Percentages may not total 100 due to rounding.
Across all grades, the positive year-to-year trend also continues in math. There is a decline in
the percent of students in the lower two levels of performance, along with an increase in the
percent of students who are meeting or exceeding expectations.

New Jersey
DEPARTM ENT OF
EDUCATION
11
Matched Cohort of Student Performance in PARCC
“Level 1” Across Spring 2015 and Spring 2016: ELA/L
Assessment taken in Spring 2015
Total number of students getting a
“Level 1” in Spring 2015
Total number of students who
moved up one level or more in
Spring 2016
Percent of students who moved up one
level or more in Spring 2016
ELA 3 12,853 7,654 59.6%
ELA 4 6,677 3,416 51.2%
ELA 5 6,196 2,969 47.9%
ELA 6 6,560 2,493 38%
ELA 7 8,663 3,691 42.6%
ELA 8 3,920 3,920 46.7%
ELA 9 11,771 3,962 33.7%
ELA 10 14,405 8,265 57.4%
By following the individual student performance from one grade to the next in ELA/L, the
data shows up to 60 percent of those same students who scored in “Level 1” in Spring 2015
scored at least one level higher in Spring 2016.
NOTE: PARCC ELA/L 11 outcomes are not shown as some of these students participate in AP or IB ELA/L.

New Jersey
DEPARTM ENT OF
EDUCATION
12
Matched Cohort of Student Performance in PARCC
“Level 1” Across Spring 2015 and Spring 2016: Math
Assessment taken in Spring 2015
Total number of students getting a
“Level 1” in Spring 2015
Total number of students who movedup one level or more
in Spring 2016
Percent of students who moved up one
level or more in Spring 2016
Math 3 6,940 3,309 47.7%
Math 4 6,067 3,418 56.3%
Math 5 5,190 2,360 45.5%
Math 6 6,339 2,940 46.4%
Math 7 5,571 1,603 28.8%
NOTE: PARCC Math 8 outcomes are not shown as many of these students participate in Algebra 1, Geometry or Algebra II. This is likely the reason
for the 28.8% shown here which goes against the positive trend.
By following the individual student performance from one grade to the next in math, the data
show at least 45 percent of students moved up one or more levels. The one exception is Math
7, which does not include the students in seventh grade who took Algebra 1.

New Jersey
DEPARTM ENT OF
EDUCATION
13
Percent of Students Meeting or Exceeding Expectations By
Economic Status: ELA/L
28
33 33 3337 38
31 3033
61
67 6664
6765
59
52
44
0
10
20
30
40
50
60
70
80
GR 03 GR 04 GR 05 GR 06 GR 07 GR 08 GR 09 GR 10 GR 11
Economically Disadvantaged Non-Economically Disadvantaged
The achievement gap between economically disadvantaged and non-economically
disadvantaged students persists across grade levels. Although the gap appears to decrease in
ELA/L at the high school level, the overall student performance declines in grade 9 through
grade 11 which contributes to the perceived reduction of the achievement gap.

New Jersey
DEPARTM ENT OF
EDUCATION
14
Percent of Students Meeting or Exceeding Expectations By
Economic Status: Math
32
27 28
2321
18
23
1210
66
60 60
55
50
32
52
3532
0
10
20
30
40
50
60
70
GR 03 GR 04 GR 05 GR 06 GR 07 GR 08 ALG 1 GEO ALG 2
Economically Disadvantaged Non-Economically Disadvantaged
The achievement gap between economically disadvantaged and non-economically
disadvantaged students persists across grade levels. Although the gap appears to decrease in
math for grade 8, Geometry and Algebra 2, the overall student performance is lower on these
assessments which contribute to the perceived reduction of the achievement gap.

New Jersey
DEPARTM ENT OF
EDUCATION
15
Percent of Students Meeting or Exceeding Expectations By
Race/Ethnicity: ELA/L
3033 32 31
35 34
29 283131
37 37 3741
43
34 3337
58
64 6361
6563
58
50
42
74
80 80 79
8482
78
69
58
0
10
20
30
40
50
60
70
80
90
GR 03 GR 04 GR 05 GR 06 GR 07 GR 08 GR 09 GR 10 GR 11
AFRICAN AMERICAN HISPANIC WHITE ASIAN
The achievement gap between race/ethnicity groups persists across grade levels in
English Language Arts/Literacy.

New Jersey
DEPARTM ENT OF
EDUCATION
16
Percent of Students Meeting or Exceeding Expectations By
Race/Ethnicity: Math
31
24 24
20 19
14
20
9 8
35
30 31
2623
20
24
12 11
63
57 57
53
47
32
51
34
30
82
7881
7673
49
76
6159
0
10
20
30
40
50
60
70
80
90
GR 03 GR 04 GR 05 GR 06 GR 07 GR 08 ALG 1 GEO ALG 2
AFRICAN AMERICAN HISPANIC WHITE ASIAN
The achievement gap between race/ethnicity groups persists across grade levels in math.

New Jersey
DEPARTM ENT OF
EDUCATION
17
PARCC Tools, Data and Resources Support
Educators and Parents
Initial Performance Data
• Quick Reports were released to districts in June to provide a first look at student data months sooner than previous statewide assessments
Resources to Drive Student Performance
• District Summary Reports, Individual Student Reports, and Evidence Statement Reports were disseminated near the beginning of the school year and provided final PARCC data disaggregated by student and standards
Interactive Resources
• Data Management Reporting System (DMRS) and Item Analysis Reports will provide customizable tools to analyze student data and will be available later this fall

New Jersey
DEPARTM ENT OF
EDUCATION
18
PARCC Helps Target and Align Supports
Accountability – PARCC meets the federal and state testing
requirements
Identification – PARCC provides more accurate representation of
college and career readiness, while helping identify student and
educator strengths and opportunities for improvement
Supports – PARCC puts New Jersey in a better position to allocate
necessary supports to where they are needed most
Statewide Supports – General guidance, resources and tools, such
as Professional Learning Communities
Targeted Supports – Regional Achievement Centers (RACs),
county office specialists and program office staff

New Jersey
DEPARTM ENT OF
EDUCATION
19
Shared Responsibility to Help Students
The NJDOE’s goal is to ensure that all students graduate from high
school college and career ready, and PARCC is one component of the
cycle of teaching and learning that will help students reach that goal
The NJDOE will continue to improve the administration of PARCC and
is committed to working with educators, parents, business community,
and local boards to enhance the assessment and related resources
through:
Leading, fostering and supporting district capacity
Developing and enhancing data-driven supports
Tiering and differentiating support around student learning and
educators as instructional leaders
Promoting a shared responsibility for student learning

New Jersey
DEPARTM ENT OF
EDUCATION
20
Resources to Learn More About PARCC
Publicly Accessible Resources:
• New Jersey Student Learning Standards
• Understandthescore.org
• PARCC Sample Items
Resources Available for New Jersey Educators:
• 2015-16 District/School Evidence Statement Analysis Report and School
Content Standards Roster Interpretation Guide
• New Jersey Collaborative Online Exchange
• Partnership Resource Center
• Partnerships for Advancing Student Success (PASS)
• Curricular Framework: English Language Arts/Literacy & Mathematics
• Professional Learning Communities
New Jersey
DEPARTM ENT OF
EDUCATION
21
What are NJ Educators Saying?
West Essex Regional School District Director of Curriculum and Instruction
Ryan Gupta: “PARCC is great because it breaks down every question and gives
us data to look at…We can look at that data and see what everyone understood
well, and we can see where students struggle, then use that data to make
adjustments.” (The Progress, 10/17/16)
Carlstadt Supervisor of Curriculum and Instruction Allison Evans: “With
scores being released earlier than the previous year, the district and teachers will be
able to use knowledge gained from the data to understand where instruction needs
to be driven and what individual students need…” (South Bergenite, 10/13/16)
Jackson Superintendent Stephen Genco: “Evaluating the results from PARCC
testing can be a helpful tool in measuring your child’s success in school, and it is
just one of the many ways our teachers [and] administrators can determine whether
he or she is on track to being college- and career-ready.” (Macromedia Publication, 9/30/16)

New Jersey
DEPARTM ENT OF
EDUCATION
22
Questions?
New Jersey
DEPARTM ENT OF
EDUCATION
23
Following Slides:
Subgroup Spring 2015 and
2016 PARCC results across
English Language
Arts/Literacy
and Math

New Jersey
DEPARTM ENT OF
EDUCATION
24
Comparison of New Jersey’s
Asian Students’ Results:
Spring 2015 and Spring 2016 PARCC Administrations
English Language Arts/Literacy
Not YetMeeting
Expectations(Level 1)
Partially Meeting Expectations
(Level 2)
Approaching Expectations
(Level 3)
Meeting Expectations
(Level 4)
Exceeding Expectations
(Level 5)
% Change in Level 1 and
Level 2
% Change in Level 4 and Level
5(College and
Career Ready)2015 2016 2015 2016 2015 2016 2015 2016 2015 2016
Grade 3 3.9% 3.5% 8.4% 6.9% 17.6% 15.9% 55.9% 56.8% 14.1% 17.0% 1.9% 3.8%
Grade 4 1.7% 2.1% 4.7% 4.4% 15.6% 14.0% 47.8% 48.3% 30.2% 31.2% 0.1% 1.5%
Grade 5 1.7% 1.6% 5.5% 4.6% 15.3% 13.4% 59.3% 60.2% 18.2% 20.1% 0.9% 2.8%
Grade 6 2.0% 2.0% 4.9% 4.5% 16.2% 14.5% 51.1% 49.3% 25.7% 29.7% 0.4% 2.2%
Grade 7 2.7% 2.2% 5.0% 3.5% 12.7% 10.3% 36.9% 35.0% 42.8% 48.9% 2.0% 4.4%
Grade 8 2.4% 2.6% 5.3% 4.3% 12.0% 11.0% 45.8% 44.0% 34.5% 38.1% 0.8% 1.8%
Grade 9 5.6% 3.1% 9.3% 5.4% 17.7% 13.3% 41.1% 41.3% 26.3% 37.0% 6.5% 10.8%
Grade 10 11.0% 8.1% 10.9% 8.0% 16.8% 14.9% 33.7% 36.6% 27.6% 32.5% 5.8% 7.8%
Grade 11* 7.8% 9.9% 10.1% 12.2% 18.2% 19.7% 36.8% 38.3% 27.1% 19.9% 4.2% 5.6%
*Grade 11 does not include students who took an AP/IB test.Notes: Data shown is preliminary. Percentages may not total 100 due to rounding.

New Jersey
DEPARTM ENT OF
EDUCATION
25
Comparison of New Jersey’s
Asian Students’ Results:
Spring 2015 and Spring 2016 PARCC Administrations
Mathematics
Not Yet Meeting Expectations
(Level 1)
Partially Meeting Expectations
(Level 2)
Approaching Expectations
(Level 3)
Meeting Expectations
(Level 4)
Exceeding Expectations
(Level 5)
% Change in Level 1 and
Level 2
% Change in Level 4 and Level 5
(College and Career Ready)
2015 2016 2015 2016 2015 2016 2015 2016 2015 2016
Grade 3 1.6% 1.6% 5.1% 4.1% 16.0% 11.8% 48.6% 46.0% 28.8% 36.4% 0.9% 5.1%
Grade 4 1.1% 1.7% 6.3% 5.0% 17.7% 14.9% 56.4% 57.3% 18.5% 21.1% 0.7% 3.5%
Grade 5 1.2% 1.2% 5.8% 4.5% 18.4% 13.5% 51.1% 49.3% 23.5% 31.5% 1.4% 6.2%
Grade 6 1.3% 1.8% 6.3% 6.0% 17.2% 16.3% 51.1% 49.3% 24.0% 26.6% 0.1% 0.7%
Grade 7 1.8% 2.0% 7.4% 5.9% 22.1% 19.4% 53.7% 52.6% 15.0% 20.1% 1.3% 4.0%
Grade 8* 9.7% 9.2% 16.1% 16.3% 28.4% 25.6% 43.5% 45.8% 2.3% 3.1% 0.4% 3.1%
Algebra I 3.2% 2.7% 9.6% 6.6% 17.1% 14.4% 55.7% 58.0% 14.4% 18.2% 3.5% 6.1%
Algebra II 10.8% 10.5% 14.8% 12.3% 19.8% 18.1% 47.1% 47.7% 7.5% 11.5% 2.8% 4.4%
Geometry 3.6% 2.6% 15.4% 12.4% 25.4% 23.9% 42.2% 43.5% 13.5% 17.6% 3.9% 5.5%
*Approximately 30,000 New Jersey students in grade 8 participated in the PARCC Algebra I assessment. Thus, PARCC Math 8 outcomes are not representative of grade 8 performance as a whole.Notes: Data shown is preliminary. Percentages may not total 100 due to rounding.

New Jersey
DEPARTM ENT OF
EDUCATION
26
Comparison of New Jersey’s
White Students’ Results:
Spring 2015 and Spring 2016 PARCC Administrations
English Language Arts/Literacy
Not Yet Meeting Expectations
(Level 1)
Partially Meeting Expectations
(Level 2)
Approaching Expectations
(Level 3)
Meeting Expectations
(Level 4)
Exceeding Expectations
(Level 5)
% Change in Level 1 and
Level 2
% Change in Level 4 and Level
5(College and
Career Ready)2015 2016 2015 2016 2015 2016 2015 2016 2015 2016
Grade 3 7.8% 6.6% 13.6% 12.1% 24.3% 22.9% 48.4% 50.8% 5.9% 7.6% 2.7% 4.1%
Grade 4 3.7% 3.9% 9.4% 9.0% 24.5% 22.6% 47.7% 48.7% 14.6% 15.7% 0.2% 2.1%
Grade 5 3.5% 3.5% 10.2% 9.9% 24.5% 23.2% 54.4% 55.5% 7.5% 7.9% 0.3% 1.5%
Grade 6 4.1% 4.0% 11.1% 10.2% 26.6% 24.5% 47.5% 48.6% 10.6% 12.6% 0.9% 3.1%
Grade 7 6.2% 5.6% 10.9% 9.3% 22.0% 20.0% 39.6% 40.8% 21.3% 24.3% 2.2% 4.2%
Grade 8 7.1% 6.2% 11.1% 10.4% 21.5% 20.5% 45.8% 46.3% 14.5% 16.5% 1.6% 2.6%
Grade 9 11.7% 7.3% 16.9% 12.1% 24.5% 23.1% 35.8% 42.3% 11.0% 15.2% 9.2% 10.6%
Grade 10 19.8% 16.1% 16.7% 12.9% 21.2% 20.8% 29.4% 34.8% 12.9% 15.3% 7.4% 7.9%
Grade 11* 14.1% 17.0% 17.1% 17.5% 22.9% 23.3% 33.2% 32.9% 12.7% 9.2% 3.3% 3.8%
*Grade 11 does not include students who took an AP/IB test.Notes: Data shown is preliminary. Percentages may not total 100 due to rounding.

New Jersey
DEPARTM ENT OF
EDUCATION
27
Comparison of New Jersey’s
White Students’ Results
Spring 2015 and Spring 2016 PARCC Administrations
Mathematics
Not Yet Meeting Expectations
(Level 1)
Partially Meeting Expectations
(Level 2)
Approaching Expectations
(Level 3)
Meeting Expectations
(Level 4)
Exceeding Expectations
(Level 5)
% Change in Level 1 and
Level 2
% Change in Level 4 and Level
5(College and
Career Ready)2015 2016 2015 2016 2015 2016 2015 2016 2015 2016
Grade 3 4.0% 3.8% 13.0% 10.4% 27.7% 22.7% 46.5% 47.8% 8.9% 15.2% 2.8% 7.7%
Grade 4 3.6% 3.9% 15.8% 12.8% 31.3% 26.5% 45.0% 51.3% 4.3% 5.5% 2.7% 7.6%
Grade 5 3.1% 3.0% 15.0% 12.4% 33.1% 27.9% 42.5% 47.5% 6.3% 9.3% 2.8% 8.0%
Grade 6 3.7% 4.3% 15.4% 13.3% 31.4% 29.7% 43.5% 44.8% 6.1% 7.9% 1.4% 3.2%
Grade 7 4.1% 4.9% 16.3% 14.7% 34.3% 33.1% 41.1% 41.6% 4.2% 5.7% 0.8% 2.0%
Grade 8* 15.0% 14.6% 23.8% 23.0% 32.0% 30.5% 28.8% 31.1% 0.4% 0.7% 1.1% 2.6%
Algebra I 9.6% 7.5% 20.8% 16.2% 26.4% 25.5% 40.4% 46.9% 2.8% 3.8% 6.6% 7.5%
Algebra II 25.9% 25.9% 23.7% 22.4% 22.9% 22.0% 26.3% 27.8% 1.2% 1.9% 1.3% 2.2%
Geometry 9.1% 6.6% 30.5% 24.7% 33.8% 35.2% 24.1% 29.8% 2.5% 3.7% 8.3% 7.0%
*Approximately 30,000 New Jersey students in grade 8 participated in the PARCC Algebra I assessment. Thus, PARCC Math 8 outcomes are not representative of grade 8 performance as a whole.Notes: Data shown is preliminary. Percentages may not total 100 due to rounding.
New Jersey
DEPARTM ENT OF
EDUCATION
28
Comparison of New Jersey’s
African American Students’ Results:
Spring 2015 and Spring 2016 PARCC Administrations
English Language Arts/Literacy
Not Yet Meeting Expectations
(Level 1)
Partially Meeting Expectations
(Level 2)
Approaching Expectations
(Level 3)
Meeting Expectations
(Level 4)
Exceeding Expectations
(Level 5)
% Change in Level 1 and
Level 2
% Change in Level4 and Level 5(College and
Career Ready)2015 2016 2015 2016 2015 2016 2015 2016 2015 2016
Grade 3 27.1% 24.2% 25.4% 22.1% 23.0% 24.0% 23.0% 27.3% 1.5% 2.3% 6.2% 5.2%
Grade 4 15.5% 15.2% 24.1% 22.0% 31.5% 30.1% 25.4% 28.1% 3.5% 4.7% 2.5% 3.9%
Grade 5 15.0% 13.4% 24.5% 24.7% 30.3% 29.7% 28.4% 30.1% 1.7% 2.0% 1.4% 2.0%
Grade 6 16.0% 14.9% 25.7% 22.9% 31.4% 31.1% 24.3% 27.5% 2.5% 3.6% 3.9% 4.3%
Grade 7 21.4% 17.9% 22.7% 20.8% 26.2% 26.4% 24.0% 27.1% 5.7% 7.8% 5.3% 5.2%
Grade 8 21.4% 19.3% 23.0% 20.8% 25.6% 26.2% 26.4% 29.1% 3.6% 4.6% 4.4% 3.6%
Grade 9 27.6% 21.0% 26.6% 23.1% 23.8% 26.5% 19.0% 25.0% 3.0% 4.4% 10.1% 7.4%
Grade 10 37.8% 31.2% 21.1% 19.5% 19.6% 21.8% 17.5% 22.2% 3.9% 5.3% 8.3% 6.1%
Grade 11* 23.7% 23.2% 24.6% 21.7% 25.8% 24.4% 22.3% 26.0% 3.6% 4.7% 3.4% 4.8%
*Grade 11 does not include students who took an AP/IB test.Notes: Data shown is preliminary. Percentages may not total 100 due to rounding.
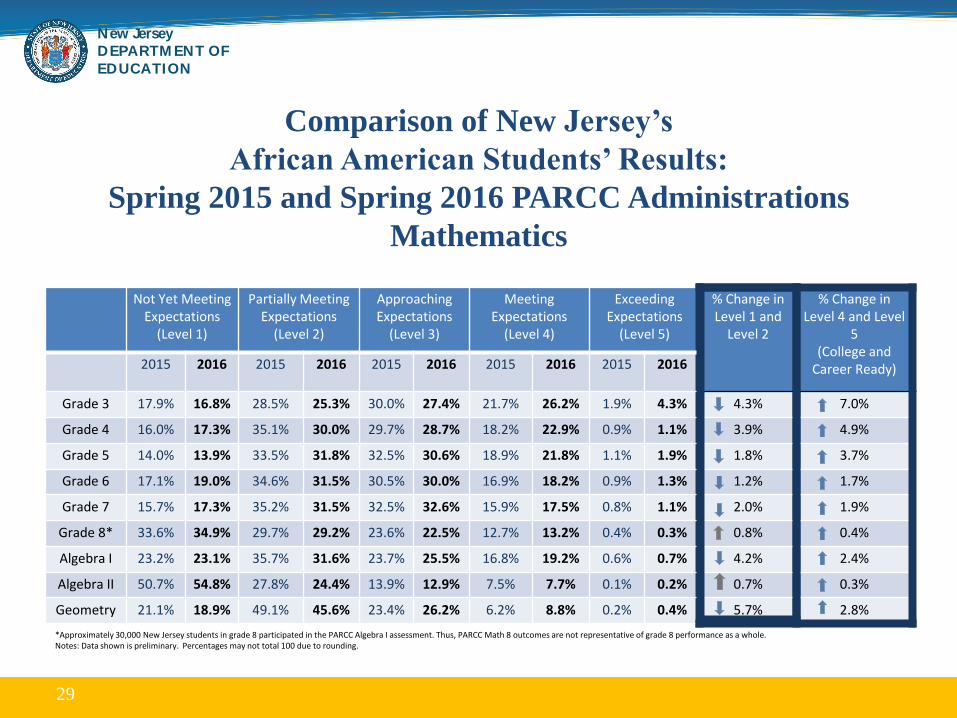
New Jersey
DEPARTM ENT OF
EDUCATION
29
Comparison of New Jersey’s
African American Students’ Results:
Spring 2015 and Spring 2016 PARCC Administrations
Mathematics
Not Yet Meeting Expectations
(Level 1)
Partially Meeting Expectations
(Level 2)
Approaching Expectations
(Level 3)
Meeting Expectations
(Level 4)
Exceeding Expectations
(Level 5)
% Change in Level 1 and
Level 2
% Change in Level 4 and Level
5(College and
Career Ready)2015 2016 2015 2016 2015 2016 2015 2016 2015 2016
Grade 3 17.9% 16.8% 28.5% 25.3% 30.0% 27.4% 21.7% 26.2% 1.9% 4.3% 4.3% 7.0%
Grade 4 16.0% 17.3% 35.1% 30.0% 29.7% 28.7% 18.2% 22.9% 0.9% 1.1% 3.9% 4.9%
Grade 5 14.0% 13.9% 33.5% 31.8% 32.5% 30.6% 18.9% 21.8% 1.1% 1.9% 1.8% 3.7%
Grade 6 17.1% 19.0% 34.6% 31.5% 30.5% 30.0% 16.9% 18.2% 0.9% 1.3% 1.2% 1.7%
Grade 7 15.7% 17.3% 35.2% 31.5% 32.5% 32.6% 15.9% 17.5% 0.8% 1.1% 2.0% 1.9%
Grade 8* 33.6% 34.9% 29.7% 29.2% 23.6% 22.5% 12.7% 13.2% 0.4% 0.3% 0.8% 0.4%
Algebra I 23.2% 23.1% 35.7% 31.6% 23.7% 25.5% 16.8% 19.2% 0.6% 0.7% 4.2% 2.4%
Algebra II 50.7% 54.8% 27.8% 24.4% 13.9% 12.9% 7.5% 7.7% 0.1% 0.2% 0.7% 0.3%
Geometry 21.1% 18.9% 49.1% 45.6% 23.4% 26.2% 6.2% 8.8% 0.2% 0.4% 5.7% 2.8%
*Approximately 30,000 New Jersey students in grade 8 participated in the PARCC Algebra I assessment. Thus, PARCC Math 8 outcomes are not representative of grade 8 performance as a whole.Notes: Data shown is preliminary. Percentages may not total 100 due to rounding.

New Jersey
DEPARTM ENT OF
EDUCATION
30
Comparison of New Jersey’s
Hispanic Students’ Results:
Spring 2015 and Spring 2016 PARCC Administrations
English Language Arts/Literacy
Not Yet Meeting Expectations
(Level 1)
Partially Meeting Expectations
(Level 2)
Approaching Expectations
(Level 3)
Meeting Expectations
(Level 4)
Exceeding Expectations
(Level 5)
% Change in Level 1 and
Level 2
% Change in Level4 and Level 5(College and
Career Ready)2015 2016 2015 2016 2015 2016 2015 2016 2015 2016
Grade 3 24.6% 21.8% 24.0% 22.0% 25.3% 25.1% 24.6% 28.7% 1.5% 2.4% 4.8% 5.1%
Grade 4 12.8% 13.6% 21.7% 19.5% 32.0% 29.8% 29.5% 31.8% 3.9% 5.3% 1.5% 3.7%
Grade 5 11.8% 10.7% 22.9% 21.4% 31.6% 31.2% 31.7% 34.3% 2.0% 2.4% 2.5% 3.0%
Grade 6 12.7% 11.7% 22.1% 20.0% 32.7% 31.4% 29.3% 32.2% 3.1% 4.7% 3.2% 4.5%
Grade 7 16.5% 14.9% 20.4% 17.3% 27.8% 26.6% 27.9% 31.4% 7.4% 9.9% 4.7% 6.0%
Grade 8 18.0% 15.1% 20.2% 16.9% 26.3% 25.5% 31.1% 35.6% 4.5% 6.9% 6.2% 7.0%
Grade 9 27.4% 22.2% 22.4% 19.1% 24.3% 24.8% 22.3% 28.0% 3.6% 5.8% 8.4% 8.0%
Grade 10 34.9% 29.1% 20.6% 16.2% 20.6% 21.3% 19.5% 26.6% 4.3% 6.8% 10.3% 9.5%
Grade 11* 21.5% 20.8% 21.9% 18.8% 25.6% 23.7% 26.1% 31.0% 4.9% 5.7% 3.8% 5.7%
*Grade 11 does not include students who took an AP/IB test.Notes: Data shown is preliminary. Percentages may not total 100 due to rounding.

New Jersey
DEPARTM ENT OF
EDUCATION
31
Comparison of New Jersey’s
Hispanic Students’ Results:
Spring 2015 and Spring 2016 PARCC Administrations
Mathematics
Not Yet Meeting Expectations
(Level 1)
Partially Meeting Expectations
(Level 2)
Approaching Expectations
(Level 3)
Meeting Expectations
(Level 4)
Exceeding Expectations
(Level 5)
% Change in Level 1 and
Level 2
% Change in Level 4 and Level
5(College and
Career Ready)2015 2016 2015 2016 2015 2016 2015 2016 2015 2016
Grade 3 12.5% 12.2% 27.0% 23.4% 33.0% 29.4% 25.3% 30.2% 2.2% 4.8% 3.9% 7.5%
Grade 4 10.6% 11.8% 31.1% 26.9% 34.0% 31.1% 23.4% 28.7% 0.9% 1.5% 3.0% 5.9%
Grade 5 9.0% 9.5% 29.8% 26.4% 36.2% 33.3% 23.4% 28.0% 1.6% 2.8% 2.9% 5.8%
Grade 6 11.8% 14.1% 30.9% 27.8% 33.4% 32.5% 22.6% 23.6% 1.3% 1.9% 0.8% 1.7%
Grade 7 11.3% 13.6% 30.9% 28.0% 35.9% 35.2% 21.1% 21.7% 0.8% 1.4% 0.5% 1.1%
Grade 8* 26.7% 25.2% 29.4% 27.7% 26.2% 26.9% 17.3% 19.6% 0.5% 0.6% 3.2% 2.4%
Algebra I 19.9% 19.5% 33.5% 29.5% 26.6% 26.8% 19.6% 23.4% 0.5% 0.9% 4.3% 4.1%
Algebra II 43.8% 45.3% 29.5% 26.7% 17.1% 16.8% 9.3% 10.8% 0.2% 0.4% 1.3% 1.7%
Geometry 17.3% 15.6% 46.8% 41.7% 27.4% 30.4% 8.2% 11.8% 0.3% 0.5% 6.8% 3.8%
*Approximately 30,000 New Jersey students in grade 8 participated in the PARCC Algebra I assessment. Thus, PARCC Math 8 outcomes are not representative of grade 8 performance as a whole.Notes: Data shown is preliminary. Percentages may not total 100 due to rounding.

New Jersey
DEPARTM ENT OF
EDUCATION
32
Comparison of New Jersey’s
Non-Economically Disadvantaged Students’ Results:
Spring 2015 and Spring 2016 PARCC Administrations
English Language Arts/Literacy
Not Yet Meeting Expectations
(Level 1)
Partially Meeting Expectations
(Level 2)
Approaching Expectations
(Level 3)
Meeting Expectations
(Level 4)
Exceeding Expectations
(Level 5)
% Change in Level 1 and
Level 2
% Change in Level 4 and Level
5(College and
Career Ready)2015 2016 2015 2016 2015 2016 2015 2016 2015 2016
Grade 3 6.9% 6.1% 12.6% 10.9% 23.0% 21.8% 50.1% 52.0% 7.5% 9.3% 2.5% 3.7%
Grade 4 3.4% 3.5% 8.6% 8.1% 22.9% 21.2% 47.6% 48.7% 17.5% 18.6% 0.4% 2.1%
Grade 5 3.4% 3.1% 9.3% 9.0% 22.6% 21.5% 55.2% 56.3% 9.5% 10.1% 0.6% 1.7%
Grade 6 3.9% 3.9% 10.2% 9.4% 24.8% 22.7% 47.8% 48.4% 13.2% 15.6% 0.9% 3.0%
Grade 7 5.9% 5.3% 10.3% 8.6% 20.5% 18.6% 38.8% 39.5% 24.4% 27.9% 2.3% 4.1%
Grade 8 6.9% 5.9% 10.6% 9.6% 20.2% 19.5% 45.0% 45.4% 17.3% 19.6% 1.9% 2.7%
Grade 9 12.4% 7.9% 16.0% 11.6% 23.4% 21.6% 35.3% 41.1% 12.9% 17.9% 8.9% 10.8%
Grade 10 20.0% 15.7% 16.0% 12.5% 20.3% 20.1% 29.2% 34.3% 14.6% 17.4% 7.8% 7.9%
Grade 11* 14.1% 16.4% 16.6% 16.9% 22.5% 22.9% 32.7% 33.5% 14.2% 10.3% 2.6% 3.0%
*Grade 11 does not include students who took an AP/IB test.Notes: Data shown is preliminary. Percentages may not total 100 due to rounding.

New Jersey
DEPARTM ENT OF
EDUCATION
33
Comparison of New Jersey’s
Non-Economically Disadvantaged Students’ Results:
Spring 2015 and Spring 2016 PARCC Administrations
Mathematics
Not Yet Meeting Expectations
(Level 1)
Partially Meeting Expectations
(Level 2)
Approaching Expectations
(Level 3)
Meeting Expectations
(Level 4)
Exceeding Expectations
(Level 5)
% Change in Level 1 and
Level 2
% Change in Level 4 and Level
5(College and
Career Ready)2015 2016 2015 2016 2015 2016 2015 2016 2015 2016
Grade 3 3.8% 3.6% 11.6% 9.6% 25.7% 20.9% 46.6% 47.1% 12.3% 18.9% 2.2% 7.0%
Grade 4 3.5% 3.7% 14.5% 11.6% 28.7% 24.5% 46.6% 52.0% 6.7% 8.2% 2.7% 6.9%
Grade 5 3.2% 3.0% 13.9% 11.5% 30.2% 25.6% 43.6% 47.0% 9.2% 13.0% 2.6% 7.3%
Grade 6 4.0% 4.6% 14.5% 13.0% 28.9% 27.4% 43.6% 44.3% 9.0% 10.8% 1.0% 2.5%
Grade 7 4.5% 5.1% 15.9% 14.4% 32.6% 31.0% 41.5% 42.0% 5.5% 7.5% 0.9% 2.5%
Grade 8* 16.4% 15.6% 23.8% 22.9% 30.8% 29.6% 28.4% 30.9% 0.6% 0.8% 1.6% 2.8%
Algebra I 10.0% 8.3% 20.5% 16.2% 24.8% 23.8% 40.4% 46.0% 4.3% 5.7% 5.9% 6.8%
Algebra II 25.7% 26.2% 22.8% 21.1% 21.3% 20.4% 28.1% 29.0% 2.2% 3.3% 1.1% 2.1%
Geometry 9.5% 7.1% 29.8% 25.1% 31.4% 32.9% 25.2% 29.6% 4.1% 5.4% 7.1% 5.7%
*Approximately 30,000 New Jersey students in grade 8 participated in the PARCC Algebra I assessment. Thus, PARCC Math 8 outcomes are not representative of grade 8 performance as a whole.Notes: Data shown is preliminary. Percentages may not total 100 due to rounding.

New Jersey
DEPARTM ENT OF
EDUCATION
34
Comparison of New Jersey’s
Economically Disadvantaged Students’ Results:
Spring 2015 and Spring 2016 PARCC Administrations
English Language Arts/Literacy
Not Yet Meeting Expectations
(Level 1)
Partially Meeting Expectations
(Level 2)
Approaching Expectations
(Level 3)
Meeting Expectations
(Level 4)
Exceeding Expectations
(Level 5)
% Change in Level 1 and
Level 2
% Change in Level 4 and Level
5(College and
Career Ready)2015 2016 2015 2016 2015 2016 2015 2016 2015 2016
Grade 3 26.7% 23.9% 25.1% 23.1% 24.7% 24.7% 22.3% 26.4% 1.2% 2.0% 4.8% 4.8%
Grade 4 14.4% 15.1% 23.4% 21.4% 32.2% 30.2% 26.9% 29.1% 3.0% 4.2% 1.3% 3.2%
Grade 5 13.3% 12.4% 24.5% 23.7% 31.8% 31.2% 29.0% 30.9% 1.4% 1.8% 1.6% 2.3%
Grade 6 14.4% 13.4% 24.2% 22.0% 32.6% 31.9% 26.4% 29.3% 2.4% 3.5% 3.3% 4.0%
Grade 7 19.0% 16.9% 21.6% 19.4% 27.5% 26.8% 25.6% 28.8% 6.3% 8.1% 4.3% 5.1%
Grade 8 19.8% 17.6% 21.7% 19.1% 26.1% 25.7% 28.6% 32.3% 3.9% 5.4% 4.9% 5.2%
Grade 9 27.9% 22.1% 24.9% 21.0% 23.9% 25.8% 20.4% 26.4% 2.9% 4.8% 9.7% 7.8%
Grade 10 36.2% 31.2% 21.1% 17.7% 20.4% 21.1% 18.4% 24.4% 3.9% 5.6% 8.5% 7.8%
Grade 11* 22.1% 22.3% 23.0% 20.2% 25.7% 24.2% 25.0% 28.3% 4.2% 5.1% 2.6% 4.1%
*Grade 11 does not include students who took an AP/IB test.Notes: Data shown is preliminary. Percentages may not total 100 due to rounding.

New Jersey
DEPARTM ENT OF
EDUCATION
35
Comparison of New Jersey’s
Economically Disadvantaged Students’ Results:
Spring 2015 and Spring 2016 PARCC administrations
Mathematics
Not Yet Meeting Expectations
(Level 1)
Partially Meeting Expectations
(Level 2)
Approaching Expectations
(Level 3)
Meeting Expectations
(Level 4)
Exceeding Expectations
(Level 5)
% Change in Level 1 and
Level 2
% Change in Level 4 and Level
5(College and
Career Ready)2015 2016 2015 2016 2015 2016 2015 2016 2015 2016
Grade 3 14.7% 14.3% 28.1% 24.7% 31.9% 29.1% 23.3% 27.8% 2.0% 4.0% 3.7% 6.5%
Grade 4 12.7% 14.3% 33.1% 28.9% 32.6% 30.3% 20.9% 25.3% 0.8% 1.3% 2.7% 4.9%
Grade 5 10.7% 11.2% 31.5% 29.0% 35.2% 32.3% 21.2% 25.2% 1.4% 2.3% 2.1% 5.0%
Grade 6 13.6% 16.0% 32.5% 29.2% 32.4% 31.8% 20.4% 21.3% 1.1% 1.7% 0.9% 1.5%
Grade 7 12.7% 15.3% 32.6% 29.5% 34.3% 34.3% 19.3% 19.5% 1.0% 1.3% 0.4% 0.5%
Grade 8* 28.9% 29.0% 29.3% 28.3% 25.3% 24.9% 16.1% 17.3% 0.4% 0.5% 0.8% 1.2%
Algebra I 21.0% 20.5% 34.4% 30.0% 25.4% 26.4% 18.5% 22.2% 0.7% 0.9% 4.9% 3.9%
Algebra II 45.4% 48.3% 28.5% 25.8% 16.8% 15.7% 9.1% 9.9% 0.2% 0.4% 0.2% 0.9%
Geometry 18.3% 17.0% 47.5% 43.0% 26.3% 28.6% 7.7% 10.9% 0.3% 0.6% 5.7% 3.5%
*Approximately 30,000 New Jersey students in grade 8 participated in the PARCC Algebra I assessment. Thus, PARCC Math 8 outcomes are not representative of grade 8 performance as a whole.Notes: Data shown is preliminary. Percentages may not total 100 due to rounding.

New Jersey
DEPARTM ENT OF
EDUCATION
36
Comparison of New Jersey’s
English Language Learner Students’ Results:
Spring 2015 and Spring 2016 PARCC administrations
English Language Arts/Literacy
Not Yet Meeting Expectations
(Level 1)
Partially Meeting Expectations
(Level 2)
Approaching Expectations
(Level 3)
Meeting Expectations
(Level 4)
Exceeding Expectations
(Level 5)
% Change in Level 1 and
Level 2
% Change in Level 4 and Level
5(College and
Career Ready)2015 2016 2015 2016 2015 2016 2015 2016 2015 2016
Grade 3 34.9% 32.1% 26.9% 25.0% 21.3% 22.2% 16.1% 19.1% 0.8% 1.5% 4.7% 3.7%
Grade 4 22.1% 21.7% 27.1% 25.7% 30.9% 28.9% 18.1% 21.5% 1.8% 2.3% 1.8% 3.9%
Grade 5 22.0% 20.0% 31.2% 30.5% 29.0% 28.9% 17.1% 19.7% 0.7% 0.9% 2.7% 2.8%
Grade 6 28.7% 26.5% 30.3% 29.0% 26.7% 27.3% 13.4% 16.0% 0.9% 1.1% 3.5% 2.8%
Grade 7 42.5% 38.0% 23.9% 23.9% 19.3% 21.0% 11.6% 14.2% 2.6% 2.9% 4.5% 2.9%
Grade 8 46.4% 41.7% 23.4% 22.6% 17.3% 20.2% 11.6% 14.1% 1.3% 1.3% 5.5% 2.5%
Grade 9 62.7% 58.5% 20.6% 22.0% 10.8% 11.9% 5.3% 7.0% 0.7% 0.6% 2.8% 1.6%
Grade 10 67.3% 63.0% 17.1% 16.7% 9.3% 12.1% 5.7% 7.5% 0.6% 0.6% 4.7% 1.8%
Grade 11* 43.9% 43.1% 29.1% 25.7% 18.4% 18.7% 8.1% 11.9% 0.5% 0.6% 4.2% 3.9%
*Grade 11 does not include students who took an AP/IB test.Notes: Data shown is preliminary. Percentages may not total 100 due to rounding.

New Jersey
DEPARTM ENT OF
EDUCATION
37
Comparison of New Jersey’s
English Language Learner Students’ Results:
Spring 2015 and Spring 2016 PARCC administrations
Mathematics
Not Yet Meeting Expectations
(Level 1)
Partially Meeting Expectations
(Level 2)
Approaching Expectations
(Level 3)
Meeting Expectations
(Level 4)
Exceeding Expectations
(Level 5)
% Change in Level 1 and
Level 2
% Change in Level 4 and Level
5(College and
Career Ready)2015 2016 2015 2016 2015 2016 2015 2016 2015 2016
Grade 3 15.2% 32.1% 26.8% 25.0% 28.9% 22.2% 24.6% 19.1% 4.6% 1.5% 4.1% 6.5%
Grade 4 15.0% 21.7% 31.6% 25.7% 30.0% 28.9% 21.9% 21.5% 1.4% 2.3% 4.0% 4.9%
Grade 5 13.8% 20.0% 31.6% 30.5% 31.5% 28.9% 20.8% 19.7% 2.3% 0.9% 3.1% 5.0%
Grade 6 25.3% 26.5% 33.1% 29.0% 25.7% 27.3% 14.3% 16.0% 1.6% 1.1% 1.0% 1.5%
Grade 7 29.1% 38.0% 32.9% 23.9% 24.8% 21.0% 11.8% 14.2% 1.4% 2.9% 1.8% 0.5%
Grade 8* 41.3% 41.7% 28.5% 22.6% 18.7% 20.2% 10.9% 14.1% 0.6% 1.3% 2.5% 1.2%
Algebra I 32.6% 58.5% 37.0% 22.0% 18.7% 11.9% 10.7% 7.0% 1.0% 0.6% 2.9% 3.9%
Algebra II 59.7% 63.0% 22.3% 16.7% 9.7% 12.1% 7.8% 7.5% 0.4% 0.6% 2.4% 0.9%
Geometry 26.5% 43.1% 48.5% 25.7% 17.3% 18.7% 6.8% 11.9% 1.0% 0.6% 1.3% 3.5%
*Approximately 30,000 New Jersey students in grade 8 participated in the PARCC Algebra I assessment. Thus, PARCC Math 8 outcomes are not representative of grade 8 performance as a whole.Notes: Data shown is preliminary. Percentages may not total 100 due to rounding.
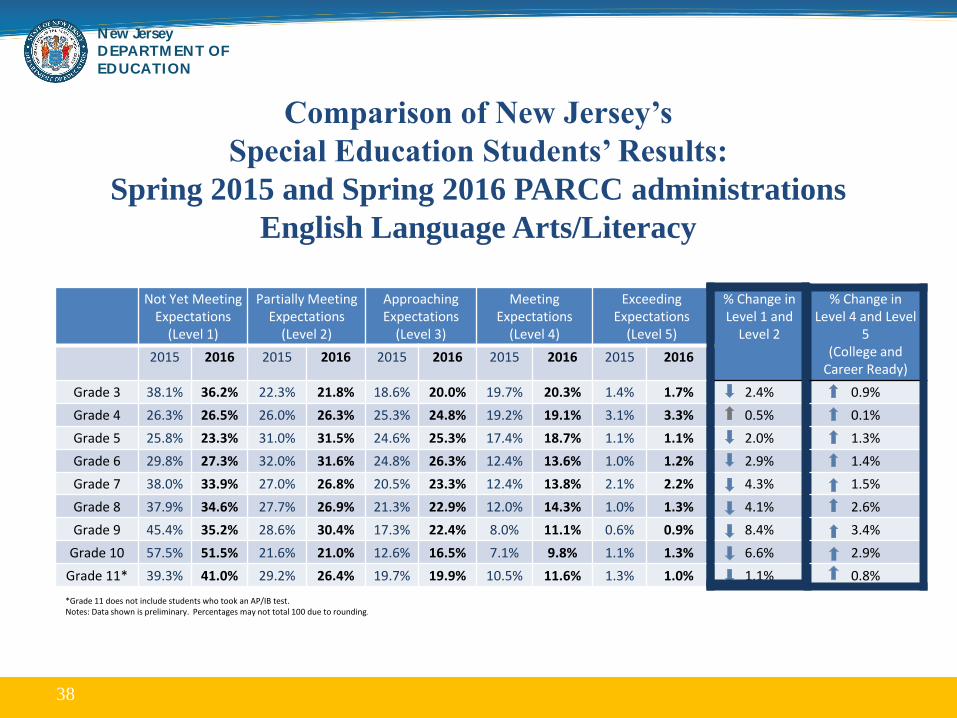
New Jersey
DEPARTM ENT OF
EDUCATION
38
Comparison of New Jersey’s
Special Education Students’ Results:
Spring 2015 and Spring 2016 PARCC administrations
English Language Arts/Literacy
Not Yet Meeting Expectations
(Level 1)
Partially Meeting Expectations
(Level 2)
Approaching Expectations
(Level 3)
Meeting Expectations
(Level 4)
Exceeding Expectations
(Level 5)
% Change in Level 1 and
Level 2
% Change in Level 4 and Level
5(College and
Career Ready)2015 2016 2015 2016 2015 2016 2015 2016 2015 2016
Grade 3 38.1% 36.2% 22.3% 21.8% 18.6% 20.0% 19.7% 20.3% 1.4% 1.7% 2.4% 0.9%
Grade 4 26.3% 26.5% 26.0% 26.3% 25.3% 24.8% 19.2% 19.1% 3.1% 3.3% 0.5% 0.1%
Grade 5 25.8% 23.3% 31.0% 31.5% 24.6% 25.3% 17.4% 18.7% 1.1% 1.1% 2.0% 1.3%
Grade 6 29.8% 27.3% 32.0% 31.6% 24.8% 26.3% 12.4% 13.6% 1.0% 1.2% 2.9% 1.4%
Grade 7 38.0% 33.9% 27.0% 26.8% 20.5% 23.3% 12.4% 13.8% 2.1% 2.2% 4.3% 1.5%
Grade 8 37.9% 34.6% 27.7% 26.9% 21.3% 22.9% 12.0% 14.3% 1.0% 1.3% 4.1% 2.6%
Grade 9 45.4% 35.2% 28.6% 30.4% 17.3% 22.4% 8.0% 11.1% 0.6% 0.9% 8.4% 3.4%
Grade 10 57.5% 51.5% 21.6% 21.0% 12.6% 16.5% 7.1% 9.8% 1.1% 1.3% 6.6% 2.9%
Grade 11* 39.3% 41.0% 29.2% 26.4% 19.7% 19.9% 10.5% 11.6% 1.3% 1.0% 1.1% 0.8%
*Grade 11 does not include students who took an AP/IB test.Notes: Data shown is preliminary. Percentages may not total 100 due to rounding.
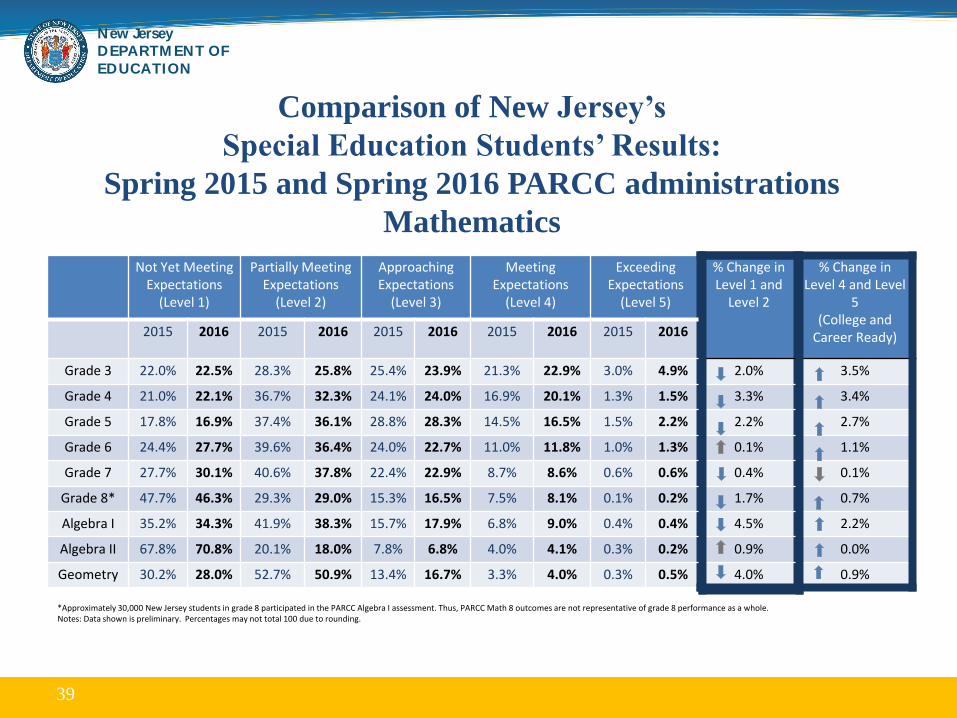
New Jersey
DEPARTM ENT OF
EDUCATION
39
Comparison of New Jersey’s
Special Education Students’ Results:
Spring 2015 and Spring 2016 PARCC administrations
Mathematics
Not Yet Meeting Expectations
(Level 1)
Partially Meeting Expectations
(Level 2)
Approaching Expectations
(Level 3)
Meeting Expectations
(Level 4)
Exceeding Expectations
(Level 5)
% Change in Level 1 and
Level 2
% Change in Level 4 and Level
5(College and
Career Ready)2015 2016 2015 2016 2015 2016 2015 2016 2015 2016
Grade 3 22.0% 22.5% 28.3% 25.8% 25.4% 23.9% 21.3% 22.9% 3.0% 4.9% 2.0% 3.5%
Grade 4 21.0% 22.1% 36.7% 32.3% 24.1% 24.0% 16.9% 20.1% 1.3% 1.5% 3.3% 3.4%
Grade 5 17.8% 16.9% 37.4% 36.1% 28.8% 28.3% 14.5% 16.5% 1.5% 2.2% 2.2% 2.7%
Grade 6 24.4% 27.7% 39.6% 36.4% 24.0% 22.7% 11.0% 11.8% 1.0% 1.3% 0.1% 1.1%
Grade 7 27.7% 30.1% 40.6% 37.8% 22.4% 22.9% 8.7% 8.6% 0.6% 0.6% 0.4% 0.1%
Grade 8* 47.7% 46.3% 29.3% 29.0% 15.3% 16.5% 7.5% 8.1% 0.1% 0.2% 1.7% 0.7%
Algebra I 35.2% 34.3% 41.9% 38.3% 15.7% 17.9% 6.8% 9.0% 0.4% 0.4% 4.5% 2.2%
Algebra II 67.8% 70.8% 20.1% 18.0% 7.8% 6.8% 4.0% 4.1% 0.3% 0.2% 0.9% 0.0%
Geometry 30.2% 28.0% 52.7% 50.9% 13.4% 16.7% 3.3% 4.0% 0.3% 0.5% 4.0% 0.9%
*Approximately 30,000 New Jersey students in grade 8 participated in the PARCC Algebra I assessment. Thus, PARCC Math 8 outcomes are not representative of grade 8 performance as a whole.Notes: Data shown is preliminary. Percentages may not total 100 due to rounding.

New Jersey
DEPARTM ENT OF
EDUCATION
40
Recommended