PALMER AMARANTH CONTROL IN ESTABLISHED ALFALFA AND DOCUMENTATION
OF GLYPHOSATE-RESISTANT AMARANTHUS SPECIES IN KANSAS
by
JOSHUA ADAM PUTMAN
B.S., Wilmington College of Ohio, 2011
A THESIS
Submitted in partial fulfillment of the requirements for the degree
MASTER OF SCIENCE
Department of Agronomy
College of Agriculture
KANSAS STATE UNIVERSITY
Manhattan, Kansas
2013
Approved by:
Major Professor
Dr. Dallas Peterson
Abstract
Palmer amaranth is a troublesome weed that competes for water, nutrients, and sunlight
in many cropping systems throughout the United States. It is a serious production problem for
alfalfa growers in the southern Great Plains region because of extended germination and impact
on forage quality and yields. Glyphosate has been used extensively to control Palmer amaranth
but control has become difficult. The objectives of this research were to (1) evaluate various
herbicide treatments for Palmer amaranth control in established alfalfa, (2) confirm the presence
and scope of glyphosate-resistance in common waterhemp and Palmer amaranth populations in
eastern Kansas, and (3) to characterize glyphosate-resistance in two Palmer amaranth
populations from south central Kansas. Residual Palmer amaranth control in alfalfa varied
among herbicide treatments. The best late season Palmer amaranth control was accomplished
with sequential treatments that included flumioxazin at 140 g ha-1
or diuron at 2,690 g ha-1
as
dormant applications followed by a between cutting treatment of flumioxazin at 70 g ha-1
, which
was still providing 85 to 96% control in late summer. Several other treatments provided good
early season Palmer amaranth control, but control diminished as the season progressed. Palmer
amaranth emerges throughout the growing season and therefore, sequential herbicide treatments
with good residual activity may be necessary for season-long control. Greenhouse studies
indicated that glyphosate-resistant common waterhemp is present throughout eastern Kansas
with several populations that survived glyphosate up to two times the suggested use rate.
Glyphosate-resistant Palmer amaranth was documented in several populations collected from
various counties throughout Kansas. Two populations collected in south central Kansas in 2011
survived up to eight times the typical field use rate of glyphosate. Six more populations
collected in 2012 displayed similar resistance characteristics with three populations surviving up

to four times the typical rate of glyphosate. Shikimate assays on susceptible and resistant Palmer
amaranth biotypes confirmed resistance to glyphosate.

iv
Table of Contents
List of Figures ................................................................................................................................ vi
List of Tables ................................................................................................................................ vii
Acknowledgements ........................................................................................................................ ix
Chapter 1 – Review of Literature .................................................................................................... 1
LITERATURE CITED .......................................................................................................... 14
Chapter 2 – Palmer Amaranth Control in Established Alfalfa ..................................................... 18
ABSTRACT .................................................................................................................................. 18
INTRODUCTION ........................................................................................................................ 20
MATERIALS AND METHODS .................................................................................................. 22
RESULTS AND DISCUSSION ................................................................................................... 24
SOURCES OF MATERIALS....................................................................................................... 28
ACKNOWLEDGEMENTS .......................................................................................................... 28
LITERATURE CITED ................................................................................................................. 29
Chapter 3 – Occurrence and Distribution of Glyphosate-Resistant Common Waterhemp and
Palmer Amaranth in Kansas ................................................................................................. 43
ABSTRACT .................................................................................................................................. 43
INTRODUCTION ........................................................................................................................ 44
MATERIALS AND METHODS .................................................................................................. 46
RESULTS AND DISCUSSION ................................................................................................... 47
SOURCES OF MATERIALS....................................................................................................... 53
ACKNOWLEDGEMENTS .......................................................................................................... 53
LITERATURE CITED ................................................................................................................. 54
Chapter 4 – Dose-Response and Shikimate Assay to Palmer Amaranth Populations Suspected to
be Resistant to Glyphosate ..................................................................................................... 63
ABSTRACT .................................................................................................................................. 63
INTRODUCTION ........................................................................................................................ 65
MATERIALS AND METHODS .................................................................................................. 68
RESULTS AND DISCUSSION ................................................................................................... 71

v
SOURCES OF MATERIALS....................................................................................................... 75
ACKNOWLEDGEMENTS .......................................................................................................... 75
LITERATURE CITED ................................................................................................................. 76
vi
List of Figures
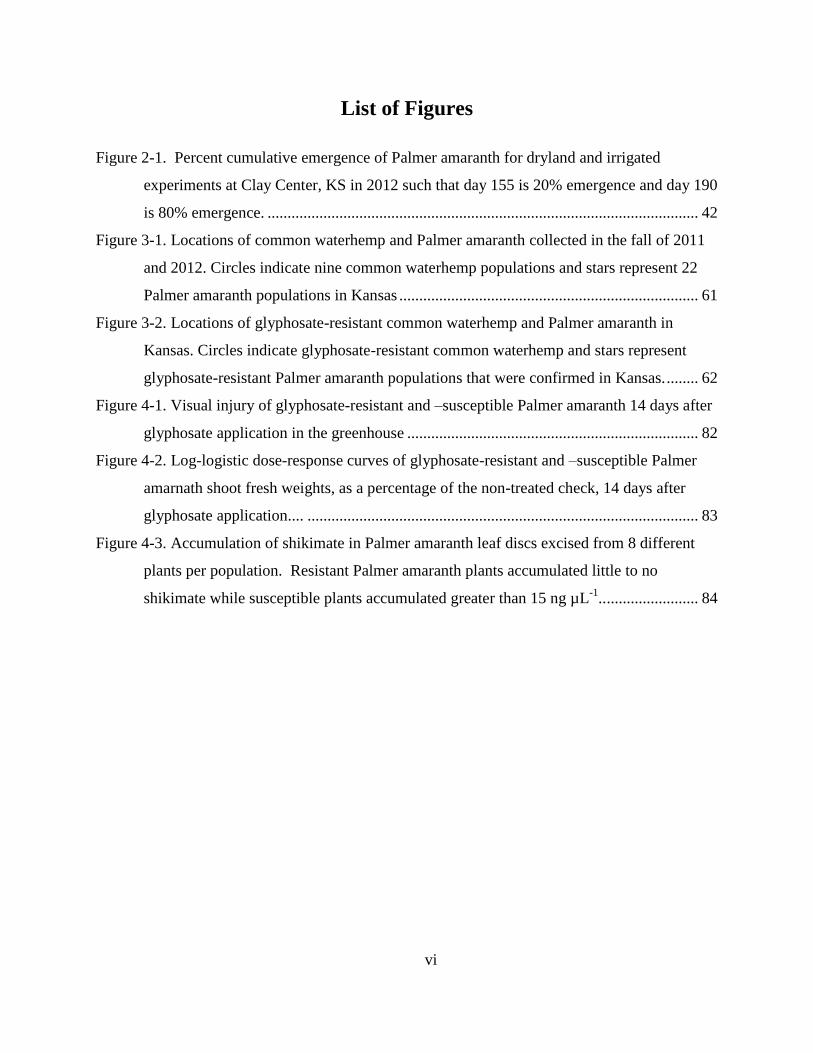
Figure 2-1. Percent cumulative emergence of Palmer amaranth for dryland and irrigated
experiments at Clay Center, KS in 2012 such that day 155 is 20% emergence and day 190
is 80% emergence. ............................................................................................................ 42
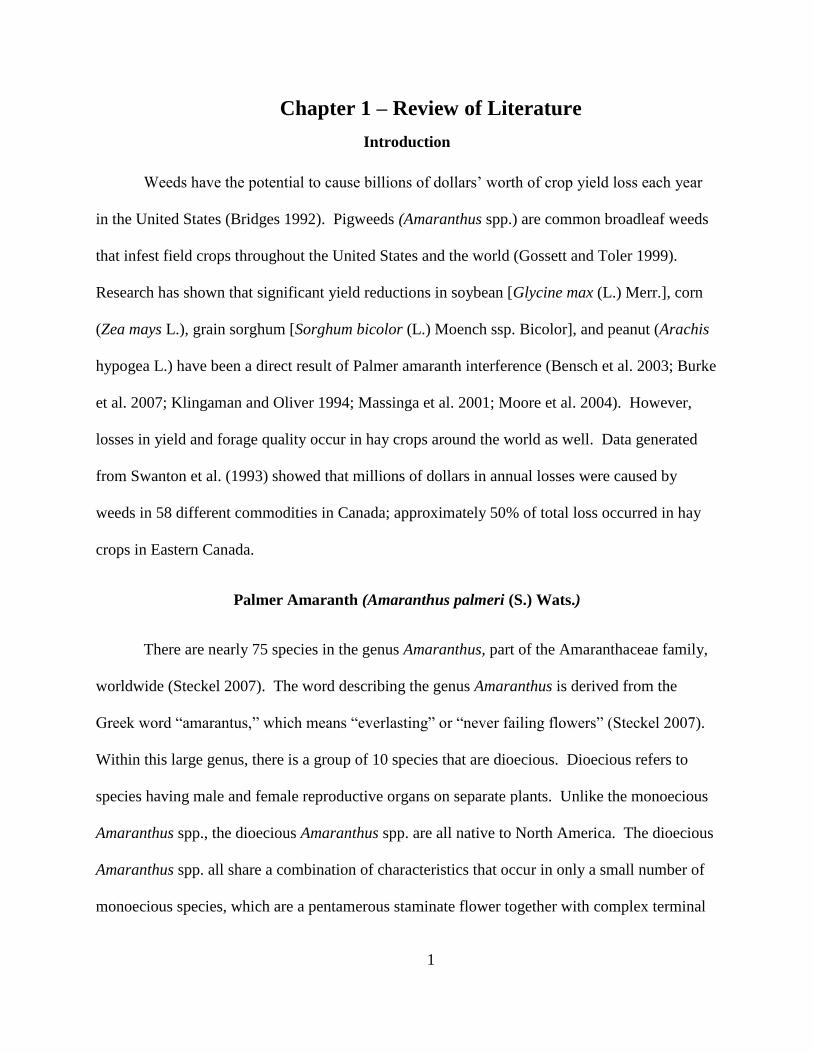
Figure 3-1. Locations of common waterhemp and Palmer amaranth collected in the fall of 2011
and 2012. Circles indicate nine common waterhemp populations and stars represent 22
Palmer amaranth populations in Kansas ........................................................................... 61
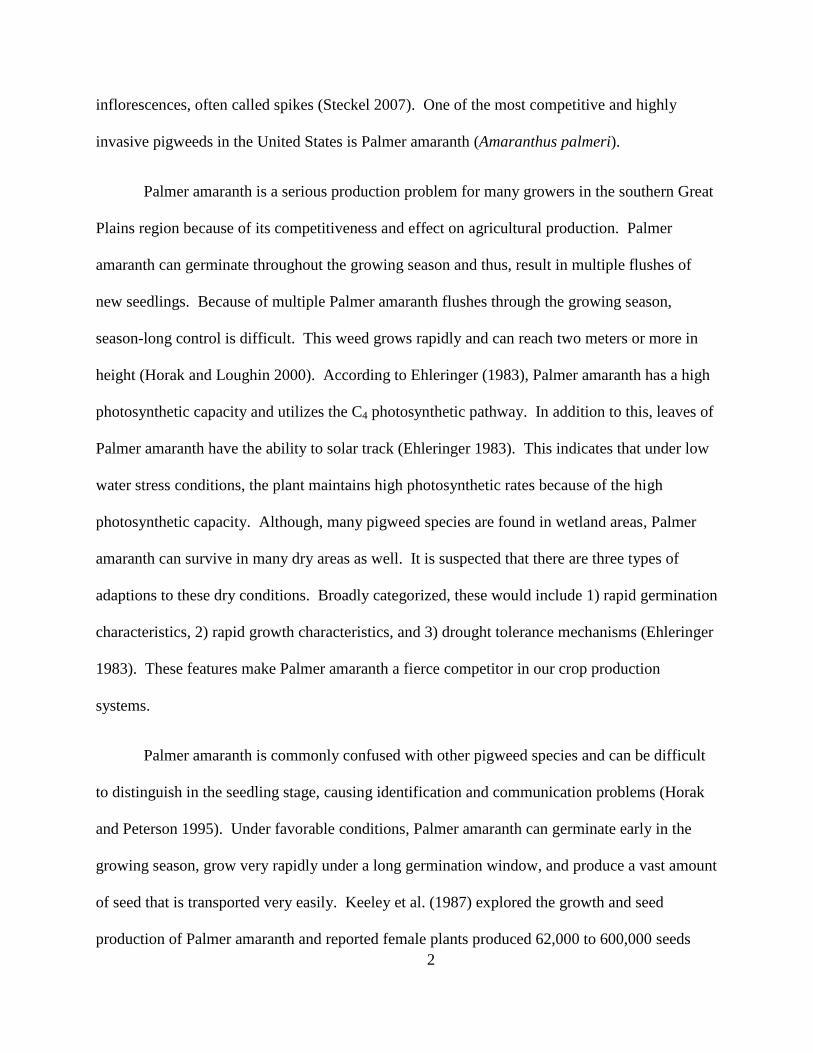
Figure 3-2. Locations of glyphosate-resistant common waterhemp and Palmer amaranth in
Kansas. Circles indicate glyphosate-resistant common waterhemp and stars represent
glyphosate-resistant Palmer amaranth populations that were confirmed in Kansas. ........ 62
Figure 4-1. Visual injury of glyphosate-resistant and –susceptible Palmer amaranth 14 days after
glyphosate application in the greenhouse ......................................................................... 82
Figure 4-2. Log-logistic dose-response curves of glyphosate-resistant and –susceptible Palmer
amarnath shoot fresh weights, as a percentage of the non-treated check, 14 days after
glyphosate application.... .................................................................................................. 83
Figure 4-3. Accumulation of shikimate in Palmer amaranth leaf discs excised from 8 different
plants per population. Resistant Palmer amaranth plants accumulated little to no
shikimate while susceptible plants accumulated greater than 15 ng µL-1
.. ....................... 84

vii
List of Tables
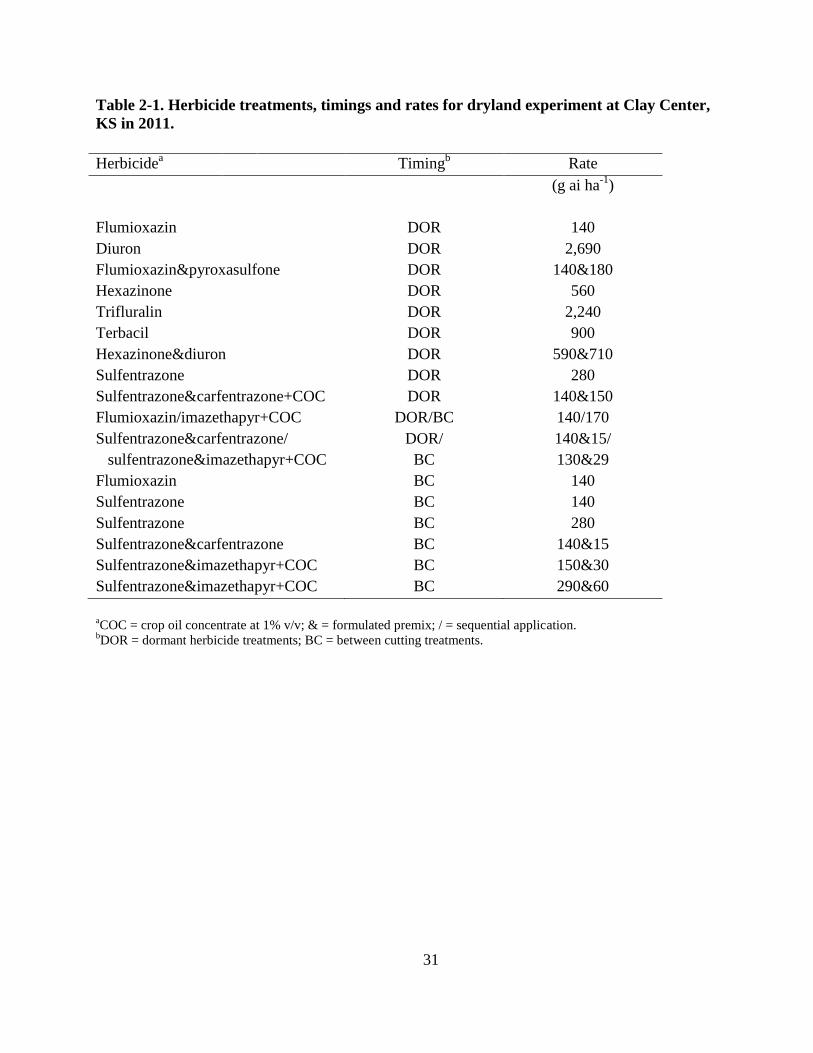
Table 2-1. Herbicide treatments, timings and rates for dryland experiment at Clay Center, KS in
2011................................................................................................................................... 31
Table 2-2. Herbicide treatments, timings and rates for irrigated and dryland experiments at Clay
Center, KS in 2012 ............................................................................................................ 32
Table 2-3. Weather data at time of applications to the dryland and irrigated alfalfa experiments
at Clay Center, KS in 2011 and 2012 ............................................................................... 33
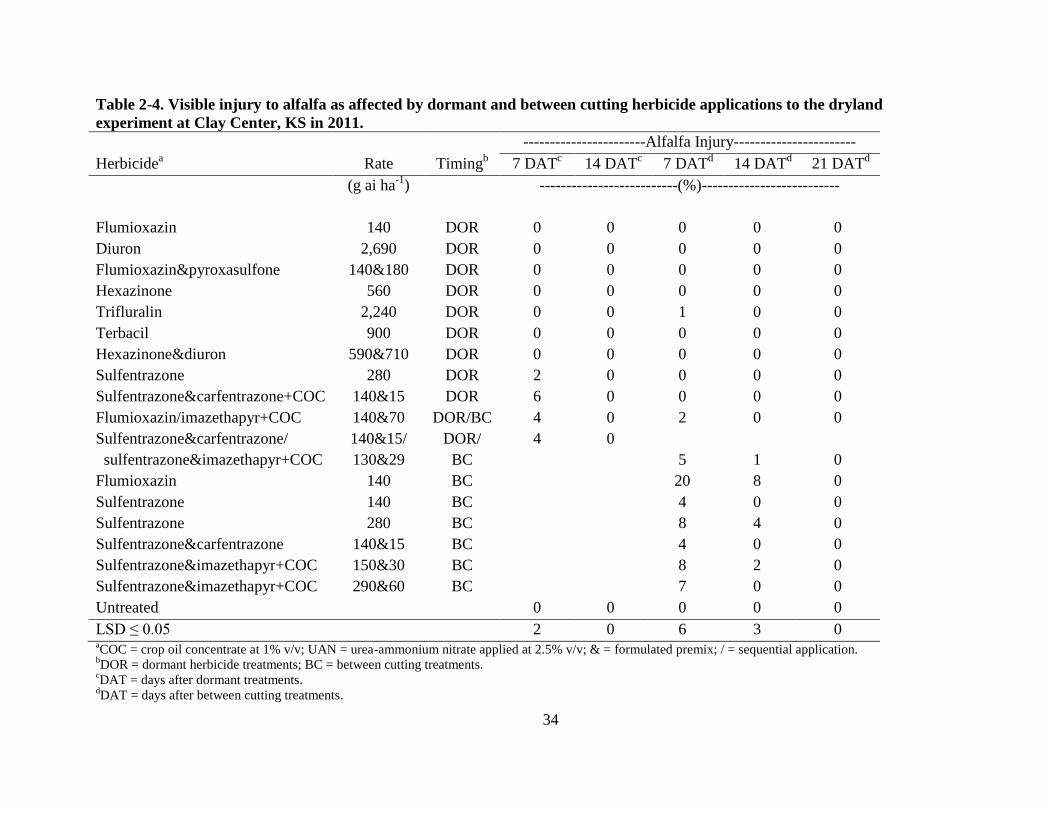
Table 2-4. Visible injury to alfalfa as affected by dormant and between cutting herbicide
applications to the dryland experiment at Clay Center, KS in 2011 ................................. 34
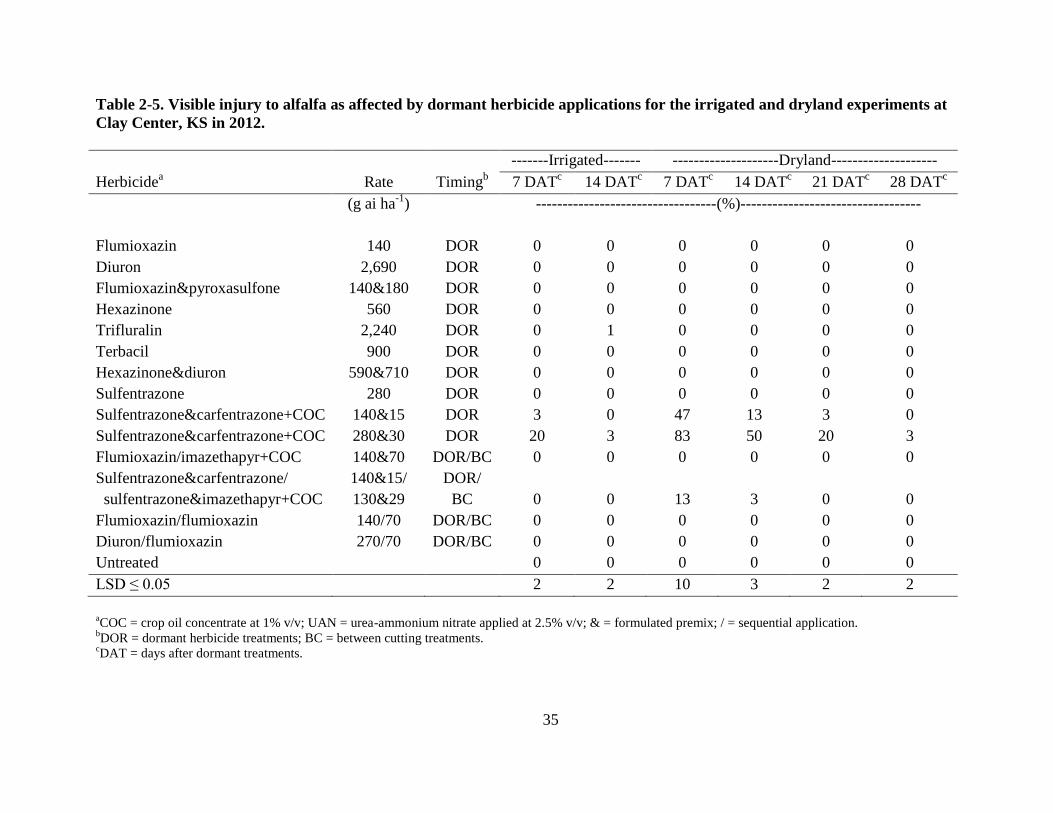
Table 2-5. Visible injury to alfalfa as affected by dormant herbicide applications for the irrigated
and dryland experiments at Clay Center, KS in 2012 ....................................................... 35
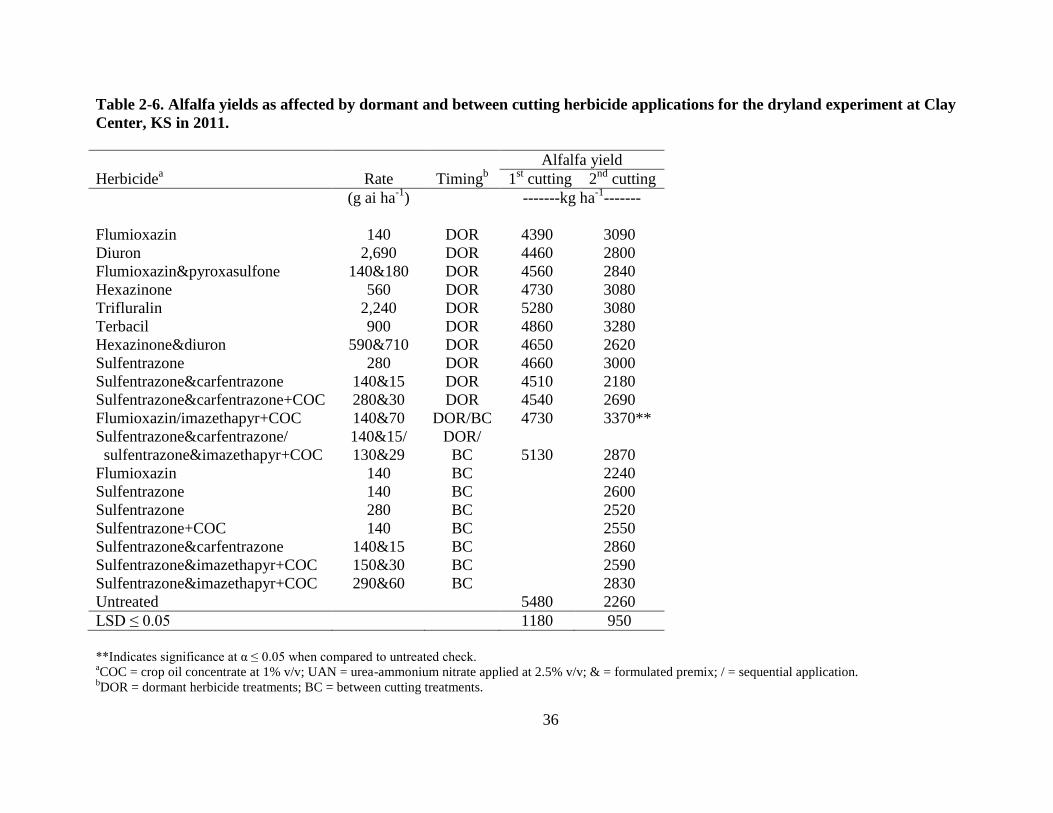
Table 2-6. Alfalfa yield as affected by dormant and between cutting herbicide applications for
the dryland experiment at Clay Center, KS in 2011 ......................................................... 36
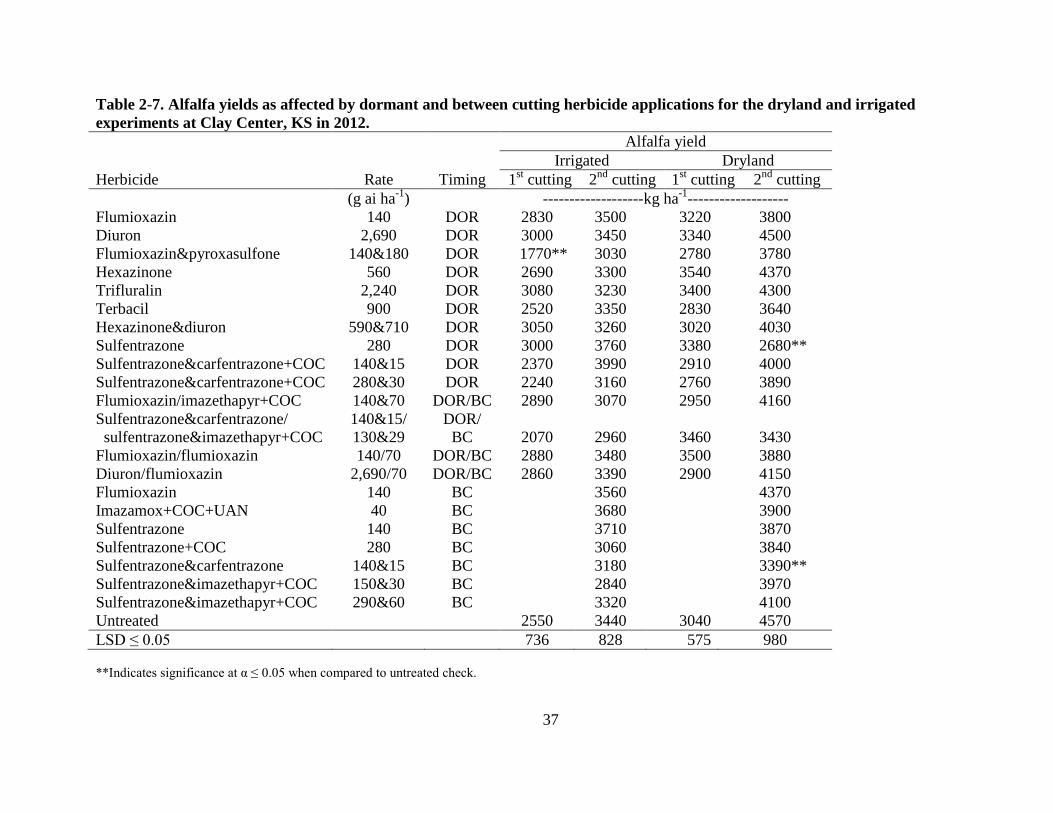
Table 2-7. Alfalfa yield as affected by dormant and between cutting herbicide applications for
the dryland and irrigated experiments at Clay Center, KS in 2012 .................................. 37
Table 2-8. Palmer amaranth control for the dryland experiment at Clay Center, KS in 2011 .... 38
Table 2-9. Palmer amaranth control for the dryland experiment at Clay Center, KS in 2012 .... 39
Table 2-10. Palmer amaranth control for the irrigated experiment at Clay Center, KS in 2012 . 40
Table 2-11. Palmer amaranth emergence for both the irrigated and dryland experiments at Clay
Center, KS in 2012 ............................................................................................................ 41
Table 3-1. GPS locations for each population of common waterhemp collected in Kansas during
the fall of 2011 .................................................................................................................. 56
Table 3-2. GPS locations for each population of Palmer amaranth collected in Kansas during the
fall of 2011 ........................................................................................................................ 56
Table 3-3. GPS locations for each population of Palmer amaranth collected in Kansas during the
fall of 2012 ........................................................................................................................ 57
Table 3-4. Visible common waterhemp control 7 and 14 days after treatment (DAT) with
glyphosate in Kansas in 2011 ........................................................................................... 58
Table 3-5. Visible Palmer amaranth control 7 and 14 days after treatment (DAT) with glyphosate
in Kansas in 2011 .............................................................................................................. 59

viii
Table 3-6. Visible Palmer amaranth control 7 and 14 days after treatment (DAT) with glyphosate
in Kansas in 2012 .............................................................................................................. 60
Table 4-1. GPS locations for the susceptible and resistant populations of Palmer amaranth
collected from 2011 .......................................................................................................... 79
Table 4-2. GPS locations for each population of Palmer amaranth collected in Kansas during the
fall of 2012 ........................................................................................................................ 79
Table 4-3. Visual control 7 and 14 days after treatment (DAT) with glyphosate on 3 Palmer
amaranth populations in Kansas in 2011 .......................................................................... 80
Table 4-4. Dose-response summary. Effective dose (ED) values expressed in g ae ha-1
and the
resistance index (RI) values represent the degree of resistance compared to the
susceptible population. ...................................................................................................... 81
Table 4-5. Growth reduction (GR) values required to decrease growth (shoot fresh weight)
biomass by 50 and 90% expressed in g ae ha-1
................................................................. 81

ix
Acknowledgements
I would like to sincerely thank Dr. Dallas Peterson for his guidance, knowledge, and
persistence throughout my master’s research. He was always available to answer any questions
that I had, aided me with my field work, and gave me the knowledge to successfully set up
research experiments. I would also like to thank Dr. Anita Dille and Dr. Walter Fick for serving
on my committee. A grateful thanks to Dr. Dille for her inspiration during my teaching
assistantships and the knowledge I gained assisting her these last 2 years.
Thanks to Don and Tim Martin for the use of their alfalfa field and their patience as I
pursued this degree. Also thanking Cathy Minihan for her technical support during my research.
I would also like to thank the Kansas State University Department of Agronomy for the use of
equipment and facilities, FMC, Valent, and NovaSource for providing me with the research
materials necessary for this project.
Finally, I would like to especially thank my family and my friends for all of their moral
support and guidance throughout my studies as well. I also thank all of my fellow graduate
students; Andrew Esser, Kindsey Myers, David Brachtenbach, Amar Godar, and J. D. Riffel who
assisted me and provided me with the friendship I needed to make this research come together.
1
Chapter 1 – Review of Literature
Introduction
Weeds have the potential to cause billions of dollars’ worth of crop yield loss each year
in the United States (Bridges 1992). Pigweeds (Amaranthus spp.) are common broadleaf weeds
that infest field crops throughout the United States and the world (Gossett and Toler 1999).
Research has shown that significant yield reductions in soybean [Glycine max (L.) Merr.], corn
(Zea mays L.), grain sorghum [Sorghum bicolor (L.) Moench ssp. Bicolor], and peanut (Arachis
hypogea L.) have been a direct result of Palmer amaranth interference (Bensch et al. 2003; Burke
et al. 2007; Klingaman and Oliver 1994; Massinga et al. 2001; Moore et al. 2004). However,
losses in yield and forage quality occur in hay crops around the world as well. Data generated
from Swanton et al. (1993) showed that millions of dollars in annual losses were caused by
weeds in 58 different commodities in Canada; approximately 50% of total loss occurred in hay
crops in Eastern Canada.
Palmer Amaranth (Amaranthus palmeri (S.) Wats.)
There are nearly 75 species in the genus Amaranthus, part of the Amaranthaceae family,
worldwide (Steckel 2007). The word describing the genus Amaranthus is derived from the
Greek word “amarantus,” which means “everlasting” or “never failing flowers” (Steckel 2007).
Within this large genus, there is a group of 10 species that are dioecious. Dioecious refers to
species having male and female reproductive organs on separate plants. Unlike the monoecious
Amaranthus spp., the dioecious Amaranthus spp. are all native to North America. The dioecious
Amaranthus spp. all share a combination of characteristics that occur in only a small number of
monoecious species, which are a pentamerous staminate flower together with complex terminal
2
inflorescences, often called spikes (Steckel 2007). One of the most competitive and highly
invasive pigweeds in the United States is Palmer amaranth (Amaranthus palmeri).
Palmer amaranth is a serious production problem for many growers in the southern Great
Plains region because of its competitiveness and effect on agricultural production. Palmer
amaranth can germinate throughout the growing season and thus, result in multiple flushes of
new seedlings. Because of multiple Palmer amaranth flushes through the growing season,
season-long control is difficult. This weed grows rapidly and can reach two meters or more in
height (Horak and Loughin 2000). According to Ehleringer (1983), Palmer amaranth has a high
photosynthetic capacity and utilizes the C4 photosynthetic pathway. In addition to this, leaves of
Palmer amaranth have the ability to solar track (Ehleringer 1983). This indicates that under low
water stress conditions, the plant maintains high photosynthetic rates because of the high
photosynthetic capacity. Although, many pigweed species are found in wetland areas, Palmer
amaranth can survive in many dry areas as well. It is suspected that there are three types of
adaptions to these dry conditions. Broadly categorized, these would include 1) rapid germination
characteristics, 2) rapid growth characteristics, and 3) drought tolerance mechanisms (Ehleringer
1983). These features make Palmer amaranth a fierce competitor in our crop production
systems.
Palmer amaranth is commonly confused with other pigweed species and can be difficult
to distinguish in the seedling stage, causing identification and communication problems (Horak
and Peterson 1995). Under favorable conditions, Palmer amaranth can germinate early in the
growing season, grow very rapidly under a long germination window, and produce a vast amount
of seed that is transported very easily. Keeley et al. (1987) explored the growth and seed
production of Palmer amaranth and reported female plants produced 62,000 to 600,000 seeds

3
when grown without competition. Since female Palmer amaranth plants can produce this many
seeds, good weed management strategies are critical.
Palmer amaranth competes effectively for light, water, and nutrients (Massinga et al.
2001) and can significantly reduce crop yields. Two factors that influence the competition of
Palmer amaranth on field crops are 1) weed density and 2) time of emergence. These two factors
can ultimately lower crop yields and impede crop harvest. Bensch et al. (2003) found that the
weed density-yield loss response of soybean was greatest for Palmer amaranth compared to
common waterhemp, redroot pigweed, and prostrate pigweed and that pigweeds emerging with
soybean were more competitive than pigweed plants emerging later. Palmer amaranth that
emerged with the soybeans caused 79% yield reductions at 8 plants m-1
of row density (Bensch
et al. 2003) and closely relates to the research findings from Klingaman and Oliver (1994) who
reported soybean yield reductions ranging from 17 to 68% for Palmer amaranth densities of 0.33
to 10 plants m-1
of row. This is further supported by the research findings from Massinga et al.
(2001) who showed that Palmer amaranth emerging with corn reduced yield from 11 to 91% as
density increased from 0.5 to 8 plants m-1
of row (Massinga et al. 2001). Differences in the
competitive ability of pigweed species do exist and need to be considered when implementing
control measures.
Common Waterhemp (Amaranthus rudis Sauer)
Common waterhemp is a troublesome weed throughout the Midwestern United States.
Common waterhemp can be found from Texas to Maine (Nordby et al. 2007) and is becoming
difficult to manage in agronomic crops. Common waterhemp has biotypes with resistance to
many common herbicides used in production systems making this pigweed species difficult to
4
control. The first reported case of common waterhemp resistance to triazine herbicides was in
southeast Nebraska in 1990 (Anderson 1996), while resistance to ALS-inhibiting herbicides was
first confirmed in a biotype of common waterhemp found in northeast Kansas in 1993 (Horak
and Peterson 1995). The introduction of Roundup Ready®
soybean in 1996 helped many farmers
regain control of waterhemp; however, this weed possesses many traits that continue to make it a
formidable foe in any management system (Nordby et al. 2007). Therefore, the recommended
management strategies for herbicide-resistant weed populations include an integrated system of
crop rotation, rotation of herbicide modes of action, tank-mixes of herbicides with different
modes of action, and cultivation (Peterson 1999).
Common waterhemp, as the name implies, thrives in wet areas of fields, but is adapted to
a variety of conditions (Nordby et al. 2007). Like Palmer amaranth, common waterhemp is a
member of the pigweed family (Amaranthus spp.) and has similar distinguishing features that
make this weed unique. Common waterhemp is a dioecious plant that can produce up to two
million seeds per female plant (Battles et al. 1998). Waterhemp seeds generally germinate early
in the growing season, within 305 growing degree days (base temperature of 10 C), but can
emerge until fall (Sellers et al. 2003). Waterhemp plants emerge throughout the growing season,
and a higher percentage of plants emerge later in the season than most other summer annual
weeds (Hartzler et al. 1999). Once the plant breaks through the soil surface, the growth rate for
common waterhemp can be almost 1 inch per day if conditions are favorable. Research findings
from Sellers et al. (2003) showed that common waterhemp began emerging between 14 and 17
days after planting whereas Palmer amaranth emerged within five days after planting.
Understanding weed seedling emergence, growth rates, and productivity capabilities can be
beneficial when considering a weed management strategy.
5
Once common waterhemp has emerged and begins to compete with a particular crop,
yields can be significantly reduced. Season-long competition by common waterhemp at more
than 20 plants per square foot reduced soybean yields 44% in 30-inch rows and 37% in 7.5-inch
rows (Steckel and Sprague 2004). Waterhemp that emerged as late as the V5 soybean growth
stage reduced yields up to 10% (Nordby et al. 2007). Waterhemp can also reduce yields in corn.
Season-long competition of common waterhemp at 82 or less plants/m2 caused 10% corn yield
loss and season-long interference at 369 to 445 plants/m2 caused 36% yield reduction (Cordes et
al. 2004).
Plant Responses to Herbicides
Phytotoxic chemicals that are used for weed control are termed herbicides (Anderson
1996). A herbicide has been defined as “any chemical substance or cultured biological organism
used to kill or suppress plant growth” (Anderson 1996). Since their introduction, application of
herbicides has been a reliable and economic alternative for weed control (Huarte and Arnold
2003). The shift from conventional tillage to no-tillage systems has increased the reliance on
herbicides for weed control. Over the past 50 years, repeated use of the same herbicides with
similar modes of action has imposed selection for increased herbicide-resistance within or among
species that had been susceptible (Holt and LeBaron 1990).
There are three types of plant responses to applied herbicides, and they are typically
characterized as: 1) susceptibility, 2) tolerance, and 3) resistance (Anderson 1996).
Susceptibility is the lack of capacity to withstand herbicide treatment so that the plant is
damaged by herbicides (Holt and LeBaron 1990). Anderson (1996) described susceptibility as a
positive response to an applied herbicide and the degree of the response was a measure of a
6
plant’s susceptibility to the applied herbicide, under the conditions involved. Smaller plants are
generally more susceptible than taller plants because older, taller plants have the ability to
metabolize the herbicide before injury occurs.
The terms tolerance and resistance have been used interchangeably because both describe
a condition whereby a plant withstands an herbicide. A working definition of tolerance is the
ability of a crop plant to withstand a predetermined dosage of an herbicide, which may be
overcome by higher dosages (Anderson 1996). The term tolerance was most often used to
designate crop response to an herbicide, and a “tolerant crop” was one that was not significantly
injured by an herbicide applied at a recommended dosage (Anderson 1996). Herbicide resistance
refers to a plants inherited ability to survive and reproduce following exposure to a dose of
herbicide normally lethal to the wild biotype (WSSA 2013). However, resistance is dependent
on the selection or evolution of a mutant mechanism within a biotype that allows it to withstand
repeated exposure to an herbicide (Anderson 1996; Holt and LeBaron 1990). The widespread
distribution of herbicide resistance is a growing concern for farmers throughout the United States
and the world.
Glyphosate
Since its introduction in mid-1970, glyphosate (N-(phosphonomethyl) glycine) has
provided a broad-spectrum of weed control at a cost effective rate for many farmers. The
introduction of genetically modified (GM) crops in 1996 containing genes for glyphosate-
resistance differed from conventional crops in that glyphosate herbicide could be applied for in-
crop weed control. This was a beneficial addition for farmers because glyphosate was better at
controlling larger weeds, has no soil activity (allowing for flexible crop rotations), and has low

7
environmental and human health risks (Boerboom and Owen 2006). Over the years, glyphosate
use has increased the number of acres planted to Roundup Ready®
crops; however, it has also
increased the potential for selecting glyphosate-resistant (GR) weed biotypes throughout the
world.
Glyphosate is an inhibitor of the shikimic acid pathway. The shikimic acid pathway is
crucial for the production of three essential amino acids: tryptophan, tyrosine, and phenylalanine.
The mechanism of action is also unique in that the binding site for glyphosate is reported to
closely overlap with the binding site of PEP (Dill et al. 2010, Franz et al. 1997). Glyphosate has
the ability to translocate to growing meristematic tissues and affect underground meristems,
corms, rhizomes, and other potential vegetative structures, which regenerate when only upper
vegetative material is killed (Dill et al. 2010). Glyphosate binds tightly to soil through chelation
and therefore, has no soil activity. Glyphosate has primarily been adopted because of
effectiveness, low cost, and simplicity. However, resistance to glyphosate is becoming a
growing concern.
History of Glyphosate Resistance
Roundup Ready®
soybean and corn acreage has been steadily increasing since their
introduction and the number of resistance issues concerning glyphosate applications has
increased as well. There are currently 24 weed species that have developed resistance to
glyphosate (Heap 2013). Confirmation of glyphosate-resistant Palmer amaranth and common
waterhemp has been documented since 2005 in the United States (Heap 2013). Palmer amaranth
and common waterhemp are among the most resistant-prone dicots, with resistance now
confirmed to four herbicide modes of action in the United States (Norsworthy et al. 2008, Heap

8
2013). In 1998, one waterhemp population was confirmed with multiple resistances to both
acetolactate synthase (ALS) - and photosystem II (PSII)-inhibiting herbicides (Boerboom and
Owen 2006). A waterhemp biotype in Kansas was documented to be approximately 34, 82, 8,
and 4 times more resistant than a susceptible common waterhemp biotype to acifluorfen,
lactofen, fomesafen, and sulfentrazone, respectively (Shoup et al. 2003). More recently,
waterhemp garnered the distinction of being the first U.S. weed to develop multiple resistances:
these combinations include resistance to ALS-, PSII-, and Protoporphyrinogen oxidase (PPO)-
inhibiting herbicides; and glyphosate, ALS-, and PPO-inhibiting herbicides (Boerboom and
Owen 2006). This genetic diversity causes severe management issues in agronomic systems.
A weed’s potential for developing glyphosate resistance is primarily guided by three
factors: weed biology, intensity of glyphosate use, and glyphosate rate (Boerboom and Owen
2006). Glyphosate has been an alternative herbicide that easily controls Palmer amaranth,
including those plants resistant to ALS-inhibiting herbicides, making glyphosate ideal for Palmer
amaranth control in glyphosate-resistant crops (Norsworthy et al. 2008). Glyphosate-resistant
Palmer amaranth was confirmed in Arkansas in 2005. The resistant biotype had an LD50 (lethal
dose of herbicide needed to kill 50% of the plants) of 2,820 g ha-1
glyphosate, which was 79- to
115-fold greater than that of susceptible biotypes and 3.4 times a normal glyphosate-use rate of
840 g ha-1
(Norsworthy et al. 2008). This research conducted by Norsworthy et al. (2008)
confirms that a Palmer amaranth biotype from Mississippi County, AR, had evolved resistance to
glyphosate and that glyphosate alone was no longer a viable option for control of this resistant
biotype.
9
Further research was conducted by Sosnoskie et al. (2011) confirming multiple resistance
in Palmer amaranth to glyphosate and pyrithiobac in Georgia. Glyphosate at 6,930 g ha-1
and
pyrithiobac at 420 g ha-1
applied alone provided no more than 89 and 65% control 1 to 8 weeks
after treatment (WAT), respectively. The dose-response analyses developed from greenhouse
data indicated that the estimated glyphosate rates required to cause 50% injury and reduce plant
fresh weights by 50% relative to the non-treated control in a suspected glyphosate- and ALS-
resistant Palmer amaranth biotype were 12 and 14 times greater, respectively, than the estimated
values for the susceptible (S) biotype (Sosnoskie et al. 2011).
A more diagnostic screening method for documenting glyphosate resistance involves
extracting EPSPS (5-enolpyruvoylshikimate-3-phosphate synthase), which is the site of action of
glyphosate (Shaner et al. 2005; Steinrucken and Amrhein 1980). When glyphosate inhibits
EPSPS there is an accumulation of shikimate, the dephosphorylated substrate of the enzyme
(Amrhein et al. 1980; Shaner et al. 2005). This method has been used to detect resistance in
crops and also used to detect resistance in GR-weeds (Shaner et al. 2005). Shikimate did not
accumulate in a GR-rigid ryegrass population treated with glyphosate (Simarmata et al. 2003) or
in a GR-horseweed population treated with a sublethal rate of glyphosate, although the same rate
did cause shikimate accumulation in a susceptible horseweed population (Feng et al. 2004).
Steckel et al. (2008) documented Palmer amaranth in Tennessee where shikimate accumulated in
both resistant and susceptible plants, indicating that 5-enolpyruvylshikimate-3-phosphate
synthase (EPSPS) was inhibited in both types. The results suggest that an altered target site is
not responsible for glyphosate resistance in these Palmer amaranth biotypes. The shikimate
assay procedure requires access to biochemistry lab equipment that is difficult to access or often
times unavailable at the field level. Multiple methods of assessing glyphosate resistance help

10
confirm the occurrence of glyphosate-resistant weeds and provide insight on the mechanism of
resistance.
Alfalfa (Medicago sativa L.)
Weeds are a primary production factor that can decrease the quality of alfalfa, lower crop
yields, interfere with harvest, and decrease the profitability of the crop. Weeds interfere with
alfalfa during establishment and throughout the duration of its life, reducing dry matter yields,
and plant persistence by competing for light, water, and nutrients (Arregui et al. 2001). Because
of its importance among forage crops, alfalfa is referred to as the “Queen of Forages.” Alfalfa
can be one of the most profitable agronomic crops based on the quality of the harvested crop.
Alfalfa is a high-yielding, perennial legume that is well-suited to hay, silage, or pasture
production and produces an excellent quality, high-protein forage (Hancock et al. 2005).
However, alfalfa can be a difficult crop to establish especially if weeds are present and
environmental conditions are not favorable.
There are many factors that can affect alfalfa production. Spring regrowth is an
important process for alfalfa production, but can vary based on environmental conditions and
primary establishment of the alfalfa plant itself. An alfalfa plant will become dormant as the
temperatures become colder to ensure winter survival. Most winter-hardy alfalfa varieties have
several nodes placed below the soil surface which aids in winter survival by providing soil
insulation for the perennial over-wintering crown structures (Meyer 1999). “Green-up” occurs
when the buds located on the crown begin to grow in response to warm spring temperatures
(Undersander et al. 2011). The first cutting harvest will usually yield more tonnage per hectare
because there is less stress early in the growing season. Heat stress, drought, weed competition,
11
and lack of nutrients decrease alfalfa growth. Drought reduces stem growth more than leaf
growth, causing shortened plants that are low-yielding but generally high in quality because of
the increased leaf-to-stem ratio (Undersander et al. 2011).
There are several other factors that can affect an alfalfa stand. Increasing age of stand,
too many cuttings during the growing season, untimely fall harvesting, and overuse by grazing
animals often result in one or all of the following: reduced yields, limited root growth, increased
winterkill and/or injury, thinning of stands, grass and weed invasions, and increased disease
susceptibility (Meyer and Helm 1994). A six year study conducted in Fargo, ND to evaluate
stand age effects on alfalfa productivity showed that forage yields averaged 12 tons of dry matter
ha-1
during the first harvest year, 10 tons ha-1
in the second year, and 9 tons ha-1
in the third year,
a decrease of 3 tons ha-1
between first and third production years (Meyer and Helm 1994).
Tonnage can be important when maximum yield is the main goal however, quality can decrease
with increased tonnage.
The number of cuttings obtained from an alfalfa stand depends on the available soil water
for regrowth (Meyer and Helm 1994). The first crop should be harvested by the 10% bloom
stage (late bud to early bloom), whereas the third cutting should be harvested at 10 to 50% bloom
to allow buildup of root reserves to aid in overwintering, and forage will be of high quality
(Meyer and Helm 1994). Each cutting should be harvested at about 5 cm from the soil surface to
ensure that there is enough foliage left for regrowth.
Weeds affect alfalfa yields and quality, so chemical weed control is widely used in alfalfa
production. Wilson Jr. (1981) found that controlling weeds in established alfalfa significantly
increased the estimates of protein and total digestible nutrients produced per hectare each
12
growing season compared to the weedy check. Time of application of herbicides is important for
increasing weed control in alfalfa. Timing of application of herbicides in alfalfa are preplant,
postemergence to alfalfa and preemergence to weeds, postemergence to both, and dormant
(DOR) to alfalfa (Thompson et al. 2013). Dormant applications are made after alfalfa goes
dormant in the fall and before the alfalfa plant resumes active spring regrowth and producers will
generally see little to no effect on the alfalfa stand or its quality. Dormant herbicides may
provide control of existing winter annual weeds as well as residual control of late germinating
summer annual weeds. Between cutting (BC) applications can be made after a cutting has been
taken from the field. It is crucial to apply the herbicides before the plants produce very much
green foliage, otherwise stunting or foliar necrosis can result from the application.
Some herbicides labeled for use in alfalfa have good residual activity on broadleaf and
annual grass weeds. Diuron is a dormant season herbicide that has been around for many years.
This herbicide provides excellent control of many winter annual broadleaf weeds and good to
excellent control of many broadleaf summer annuals (Thompson et al. 2013). Winter annual
broadleaf weeds include prickly lettuce, flixweed, tansy mustard, field pennycress, and
shepherdspurse. Kochia, common lambsquarters, morningglory species, pigweed species,
common ragweed, and Pennsylvania smartweed are summer annual weeds which can be
controlled by diuron. Flumioxazin is another herbicide that provides adequate control of
broadleaf and annual grass weeds. Like diuron, it provides fair to excellent residual control.
Flumioxazin as a DOR or BC application is an herbicide that has recently become labeled in
alfalfa production. Flumioxazin will be beneficial for alfalfa growers for maintaining broadleaf
and grass weeds in their production systems.
13
Sulfentrazone is not currently registered for use in alfalfa, but could be an option if alfalfa
tolerance is acceptable. Sulfentrazone is labeled for use in soybeans and sunflower in Kansas.
In soybeans, it is applied as preplant incorporated or preemergence. It provides fair to excellent
control of many annual grasses and provides good control of Eastern black nightshade, common
lambsquarters, and pigweed spp. (Thompson et al. 2013). In sunflower, sulfentrazone can be
applied as a burndown, preplant, or preemergence. Sulfentrazone plus carfentrazone in the fall
can provide residual control of broadleaf weeds into the spring (Thompson et al. 2013).
Alfalfa can be one of the most profitable agronomic crops because of its high energy
value and protein content. However, good management and timely crop harvest is critical to the
success of alfalfa production and quantity. When well-managed, alfalfa is a high-value crop that
can be profitably produced for cash hay market or stored as hay or silage for on-farm use
(Hancock et al. 2012).
Common waterhemp and Palmer amaranth are very problematic weeds in crop
production systems and control of these pigweed species is difficult. These two species have a
wide window for germination, grow rapidly, produce a vast number of seeds, and are developing
resistance to multiple classes of herbicides. The objectives of this research were to (1) document
the season-long emergence of Palmer amaranth and evaluate Palmer amaranth control in
established alfalfa with various labeled and experimental herbicides, (2) document the presence
and scope of GR common waterhemp and Palmer amaranth in Kansas, and (3) characterize two
GR Palmer amaranth populations in Kansas.

14
LITERATURE CITED
Amrhein, N., B. Deus, P. Gehrke, and H. C. Steinruken. 1980. The site of inhibition of the
shikimate pathway by glyphosate. II. Interference of glyphosate with chorismate
formation in vivo and in vitro. Plant Physiol. 66:830-834.
Anderson, W. P. 1996. Weed science: principles and applications. 3rd. St. Paul, MN: West
Publishing Company. 58-127. Print.
Arregui, M., D. Sanchez, and R. Scotta. 2001. Weed control in established alfalfa (Medicago
sativa) with postemergence herbicides. Weed Technol. 15:424-428.
Battles, B., B. Hartzler, and D. Buhler. 1998. Effect of common waterhemp emergence date in
soybean on growth and competitiveness. Proc. N. Cent. Weed Sci. Soc. 53:145-146.
Bensch, C. N., M. J. Horak, and D. Peterson. 2003. Interference of redroot pigweed (Amaranthus
retroflexus), Palmer amaranth (Amaranthus palmeri), and common waterhemp
(Amaranthus rudis) in soybean. Weed Sci. 51:37-43.
Boerboom, C. and M. Owen. 2006. Facts about glyphosate-resistant weeds. The glyphosate,
weeds, and crop series – GWC-1. West Lafayette, IN: Purdue University.
http://www.extension.purdue.edu/extmedia/gwc/gwc-1.pdf.
Bridges D. C. 1992. Crop losses due to weeds in the USA. Champaign, IL: Weed Science
Society of America. 401 p.
Burke, I. C., M. Schroeder, W. E. Thomas, and J. W. Wilcut. 2007. Palmer amaranth interference
and seed production in peanut. Weed Technol. 21:367-371.
Cordes, J. C., W. G. Johnson, P. Scharf, and R. J. Smeda. 2004. Late-emerging common
waterhemp (Amaranthus rudis) interference in conventional tillage corn. Weed Technol.
18:999-1005.
Dill G. M., R. D. Sammons, P.C.C. Feng, F. Kohn, K. Kretzmer, A. Mehrsheikh, M. Bleeke, J.
L. Honegger, D. Farmer, D. Wright, and E. A. Haupfear. 2010. Glyphosate: discovery,
development, applications, and properties. (pp. 1-33) In V. K. Nandula (Ed.), Glyphosate
resistance in crops and weeds: history, development, and management. Hoboken, New
Jersey: John Wiley & Sons, Inc.
Ehleringer, J. 1983. Ecophysiology of Amaranthus palmeri, a Sonoran Desert Summer Annual.
Oecologia 57:107-12.
Feng, P.C.C., M. Tran, T. Chiu, R. D. Sammons, G. R. Heck, and C. A. Jacob. 2004.
Investigations into glyphosate-resistant horseweed (Conyza canadensis): retention,
uptake, translocation, and metabolism. Weed Sci. 52:498-505.

15
Franz, J. E., M. K. Mao, and J. A. Sikorski. 1997. Glyphosate: A unique global pesticide.
Washington, DC: American Chemical Society.
Gossett, B. and J. Toler. 1999. Differential control of Palmer amaranth (Amaranthus palmeri)
and smooth pigweed (Amaranthus hybridus) by postemergence herbicides in soybean
(Glycine max). Weed Technol. 13:165-168.
Hancock, D. W., D. G. Buntin, L. O. Ely, R. C. Lacy, G. L. Huesner, and R. L. Stewart. 2012.
Alfalfa management in Georgia. CAES publications – B1350. Athens, GA: The
University of Georgia. http://www.caes.uga.edu/Publications/pubDetail.cfm?pk_id=7788.
Hartzler, R. G., D. D. Buhler, and D. E. Stoltenberg. 1999. Emergence characteristics of four
annual weed species. Weed Sci. 47:578-584.
Heap, I. 2011. The International Survey of Herbicide Resistant Weeds. Available at
http://www.weedscience.com. Accessed: July 10, 2013.
Horak, M. J. and D. E. Peterson. 1995. Biotypes of Palmer amaranth (Amaranthus palmeri) and
common waterhemp (Amaranthus rudis) are resistant to imazethapyr and thifensulfuron.
Weed Technol. 9:192-195.
Horak, M. J. and T. M. Loughin. 2000. Growth analysis of four Amaranthus species. Weed Sci.
48:347-355.
Holt, J. S. and H. M. LeBaron. 1990. Significance and distribution of herbicide resistance. Weed
Technol. 4:141-149.
Huarte, H., and R. Arnold. 2003. Understanding mechanisms of reduced annual weed emergence
in alfalfa. Weed Sci. 51:876-885.
Keeley, P. E., C.H. Carter, and R. J. Thullen. 1987. Influence of planting date on growth of
Palmer amaranth (Amaranthus palmeri). Weed Sci. 35:199-204.
Klingaman, T. E. and L. R. Oliver. 1994. Palmer amaranth (Amaranthus palmeri) interference in
soybeans (Glycine max). Weed Sci. 42:523-527.
Massinga, R. A., R. S. Currie, M. J. Horak, and J. Boyer Jr. 2001. Interference of Palmer
amaranth in corn. Weed Sci. 49:202-208.
Meyer, D. 1999. Alfalfa: Seed germination, seedling growth, vegetative development. Fargo,
ND: North Dakota State University.
http://lib.ndsu.nodak.edu/repository/bitstream/handle/10365/9130/R648_1999.pdf?seque
nce=1.
Meyer, D. and J. Helm. 1994. Alfalfa management in North Dakota. Fargo, ND: North Dakota
State University.
16
http://library.ndsu.edu/tools/dspace/load/?file=/repository/bitstream/handle/10365/17226/
R-571-1994.pdf?sequence=1
Moore, J. W., D. S. Murray, and R. B. Westerman. 2004. Palmer amaranth (Amaranthus
palmeri) effects on the harvest and yield of grain sorghum (Sorghum bicolor). Weed
Technol. 18:23-29.
Nordby, D., B. Hartzler, and K. Bradley. 2007. Biology and Management of Waterhemp. The
glyphosate, weeds, and crop series – GWC-13. West Lafayette, IN: Purdue University.
http://www.extension.purdue.edu/extmedia/BP/gwc-13.pdf
Norsworthy, J. K., G. M. Griffith, R. C. Scott, K. L. Smith, and L. R. Oliver. 2008. Confirmation
and control of glyphosate-resistant Palmer amaranth (Amaranthus palmeri) in Arkansas."
Weed Technol. 22:108-113.
Peterson, D. E. 1999. The impact of herbicide-resistant weeds on Kansas agriculture. Weed
Technol. 13:632-635.
Sellers, B. A., R. J. Smeda, W. G. Johnson, J. A. Kendig, and M. R. Ellersieck. 2003.
Comparative growth of six Amaranthus species in Missouri. Weed Sci. 51:329-333.
Shaner, D. L., T. Nadler-Hassar, W. B. Henry, and C. H. Koger. 2005. A rapid in vivo shikimate
accumulation assay with excised leaf discs. Weed Sci. 53:769-774.
Shoup, D. E., K. Al-Khatib, and D. E. Peterson. 2003. Common waterhemp (Amaranthus rudis)
resistance to protoporphyrinogen oxidase-inhibiting herbicides. Weed Sci. 51:145-150.
Simarmata, M., J. E. Kaufmann, and D. Penner. 2003. Potential basis of glyphosate resistance in
California rigid ryegrass (Lolium rigidum). Weed Sci. 51:678-682.
Sosnoskie, L., J. Kichler, R. Wallace, and S. A. Culpepper. 2011. Multiple resistance in Palmer
amaranth to glyphosate and pyrithiobac confirmed in Georgia. Weed Sci. 59:321-325.
Steckel, L. E. 2007. The dioecious amaranthus spp.: Here to stay. Weed Technol. 21:567-570.
Steckel, L., C. Main, A. Ellis, and T. Mueller. 2008. Palmer amaranth (Amaranthus palmeri) in
Tennessee has low level glyphosate resistance. Weed Technol. 22:119-123.
Steckel, L. E. and C. L. Sprague. 2004. Late-season common waterhemp (Amaranthus rudis)
interference in narrow- and wide-row soybean. Weed Technol. 18:947-952.
Steinrucken, H. C. and N. Amrhein. 1980. The herbicide glyphosate is a potent inhibitor of 5-
enolpyruvyl-shikimic acid-3-phosphate. Biochem. Biophys. Res. Commun. 94:1207-
1212.
17
Swanton, C. J., K. N. Harker, and R. L. Anderson. 1993. Crop losses due to weeds in Canada.
Weed Technol. 7:537-542.
Thompson, C. R., D. E. Peterson, W. H. Fick, P. W. Stahlman, and R. E. Wolf. 2013. 2013
Chemical weed control for field crops, pastures, rangeland, and noncropland. Report of
Progress 1081. Manhattan, KS: Kansas State University.
Undersander, D., M. H. Hall, P. Vassalotti, and D. Cosgrove. 2011. Alfalfa germination and
growth. Publication A3681. Madison, WI: University of Wisconsin.
http://learningstore.uwex.edu/assets/pdfs/A3681.PDF
WSSA [Weed Science Society of America]. 2013. Herbicide resistance and herbicide tolerance
definitions. Weed Technol. Volume 12, Issue 4 (October-December) 1998. p.789.
Wilson, Jr., R. G. 1981. Weed control in established dryland alfalfa (Medicago sativa). Weed
Sci. 29:615-618.
18
Chapter 2 - Palmer Amaranth Control in Established Alfalfa
ABSTRACT
Palmer amaranth is a serious production problem for alfalfa growers in the southern
Great Plains region. Infestations of Palmer amaranth in alfalfa can reduce yields and lower the
quality of the harvested product. Field experiments were conducted near Clay Center, KS in
2011 and 2012 to evaluate various herbicide treatments in alfalfa for crop response and Palmer
amaranth control at regular intervals throughout the growing season. Dormant season treatments
included labeled rates of several registered herbicides including flumioxazin, hexazinone, diuron,
trifluralin, and terbacil. Experimental treatments included sulfentrazone and pyroxasulfone
herbicides. Between cutting treatments included flumioxazin, imazethapyr, imazamox, and
sulfentrazone. Palmer amaranth emergence was monitored weekly in 2012 to relate emergence
patterns through the season to residual herbicide activity. In 2011, several treatments provided
early season Palmer amaranth control, but the best late season control of Palmer amaranth was
from treatments that included flumioxazin at 140 g ha-1
either as a dormant or between cutting
treatment, or a dormant treatment of diuron at 2,690 g ha-1
. Palmer amaranth control on
September 19 was 82% for the between cutting treatment of flumioxazin, 60% for the dormant
treatment of flumioxazin, and 76% for the dormant treatment of diuron. All other treatments
provided no more than 10% Palmer amaranth control by September 19. In 2012, the best late
season Palmer amaranth control of 85 to 96% was achieved with sequential treatments that
included flumioxazin at 140 g ha-1
or diuron at 2,690 g ha-1
as dormant applications followed by
a between cutting treatment of flumioxazin at 70 g ha-1
. Several other treatments provided good
early season Palmer amaranth control, but control diminished as the season progressed. Palmer
amaranth began emerging May 1, 2012 with 20% cumulative emergence by June 3 (33 d), 80%

19
cumulative emergence by July 8 (35 d later), and 100% emergence by August 5. Palmer
amaranth emerged throughout the growing season and therefore, sequential herbicide treatments
with good residual activity may be necessary for season-long control.

20
INTRODUCTION
Alfalfa is one of the most important forage crops in the United States. In 2011, total hay
production in the United States was 22.8 million ha (Anonymous 2012). In Kansas, alfalfa hay
production was 2.25 million Mg produced in 2011 and is the 4th
most widely grown agronomic
crop in the state (Anonymous 2012). It is grown on a variety of soil types and across many
different climates around the world. Alfalfa is highly beneficial for livestock producers because
of its forage quality.
Alfalfa establishment can be difficult due to certain competition factors. Weeds compete
with alfalfa for sunlight, water, and nutrients. Moyer (1985) has shown that weed control during
alfalfa establishment is required to prevent crop yield losses in subsequent years. Ott et al.
(1989) reported that volunteer wheat (Triticum aestivum L.) emerging with seedling alfalfa in the
fall could reduce first-cutting alfalfa yields by more than 80%. Furthermore, Pike and Stritzke
(1984) observed that cheat (Bromus secalinus L.) infestations reduced first-cutting yields 60 to
85% when not controlled in the fall and total alfalfa yield was reduced 25 to 35% across all
cuttings. Weeds can also reduce alfalfa quality (Cords 1973; Cosgrove and Barrett 1987). If
weeds are not adequately controlled during establishment, a poor stand will result. Weeds are
also problematic in established alfalfa as well, resulting in reduced quality and yield (Cords
1973; Kapusta and Strieker 1975; Smith 1969).
Since their introduction, herbicides have been widely adapted into agricultural production
systems for weed control. When alfalfa stands deteriorate as a result of winter killing, disease,
etc., weeds become established and compete for growth resources (Robison et al. 1978). Several
herbicides are commonly used in alfalfa, such as hexazinone, metribuzin, paraquat, pronamide,
and terbacil (Kapusta and Strieker 1975; Peters et al. 1984; Wilson 1989). In established stands
21
of alfalfa grown for hay, pasture, dehydration, or seed, producers often prefer a residual
herbicide such as terbacil or hexazinone, as opposed to a short-lived POST herbicide such as 2,
4-DB [4-(2, 4 –dichlorophenoxy) butanoic acid] because a broader spectrum of weeds is
controlled by a combination of immediate and residual herbicide actions (Malik et al. 1993).
Many weeds in alfalfa are better controlled with soil-applied as opposed to foliar-applied
herbicides; however the cost per acre has been a deterrent to acceptance by farmers (Robison et
al. 1978).
Excellent weed control can be achieved in alfalfa with flumioxazin and diuron
(Thompson et al. 2013). Furthermore, a postemergence (POST) herbicide that has been effective
at controlling summer annual grass and broadleaf weeds has been paraquat (Thompson et al.
2013). However, Peters et al. (1984) showed that paraquat was less effective for controlling
weeds when applied in late March than when applied in February. A study conducted by Malik
et al. (1993) showed that hexazinone provided the most consistent weed control in established
alfalfa grown for seed. Average control of Canada thistle (Cirsium arvense (L.) Scop.),
catchweed bedstraw (Galium aparine (L.)), dandelion (Taraxacum officinale (G.H.) Weber ex
Wiggers), perennial sowthistle (Sonchus arvensis), quackgrass (Elymus repens (L.) Gould),
Russian pigweed (Axyris amaranthoides (L.), and scentless chamomile (Matricaria perforate)
was 80%. Alfalfa seed production was 33% greater than other herbicide treatments average
across all sites (Malik 1993). Although a number of other herbicides are currently labeled for
weed control in alfalfa, all products have limitations because of low soil activity on some weed
species, potential crop safety concerns, or other deficiencies (Curran et al. 2008; Hagood et al.
2009; Hahn 2010).
22
The objectives of this study were to evaluate alfalfa crop tolerance and Palmer amaranth
control with various labeled and experimental herbicide treatments under dryland and irrigated
conditions and to document season-long emergence patterns of Palmer amaranth.
MATERIALS AND METHODS
Field experiments were conducted near Clay Center, KS to evaluate Palmer amaranth
control in established alfalfa under dryland conditions in 2011 and 2012 and irrigated conditions
in 2012. The soil for both experiments was a Muir Sandy loam (fine-silty, mixed, mesic, Pachic
Haplustolls) with pH of 6.4, organic matter of 0.8% and soil texture was 74% sand, 20% silt, and
6% clay. The alfalfa was established in 2004 resulting in a timeworn, thin, and highly variable
stand by 2011 and allowing for Palmer amaranth infestation. In 2012, the irrigated experiment
received water 2 to 3 times per week beginning in April through to September with 2.5 cm of
water applied each time. The dryland experiment received natural precipitation both years.
Labeled and experimental herbicide treatments were used to evaluate season-long Palmer
amaranth control. Herbicide applications included dormant (DOR) and between cutting (BC)
treatments between the first and second harvest either alone or sequentially. Dormant season
treatments included labeled rates of several registered herbicides, including flumioxazin,
hexazinone, diuron, trifluralin, and terbacil. Experimental treatments included sulfentrazone and
pyroxasulfone herbicides. Between cutting treatments included flumioxazin, imazethapyr,
imazamox, and sulfentrazone. A non-treated plot was included for comparison. Additional
herbicide treatments were added in 2012 in response to the results of 2011. Treatment
formulations, timings, and rates are shown in Tables 2-1 and 2-2. All herbicide treatments were
applied using a CO2 back-pack sprayer delivering 140 L ha-1
at 193 kPa through TurboTee1

23
110015 wide angle flat fan spray tips. Weather data for both application timings and years are
shown in Table 2-3.
Alfalfa injury and Palmer amaranth control were evaluated at regular intervals throughout
the growing season. Visual ratings of alfalfa injury and Palmer amaranth control were recorded
one week after treatment and throughout the duration of the growing season on a scale of 0 to
100, where 0 equals no effect and 100 equals plant mortality or complete weed control.
Alfalfa was harvested by clipping the alfalfa 8 cm above the crown in a 0.25 m2 quadrat,
weighed, and then dried at 50 C for 7 days. Once dried, the samples were weighed and
submitted to a commercial laboratory2 for quality analyses. Alfalfa yield, forage quality, and
forage quality analyses were then analyzed for statistical differences.
In 2012, Palmer amaranth emergence was monitored in 0.25 m2 quadrats at the four
corners of each experiment by removing emerged plants and recording them at weekly intervals
throughout the season. A three-parameter logistic model was fit to Palmer amaranth emergence
data based on Julian days, such that May 1 is day 122, June 3 is 155, July 8 is 190, and August 5
is 218. The emergence model was:
where y is the cumulative % emergence, X is cumulative growing degree days (GDD), a is the
maximum % emergence, E50 is the inflection point (GDD) of curve, and b is the slope of the
curve at the inflection point.
The experimental design for each experiment was a randomized complete block with
three replications, and 3 by 9 m plots. Data were subjected to analysis of variance using PROC
GLIMMIX in SAS 9.23, and means were separated using Fisher’s protected LSD at P ≤ 0.05.
𝑦 = a
1 + (𝑋E50
)
24
Alfalfa injury and Palmer amaranth control were then compared to the untreated check using
contrasts and pairwise comparisons to determine if significant differences were observed at P ≤
0.05.
RESULTS AND DISCUSSION
Alfalfa Injury
Several treatments injured the alfalfa at both application timings for both the dryland and
irrigated experiments. Injury was observed 7 and 14 DAT in 2011 (Table 2-4) and 7, 14, 21, and
28 DAT in 2012 (Table 2-5). Injury symptoms from these herbicide treatments consisted of leaf
chlorosis, necrosis, and general stunting. The substantial injury caused in 2012 was likely
enhanced by the warm weather, alfalfa coming out of dormancy, and addition of crop oil
concentrate (COC) with one of the herbicide formulations.
In 2011, some DOR applications significantly injured the alfalfa 7 DAT but injury was
not evident by 14 DAT (Table 2-4). A DOR premix of sulfentrazone & carfentrazone at 140 &
15 g ha-1
+ COC at 1% v/v caused 6% injury while all other DOR treatments did not
significantly affect the alfalfa (Table 2-4). Much of these injury symptoms were general stunting
with some foliar necrosis to the trifoliate leaf tips. Significant foliar necrosis was also observed
from seven BC treatments 7 DAT but only two treatments had a significant effect on the alfalfa
14 DAT. By 21 DAT, injury was not evident for any of the herbicide treatments (Table 2-4).
In 2012, three herbicide treatments caused significant chlorosis and necrosis to the alfalfa
in the dryland experiment. Dormant applications of sulfentrazone & carfentrazone at 140 & 15 +
COC and 280 & 30 g ha-1
+ COC at 1% v/v, and sulfentrazone & carfentrazone at 140 & 15 g ha-
1 caused 47, 83, and 13% injury to the alfalfa 7 DAT, respectively, but new alfalfa growth was
not affected as symptoms subsided with time and were no longer evident by 28 DAT (Table 2-5).
25
Alfalfa injury was not evident following BC applications (data not presented). Alfalfa injury
was substantially less for the same treatments in the irrigated experiment and all chlorosis,
necrosis, and stunting had diminished by first harvest.
Alfalfa yield and quality
In 2011, first cutting alfalfa yields from plots treated with DOR herbicide applications
ranged from 4,390 to 5,130 kg ha-1
(Table 2-6). Alfalfa yields from the herbicide-treated plots
were not different from the untreated check. The DOR application of flumioxazin at 140 g ha-1
followed by BC imazethapyr at 70 g ha-1
+ COC at 1% v/v had higher alfalfa yield when
compared to the untreated check for the second cutting, but the difference was probably due to
variable alfalfa stands and not treatment effect. All other herbicide treatments were not different
from the untreated check at a significance level of 0.05 (Table 2-6). In 2012, a DOR application
of flumioxazin & pyroxasulfone at 140 & 180 g ha-1
in the irrigated experiment and a DOR
application of sulfentrazone at 280 g ha-1
in the dryland experiment both yielded lower when
compared to the untreated check (Table 2-7). Less yield was recorded from plots treated with a
BC application of sulfentrazone & carfentrazone at 140 & 15 g ha-1
in the dryland experiment
when compared to the untreated check (Table 2-7). However, alfalfa yield did not differ among
for any other herbicide treatments or application timings for both the dryland and irrigated
experiments, respectively. Alfalfa stands were variable for the dryland and irrigated experiments
which may have had an effect on yield data. Alfalfa forage qualities were not different from the
untreated check. Crude protein (CP), acid detergent fiber (ADF), neutral detergent fiber (NDF),
total digestible nutrients (TDN), calcium (Ca), phosphorus (P), potassium (K), Magnesium (Mg),
and relative feed value (RFV) were unaffected by all herbicide treatments and timings (data not
26
shown). Weed competition with alfalfa was minimal for the first two alfalfa cuttings and the
herbicide treatments appeared to have minimal negative effect on alfalfa yield and quality.
Palmer amaranth control
Several herbicide treatments provided early season Palmer amaranth control, but the best
late season control was provided by treatments that included flumioxazin or diuron alone or in
combination with another herbicide in 2011 (Table 2-8). A BC application of flumioxazin at 140
g ha-1
provided the best late season control of Palmer amaranth with 82% control by the end of
the season. A dormant application of diuron at 2,690 g ha-1
provided 77% control late in the
season, which was significantly better than the DOR applications of flumioxazin which provided
60% control. The BC application of flumioxazin would persist later into the summer than the
DOR treatments. This provides better control of later germinating weeds. A dormant
application of flumioxazin & pyroxasulfone at 140 & 180 g ha-1
provided 65% control and a
sequential application of flumioxazin at 140 g ha-1
followed by imazethapyr at 70 g ha-1
+ COC
at 1% v/v provided 68% control of Palmer amaranth late into the season. All other herbicide
treatments provided little to no Palmer amaranth control by the end of the season (Table 2-8).
Palmer amaranth control in 2012 was similar to 2011. All herbicides provided fair to
good control of Palmer amaranth early in the season but control diminished for many of the
treatments towards the end of the season. The best late season control of Palmer amaranth was
achieved with treatments that included a DOR application of flumioxazin or diuron, followed by
a BC application of flumioxazin. These treatments were added in 2012 based on the 2011
results in an attempt to achieve better late season Palmer amaranth control. Flumioxazin at 140 g
ha-1
followed by flumioxazin at 70 g ha-1
provided 88 and 87% control for the dryland and
irrigated experiments, respectively. Diuron at 2,690 kg ha-1
followed by flumioxazin at 70 g ha-1

27
provided 96 and 88% for the dryland and irrigated experiments, respectively (Tables 2-9 and 2-
10). Late season Palmer amaranth control with DOR applications of flumioxazin and diuron or
BC treatments with flumioxazin were better than the other treatments, but not as good as the
sequential treatments. Control varied 44-85% for DOR and BC applications of flumioxazin and
diuron for the dryland and irrigated experiments (Tables 2-9 and 2-10).
Palmer amaranth emergence
Palmer amaranth began emerging early in the season and continued throughout the
duration of the growing season. In 2012, Palmer amaranth began emerging May 1, with 20%
cumulative emergence by June 3 or 33 days after weed emergence began, 80% cumulative
emergence by July 8, and emergence stopped by August 5 (Figure 2-1). The greatest emergence
was between June 3 and July 8. Total Palmer amaranth emergence was greater on the dryland
experiment than the irrigated experiment with 436 and 136 plants m-2
, respectively, but
emergence patterns were similar. Palmer amaranth germinates throughout the growing season
and herbicides with long residual soil activity may be necessary to achieve acceptable season-
long control.
Several treatments provided early season Palmer amaranth control and the best late
season control of Palmer amaranth was provided by treatments that included a DOR application
of flumioxazin or diuron, followed by a BC application of flumioxazin. Therefore, sequential
herbicide treatments with good residual activity may be necessary for season-long control of
Palmer amaranth.

28
SOURCES OF MATERIALS
1Teejet Spraying Systems, Wheaton, IL 60189-7900.
2SDK Laboratories, Inc. 1000 Corey Road Hutchinson, KS 67501.
3SAS version 9.2, SAS Institute Inc., 100 SAS Campus Drive, Cary NC 27513.
ACKNOWLEDGEMENTS
The authors thank Don and Tim Martin for the use of their alfalfa field during this
research; FMC, Valent, and NovaSource for providing funding; and SDK Laboratories, Inc., for
their assistance with the forage quality analyses.
29
LITERATURE CITED
Anonymous 2012. USDA-NASS Quick Stats (crops).
http://www.nass.gov/QuickStats/PullData_US.jsp. Accessed: March 10, 2012.
Cords, H. P. 1973. Weeds and alfalfa quality. Weeds 21:400-401.
Cosgrove, D. R. and M. Barrett. 1987. Effects of weed control in established alfalfa (Medicago
sativa) on forage yield and quality. Weed Sci. 35:564-567.
Curran, W. S., D. D. Lingenfelter, D. D. Calvin, J. F. Tooker, and J. M. Dillon. 2008. Forages
pest management. Pages 321-346 in A. Kirsten, ed. The Agronomy Guide 2009-2010.
University Park, PA: Pennsylvania State University.
Hagood, E. S., H. P. Wilson, R. L. Ritter, B. A. Majek, W. S. Curran, R. Chandran, and M.
VanGessel. 2010. Weed Control in field crops. Section 5-23 in The 2010 Pest
Management Guide. Blacksburg, VA: Virginia Cooperative Extension, Virginia Tech,
http://pubs.ext.vt.edu/456/456-016/456-016-10_Field_Crops.pdf. Accessed: February 1,
2012.
Hahn, R. R. 2010. Weed control in forages. Section 4.11 in W. Cox and L. Smith, eds. The 2010
Cornell guide for integrated field crop management. Ithaca, NY: Cornell University
Cooperative Extension. http://ipmguidelines.org/FieldCrops/. Accessed: March 20, 2013.
Kapusta, G. and C. F. Strieker. 1975. Selective control of downy brome in alfalfa. Weed Sci.
23:202-206.
Malik, N., G. G. Bowes, and J. Waddington. 1993. Residual herbicides for weed control in
established alfalfa (Medicago sativa) grown for seed. Weed Technol. 7:483-490.
Moyer, J. R. 1985. Effect of weed control and companion crop on alfalfa and sainfoin
establishment, yields, and nutrient composition. Can. J. Plant Sci. 65:107-116.
Ott, P. M., J. H. Dawson, and A. P. Appleby. 1989. Volunteer wheat (Triticum aestivum) in
newly seeded alfalfa (Medicago sativa). Weed Technol. 3:375–380.
Peters, E. J., R. A. McKelvey, and R. Mattas. 1984. Controlling weeds in dormant and
nondormant alfalfa (Medicago sativa). Weed Sci. 32:154-157.
Pike, D. R. and J. F. Stritzke. 1984. Alfalfa (Medicago sativa)-cheat (Bromus secalinus)
competition. Weed Sci. 32:751-756.
Robison, L. R., C. F. Williams, and W. D. Laws. 1978. Weed control in established alfalfa
(Medicago sativa). Weed Sci. 26:37-41.
30
Smith, D. 1969. Influence of temperature on the yield and chemical composition of ‘Vernal’
alfalfa at first flower. Agron. J. 61:470-472.
Thompson, C. R., D. E. Peterson, W. H. Fick, P. W. Stahlman, and R. E. Wolf. 2013. 2013
Chemical weed control for field crops, pastures, rangeland, and noncropland. Report of
Progress 1081. Manhattan, KS: Kansas State University.
Wilson, R. G. 1989. New herbicides for weed control in established alfalfa (Medicago sativa).
Weed Technol. 3:523-526.
31
Table 2-1. Herbicide treatments, timings and rates for dryland experiment at Clay Center,
KS in 2011.
Herbicidea Timing
b Rate
(g ai ha-1
)
Flumioxazin DOR 140
Diuron DOR 2,690
Flumioxazin&pyroxasulfone DOR 140&180
Hexazinone DOR 560
Trifluralin DOR 2,240
Terbacil DOR 900
Hexazinone&diuron DOR 590&710
Sulfentrazone DOR 280
Sulfentrazone&carfentrazone+COC DOR 140&150
Flumioxazin/imazethapyr+COC DOR/BC 140/170
Sulfentrazone&carfentrazone/
sulfentrazone&imazethapyr+COC
DOR/
BC
140&15/
130&29
Flumioxazin BC 140
Sulfentrazone BC 140
Sulfentrazone BC 280
Sulfentrazone&carfentrazone BC 140&15
Sulfentrazone&imazethapyr+COC BC 150&30
Sulfentrazone&imazethapyr+COC BC 290&60
aCOC = crop oil concentrate at 1% v/v; & = formulated premix; / = sequential application.
bDOR = dormant herbicide treatments; BC = between cutting treatments.

32
Table 2-2. Herbicide treatments, timings and rates for irrigated and dryland experiments
at Clay Center, KS in 2012.
Herbicidea Timing
b Rate
(g ai ha-1
)
Flumioxazin DOR 140
Diuron DOR 2,690
Flumioxazin&pyroxasulfone DOR 140&180
Hexazinone DOR 560
Trifluralin DOR 2,240
Terbacil DOR 900
Hexazinone&diuron DOR 590&710
Sulfentrazone DOR 280
Sulfentrazone&carfentrazone+COC DOR 140&150
Flumioxazin/imazethapyr+COC DOR/BC 140/170
Sulfentrazone&carfentrazone/
sulfentrazone&imazethapyr+COC
DOR/
BC
140&15/
130&29
Flumioxazin/flumioxazin DOR/BC 140/70
Diuron/flumioxazin DOR/BC 2,690/70
Flumioxazin BC 140
Imaxamox+COC+UAN BC 40
Sulfentrazone BC 140
Sulfentrazone BC 280
Sulfentrazone&carfentrazone BC 140&15
Sulfentrazone&imazethapyr+COC BC 150&30
Sulfentrazone&imazethapyr+COC BC 290&60
aCOC = crop oil concentrate at 1% v/v; UAN = urea-ammonium nitrate applied at 2.5% v/v; & = formulated premix;
/ = sequential application. bDOR = dormant herbicide treatments; BC = between cutting treatments.

33
Table 2-3. Weather data at time of applications to the dryland and irrigated alfalfa
experiments at Clay Center, KS in 2011 and 2012.
Dryland Irrigated
----------2011---------- ----------2012---------- ----------2012----------
Application date 03/10/11 05/23/11 03/09/12 04/23/12 03/09/12 04/23/12
Time of day 5:30 PM 4:30 PM 11:30 PM 7:30 PM 1:30 PM 6:30 PM
Application timinga DOR BC DOR BC DOR BC
Air temperature (C) 12 28 22 20 21 22
Relative humidity % 52 45 16 44 17 38
Wind speed (m s-1
) 1.8 1.8 1.7 2.7 2.0 1.8
Wind direction S E SW S SW SSW
Dew presence No No No No No No
Soil temperature (C) 8 27 8 18 9 16
Soil moisture Good Dry Dry Dry Dry Dry
Cloud cover % 0 0 0 0 0 0
a DOR = dormant application, BC = between cutting application
34
Table 2-4. Visible injury to alfalfa as affected by dormant and between cutting herbicide applications to the dryland
experiment at Clay Center, KS in 2011.
-----------------------Alfalfa Injury-----------------------
Herbicidea Rate Timing
b 7 DAT
c 14 DAT
c 7 DAT
d 14 DAT
d 21 DAT
d
(g ai ha-1
) --------------------------(%)--------------------------
Flumioxazin 140 DOR 0 0 0 0 0
Diuron 2,690 DOR 0 0 0 0 0
Flumioxazin&pyroxasulfone 140&180 DOR 0 0 0 0 0
Hexazinone 560 DOR 0 0 0 0 0
Trifluralin 2,240 DOR 0 0 1 0 0
Terbacil 900 DOR 0 0 0 0 0
Hexazinone&diuron 590&710 DOR 0 0 0 0 0
Sulfentrazone 280 DOR 2 0 0 0 0
Sulfentrazone&carfentrazone+COC 140&15 DOR 6 0 0 0 0
Flumioxazin/imazethapyr+COC 140&70 DOR/BC 4 0 2 0 0
Sulfentrazone&carfentrazone/
sulfentrazone&imazethapyr+COC
140&15/
130&29
DOR/
BC
4
0
5
1 0
Flumioxazin 140 BC 20 8 0
Sulfentrazone 140 BC 4 0 0
Sulfentrazone 280 BC 8 4 0
Sulfentrazone&carfentrazone 140&15 BC 4 0 0
Sulfentrazone&imazethapyr+COC 150&30 BC 8 2 0
Sulfentrazone&imazethapyr+COC 290&60 BC 7 0 0
Untreated 0 0 0 0 0
LSD ≤ 0.05 2 0 6 3 0 aCOC = crop oil concentrate at 1% v/v; UAN = urea-ammonium nitrate applied at 2.5% v/v; & = formulated premix; / = sequential application.
bDOR = dormant herbicide treatments; BC = between cutting treatments.
cDAT = days after dormant treatments.
dDAT = days after between cutting treatments.
35
Table 2-5. Visible injury to alfalfa as affected by dormant herbicide applications for the irrigated and dryland experiments at
Clay Center, KS in 2012.
-------Irrigated------- --------------------Dryland--------------------
Herbicidea Rate Timing
b 7 DAT
c 14 DAT
c 7 DAT
c 14 DAT
c 21 DAT
c 28 DAT
c
(g ai ha-1
) ----------------------------------(%)----------------------------------
Flumioxazin 140 DOR 0 0 0 0 0 0
Diuron 2,690 DOR 0 0 0 0 0 0
Flumioxazin&pyroxasulfone 140&180 DOR 0 0 0 0 0 0
Hexazinone 560 DOR 0 0 0 0 0 0
Trifluralin 2,240 DOR 0 1 0 0 0 0
Terbacil 900 DOR 0 0 0 0 0 0
Hexazinone&diuron 590&710 DOR 0 0 0 0 0 0
Sulfentrazone 280 DOR 0 0 0 0 0 0
Sulfentrazone&carfentrazone+COC 140&15 DOR 3 0 47 13 3 0
Sulfentrazone&carfentrazone+COC 280&30 DOR 20 3 83 50 20 3
Flumioxazin/imazethapyr+COC 140&70 DOR/BC 0 0 0 0 0 0
Sulfentrazone&carfentrazone/
sulfentrazone&imazethapyr+COC
140&15/
130&29
DOR/
BC
0
0
13
3
0
0
Flumioxazin/flumioxazin 140/70 DOR/BC 0 0 0 0 0 0
Diuron/flumioxazin 270/70 DOR/BC 0 0 0 0 0 0
Untreated 0 0 0 0 0 0
LSD ≤ 0.05 2 2 10 3 2 2
aCOC = crop oil concentrate at 1% v/v; UAN = urea-ammonium nitrate applied at 2.5% v/v; & = formulated premix; / = sequential application.
bDOR = dormant herbicide treatments; BC = between cutting treatments.
cDAT = days after dormant treatments.
36
Table 2-6. Alfalfa yields as affected by dormant and between cutting herbicide applications for the dryland experiment at Clay
Center, KS in 2011.
Alfalfa yield
Herbicidea Rate Timing
b 1
st cutting 2
nd cutting
(g ai ha-1
) -------kg ha-1
-------
Flumioxazin 140 DOR 4390 3090
Diuron 2,690 DOR 4460 2800
Flumioxazin&pyroxasulfone 140&180 DOR 4560 2840
Hexazinone 560 DOR 4730 3080
Trifluralin 2,240 DOR 5280 3080
Terbacil 900 DOR 4860 3280
Hexazinone&diuron 590&710 DOR 4650 2620
Sulfentrazone 280 DOR 4660 3000
Sulfentrazone&carfentrazone 140&15 DOR 4510 2180
Sulfentrazone&carfentrazone+COC 280&30 DOR 4540 2690
Flumioxazin/imazethapyr+COC 140&70 DOR/BC 4730 3370**
Sulfentrazone&carfentrazone/
sulfentrazone&imazethapyr+COC
140&15/
130&29
DOR/
BC
5130
2870
Flumioxazin 140 BC 2240
Sulfentrazone 140 BC 2600
Sulfentrazone 280 BC 2520
Sulfentrazone+COC 140 BC 2550
Sulfentrazone&carfentrazone 140&15 BC 2860
Sulfentrazone&imazethapyr+COC 150&30 BC 2590
Sulfentrazone&imazethapyr+COC 290&60 BC 2830
Untreated 5480 2260
LSD ≤ 0.05 1180 950
**Indicates significance at α ≤ 0.05 when compared to untreated check. aCOC = crop oil concentrate at 1% v/v; UAN = urea-ammonium nitrate applied at 2.5% v/v; & = formulated premix; / = sequential application.
bDOR = dormant herbicide treatments; BC = between cutting treatments.
37
Table 2-7. Alfalfa yields as affected by dormant and between cutting herbicide applications for the dryland and irrigated
experiments at Clay Center, KS in 2012.
Alfalfa yield
Irrigated Dryland
Herbicide Rate Timing 1st cutting 2
nd cutting 1
st cutting 2
nd cutting
(g ai ha-1
) -------------------kg ha-1
-------------------
Flumioxazin 140 DOR 2830 3500 3220 3800
Diuron 2,690 DOR 3000 3450 3340 4500
Flumioxazin&pyroxasulfone 140&180 DOR 1770** 3030 2780 3780
Hexazinone 560 DOR 2690 3300 3540 4370
Trifluralin 2,240 DOR 3080 3230 3400 4300
Terbacil 900 DOR 2520 3350 2830 3640
Hexazinone&diuron 590&710 DOR 3050 3260 3020 4030
Sulfentrazone 280 DOR 3000 3760 3380 2680**
Sulfentrazone&carfentrazone+COC 140&15 DOR 2370 3990 2910 4000
Sulfentrazone&carfentrazone+COC 280&30 DOR 2240 3160 2760 3890
Flumioxazin/imazethapyr+COC 140&70 DOR/BC 2890 3070 2950 4160
Sulfentrazone&carfentrazone/
sulfentrazone&imazethapyr+COC
140&15/
130&29
DOR/
BC
2070
2960
3460
3430
Flumioxazin/flumioxazin 140/70 DOR/BC 2880 3480 3500 3880
Diuron/flumioxazin 2,690/70 DOR/BC 2860 3390 2900 4150
Flumioxazin 140 BC 3560 4370
Imazamox+COC+UAN 40 BC 3680 3900
Sulfentrazone 140 BC 3710 3870
Sulfentrazone+COC 280 BC 3060 3840
Sulfentrazone&carfentrazone 140&15 BC 3180 3390**
Sulfentrazone&imazethapyr+COC 150&30 BC 2840 3970
Sulfentrazone&imazethapyr+COC 290&60 BC 3320 4100
Untreated 2550 3440 3040 4570
LSD ≤ 0.05 736 828 575 980
**Indicates significance at α ≤ 0.05 when compared to untreated check.
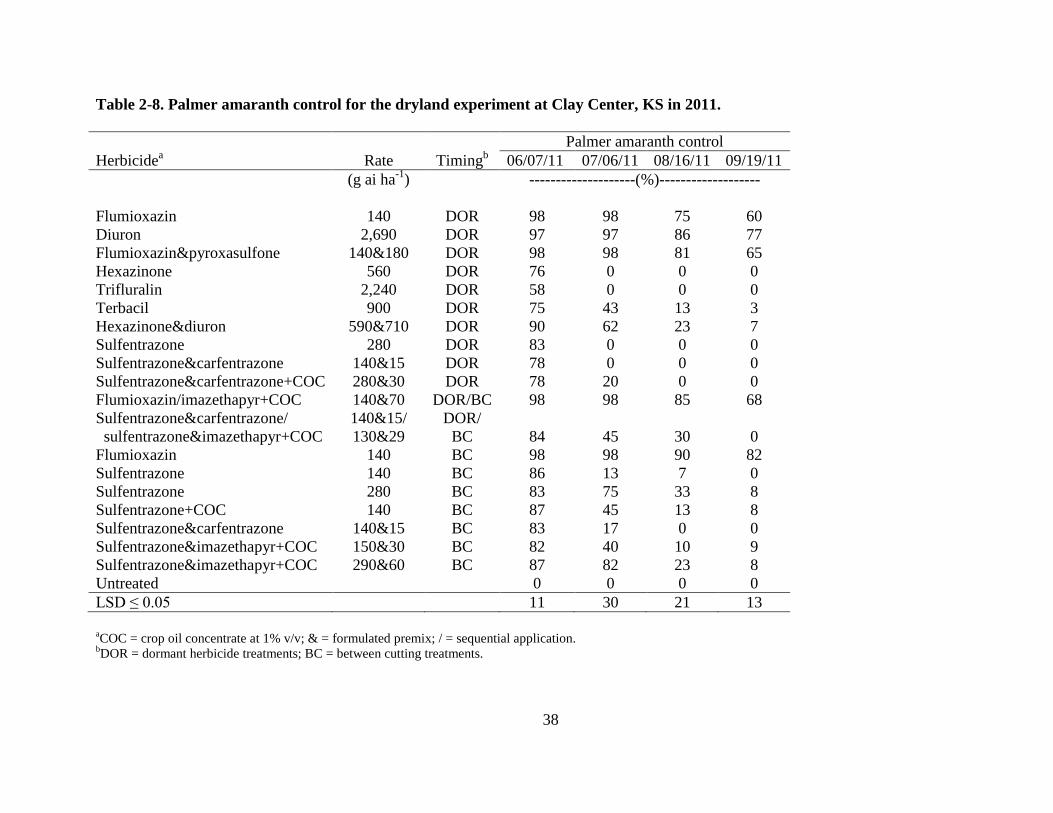
38
Table 2-8. Palmer amaranth control for the dryland experiment at Clay Center, KS in 2011.
Palmer amaranth control
Herbicidea Rate Timing
b 06/07/11 07/06/11 08/16/11 09/19/11
(g ai ha-1
) --------------------(%)-------------------
Flumioxazin 140 DOR 98 98 75 60
Diuron 2,690 DOR 97 97 86 77
Flumioxazin&pyroxasulfone 140&180 DOR 98 98 81 65
Hexazinone 560 DOR 76 0 0 0
Trifluralin 2,240 DOR 58 0 0 0
Terbacil 900 DOR 75 43 13 3
Hexazinone&diuron 590&710 DOR 90 62 23 7
Sulfentrazone 280 DOR 83 0 0 0
Sulfentrazone&carfentrazone 140&15 DOR 78 0 0 0
Sulfentrazone&carfentrazone+COC 280&30 DOR 78 20 0 0
Flumioxazin/imazethapyr+COC 140&70 DOR/BC 98 98 85 68
Sulfentrazone&carfentrazone/
sulfentrazone&imazethapyr+COC
140&15/
130&29
DOR/
BC
84
45
30
0
Flumioxazin 140 BC 98 98 90 82
Sulfentrazone 140 BC 86 13 7 0
Sulfentrazone 280 BC 83 75 33 8
Sulfentrazone+COC 140 BC 87 45 13 8
Sulfentrazone&carfentrazone 140&15 BC 83 17 0 0
Sulfentrazone&imazethapyr+COC 150&30 BC 82 40 10 9
Sulfentrazone&imazethapyr+COC 290&60 BC 87 82 23 8
Untreated 0 0 0 0
LSD ≤ 0.05 11 30 21 13
aCOC = crop oil concentrate at 1% v/v; & = formulated premix; / = sequential application.
bDOR = dormant herbicide treatments; BC = between cutting treatments.
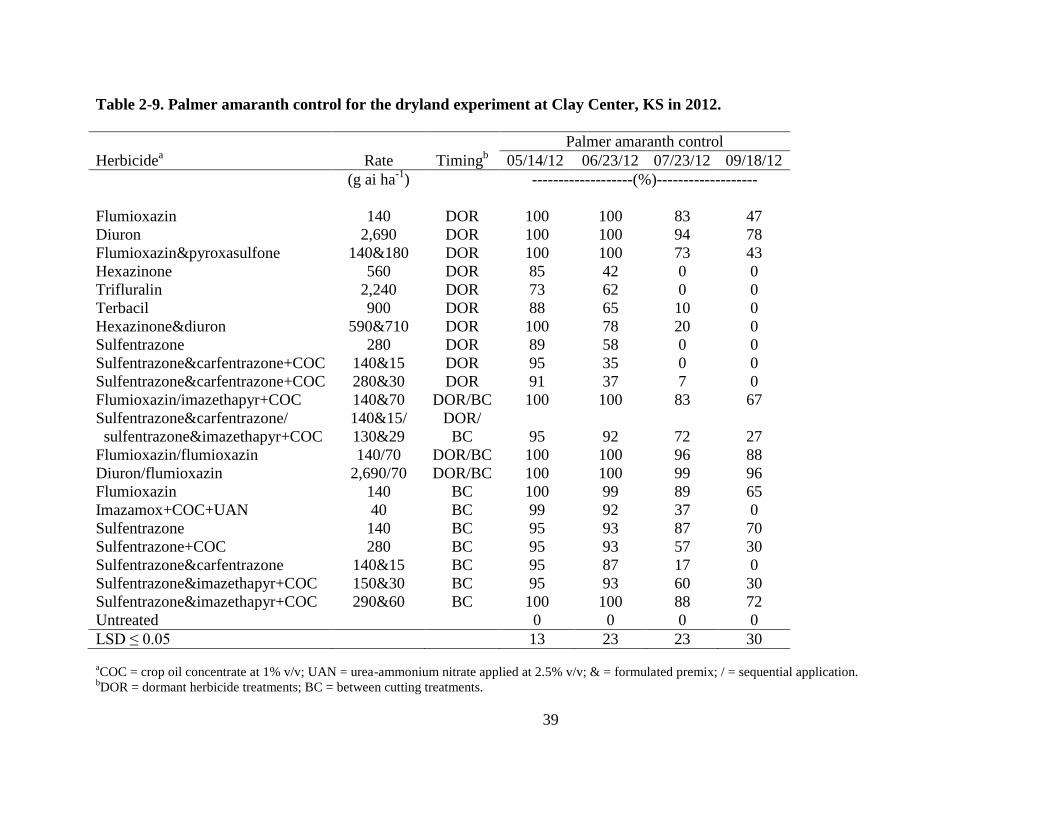
39
Table 2-9. Palmer amaranth control for the dryland experiment at Clay Center, KS in 2012.
Palmer amaranth control
Herbicidea Rate Timing
b 05/14/12 06/23/12 07/23/12 09/18/12
(g ai ha-1
) -------------------(%)-------------------
Flumioxazin 140 DOR 100 100 83 47
Diuron 2,690 DOR 100 100 94 78
Flumioxazin&pyroxasulfone 140&180 DOR 100 100 73 43
Hexazinone 560 DOR 85 42 0 0
Trifluralin 2,240 DOR 73 62 0 0
Terbacil 900 DOR 88 65 10 0
Hexazinone&diuron 590&710 DOR 100 78 20 0
Sulfentrazone 280 DOR 89 58 0 0
Sulfentrazone&carfentrazone+COC 140&15 DOR 95 35 0 0
Sulfentrazone&carfentrazone+COC 280&30 DOR 91 37 7 0
Flumioxazin/imazethapyr+COC 140&70 DOR/BC 100 100 83 67
Sulfentrazone&carfentrazone/
sulfentrazone&imazethapyr+COC
140&15/
130&29
DOR/
BC
95
92
72
27
Flumioxazin/flumioxazin 140/70 DOR/BC 100 100 96 88
Diuron/flumioxazin 2,690/70 DOR/BC 100 100 99 96
Flumioxazin 140 BC 100 99 89 65
Imazamox+COC+UAN 40 BC 99 92 37 0
Sulfentrazone 140 BC 95 93 87 70
Sulfentrazone+COC 280 BC 95 93 57 30
Sulfentrazone&carfentrazone 140&15 BC 95 87 17 0
Sulfentrazone&imazethapyr+COC 150&30 BC 95 93 60 30
Sulfentrazone&imazethapyr+COC 290&60 BC 100 100 88 72
Untreated 0 0 0 0
LSD ≤ 0.05 13 23 23 30
aCOC = crop oil concentrate at 1% v/v; UAN = urea-ammonium nitrate applied at 2.5% v/v; & = formulated premix; / = sequential application.
bDOR = dormant herbicide treatments; BC = between cutting treatments.
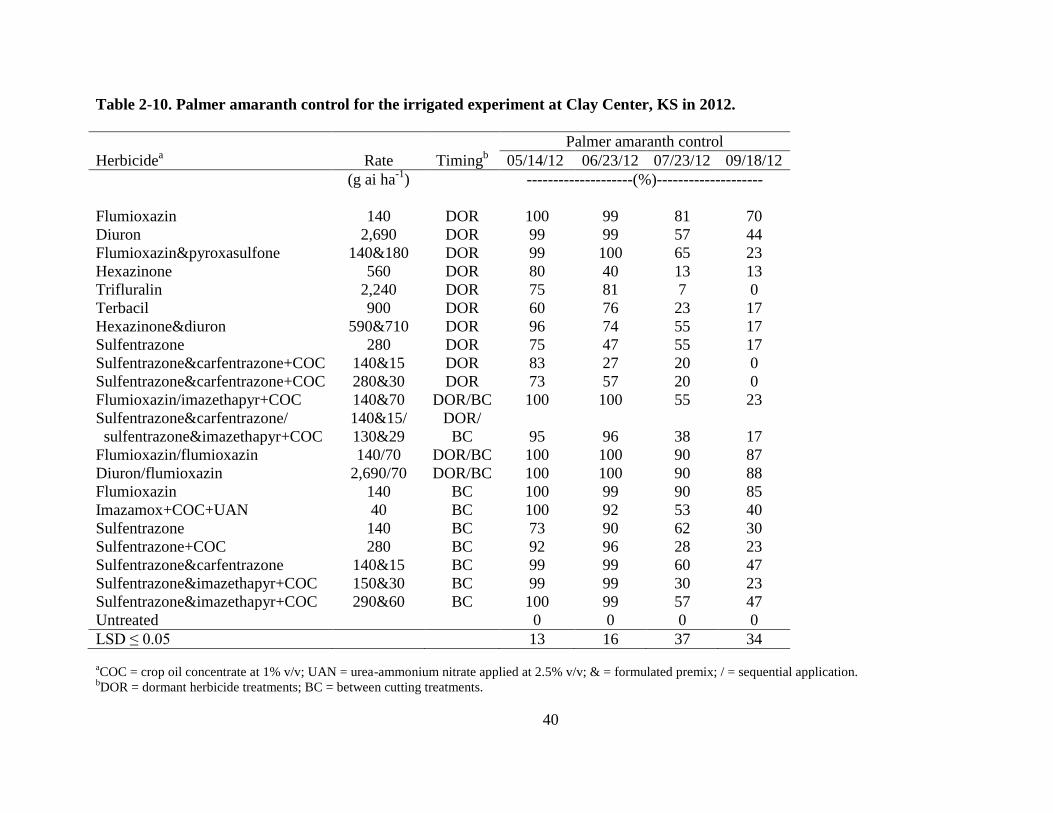
40
Table 2-10. Palmer amaranth control for the irrigated experiment at Clay Center, KS in 2012.
Palmer amaranth control
Herbicidea Rate Timing
b 05/14/12 06/23/12 07/23/12 09/18/12
(g ai ha-1
) --------------------(%)--------------------
Flumioxazin 140 DOR 100 99 81 70
Diuron 2,690 DOR 99 99 57 44
Flumioxazin&pyroxasulfone 140&180 DOR 99 100 65 23
Hexazinone 560 DOR 80 40 13 13
Trifluralin 2,240 DOR 75 81 7 0
Terbacil 900 DOR 60 76 23 17
Hexazinone&diuron 590&710 DOR 96 74 55 17
Sulfentrazone 280 DOR 75 47 55 17
Sulfentrazone&carfentrazone+COC 140&15 DOR 83 27 20 0
Sulfentrazone&carfentrazone+COC 280&30 DOR 73 57 20 0
Flumioxazin/imazethapyr+COC 140&70 DOR/BC 100 100 55 23
Sulfentrazone&carfentrazone/
sulfentrazone&imazethapyr+COC
140&15/
130&29
DOR/
BC
95
96
38
17
Flumioxazin/flumioxazin 140/70 DOR/BC 100 100 90 87
Diuron/flumioxazin 2,690/70 DOR/BC 100 100 90 88
Flumioxazin 140 BC 100 99 90 85
Imazamox+COC+UAN 40 BC 100 92 53 40
Sulfentrazone 140 BC 73 90 62 30
Sulfentrazone+COC 280 BC 92 96 28 23
Sulfentrazone&carfentrazone 140&15 BC 99 99 60 47
Sulfentrazone&imazethapyr+COC 150&30 BC 99 99 30 23
Sulfentrazone&imazethapyr+COC 290&60 BC 100 99 57 47
Untreated 0 0 0 0
LSD ≤ 0.05 13 16 37 34
aCOC = crop oil concentrate at 1% v/v; UAN = urea-ammonium nitrate applied at 2.5% v/v; & = formulated premix; / = sequential application.
bDOR = dormant herbicide treatments; BC = between cutting treatments.
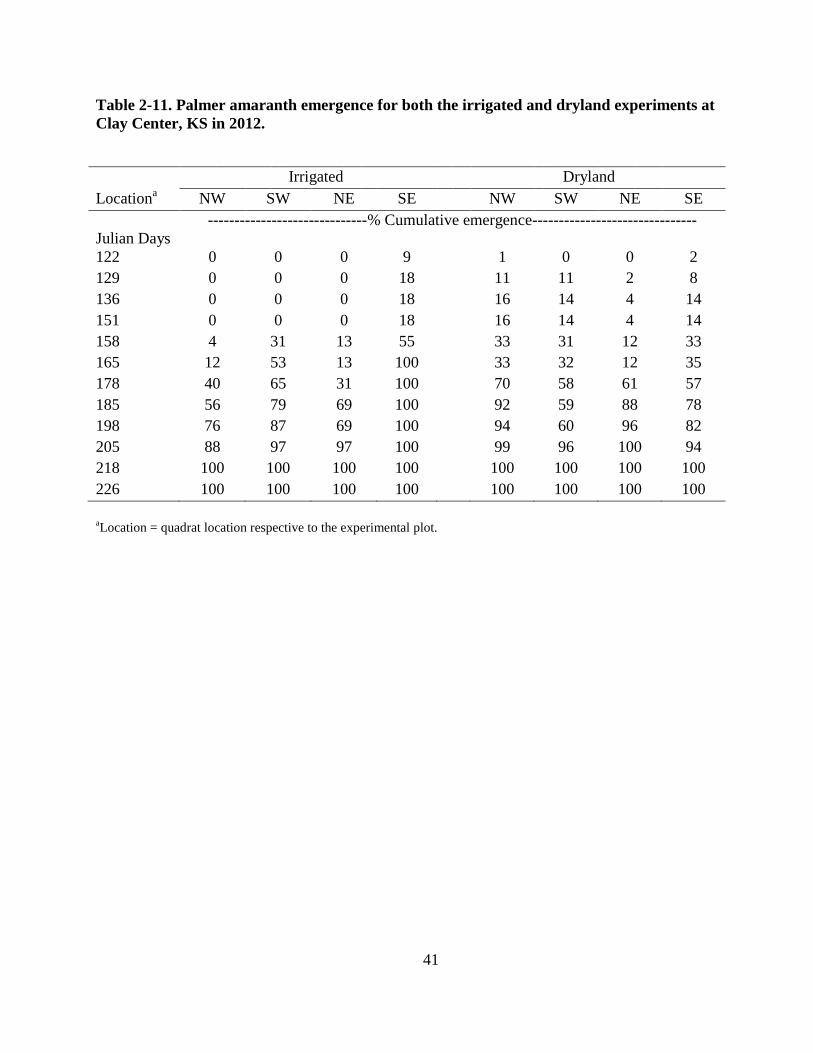
41
Table 2-11. Palmer amaranth emergence for both the irrigated and dryland experiments at
Clay Center, KS in 2012.
Irrigated Dryland
Locationa NW SW NE SE NW SW NE SE
------------------------------% Cumulative emergence-------------------------------
Julian Days
122 0 0 0 9 1 0 0 2
129 0 0 0 18 11 11 2 8
136 0 0 0 18 16 14 4 14
151 0 0 0 18 16 14 4 14
158 4 31 13 55 33 31 12 33
165 12 53 13 100 33 32 12 35
178 40 65 31 100 70 58 61 57
185 56 79 69 100 92 59 88 78
198 76 87 69 100 94 60 96 82
205 88 97 97 100 99 96 100 94
218 100 100 100 100 100 100 100 100
226 100 100 100 100 100 100 100 100
aLocation = quadrat location respective to the experimental plot.
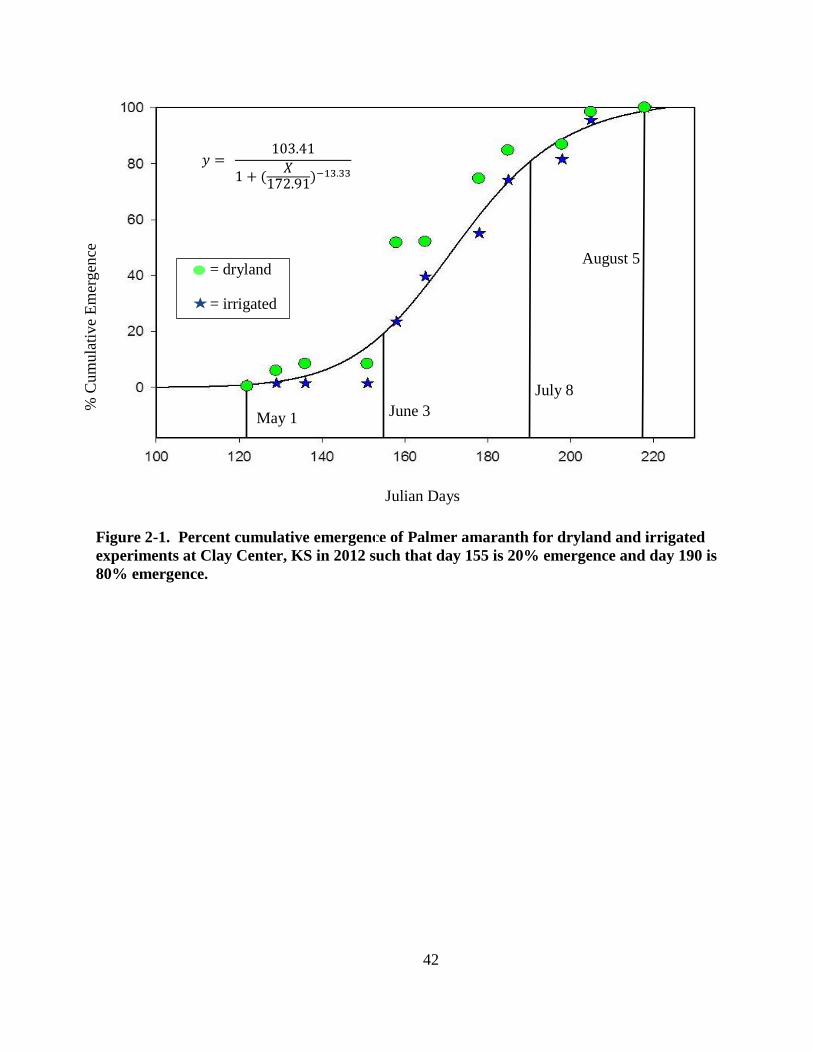
42
Figure 2-1. Percent cumulative emergence of Palmer amaranth for dryland and irrigated
experiments at Clay Center, KS in 2012 such that day 155 is 20% emergence and day 190 is
80% emergence.
Julian Days
% C
um
ula
tive
Em
ergen
ce
= dryland
= irrigated
May 1 June 3
July 8
August 5
𝑦 = 103.41
1 + (𝑋
172.91)−13.33
43
Chapter 3 – Occurrence and Distribution of Glyphosate-Resistant
Common Waterhemp and Palmer Amaranth in Kansas
ABSTRACT
Common waterhemp (Amaranthus rudis) and Palmer amaranth (Amaranthus palmeri) are
troublesome pigweed (Amaranthus) species that can reduce crop yields. Common waterhemp
was first confirmed to be resistant to glyphosate in northeast Kansas in 2006. Glyphosate-
resistant Palmer amaranth is a major problem in the southeastern United States but has not been
previously confirmed in Kansas. The objective of this research was to document the presence
and scope of glyphosate-resistant common waterhemp and Palmer amaranth in Kansas. Seed
from nine populations of common waterhemp and five populations of Palmer amaranth were
collected from soybean and cotton fields throughout eastern Kansas in the fall of 2011 and from
17 populations of Palmer amaranth in the fall of 2012. Plants of each population and species
were grown in the greenhouse and treated with glyphosate at 0, 870, 1,740, and 3,480 g ae ha-1
,
where 870 g ae ha-1
is the typical field use rate, when plants were 10 to 14 cm tall and evaluated
for control when compared to a known susceptible population of each species. Glyphosate
effectively controlled the susceptible population of each species at all glyphosate rates resulting
in complete plant mortality. Several populations of common waterhemp survived applications of
glyphosate up to two times the typical field use rate with some individuals surviving four times
the typical field use rate. Visual injury ranged from 20 to 100% depending on the population and
glyphosate rate. Two populations of Palmer amaranth from 2011 and six populations from 2012
showed similar resistance characteristics, with some plants surviving four times the typical field
use rate of glyphosate. Glyphosate-resistant common waterhemp is present across much of

44
eastern Kansas. Glyphosate-resistant Palmer amaranth is now present in central Kansas and will
likely become more widespread in the future.
45
INTRODUCTION
Pigweed (Amaranthus) species infest agronomic production fields throughout the United
States and have been known to significantly reduce crop yields. The word describing the genus
Amaranthus is derived from the Greek word “amarantus,” which means “everlasting” or “never
failing flowers” (Steckel et al. 2008). Common waterhemp is a troublesome weed throughout
the midwest United States because of its prolific seed production and rapid growth
characteristics (Battles et al. 1998; Bensch et al. 2003). Palmer amaranth is a highly competitive
weed and is a growing threat to conservation tillage in the United States. Palmer amaranth is
native to North America and is becoming very difficult to control because of its growth
characteristics and its evolution of resistance to many classes of herbicides. Identification of
common waterhemp and Palmer amaranth is commonly confused with other pigweed species
such as redroot pigweed (Amaranthus retroflexus). Misidentification of common waterhemp and
Palmer amaranth early in the growing season can be detrimental to a grower if proper
management is not applied.
Common waterhemp and Palmer amaranth have an extended period of germination and
emergence which makes control difficult. They are both dioecious, grow rapidly, and produce
an abundant amount of seed. Common waterhemp germinates optimally between 25/20 and
35/30 C (Guo and Al-Khatib 2003), can produce up to 2 million seeds per plant (Battles et al.
1998) and can grow 2 to 3 m tall (Horak and Loughin 2000). Palmer amaranth can grow up to 5
cm per day under optimal conditions reaching heights of 3 to 4 m (Horak and Peterson 1995).
Bensch et al. (2003) documented seed production for Palmer amaranth and common waterhemp
to be 32,300 and 51,800 seeds m-2
, respectively. These characteristics make common waterhemp
and Palmer amaranth competitive with agronomic crops.
46
Weeds resistant to herbicides are among the primary concerns in modern agriculture
(Burgos et al. 2013). Glyphosate [N-(phosphonomethyl) glycine] is a relatively cheap and
effective tool for controlling grass and broadleaf weed species. After the introduction of
glyphosate-resistant (GR) crops in 1996, the use of this herbicide increased significantly. It is
now estimated that more than 25 million ha of cropland are affected by glyphosate-resistant
weed species (Heap 2013).
Common waterhemp was first confirmed resistant to glyphosate in 2005 in Missouri and
has been spreading since (Legleiter and Bradley 2008). In 2011, two populations of common
waterhemp were confirmed resistant to glyphosate in Texas (Light et al. 2011). They found that
the lethal dose (LD50) was 736 g ae ha-1
for the susceptible population which was equivalent to
0.9x labeled rate of glyphosate, whereas the resistant lines exhibited a broad range of resistance
with LD50 values ranging from 3.5 to 59.7x the labeled rate of glyphosate (Light et al. 2011).
First report in Kansas of glyphosate-resistant common waterhemp occurred in northeast Kansas
in 2006 (Heap 2013). Glyphosate-resistant common waterhemp has spread rapidly; control is
becoming extremely difficult and will likely become more problematic in the near future.
Glyphosate-resistant Palmer amaranth was first observed in 2004 in a field in Macon
County, Georgia (Culpepper et al. 2006). Glyphosate at 12x the labeled rate of 840 g ae ha-1
failed to provide acceptable control of this biotype in the field (Culpepper et al. 2006). Since
then, glyphosate-resistant Palmer amaranth has spread through the southeastern part of the
United States and has begun to move northward. Norsworthy et al. (2008) initiated an
experiment to quantify the level of glyphosate resistance compared to a known susceptible
population that had not been previously exposed to glyphosate. Results showed that the resistant
biotype had an LD50 of 2,820 g ae ha-1
glyphosate, which was 79 to 115x greater than that of the
47
susceptible biotypes and 3.4x a normal glyphosate-use rate of 840 g ae ha-1
in Arkansas
(Norsworthy et al. 2008).
Glyphosate-resistant Palmer amaranth has not been previously confirmed in Kansas
however, several cases of “difficult to control” Palmer amaranth have been reported. The
objective of this study was to document the presence and scope of glyphosate-resistant common
waterhemp and to determine if Palmer amaranth has evolved resistance to glyphosate in Kansas
and document its distribution.
MATERIALS AND METHODS
Common waterhemp and Palmer amaranth seed were collected in October, 2011 from
cotton and soybean fields in eastern Kansas where surviving plants remained. Ten to 20 female
plants were collected from each field. Wise et al. (2009) documented collecting 10 to 30 females
per field of Palmer amaranth and Burgos et al. (2013) believe that five to ten is a sufficient
number of plants to represent a sample for cross-pollinated species. A total of nine common
waterhemp populations and five populations of Palmer amaranth were evaluated. In September
2012, Palmer amaranth seed were collected in a similar manner from 17 fields throughout central
Kansas where glyphosate did not effectively control it. Global positioning system (GPS)
coordinates at each location are reported in Tables 3-1, 3-2, and 3-3 and sampling locations by
county are represented visually on a map of Kansas (Figure 3-1). Seed from each site was
threshed and placed in storage at -5 C until planted. Known glyphosate-susceptible common
waterhemp and Palmer amaranth populations collected from the Department of Agronomy
Ashland Bottoms Research Farm near Manhattan, KS were included for comparison.
From December to April 2011 and again in 2012, seed for all common waterhemp and
Palmer amaranth populations were sown in separate flats, with a volume of 3.4 L and filled with
48
0.7 kg of Miracle-Gro moisture control potting mix1. Plants were grown under greenhouse
conditions of 27/24 ± 2 C day/night temperature with a 16/8 h day/night period and light
intensity of 80 µmol m-2
s-1
photosynthetic photon flux. Individual seedlings were transplanted
into 0.25-L pots when plants were at the cotyledon stage of growth and watered as needed. The
plants were treated when they reached 10 to 14 cm in height. Three treatment levels of
glyphosate2 were applied at 870, 1,740, and 3,480 g ae ha
-1, which represents 1, 2, and 4 times
the typical field use rate. Ammonium sulfate (AMS) at 1% w/w was added to all herbicide
treatments. Glyphosate was applied with a bench-type sprayer3 equipped with an 80015LP
4
spray tip to deliver 187 L ha-1
at 138 kPa.
Percent control was determined 7 and 14 days after treatment (DAT) on a 0 to 100%
scale where 0 = no effect and 100 = plant death. The experimental design was a randomized
complete block with eight replications and was repeated. Control data were subjected to analysis
of variance and pooled across runs because of an insignificant run effect using PROC GLIMMIX
in SAS 9.25. A pairwise comparison was conducted using a Dunnett’s adjustment to compare all
populations by rate against the susceptible population and the adjusted p-value was used for
significance at P ≤ 0.05.
RESULTS AND DISCUSSION
Common Waterhemp
Glyphosate provided 100% control of the known susceptible common waterhemp
population at 7 DAT (Table 3-4). Glyphosate caused foliar chlorosis and necrosis to the leaves
of plants from other populations, but many plants displayed little to no symptoms by 14 DAT.
Some plants were injured, but by 14 DAT had begun to regrow and injury symptoms were less
than 5% in many cases. All populations except NM11 were different from the susceptible
49
population. Population NM11 was sampled from a field in Nemaha County, KS and appeared to
be more susceptible to glyphosate than the other eight populations. Percent control of NM11
was 78 and 87% with 870 g ae ha-1
at 7 and 14 DAT, respectively (Table 3-4). Control of all
other populations was different from the susceptible population with control ranging from 21 to
69% at 14 DAT (Table 3-4). Several populations survived the 2x rate of glyphosate with control
ranging from 53 to 74% at 14 DAT, which were different from the susceptible population (Table
3-4). Population FR11(3) differed from the susceptible population when treated with 3,480 g ha-
1 glyphosate, with control ranging from 73 to 83% at 7 and 14 DAT (Table 3-4). All other
populations were not statistically different from the susceptible population when treated with
3,480 g ha-1
glyphosate. Light et al. (2011) found that the LD50 value for the susceptible
population of common waterhemp (736 g ae ha-1
) was equivalent to the 0.9x labeled rate of
glyphosate, whereas the putatively resistant lines exhibited a broad range of resistance with LD50
values ranging from 3.5 to 59.7x the labeled rate of glyphosate. This research showed that four
out of nine common waterhemp populations survived a 2x rate and one population survived a 4x
rate of glyphosate.
Glyphosate has been used extensively and failure to control common waterhemp with a
typical field use rate often results in reapplications with higher rates. The repeated overuse of
glyphosate has resulted in the selection of glyphosate-resistant weeds. Some populations of
common waterhemp that have been exposed to greater rates of glyphosate for an extended period
of time display higher levels of resistance. Selection pressure has increased the number of
glyphosate-resistant common waterhemp populations throughout the midwest United States.
Glyphosate-resistant common waterhemp is present in several counties across eastern Kansas
and control of this pigweed species is an increasing concern.

50
Palmer Amaranth
In 2011, five populations of Palmer amaranth were collected and analyzed for differences
in response to increasing glyphosate rates in comparison to the susceptible population. Control
of populations from Clay, Dickenson, and Douglas Counties was 100% for the 1, 2, and 4x rates
of glyphosate 7 and 14 DAT and not different from the susceptible population (Table 3-5).
However, two different populations collected from Cowley County, KS were not effectively
controlled with 870 and 1,740 g ha-1
of glyphosate. Control of population CL11(1) ranged from
35 to 41% with 870 g ae ha-1
by 7 and 14 DAT and 58 to 68% with 1,740 g ha-1
glyphosate by 7
and 14 DAT (Table 3-5). Population CL11(2) showed 40 to 44% control with 870 g ae ha-1
by 7
and 14 DAT and from 84 to 89% control with 1,740 g ae ha-1
glyphosate by 7 and 14 DAT
(Table 3-5). Four times the suggested use rate of glyphosate provided control of 91 to 93% by 7
and 14 DAT which was significantly different from the susceptible population (Table 3-5).
In 2012 the 17 populations of Palmer amaranth showed symptoms such as foliar chlorosis
and leaf necrosis but many of the resistant plants outgrew the symptoms by 14 DAT. Seven
populations collected from Cowley, Pottawatomie, and Stafford Counties were not effectively
controlled with glyphosate at 870 g ha-1
by 14 DAT. Three of four populations from Cowley
County, KS were not adequately controlled with glyphosate at 870 g ha-1
by 14 DAT. Control of
population CL12(1) was 43 to 55%, CL12(3) was 56 to 58%, and CL12(4) was 49 to 54% with
870 g ae ha-1
glyphosate at 7 and 14 DAT (Table 3-6). Population CL12(2) was different from
the susceptible population 7 DAT with control of 77% but did not differ by 14 DAT. However,
control was 87% by 14 DAT, indicating some plants were not fully controlled with the 1x rate of
glyphosate. Furthermore, two populations collected from Pottawatomie County, KS [PT12(1)
and PT12(2)] were not controlled with a 1x rate of glyphosate such that PT12(1) was only

51
controlled 67 to 66% and control for population PT12(2) was 60 to 58% at 7 and 14 DAT (Table
3-6). Control started to diminish as plants began growing out of their injury symptoms 14 DAT.
Many plants treated with 870 g ha-1
glyphosate were visually unaffected after 14 DAT indicating
differences within populations. Four populations from Stafford County, KS were collected after
a report of failed Palmer amaranth control in an irrigated glyphosate-resistant soybean field.
Populations SF12(1) and SF12(2) did not differ from the susceptible population 14 DAT across
all rates of glyphosate. However, SF12(3) and SF12(4) were only controlled 35 to 36% and 38
to 46% with 870 g ha-1
glyphosate by 7 to 14 DAT when compared to the susceptible population.
All other populations did not differ from the susceptible population (Table 3-6).
Six Palmer amaranth populations collected in 2012 displayed resistance surviving and
application of 1,740 g ae ha-1
glyphosate. Populations CL12(1), CL12(3), CL12(4), PT12(2),
SF12(3), and SF12(4) survived the 2x rate of glyphosate and were different from the susceptible
population. Control for these populations at 14 DAT was 83, 70, 65, 74, 82 and 81%,
respectively (Table 3-6). No other populations differed from the susceptible population 14 DAT.
CL12(1), CL12(3), and PT12(2) were not fully controlled with 4 times the typical field use rate
of glyphosate at 3,480 g ae ha-1
. Control was 88, 86, and 94% at 14 DAT which was different
from the susceptible population (Table 3-6). All other populations did not differ from the
susceptible population.
A wide variety of crops are grown in Kansas and the use of glyphosate-resistant
technology is very common (Anonymous 2013). The overreliance on glyphosate to control
weeds has led to glyphosate-resistant weed biotypes. In Cowley County in 2011, two
populations of Palmer amaranth collected from a cotton and soybean field were not adequately
controlled with one and two times the typical field use rate of glyphosate. One of those
52
populations [CL11(1)] survived a 4x rate of glyphosate. In 2012, six populations were not
adequately controlled with a 2x rate and three of those populations were uncontrolled with a 4x
rate of glyphosate. Complete control of the susceptible biotype was achieved with glyphosate at
870 g ha-1
by 7 DAT, while 1,740 and 3,480 g ha-1
were still ineffective at controlling the
resistant biotypes. These results mimic research findings of Culpepper et al. (2006) who found
that control of a susceptible biotype of Palmer amaranth was noted with 0.6 kg ha-1
while a 12-
fold increase in glyphosate (7.2 kg ha-1
) was necessary for complete control of the resistant
biotype. These results are also consistent with Norsworthy et al. (2008), who found a resistant
Palmer amaranth biotype in Arkansas had an LD50 of 2,820 g ha-1
glyphosate, which was 79- to
115-fold greater than that of the susceptible biotypes and 3.4 times a normal glyphosate-use rate
of 840 g ha-1
. The development and spread of glyphosate resistance in Palmer amaranth has
become an issue for crop producers in the United States.
Glyphosate-resistant horseweed, giant ragweed, common ragweed, common waterhemp,
and kochia have been confirmed in Kansas (Heap 2013). Several populations of common
waterhemp survived a 1x rate of glyphosate (Figure 3-2). This research confirms that
glyphosate-resistant common waterhemp is present in several counties in eastern Kansas with
several populations surviving two times the typical field use rate of glyphosate. Eight
populations of Palmer amaranth survived the 2x rate of glyphosate and were different from the
susceptible population 14 DAT (Figure 3-2). Therefore, this confirms that glyphosate-resistant
Palmer amaranth is now present in Kansas and glyphosate alone is not a viable option for
controlling these pigweed species. Alternative weed management strategies need to be explored
for controlling glyphosate-resistant common waterhemp and Palmer amaranth in Kansas crop
production systems.
53
SOURCES OF MATERIALS
1Miracle-Gro moisture control potting mix, Scotts Miracle-Gro Products Inc., 1411
Scottslawn Road, Marysville, OH 43041.
2Roundup WEATHERMAX
®, Monsanto Company, St. Louis, MO 63167.
3Research track sprayer, De Vries Manufacturing, RR 1, Box 184, Hollandale, MN
56045.
4Teejet Spraying Systems, Wheaton, IL 60189-7900.
5SAS version 9.2, SAS Institute Inc., 100 SAS Campus Drive, Cary NC 27513.
ACKNOWLEDGEMENTS
The authors thank Kansas State University Department of Agronomy for the use of
facilities.
54
LITERATURE CITED
Anonymous. 2013. USDA-NASS Quick Stats (crops).
http://www.usda.gov/nass/PUBS/TODAYRPT/acrg0612.pdf
Battles, B., B. Hartzler, and D. Buhler. 1998. Effect of common waterhemp emergence date in
soybeans on growth and competitiveness. Proc. N. Cent. Weed Sci. Soc 53:145–146.
Bensch, C. N., M. J. Horak, and D. Peterson. 2003. Interference of redroot pigweed (Amaranthus
retroflexus), Palmer amaranth (Amaranthus palmeri), and common waterhemp
(Amaranthus rudis) in soybean. Weed Sci. 51:37-43.
Burgos, N., P. J. Tranel, J. C. Streibig, V. M. Davis, D. Shaner, J. K. Norsworthy, and C. Ritz.
2013. Review: confirmation of resistance to herbicides and evaluation of resistance
levels. Weed Sci. 61:4-20.
Culpepper, A. S., T. L. Grey, W. K. Vencill, J. M. Kichler, T. M Webster, S. M. Brown, A. C.
York, J. W. Davis, and W. W. Hanna. 2006. Glyphosate-resistant Palmer amaranth
(Amaranthus palmeri) confirmed in Georgia. Weed Sci. 54:620-626.
Guo, P. and K. Al-Khatib. 2003. Temperature effects on germination and growth of redroot
pigweed (Amaranthus retroflexus), Palmer amaranth (A. palmeri), and common
waterhemp (A. rudis). Weed Sci. 51:329-333.
Heap, I. 2013. The International Survey of Herbicide Resistant Weeds. Available at
http://www.weedscience.com. Accessed: January 15, 2013.
Horak, M. J. and T. M. Loughin. 2000. Growth analysis of four Amaranthus species. Weed Sci.
48:347–355.
Horak, M. J., and D. E. Peterson. 1995. Biotypes of Palmer amaranth (Amaranthus palmeri) and
common waterhemp (Amaranthus rudis) are resistant to imazethapyr and thifensulfuron.
Weed Technol. 9:192-195.
Legleiter, T. R., and K. W. Bradley. 2008. Glyphosate and multiple herbicide resistance in
common waterhemp (Amaranthus rudis) populations in Missouri. Weed Sci. 56:582-587.
Light, G. G., M. Y. Mohammed, P. A. Dotray, J. M. Chandler, and R. J. Wright. 2011.
Glyphosate-resistant common waterhemp (Amaranthus rudis) confirmed in Texas. Weed
Technol. 25:480-485.
Norsworthy, J. K., G. M. Griffith, R. C. Scott, K. L. Smith, and L. R. Oliver. 2008. Confirmation
and control of glyphosate-resistant Palmer amaranth (Amaranthus palmeri) in Arkansas.
Weed Technol. 22:108-113.

55
Steckel, L., C. Main, A. Ellis, and T. Mueller. 2008. Palmer amaranth (Amaranthus palmeri) in
Tennessee has low level glyphosate resistance. Weed Technol. 22:119-123.
Wise, A. M., T. L. Grey, E. P. Prostko, W. K. Vencill, and T. M. Webster. 2009. Establishing the
geographical distribution and level of acetolactate synthase resistance of Palmer amaranth
(Amaranthus palmeri) accessions in Georgia. Weed Technol. 23:214–220.

56
Table 3-1. GPS locations for each population of common waterhemp collected in Kansas
during the fall of 2011.
County Populationa GPS coordinates Elevation
---m---
Susceptible S N 39 07.470 W 96 36.840 311
Crawford CR11 N 37 23.549 W 94 43.013 277
Franklin FR11(1) N 38 36.532 W 95 17.971 279
Franklin FR11(2) N 38 36.229 W 95 17.199 274
Franklin FR11(3) N 38 34.753 W 95 16.903 280
Franklin FR11(4) N 38 32.361 W 95 14.649 300
Franklin FR11(5) N 38 32.212 W 95 14.533 300
Marshall MS11 N 39 50.526 W 96
16.103 413
Nemaha NM11 N 39 46.135 W 96 08.516 330
Washington WS11 N 39 50.498 W 96 51.921 410
aPopulation = Kansas county codes followed by the year collected followed by reference number.
Table 3-2. GPS locations for each population of Palmer amaranth collected in Kansas
during the fall of 2011.
County Populationa GPS coordinates Elevation
---m---
Susceptible S N 39 07.470 W 96 36.840 311
Clay CY11 N 39 19.847 W 97 04.346 356
Cowley CL11(1) N 37 14.518 W 97 06.850 374
Cowley CL11(2) N 37 11.262 W 97 10.764 349
Dickenson DK11 N 38 44.705 W 97 16.772 387
Douglas DG11 N 39 00.023 W 95 13.728 243
aPopulation = Kansas county codes followed by the year collected followed by reference number.
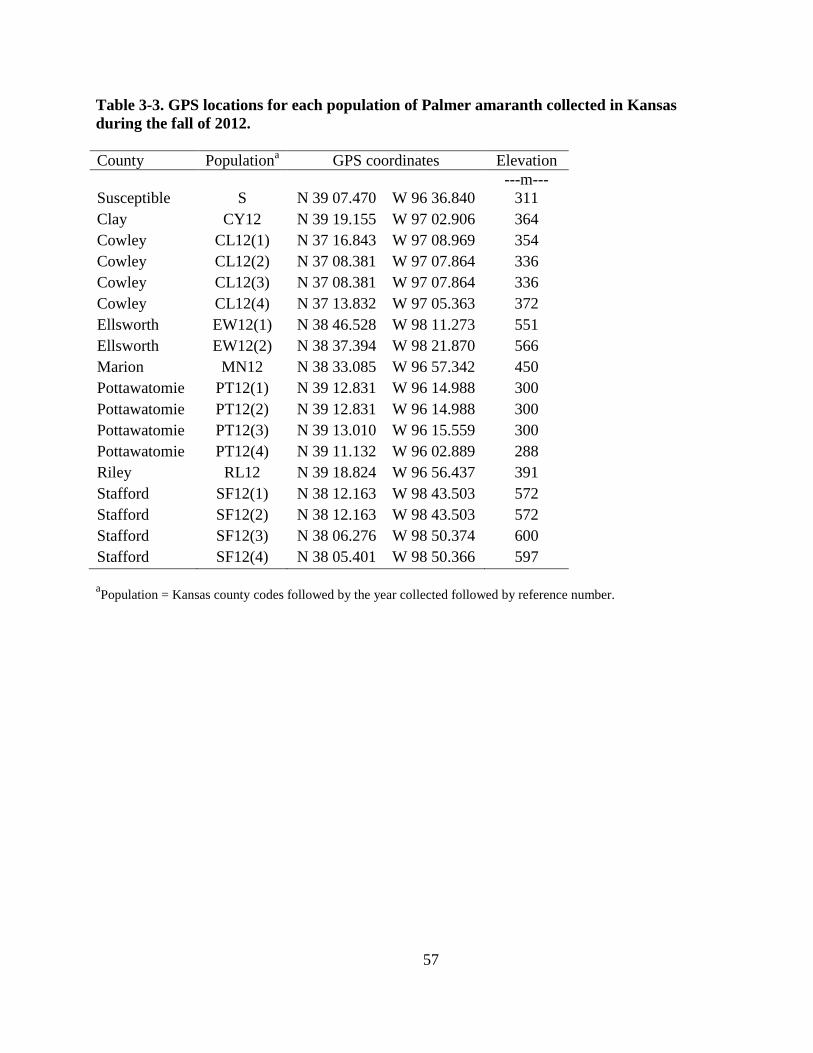
57
Table 3-3. GPS locations for each population of Palmer amaranth collected in Kansas
during the fall of 2012.
County Populationa GPS coordinates Elevation
---m---
Susceptible S N 39 07.470 W 96 36.840 311
Clay CY12 N 39 19.155 W 97 02.906 364
Cowley CL12(1) N 37 16.843 W 97 08.969 354
Cowley CL12(2) N 37 08.381 W 97 07.864 336
Cowley CL12(3) N 37 08.381 W 97 07.864 336
Cowley CL12(4) N 37 13.832 W 97 05.363 372
Ellsworth EW12(1) N 38 46.528 W 98 11.273 551
Ellsworth EW12(2) N 38 37.394 W 98 21.870 566
Marion MN12 N 38 33.085 W 96 57.342 450
Pottawatomie PT12(1) N 39 12.831 W 96 14.988 300
Pottawatomie PT12(2) N 39 12.831 W 96 14.988 300
Pottawatomie PT12(3) N 39 13.010 W 96 15.559 300
Pottawatomie PT12(4) N 39 11.132 W 96 02.889 288
Riley RL12 N 39 18.824 W 96 56.437 391
Stafford SF12(1) N 38 12.163 W 98 43.503 572
Stafford SF12(2) N 38 12.163 W 98 43.503 572
Stafford SF12(3) N 38 06.276 W 98 50.374 600
Stafford SF12(4) N 38 05.401 W 98 50.366 597
aPopulation = Kansas county codes followed by the year collected followed by reference number.
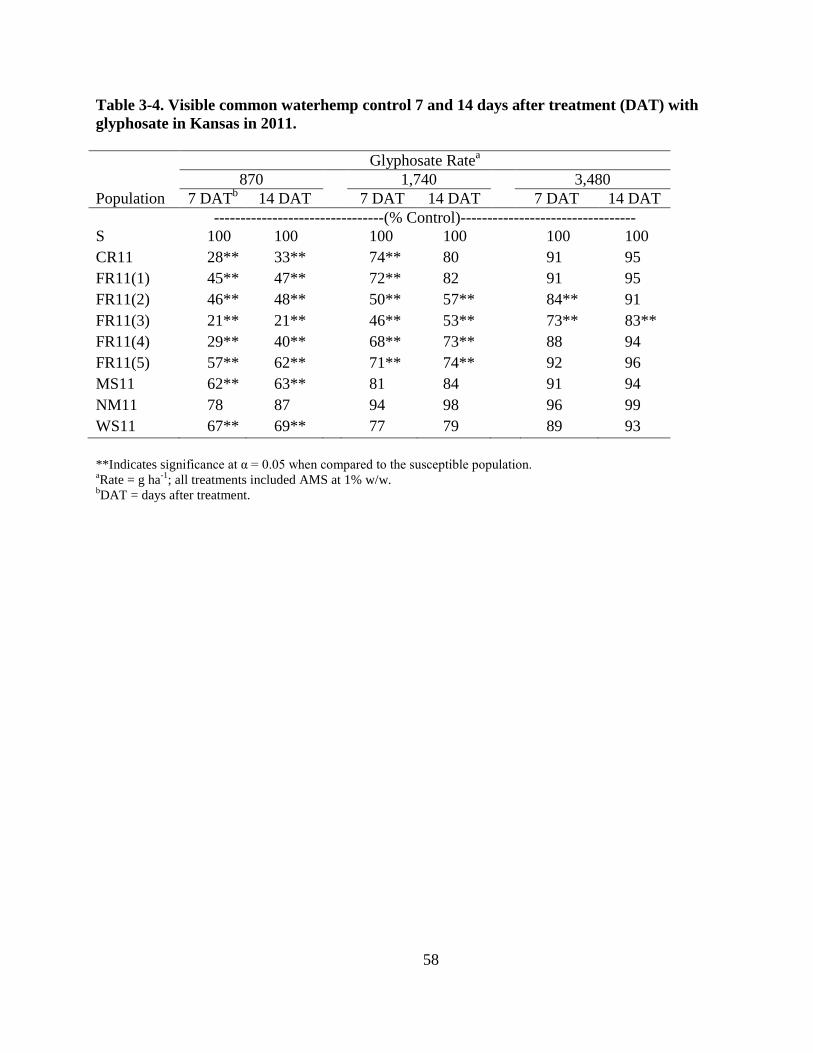
58
Table 3-4. Visible common waterhemp control 7 and 14 days after treatment (DAT) with
glyphosate in Kansas in 2011.
Glyphosate Ratea
870 1,740 3,480
Population 7 DATb 14 DAT 7 DAT 14 DAT 7 DAT 14 DAT
--------------------------------(% Control)---------------------------------
S 100 100 100 100 100 100
CR11 28** 33** 74** 80 91 95
FR11(1) 45** 47** 72** 82 91 95
FR11(2) 46** 48** 50** 57** 84** 91
FR11(3) 21** 21** 46** 53** 73** 83**
FR11(4) 29** 40** 68** 73** 88 94
FR11(5) 57** 62** 71** 74** 92 96
MS11 62** 63** 81 84 91 94
NM11 78 87 94 98 96 99
WS11 67** 69** 77 79 89 93
**Indicates significance at α = 0.05 when compared to the susceptible population. aRate = g ha
-1; all treatments included AMS at 1% w/w.
bDAT = days after treatment.
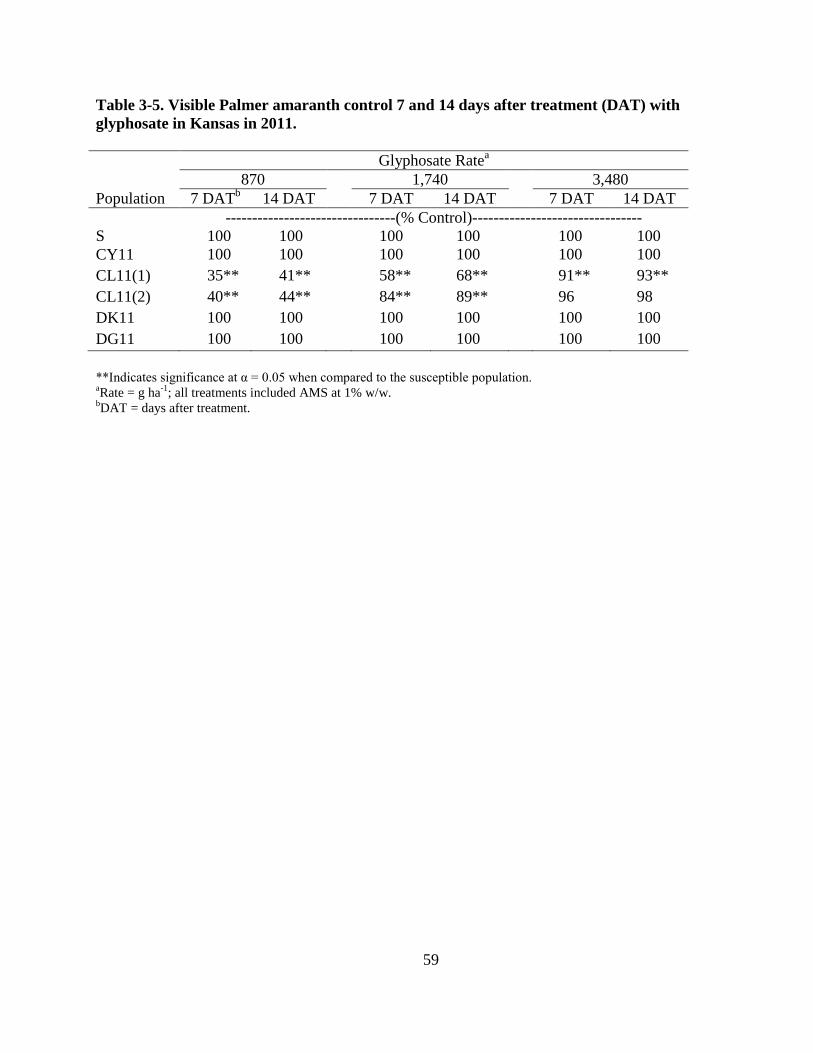
59
Table 3-5. Visible Palmer amaranth control 7 and 14 days after treatment (DAT) with
glyphosate in Kansas in 2011.
Glyphosate Ratea
870 1,740 3,480
Population 7 DATb 14 DAT 7 DAT 14 DAT 7 DAT 14 DAT
--------------------------------(% Control)--------------------------------
S 100 100 100 100 100 100
CY11 100 100 100 100 100 100
CL11(1) 35** 41** 58** 68** 91** 93**
CL11(2) 40** 44** 84** 89** 96 98
DK11 100 100 100 100 100 100
DG11 100 100 100 100 100 100
**Indicates significance at α = 0.05 when compared to the susceptible population. aRate = g ha
-1; all treatments included AMS at 1% w/w.
bDAT = days after treatment.

60
Table 3-6. Visible Palmer amaranth control 7 and 14 days after treatment (DAT) with
glyphosate in Kansas in 2012.
Glyphosate Ratea
870 1,740 3,480
Population 7 DATb 14 DAT 7 DAT 14 DAT 7 DAT 14 DAT
--------------------------------------(% Control)--------------------------------------
S 100 100 100 100 100 100
CY12 100 100 100 100 100 100
CL12(1) 43** 55** 66** 70** 81** 88**
CL12(2) 77** 87 85 91 99 100
CL12(3) 56** 58** 57** 65** 80** 86**
CL12(4) 49** 54** 66** 74** 91 98
EW12(1) 97 99 100 100 100 100
EW12(2) 100 100 100 100 100 100
MN12 100 100 100 100 100 100
PT12(1) 67** 66** 88** 95 99 100
PT12(2) 60** 58** 86** 82** 85** 94**
PT12(3) 98 99 99 100 99 100
PT12(4) 100 100 100 100 100 100
RL12 93 100 100 100 100 100
SF12(1) 99 100 98 100 98 100
SF12(2) 93 94 97 100 98 100
SF12(3) 35** 36** 73** 83** 90 96
SF12(4) 38** 46** 71** 81** 98 99
**Indicates significance at α = 0.05 when compared to the susceptible population. aRate = g ha
-1; all treatments included AMS at 1% w/w.
bDAT = days after treatment.
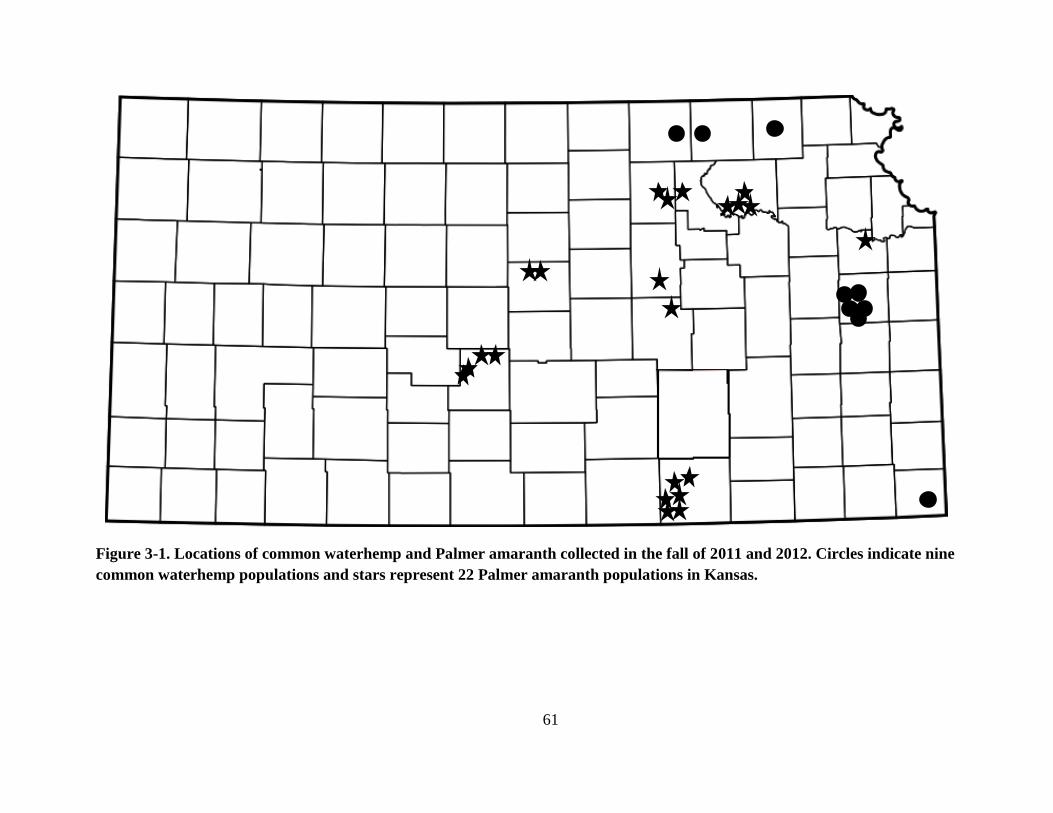
61
Figure 3-1. Locations of common waterhemp and Palmer amaranth collected in the fall of 2011 and 2012. Circles indicate nine
common waterhemp populations and stars represent 22 Palmer amaranth populations in Kansas.
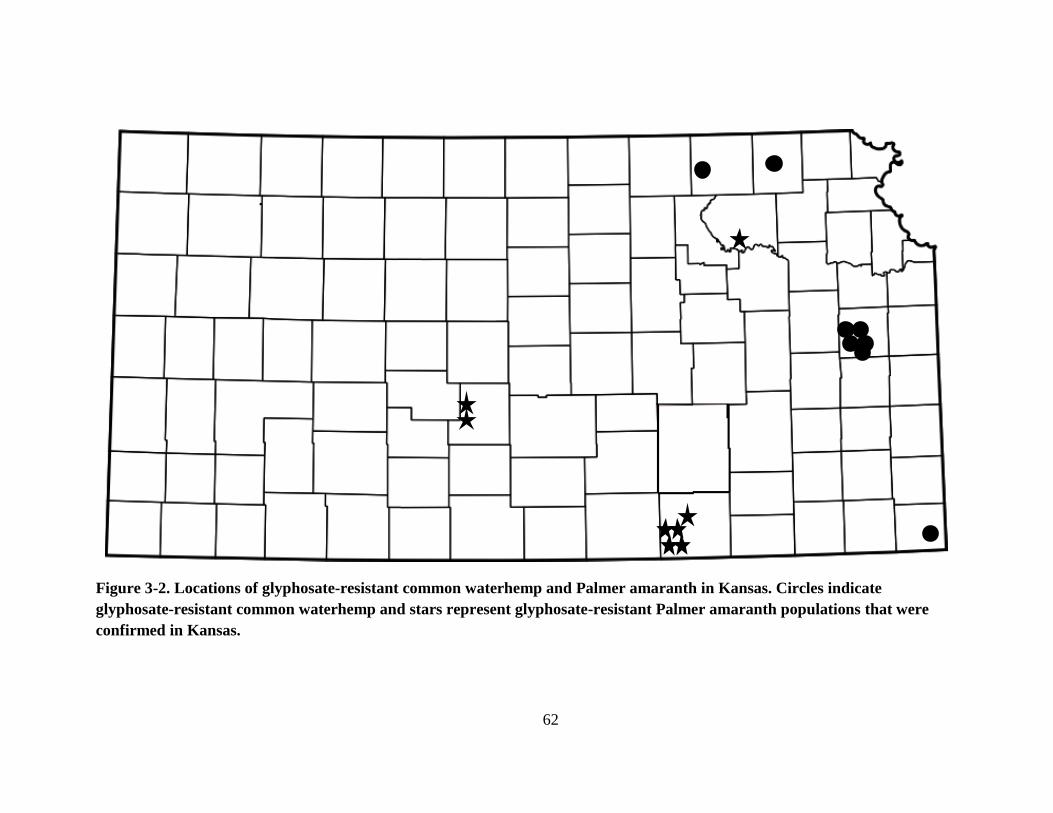
62
Figure 3-2. Locations of glyphosate-resistant common waterhemp and Palmer amaranth in Kansas. Circles indicate
glyphosate-resistant common waterhemp and stars represent glyphosate-resistant Palmer amaranth populations that were
confirmed in Kansas.
63
Chapter 4 – Glyphosate Dose-Response and Shikimate
Accumulation Assay of Palmer Amaranth Populations
ABSTRACT
Palmer amaranth is difficult to control because it germinates early in the growing season,
grows rapidly, and has evolved resistance to certain classes of herbicides. Two separate
experiments were conducted to 1) evaluate the dose response of two Kansas populations of
Palmer amaranth suspected to be resistant to glyphosate and 2) conduct shikimate accumulation
assays to the 2011 and 2012 populations that survived a 2x rate of glyphosate. The suspected
resistant populations were treated with glyphosate rates of 0, 0.50, 1, 2, 4, and 8 times the typical
field use rate of 870 g ae ha-1
and compared to a known susceptible population that was treated
with glyphosate rates of 0, 0.0625, 0.125, 0.25, 0.50, and 1 times the typical use rate. All
treatments included ammonium sulfate at 1% w/w. Percent control was evaluated 7 and 14 days
after treatment (DAT) on a 0 to 100% scale where 0 is no effect and 100 = plant death.
Surviving plants were then harvested and weighed to test for differences in fresh weight biomass
between the susceptible and resistant populations. The susceptible population was fully
controlled with the typical field use rate of glyphosate. There was variability within the resistant
populations however, they behaved similarly. Glyphosate caused chlorosis and necrosis of
leaves for both resistant populations 14 DAT with visual injury ranging from 10 to 100%
depending on the population and rate. Glyphosate at 870 g ae ha-1
did not provide acceptable
control of these Palmer amaranth populations. A shikimate accumulation assay was then
conducted on two populations from 2011 and eight from 2012 that survived applications of
glyphosate. The susceptible population accumulated shikimate when leaf discs were treated with
glyphosate. Leaf discs excised from glyphosate-resistant plants did not accumulate shikimate
64
when treated with 100 µM glyphosate. The assay clearly differentiated between glyphosate-
resistant and –susceptible Palmer amaranth plants, in which susceptible plants accumulated
greater than 15 ng shikimate µL-1
while resistant plants did not accumulate any shikimate. This
is the first documented case of glyphosate-resistant Palmer amaranth in Kansas, which will likely
become more widespread in the future.
65
INTRODUCTION
Palmer amaranth (Amaranthus palmeri S. Wats.) is a fast growing, prolific seed producer,
and has a long germination window, which attributes to its weedy characteristic (Horak and
Loughin 2000; Keeley et al. 1987; Steckel et al. 2004). Glyphosate resistance in weeds has
increased due to the extensive use of glyphosate and the selection pressure this causes. Over the
last decade, glyphosate-resistant (GR) Palmer amaranth has spread throughout the southeast
United States and has begun to expand northward. In 2004, glyphosate-resistant Palmer
amaranth was first confirmed in a 250-ha cotton field in Macon County, Georgia (Culpepper et
al. 2006). Since then, it has become a major concern for conservation farming and for many
farmers throughout the United States.
Glyphosate-resistant Palmer amaranth has spread to 18 states in the United States; as far
west as California and as far north as Michigan (Heap 2013). Palmer amaranth pollen is wind-
mediated and research has shown that long-distance pollen dispersal events occur (Alibert et al.
2005; Hanson et al. 2005; Massinga et al. 2003; Matus-Cadiz et al. 2004; Saeglitz et al. 2000).
In 2006 and 2007, studies were conducted in Georgia to determine if glyphosate resistance can
be transferred via pollen movement from a GR Palmer amaranth source planted in the center of a
30-ha field to glyphosate-susceptible females planted between 1 and 300 m away (Sosnoskie et
al. 2009). Approximately 60% of the offspring derived from susceptible females at the 1-m
distance were resistant to glyphosate; at 300-m, approximately 20% of the offspring were
resistant (Culpepper et al. 2010). This indicated that glyphosate-resistant pollen can travel long
distances, and, breed with other females and thus spread quickly into surrounding fields, making
control difficult.
66
Testing methods for genetically engineered glyphosate-resistant crops are relatively
straight forward because the mutations are known and the level of resistance is extremely high
(Shaner 2010). However, testing for glyphosate resistance in weed biotypes is more difficult.
There are several methods for testing for glyphosate resistance in weedy biotypes. Two common
methods for testing resistance to glyphosate are greenhouse dose-response assays and shikimate
accumulation assays. The greenhouse dose-response assay requires several herbicide treatment
levels and is the most definitive. Treatment levels used for the dose-response will depend on the
level of resistance and the inherent sensitivity of the species to glyphosate (Shaner 2010).
Glyphosate resistance in Palmer amaranth was confirmed using glyphosate rate response
studies. In greenhouse studies, the original Georgia GR biotype had a glyphosate I50 (rate of
glyphosate required to reduce shoot fresh weight by 50%) of 1.2 kg ae ha-1
, approximately eight
times greater than that of the susceptible biotype with an I50 of 0.15 kg ha-1
(Culpepper et al.
2006). In the field, glyphosate at 1.25, 2.5, 5.0, 7.5, and 10 kg ha-1
controlled emerged Palmer
amaranth 8, 17, 46, 70, and 82%, respectively (Culpepper et al. 2006). In this experiment,
glyphosate at 12 times the recommended rate, or 10 kg ha-1
, failed to provide commercially
acceptable control of this weed species (Culpepper et al. 2006). Similar dose-response results
were seen in Palmer amaranth populations in Arkansas (Norsworthy et al. 2008). The resistant
biotype had an LD50 of 2.82 kg ha-1
glyphosate, which was 79- to 115-fold greater than the
susceptible biotypes and 3.4 times the normal-use rate of glyphosate. In Tennessee, GR-Palmer
amaranth was also examined. Field and greenhouse research confirmed that two separate
populations had reduced biomass sensitivity, 1.5x to 5.0x, to glyphosate compared to susceptible
populations, although the level of resistance was higher based on plant mortality response, about
67
10x (Steckel et al. 2008). Although good results are achieved with these assays, they require a lot
of time and can be expensive.
Shikimate accumulation assays are quick alternatives to test for glyphosate resistance in
weed biotypes; however, sophisticated laboratory equipment is needed to conduct these
experiments. An alternative method to determine whether a suspected GR weed has a resistant
EPSPS (5-enolpyruvoylshikimate-3-phosphate synthase) is to monitor the effect of glyphosate on
shikimate levels (Shaner et al. 2005). Glyphosate competes with the substrate
phosphoenolpyruvate for a binding site on the enzyme 5-enol-pyruvylshikimate-3-phosphate
synthase, resulting in uncontrolled flow of carbon and subsequent accumulation of shikimate in
affected sensitive tissues (Amrhein et al. 1980). Accumulation of shikimate in glyphosate-
treated plants indicates the herbicide is affecting the activity of EPSPS (Mueller et al. 2003).
Research has shown that some GR weed biotypes do not accumulate shikimate.
Shikimate accumulation after glyphosate treatment has been used to identify GR-soybean and
GR-cotton with a resistant EPSPS (Pline et al. 2002; Singh and Shaner 1998). Similar methods
are used to detect resistance in weeds. Shikimate did not accumulate in a GR-rigid ryegrass
population treated with glyphosate (Simarmata et al. 2003) or in a GR-horseweed population
treated with a sublethal rate of glyphosate, although the same rate did cause shikimate
accumulation in a susceptible horseweed population (Feng et al. 2004). Culpepper et al. (2006)
detected shikimate in leaf tissue of glyphosate-resistant Palmer amaranth at the lowest
concentration of glyphosate at 8.4 mg L-1
, and shikimate concentration increased linearly as
glyphosate concentration increased. The susceptible population accumulated shikimate across
all glyphosate doses, whereas the resistant population did not accumulate shikimate at the highest
dose tested (Gaines et al. 2011). This population of Palmer amaranth exhibited no changes in

68
glyphosate uptake and translocation in comparison to a susceptible population (Culpepper et al.
2006), and no known target-site mutations associated with glyphosate resistance have been
identified in the EPSPS gene sequence (Gaines et al. 2010). However, DNA blots provided
initial evidence to suggest EPSPS gene amplification was present in the resistant population.
The data presented by Gaines et al. (2010) showed that the recent evolution of glyphosate
resistance in a Palmer amaranth population is due to EPSPS gene amplification and increased
EPSPS expression. The reported data indicate that an EPSPS gene amplification in glyphosate-
resistant Palmer amaranth from Georgia results in high levels of EPSPS expression and that the
mechanism imparts high-level glyphosate resistance.
After screening for glyphosate resistance in five Palmer amaranth populations collected
from central Kansas during the fall of 2011, two populations from Cowley County, KS survived
a 2x rate of glyphosate and one of those was uncontrolled with a 4x rate of glyphosate. The
objectives of this research were to (1) determine if the two Cowley County populations are
resistant to glyphosate, (2) quantify the level of glyphosate resistance compared to a known
susceptible population that had not been previously exposed to glyphosate, and (3) to observe
whether or not shikimate accumulates in plants from the glyphosate-resistant and -susceptible
populations.
MATERIALS AND METHODS
Dose-Response Assay on Two Palmer Amaranth Populations From 2011
Seed from two Palmer amaranth populations from Cowley County, Kansas previously
screened for glyphosate resistance were used to quantify the level of resistance to glyphosate.
Global positioning system (GPS) coordinates at each location and year are reported in Tables 4-1
and 4-2. Palmer amaranth populations collected from the Department of Agronomy Ashland
69
Bottoms Research Farm near Manhattan, KS known to be susceptible to glyphosate were
included for comparison.
In April to May 2012, Palmer amaranth populations were sown in separate flats,
measuring 3.4 L, and filled with 0.7 kg of Miracle-Gro moisture control potting mix1. The plants
were grown under greenhouse conditions of 27/24 ± 2 C day/night temperature with a 16/8-h
day/night period and light intensity of 80 µmol m-2
s-1
photosynthetic photon flux. Individual
seedlings were transplanted into 0.25-L pots when plants were at the cotyledon stage of growth
and watered as needed. The experimental design was a randomized complete block (blocked by
plant size) with treatments replicated six times, and the experiment was repeated. The plants
were treated when they reached 10 to 14 cm in height with glyphosate2. The known susceptible
population was treated with 54, 109, 217, 435, and 870 g ae ha-1
glyphosate whereas the
suspected resistant populations were treated with 435, 870, 1,740, 3,480, and 6,960 g ae ha-1
glyphosate. The lowest rate corresponds to 1/16 and the highest rate corresponds to 8 times a
typical use rate of glyphosate at 870 g ae ha-1
. Ammonium sulfate (AMS) at 1% w/w was added
to all herbicide treatments. Glyphosate was applied with a bench-type sprayer3 equipped with an
80015LP4 spray tip to deliver 187 L ha
-1 at 138 kPa.
Percent control was determined 7 and 14 days after treatment (DAT) on a 0 to 100%
scale where 0 = no effect and 100 = plant death. At the final evaluation, plants were clipped at
soil level and shoot fresh weights were determined. Percent control data were subjected to
analysis of variance using PROC GLIMMIX in SAS 9.25. Nonlinear regression analysis of the
six glyphosate rates were used to determine the rate required to cause 50 and 90% injury (ED50
and ED90) as well as 50 and 90% growth reduction (GR50 and GR90) values of each accession

70
and were determined using R statistical software6. The control or mortality response, y,
herbicide rate, ‘x’ were:
where ‘a’ is the upper limit or 100%, ‘b’ is the slope. Resistance index (RI) was calculated by
dividing ED and GR values of the resistant populations by the ED and GR values of the
susceptible population.
In Vivo Shikimate Accumulation Assay
Palmer amaranth populations that survived glyphosate applications during the initial
screening process (Chapter 3) were subjected to an in vivo shikimate accumulation assay for
identifying glyphosate-resistant plants. Eight individuals from each of the glyphosate-resistant
and –susceptible populations were measured for shikimate accumulation. Leaf discs (4-mm
diam) were excised from leaves with a modified cork borer equipped with a spring-loaded
plunger. One disc was placed in each well of a 96-well microtiter plate7. Control wells
contained 10 mM ammonium phosphate plus 0.1% (v/v) Tween 80 surfactant. The glyphosate
treatment wells contained 100 µl of 10 mM ammonium phosphate (pH 4.4), 0.1% (v/v) Tween
80 surfactant and a single concentration of glyphosate8 at 100 µM. Plates were wrapped in
plastic wrap to minimize evaporation. Plates were then incubated under fluorescent lights (150
mM m-2
s-1
) at 27 C for 16 h. After incubation, plates were placed in a -20 C freezer until the
solution froze and then thawed at room temperature or at 60 C for 30 min. Twenty-five
microliters of 1.25 N HCl were pipetted into each well, giving a final concentration of 0.25 N
HCl per well. The plates were incubated at 60 C for 15 min. At the end of this incubation, the
discs had turned a uniform gray–green color, indicating complete penetration of the tissue by the
𝑦 = a
1 + exp(− (−x − ED50)/b))
71
acid. Shikimate was determined spectrophotometrically following the procedure of Cromartie
and Polge (2000). Aliquots of 25 µl were transferred from each well to another microtiter plate
to which 100 µl of 0.25% (w/v) periodic acid9 /0.25% (w/v) m-periodate
10 was added to each
well. This plate was incubated at 60 C for 30 min and then 100 µl of 0.6 N sodium
hydroxide/0.22 M sodium sulfite was added to each well. The optical density at 380 nm was
measured within 30 min using a microtiter plate spectrophotometer11
. A shikimate standard
curve was developed by adding known amounts of shikimate12
to wells containing leaf discs not
exposed to glyphosate so that shikimate levels could be reported as micrograms shikimate per
milliliter HCl solution. Shikimate accumulation greater than 15 ng µL-1
is susceptible and no
shikimate accumulation are resistant biotypes. This procedure was developed by Shaner et al.
(2005).
RESULTS AND DISCUSSION
Dose-Response
Glyphosate at 54 g ae ha-1
significantly injured the susceptible population and caused
substantial foliar chlorosis and necrosis. Visual control was 89 and 93% 7 and 14 DAT,
respectively (Table 4-3). Control increased with increase in rate and 100% control was achieved
with glyphosate at 218 g ae ha-1
for the susceptible population (Table 4-3). The resistant
populations were not adequately controlled with the typical field use rate of 870 g ha-1
glyphosate . CL11(1) was only controlled 45 and 48% at 7 and 14 DAT with 870 g ha-1
glyphosate and by 14 DAT, many resistant plants resumed growth. Control increased as
glyphosate rates increased but 6,960 g ha-1
(8 times the typical use rate) did not adequately
control all resistant biotypes (Table 4-3). Control was 95 and 98% at 7 and 14 DAT which
indicated that some plants were not fully controlled with 8 times the field use rate of glyphosate.
72
CL11(2) displayed similar resistance characteristics with visual control of 69 and 68% at 7 and
14 DAT with 870 g ha-1
glyphosate, respectively. Resistant biotypes were not completely
controlled with 6,960 g ha-1
7 and 14 DAT (Table 4-3). Visual control with 8 times the use rate
of glyphosate was 92 and 96% indicating some biotypes were severely injured but not
completely dead.
Effective dose (ED) and growth reduction (GR) values were calculated and dose-
response curves were generated along with resistance indices; the higher the resistance index
(ratios of ED50 and GR50 values relative to that of a susceptible population), the greater the level
of resistance. The ED50 values for the susceptible and resistant populations were 28, 906, and
353 g ha-1
glyphosate for the susceptible, CL11(1), and CL11(2) populations, respectively (Table
4-4). CL11(1) and CL11(2) were 33- and 13-fold more resistant than the susceptible population.
Dose-response curves described visual control of both glyphosate-resistant and –susceptible
biotypes (Figure 4-1). Furthermore, the ED90 values for CL11(1) and CL(2) were 5,240 and
2,945 g ha-1
glyphosate whereas it was only 49 g ha-1
for the susceptible population. This
corresponded to 107- and 60-fold more resistant than the susceptible population, indicating a
high level of resistance in these two Palmer amaranth populations (Table 4-4).
It is suspected that 10 g ae ha-1
would cause little to no biomass reduction to the
glyphosate-resistant Palmer amaranth populations so a data point at 10 g ha-1
glyphosate for
population CL11(2) was included to sufficiently fit the data to the log-logistic model (Figure 4-
2). GR50 values were 27, 582, and 145 g ha-1
. GR90 values correspond with ED90 values as they
were 68, 5,209, and 2,312 g ha-1
glyphosate for the susceptible, CL11(1), and CL11(2)
populations (Table 4-5). Both resistant populations were statistically different from the
73
susceptible population and high rates of glyphosate are required to decrease biomass of these two
populations.
These Palmer amaranth populations are highly resistant when compared to the known
susceptible biotype with CL11(1) requiring 107 times the dose of glyphosate to achieve adequate
control of 90%, where CL11(2) required 60 times the dose of glyphosate compared to the
susceptible population. Log-logistic dose-response curves visually explain percent control of
glyphosate-resistant and –susceptible biotypes.
The level of resistance reported here is higher than the six- to eight-fold level of
resistance reported for Palmer amaranth in Georgia (Culpepper et al. 2006). However,
Norsworthy et al. (2008) documented a glyphosate-resistant Palmer amaranth biotype in
Arkansas that had lethal dose (LD95) values of 12,500 g ha-1
, almost 15 times the normal-use rate
of glyphosate. Here, the ED90 values for the resistant populations of 5,240 and 2,945 g ha-1
are 6
and almost 4 times the typical use rate of glyphosate indicating that increasing the glyphosate use
rate may not be a feasible alternative for controlling the resistant biotypes.
In Vivo Shikimate Assay
Glyphosate competes with the substrate phosphoenolpyruvate for a binding site on the
enzyme 5-enol-pyruvylshikimate-3-phosphate synthase (EPSPS, E.C.2.5.1.19), resulting in
uncontrolled flow of carbon and subsequent accumulation of shikimate in affected sensitive
tissues (Amrhein et al. 1980; Culpepper et al. 2006). Accumulation of shikimate in glyphosate-
treated plants indicates the herbicide is affecting the activity of EPSPS (Mueller et al. 2003). In
this experiment, shikimate was detected in leaf tissue of glyphosate-susceptible Palmer amaranth
with 100 µM of glyphosate. Susceptible plants were accumulating greater than 15 ng shikimate

74
µL-1
. However, shikimate was not detected in leaf tissue of glyphosate-resistant Palmer
amaranth biotypes (Figure 4-3).
This assay can be used to detect glyphosate-resistant weed populations when plants are
small and would provide a quick turnaround time for determining if glyphosate resistance is
present. The assay is rapid and has high throughput because shikimate is extracted by freeze-
thawing and shikimate is detected by an improved spectrophotometric method (Shaner et al.
2005). However, this assay requires the use of sophisticated lab facilities and materials which
are not accessable to local growers for use.
Palmer amaranth is already one of the mose troublesome weeds of agronomic crops
across the southern United States (Webster 2005). This research confirms that glyphosate-
resistant Palmer amaranth is now present and is found in several counties throughout central
Kansas. Spread of pollen and the continued reliance on glyphosate will likely result in the
spread of glyphosate-resistant genes and a greater number of resistant populations in the near
future. Resistance to other herbicides, such as dinitroanilines and acetolactate synthase inhibitors
(Heap 2013), limits the options to control glyphosate-resistant Palmer amaranth in Kansas.
Glyphosate alone is no longer a viable option for controlling Palmer amaranth where glypohsate-
resistant populations are present.
75
SOURCES OF MATERIALS
1Miracle-Gro moisture control potting mix, Scotts miracle-gro products INC., 1411
Scottslawn Road, Marysville, OH 43041.
2Roundup WEATHERMAX
®, Monsanto Company, St. Louis, MO 63167.
3Research track sprayer, De Vries Manufacturing, RR 1, Box 184, Hollandale, MN
56045.
4Teejet Spraying Systems, Wheaton, IL 60189-7900.
5SAS version 9.2, SAS Institute Inc., 100 SAS Campus Drive, Cary NC 27513.
6R Development Core Team. 2013. R: A language and environment for statistical
computing. R Foundation for Statistical Computing, Vienna, Austria, 2010.
7Nunc Microwell 96-well plate, VWR International Inc., 17750 East 32nd Place, Suite
10, Aurora, CO 80011.
8Roundup Ultramax
®, isopropylamine salt of glyphosate, Monsanto Co., 800 North
Linbergh Boulevard, St. Louis, MO 63167.
9Periodic acid, Sigma-Aldrich Co. LLC, St. Louis, MO 63178.
http://www.sigmaaldrich.com/customer-service.html.
10
m-periodate, Sigma-Aldrich Co. LLC, St. Louis, MO 63178.
http://www.sigmaaldrich.com/customer-service.html.
11
Epoch Microplate Spectrophotometer BioTek, 100 Tigan Street Winooski, VT 05404.
12
Shikimic acid, Sigma Chemical Co., P.O. Box 14508, St. Louis, MO 63178.
ACKNOWLEDGEMENTS
The authors thank Kansas State University Department of Agronomy for the use of
facilities.
76
LITERATURE CITED
Alibert, B., H. Sellier, and A. Souvre. 2005. A combined method to study gene flow from
cultivated sugar beet to ruderal beets in the glasshouse and open field. European Journal
of Agronomy 23:195-208.
Amrhein, N., B. Deus, P. Gehrke, and H. C. Steinruken. 1980. The site of inhibition of the
shikimate pathway by glyphosate. II. Interference of glyphosate with chorismate
formation in vivo and in vitro. Plant Physiol. 66:830-834.
Cromartie, T. H. and N. D. Polge. 2000. An improved assay for shikimic acid and its use as a
monitor for the activity of sulfosate. Proc. Weed Sci. Soc. Am. 40:291.
Culpepper, A. S., T. L. Grey, W. K. Vencill, J. M. Kichler, T. M Webster, S. M. Brown, A. C.
York, J. W. Davis, and W. W. Hanna. 2006. Glyphosate-resistant Palmer amaranth
(Amaranthus palmeri) confirmed in Georgia. Weed Sci. 54:620-626.
Culpepper, A. S., T. M. Webster, L. M. Sosnoskie, and A. C. York. 2010. Glyphosate-resistant
Palmer amaranth in the United States. In V. K. Nandula (Ed.), Glyphosate resistance in
crops and weeds: history, development, and management pp. 195-212. Hoboken, NJ:
John Wiley & Sons, Inc.
Feng, P.C.C., M. Tran, T. Chiu, R. D. Sammons, G. R. Heck, and C. A. Jacob. 2004.
Investigations into glyphosate-resistant horseweed (Conyza canadensis): retention,
uptake, translocation, and metabolism. Weed Sci. 52:498-505.
Gaines, T. A., W. Zhang, D. Wang, B. Bukun, S. T. Chisholm, D. L. Shaner, S. J. Nissen, W. L.
Patzoldt, P. J. Tranel, A. S. Culpepper, T. L. Grey, T. M. Webster, W. K. Vencill, R. D.
Sammons, J. M. Jiang, C. Preston, J. E. Leach, and P. Westra. 2010. Gene amplification
confers glyphosate resistance in Amaranthus palmeri. Proc. Natl. Acad. Sci. U.S.A.
107:1029–1034.
Gaines, T. A., D. L. Shaner, S. M. Ward, J. E. Leach, C. Preston, and P. Westra. 2011.
Mechanism of resistance of evolved glyphosate-resistant Palmer amaranth (Amaranthus
palmeri). J. Agri. Food Chem. 59:5886-5889.
Hanson, B. D., C. A. Mallory-Smith, W. J. Price, B. Shafii, D. C. Thill, and R. S. Zemetra. 2005.
Interspecific hybridization: potential for movement of herbicide resistance from wheat to
jointed goatgrass (Aegilops cylindrica). Weed Technol. 19:674-682.
Heap, I. 2013. The International Survey of Herbicide Resistant Weeds. Available at
http://www.weedscience.com. Accessed: January 15, 2013.
Horak, M. J. and T. M. Loughin. 2000. Growth analysis of four Amaranthus species. Weed Sci.
48:347-355.
77
Keeley, P. E., C.H. Carter, and R. J. Thullen. 1987. Influence of planting date on growth of
Palmer amaranth (Amaranthus palmeri). Weed Sci. 35:199-204.
Massinga, R. A., R. S. Currie, K. Al-Khatib, P. St. Amand, and J. F. Miller. 2003. Gene flow
from imidazolinone-resistant domesticated sunflower to wild relatives. Weed Sci.
51:854-862.
Matus-Cadiz, M. A., P. Hucl, M. J. Horak, and L. K. Blomquist. 2004. Gene flow in wheat at the
field scale. Crop Sci. 44:718-727.
Mueller, T. C., J. H. Massey, R. M. Hayes, C. L. Main, and C. N. Stewart Jr. 2003. Shikimate
accumulation in both glyphosate-sensitive and glyphosate-resistant horseweed (Conyza
canadensis). J. Agric. Food Chem. 51:680-684.
Norsworthy, J. K., G. M. Griffith, R. C. Scott, K. L. Smith, and L. R. Oliver. 2008. Confirmation
and control of glyphosate-resistant Palmer amaranth (Amaranthus palmeri) in Arkansas.
Weed Technol. 22:108-113.
Pline, W. A., J. W. Wilcut, S. O. Duke, K. L. Edmisten, and R. Wells. 2002. Tolerance and
accumulation of shikimic acid in response to glyphosate applications in glyphosate-
resistant and nonglyphosate-resistant cotton (Gossypium hirsutum L.). J. Agri. Food
Chem. 50:506-512.
Saeglitz, C., M. Pohl, and D. Bartsch. 2000. Monitoring gene glow from transgenic sugar beet
using cytoplasmic male-sterile bait plants. Molecular Ecol. 9:2035-2040.
Shaner, D. L., T. Nadler-Hasser, W. B. Henry, and C. H. Koger. 2005. A rapid in vivo shikimate
accumulation assay with excised leaf discs. Weed Sci. 53:769-774.
Shaner, D. L. 2010. Testing methods for glyphosate resistance. In V. K. Nandula (Ed.),
Glyphosate resistance in crops and weeds: history, development, and management pp.
93-118. Hoboken, NJ: John Wiley & Sons, Inc.
Simarmata, M., J. E. Kaufmann, and D. Penner. 2003. Potential basis of glyphosate resistance in
California rigid ryegrass (Lolium ridigum). Weed Sci. 51:678-682.
Singh, B. J. and D. L. Shaner. 1998. Rapid determination of glyphosate injury to plants and
identification of glyphosate-resistant plants. Weed Technol. 12:527-530.
Sosnoskie, L. M., T. M. Webster, A. MacRae, T. L. Grey and A. S. Culpepper. 2009. Movement
of glyphosate-resistant Palmer amaranth pollen in-field. Proc. Weed Science Society of
America 49:63.
Steckel, L. E., C. L. Sprague, E. W. Stoller, and L. M. Wax. 2004. Temperature effects on
germination of nine Amaranthus species. Weed Sci. 52:217-221.

78
Steckel, L. E., C. L. Main, A. T. Ellis, and T. C. Mueller. 2008. Palmer amaranth (Amaranthus
palmeri) in Tennessee has low level glyphosate resistance. Weed Technol. 22:119-123.
Webster, T. M. 2005. Weed survey-southern states: broadleaf crops subsection. Proc. South.
Weed Sci. Soc. 58:291-304.
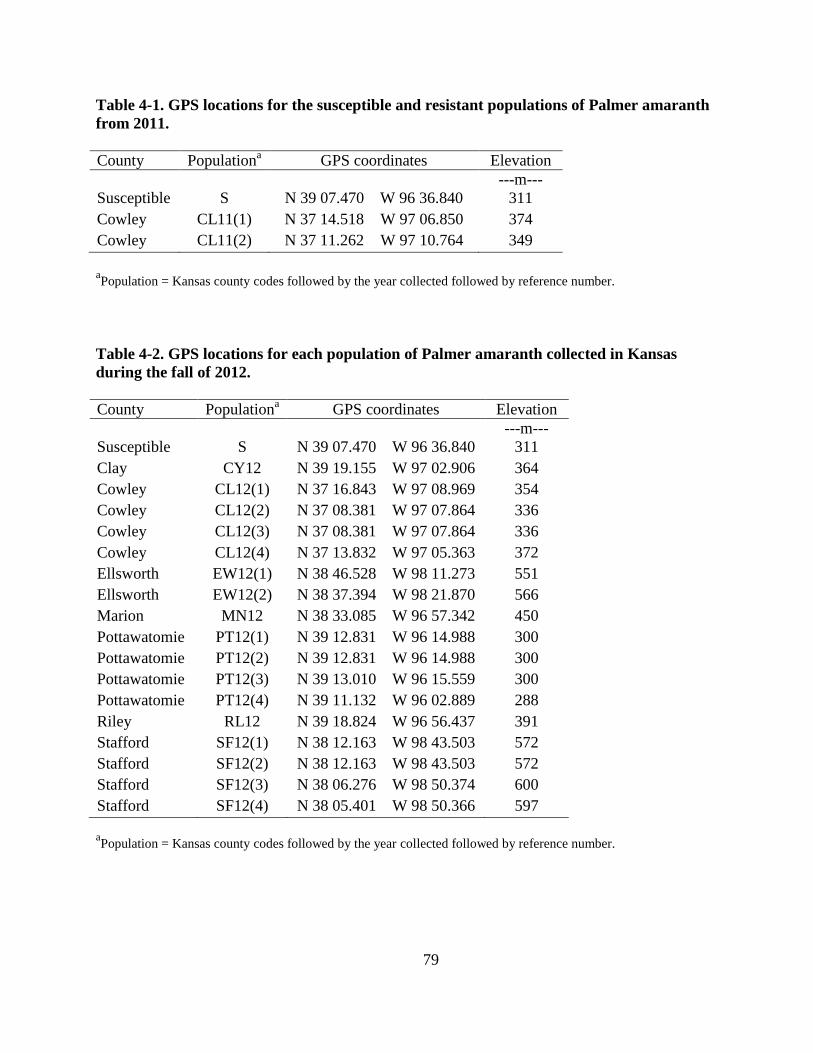
79
Table 4-1. GPS locations for the susceptible and resistant populations of Palmer amaranth
from 2011.
County Populationa GPS coordinates Elevation
---m---
Susceptible S N 39 07.470 W 96 36.840 311
Cowley CL11(1) N 37 14.518 W 97 06.850 374
Cowley CL11(2) N 37 11.262 W 97 10.764 349
aPopulation = Kansas county codes followed by the year collected followed by reference number.
Table 4-2. GPS locations for each population of Palmer amaranth collected in Kansas
during the fall of 2012.
County Populationa GPS coordinates Elevation
---m---
Susceptible S N 39 07.470 W 96 36.840 311
Clay CY12 N 39 19.155 W 97 02.906 364
Cowley CL12(1) N 37 16.843 W 97 08.969 354
Cowley CL12(2) N 37 08.381 W 97 07.864 336
Cowley CL12(3) N 37 08.381 W 97 07.864 336
Cowley CL12(4) N 37 13.832 W 97 05.363 372
Ellsworth EW12(1) N 38 46.528 W 98 11.273 551
Ellsworth EW12(2) N 38 37.394 W 98 21.870 566
Marion MN12 N 38 33.085 W 96 57.342 450
Pottawatomie PT12(1) N 39 12.831 W 96 14.988 300
Pottawatomie PT12(2) N 39 12.831 W 96 14.988 300
Pottawatomie PT12(3) N 39 13.010 W 96 15.559 300
Pottawatomie PT12(4) N 39 11.132 W 96 02.889 288
Riley RL12 N 39 18.824 W 96 56.437 391
Stafford SF12(1) N 38 12.163 W 98 43.503 572
Stafford SF12(2) N 38 12.163 W 98 43.503 572
Stafford SF12(3) N 38 06.276 W 98 50.374 600
Stafford SF12(4) N 38 05.401 W 98 50.366 597
aPopulation = Kansas county codes followed by the year collected followed by reference number.

80
Table 4-3. Visible control 7 and 14 days after treatment (DAT) with glyphosate on 3 Palmer amaranth populations in Kansas
in 2011.
Glyphosate Susceptible CL11(1) CL11(2)
Ratea 7 DAT 14 DAT 7 DAT 14 DAT 7 DAT 14 DAT
----------------------------------------(% Control)-----------------------------------
0 0 0 0 0 0 0
0.0625 89 93 - - - -
0.125 89 99 - - - -
0.25 98 100 - - - -
0.5 97 98 40 35 55 60
1 100 100 45 48 69 68
2 - - 70 76 93 93
4 - - 99 98 99 99
8 - - 95 98 92 96
LSD (0.05) 12 7 21 20 20 19
aRate = rates are the proportion of a typical field use rate of glyphosate in g ha
-1; all treatments included AMS at 1% w/w.
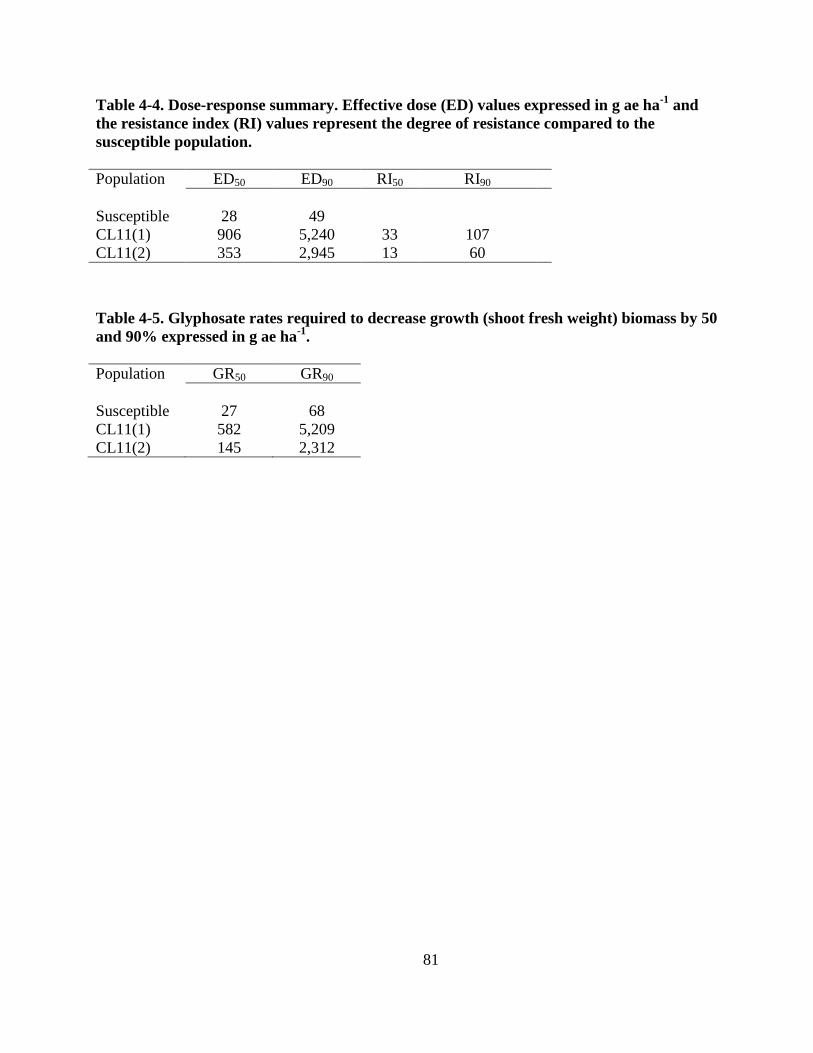
81
Table 4-4. Dose-response summary. Effective dose (ED) values expressed in g ae ha-1
and
the resistance index (RI) values represent the degree of resistance compared to the
susceptible population.
Population ED50 ED90 RI50 RI90
Susceptible 28 49
CL11(1) 906 5,240 33 107
CL11(2) 353 2,945 13 60
Table 4-5. Glyphosate rates required to decrease growth (shoot fresh weight) biomass by 50
and 90% expressed in g ae ha-1
.
Population GR50 GR90
Susceptible 27 68
CL11(1) 582 5,209
CL11(2) 145 2,312
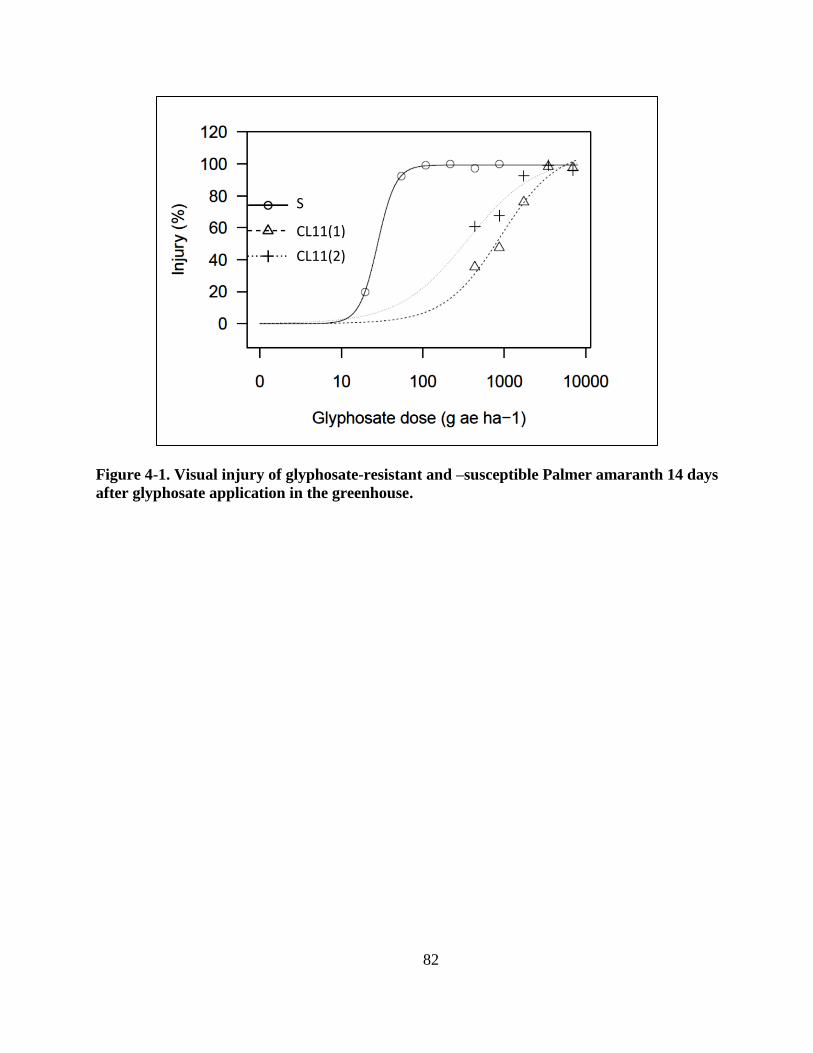
82
Figure 4-1. Visual injury of glyphosate-resistant and –susceptible Palmer amaranth 14 days
after glyphosate application in the greenhouse.
S
CL11(1)
CL11(2)
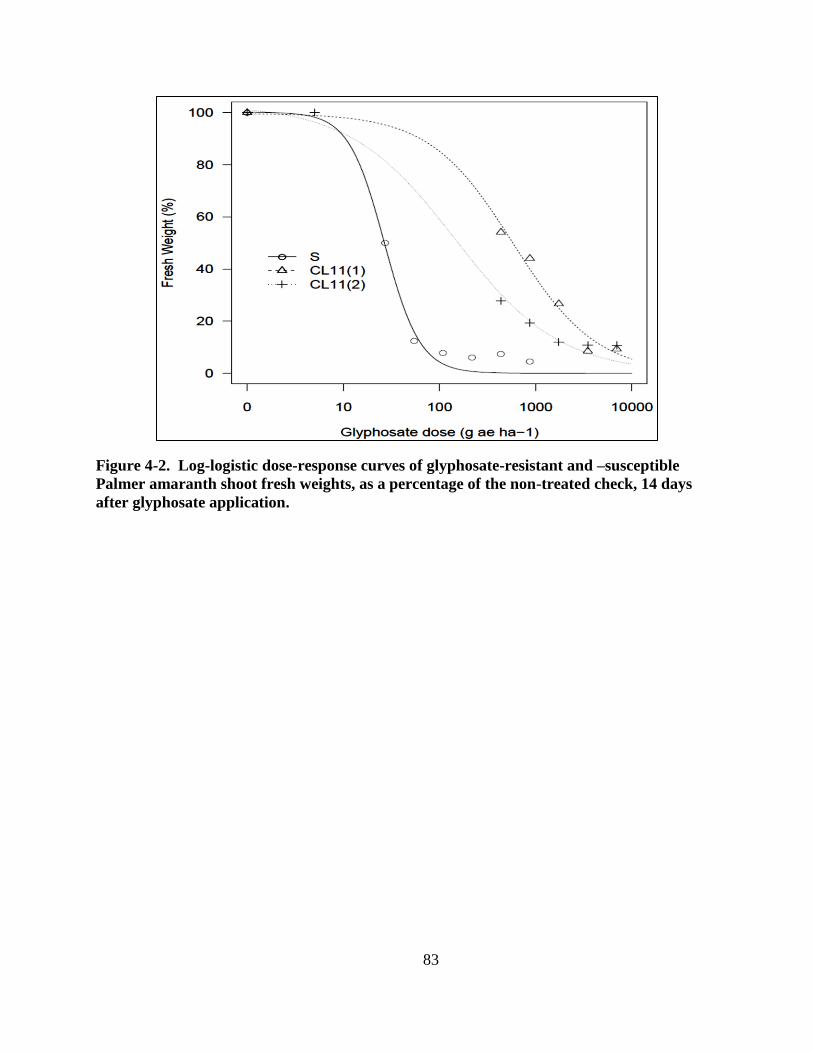
83
Figure 4-2. Log-logistic dose-response curves of glyphosate-resistant and –susceptible
Palmer amaranth shoot fresh weights, as a percentage of the non-treated check, 14 days
after glyphosate application.
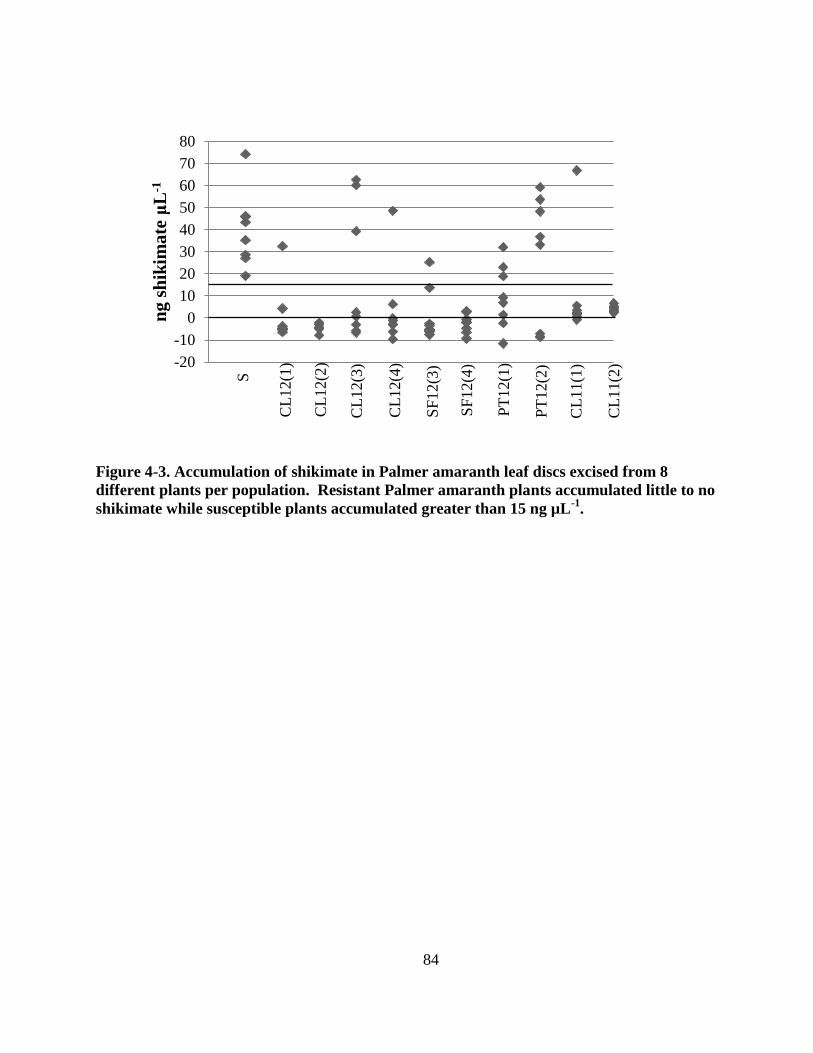
84
Figure 4-3. Accumulation of shikimate in Palmer amaranth leaf discs excised from 8
different plants per population. Resistant Palmer amaranth plants accumulated little to no
shikimate while susceptible plants accumulated greater than 15 ng µL-1
.
-20
-10
0
10
20
30
40
50
60
70
80
ng
sh
ikim
ate
μL
-1
S
CL
12(1
)
CL
12(2
)
CL
12(3
)
CL
12(4
)
SF
12(3
)
SF
12(4
)
PT
12(1
)
PT
12(2
)
CL
11(1
)
CL
11(2
)
Recommended