Ovintiv Inc.
Interim Supplemental Information
(unaudited)
For the period ended September 30, 2021
U.S. Dollar / U.S. Protocol

Third quarter report
for the period ended September 30, 2021
Ovintiv Inc. 1 Supplemental Information (prepared in US$)
Supplemental Financial Information (unaudited)
Financial Results 2021 2020
(US$ millions, unless otherwise specified)
Year-to-
Date Q3 Q2 Q1 Year Q4
Q3 Year-
to-date Q3 Q2 Q1
Net Earnings (Loss) 32 (72 ) (205 ) 309 (6,097 ) (614 ) (5,483 ) (1,521 ) (4,383 ) 421
Per share - basic (1) 0.12 (0.28 ) (0.79 ) 1.19 (23.47 ) (2.36 ) (21.10 ) (5.85 ) (16.87 ) 1.62
Per share - diluted (1) 0.12 (0.28 ) (0.79 ) 1.16 (23.47 ) (2.36 ) (21.10 ) (5.85 ) (16.87 ) 1.62
Non-GAAP Operating Earnings (Loss) (2) 974 391 290 293 91 183 (92 ) (8 ) (111 ) 27
Per share - basic (1) 3.74 1.50 1.11 1.13 0.35 0.70 (0.35 ) (0.03 ) (0.43 ) 0.10
Per share - diluted (1) 3.67 1.50 1.11 1.10 0.35 0.70 (0.35 ) (0.03 ) (0.43 ) 0.10
Non-GAAP Cash Flow (3) 2,468 845 733 890 1,929 692 1,237 398 304 535
Per share - basic (1) 9.47 3.24 2.81 3.42 7.42 2.66 4.76 1.53 1.17 2.06
Per share - diluted (1) 9.30 3.24 2.81 3.35 7.42 2.66 4.76 1.53 1.17 2.06
Foreign Exchange Rates (C$ per US$1)
Average 1.251 1.260 1.228 1.266 1.342 1.303 1.354 1.332 1.385 1.345
Period end 1.274 1.274 1.239 1.258 1.273 1.273 1.334 1.334 1.363 1.419
Non-GAAP Operating Earnings Summary
Net Earnings (Loss) Before Income Tax (143 ) (71 ) (205 ) 133 (5,730 ) (642 ) (5,088 ) (1,560 ) (4,089 ) 561
Before-tax (Addition) Deduction:
Unrealized gain (loss) on risk management (1,426 ) (579 ) (576 ) (271 ) (204 ) (186 ) (18 ) (243 ) (679 ) 904
Impairments - - - - (5,580 ) (717 ) (4,863 ) (1,336 ) (3,250 ) (277 )
Restructuring charges (13 ) (2 ) (5 ) (6 ) (90 ) (2 ) (88 ) (7 ) (81 ) -
Non-operating foreign exchange gain (loss) (17 ) (11 ) (4 ) (2 ) (16 ) 17 (33 ) 21 50 (104 )
Gain (loss) on divestitures - - - - - - - - - -
Gain on debt retirement - - - - 30 2 28 6 11 11
Adjusted Net Earnings (Loss) Before Income Tax 1,313 521 380 412 130 244 (114 ) (1 ) (140 ) 27
Income tax expense (recovery) (4) 339 130 90 119 39 61 (22 ) 7 (29 ) -
Non-GAAP Operating Earnings (Loss) (2) 974 391 290 293 91 183 (92 ) (8 ) (111 ) 27
Non-GAAP Cash Flow Summary
Cash From (Used in) Operating Activities 2,389 812 750 827 1,895 719 1,176 493 117 566
(Add back) Deduct:
Net change in other assets and liabilities (21 ) (10 ) (5 ) (6 ) (173 ) (6 ) (167 ) (47 ) (68 ) (52 )
Net change in non-cash working capital (58 ) (23 ) 22 (57 ) 139 33 106 142 (119 ) 83
Current tax on sale of assets - - - - - - - - - -
Non-GAAP Cash Flow (3) 2,468 845 733 890 1,929 692 1,237 398 304 535
Non-GAAP Cash Flow Margin ($/BOE) (5) 16.66 17.17 14.51 18.39 9.69 13.50 8.37 8.49 6.23 10.29
Non-GAAP Cash Flow (3) 2,468 845 733 890 1,929 692 1,237 398 304 535
(Add back) Deduct:
Restructuring charges (13 ) (2 ) (5 ) (6 ) (90 ) (2 ) (88 ) (7 ) (81 ) -
Non-GAAP Cash Flow, Excluding Restructuring Charges 2,481 847 738 896 2,019 694 1,325 405 385 535
(1) Net Earnings (Loss), Non-GAAP Operating Earnings (Loss) and Non-GAAP Cash Flow per share are calculated using the weighted average number of shares of common stock outstanding as follows:
2021 2020
(millions)
Year-to-
Date Q3 Q2 Q1
Year Q4
Q3 Year-
to-date Q3 Q2 Q1
Weighted Average Shares of Common Stock Outstanding
Basic 260.7 261.1 261.1 260.1 259.8 259.8 259.8 259.8 259.8 259.8
Diluted 265.3 261.1 261.1 266.0 259.8 259.8 259.8 259.8 259.8 259.8
(2) Non-GAAP Operating Earnings (Loss) is a non-GAAP measure defined as net earnings (loss) excluding non-recurring or non-cash items that Management believes reduces the comparability of
the Company's financial performance between periods. These items may include, but are not limited to, unrealized gains/losses on risk management, impairments, restructuring charges, non-
operating foreign exchange gains/losses, gains/losses on divestitures and gains on debt retirement. Income taxes includes adjustments to normalize the effect of income taxes calculated using the
estimated annual effective income tax rate. In addition, any valuation allowances are excluded in the calculation of income taxes.
(3) Non-GAAP Cash Flow is a non-GAAP measure defined as cash from (used in) operating activities excluding net change in other assets and liabilities, net change in non-cash working capital and
current tax on sale of assets.
(4) Calculated using the applicable U.S. federal and state statutory income tax rate of 24.0 percent and the applicable Canadian federal and provincial statutory income tax rate of 23.9 percent
(2020 - 24.0 percent and 24.7 percent, respectively).
(5) Non-GAAP Cash Flow Margin is a non-GAAP measure calculated as Non-GAAP Cash Flow per BOE of production.
Financial Metrics 2021 2020
Year-to-
Date Year
Debt to Adjusted Capitalization (1) 29% 37%
Net Debt to Adjusted EBITDA (1) 1.5x 3.1x
(1) These financial metrics are non-GAAP measures monitored by Management as indicators of the Company's overall financial strength. These non-GAAP measures are defined and calculated in
the Non-GAAP Definitions and Reconciliations document located on the Company's website.

Third quarter report
for the period ended September 30, 2021
Ovintiv Inc. 2 Supplemental Information (prepared in US$)
Supplemental Operating Information (unaudited)
Production Volumes by Product
2021 2020
(average)
% of
Oil & NGLs Year-to-
Date Q3 Q2 Q1 Year Q4
Q3 Year-
to-date Q3 Q2 Q1
Oil (Mbbls/d) 52 143.9 136.8 148.5 146.5 151.5 158.0 149.3 138.9 146.5 162.5
NGLs - Plant Condensate (Mbbls/d) 18 51.9 51.9 52.3 51.4 52.1 56.8 50.5 47.2 51.8 52.7
Oil & Plant Condensate (Mbbls/d) 70 195.8 188.7 200.8 197.9 203.6 214.8 199.8 186.1 198.3 215.2
Butane (Mbbls/d) 8 20.6 20.7 20.9 20.1 20.4 20.6 20.3 19.7 19.7 21.6
Propane (Mbbls/d) 11 31.5 31.8 32.5 30.1 32.3 32.1 32.4 31.2 30.8 35.2
Ethane (Mbbls/d) 11 30.8 32.4 32.5 27.5 32.6 29.9 33.5 32.9 29.6 37.8
NGLs - Other (Mbbls/d) 30 82.9 84.9 85.9 77.7 85.3 82.6 86.2 83.8 80.1 94.6
Oil & NGLs (Mbbls/d) 100 278.7 273.6 286.7 275.6 288.9 297.4 286.0 269.9 278.4 309.8
Natural Gas (MMcf/d) 1,583 1,566 1,607 1,576 1,529 1,559 1,520 1,442 1,550 1,569
Total (MBOE/d) 542.5 534.7 554.6 538.3 543.8 557.2 539.3 510.2 536.6 571.3
Production Volumes by Segment
2021 2020
(average)
Year-to-
Date Q3 Q2 Q1 Year Q4
Q3 Year-
to-date Q3 Q2 Q1
Oil (Mbbls/d)
USA Operations 143.5 136.7 148.2 145.6 150.9 157.3 148.7 138.5 146.0 161.7
Canadian Operations 0.4 0.1 0.3 0.9 0.6 0.7 0.6 0.4 0.5 0.8
143.9 136.8 148.5 146.5 151.5 158.0 149.3 138.9 146.5 162.5
NGLs - Plant Condensate (Mbbls/d)
USA Operations 10.5 11.3 10.5 9.7 11.1 10.9 11.1 11.4 11.0 11.0
Canadian Operations 41.4 40.6 41.8 41.7 41.0 45.9 39.4 35.8 40.8 41.7
51.9 51.9 52.3 51.4 52.1 56.8 50.5 47.2 51.8 52.7
Oil & Plant Condensate (Mbbls/d)
USA Operations 154.0 148.0 158.7 155.3 162.0 168.2 159.8 149.9 157.0 172.7
Canadian Operations 41.8 40.7 42.1 42.6 41.6 46.6 40.0 36.2 41.3 42.5
195.8 188.7 200.8 197.9 203.6 214.8 199.8 186.1 198.3 215.2
NGLs - Other (Mbbls/d)
USA Operations 66.6 69.4 69.2 61.0 70.3 66.5 71.7 70.2 67.2 77.5
Canadian Operations 16.3 15.5 16.7 16.7 15.0 16.1 14.5 13.6 12.9 17.1
82.9 84.9 85.9 77.7 85.3 82.6 86.2 83.8 80.1 94.6
NGLs - Total (Mbbls/d)
USA Operations 77.1 80.7 79.7 70.7 81.4 77.4 82.8 81.6 78.2 88.5
Canadian Operations 57.7 56.1 58.5 58.4 56.0 62.0 53.9 49.4 53.7 58.8
134.8 136.8 138.2 129.1 137.4 139.4 136.7 131.0 131.9 147.3
Oil & NGLs (Mbbls/d)
USA Operations 220.6 217.4 227.9 216.3 232.3 234.7 231.5 220.1 224.2 250.2
Canadian Operations 58.1 56.2 58.8 59.3 56.6 62.7 54.5 49.8 54.2 59.6
278.7 273.6 286.7 275.6 288.9 297.4 286.0 269.9 278.4 309.8
Natural Gas (MMcf/d)
USA Operations 484 495 497 459 529 508 537 507 536 568
Canadian Operations 1,099 1,071 1,110 1,117 1,000 1,051 983 935 1,014 1,001
1,583 1,566 1,607 1,576 1,529 1,559 1,520 1,442 1,550 1,569
Total (MBOE/d)
USA Operations 301.2 300.0 310.8 292.8 320.5 319.3 320.9 304.6 313.4 344.8
Canadian Operations 241.3 234.7 243.8 245.5 223.3 237.9 218.4 205.6 223.2 226.5
542.5 534.7 554.6 538.3 543.8 557.2 539.3 510.2 536.6 571.3
Third quarter report
for the period ended September 30, 2021
Ovintiv Inc. 3 Supplemental Information (prepared in US$)
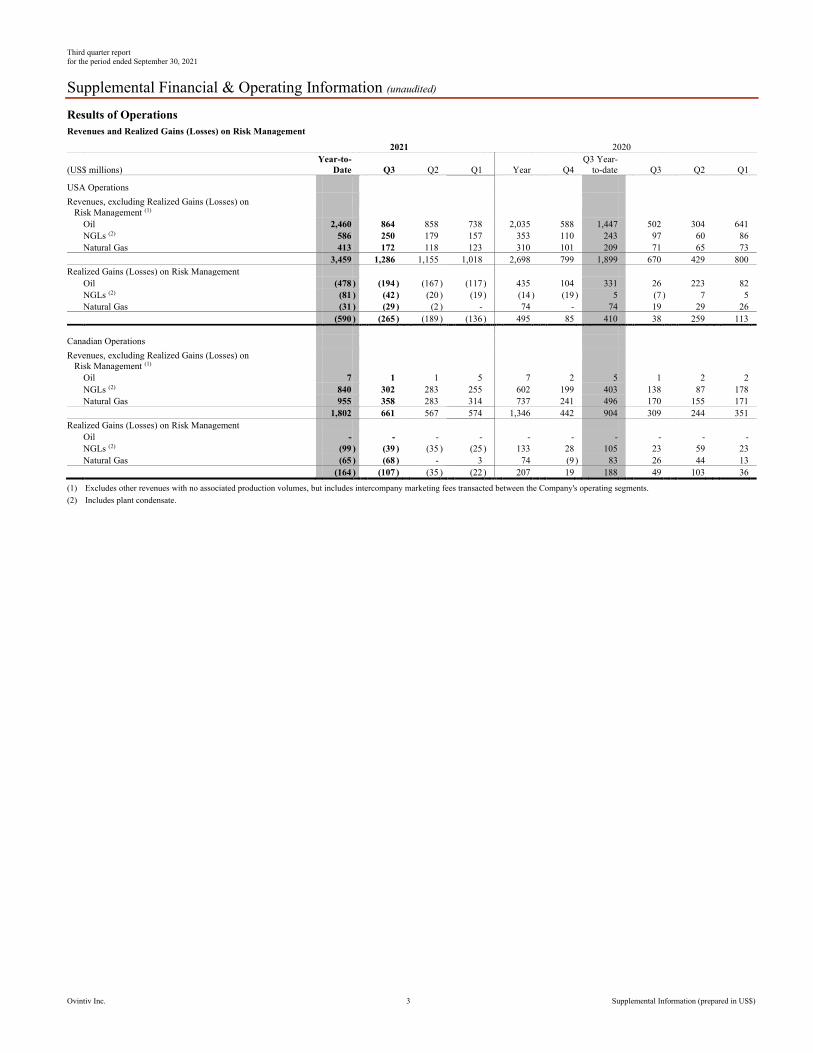
Supplemental Financial & Operating Information (unaudited)
Results of Operations
Revenues and Realized Gains (Losses) on Risk Management
2021 2020
(US$ millions)
Year-to-
Date Q3 Q2 Q1 Year Q4
Q3 Year-
to-date Q3 Q2 Q1
USA Operations
Revenues, excluding Realized Gains (Losses) on Risk Management (1)
Oil 2,460 864 858 738 2,035 588 1,447 502 304 641
NGLs (2) 586 250 179 157 353 110 243 97 60 86
Natural Gas 413 172 118 123 310 101 209 71 65 73
3,459 1,286 1,155 1,018 2,698 799 1,899 670 429 800
Realized Gains (Losses) on Risk Management
Oil (478 ) (194 ) (167 ) (117 ) 435 104 331 26 223 82
NGLs (2) (81 ) (42 ) (20 ) (19 ) (14 ) (19 ) 5 (7 ) 7 5
Natural Gas (31 ) (29 ) (2 ) - 74 - 74 19 29 26
(590 ) (265 ) (189 ) (136 ) 495 85 410 38 259 113
Canadian Operations
Revenues, excluding Realized Gains (Losses) on Risk Management (1)
Oil 7 1 1 5 7 2 5 1 2 2
NGLs (2) 840 302 283 255 602 199 403 138 87 178
Natural Gas 955 358 283 314 737 241 496 170 155 171
1,802 661 567 574 1,346 442 904 309 244 351
Realized Gains (Losses) on Risk Management
Oil - - - - - - - - - -
NGLs (2) (99 ) (39 ) (35 ) (25 ) 133 28 105 23 59 23
Natural Gas (65 ) (68 ) - 3 74 (9 ) 83 26 44 13
(164 ) (107 ) (35 ) (22 ) 207 19 188 49 103 36
(1) Excludes other revenues with no associated production volumes, but includes intercompany marketing fees transacted between the Company's operating segments.
(2) Includes plant condensate.

Third quarter report
for the period ended September 30, 2021
Ovintiv Inc. 4 Supplemental Information (prepared in US$)
Supplemental Financial & Operating Information (unaudited)
Results of Operations (continued)
Per-Unit Results, Excluding the Impact of Realized Gains (Losses) on Risk Management (1)
2021 2020
(US$/BOE)
Year-to-
Date Q3 Q2 Q1 Year Q4
Q3 Year-
to-date Q3 Q2 Q1
Total USA Operations Netback
Price 42.08 46.59 40.87 38.66 23.00 27.20 21.60 23.91 15.09 25.46
Production, mineral and other taxes 2.42 2.71 2.43 2.09 1.34 1.44 1.31 1.54 0.82 1.55
Transportation and processing 4.40 4.43 4.44 4.31 3.86 3.68 3.92 3.85 4.07 3.84
Operating 4.47 4.38 4.16 4.89 4.12 4.08 4.14 3.73 4.22 4.42
Netback 30.79 35.07 29.84 27.37 13.68 18.00 12.23 14.79 5.98 15.65
Total Canadian Operations Netback
Price 27.38 30.61 25.67 25.92 16.42 20.18 15.05 16.22 11.99 16.98
Production, mineral and other taxes 0.17 0.13 0.17 0.21 0.18 0.20 0.18 0.18 0.17 0.19
Transportation and processing 10.68 10.68 11.24 10.12 10.12 9.81 10.24 10.71 9.75 10.29
Operating 1.17 1.20 1.11 1.23 1.21 1.14 1.23 1.22 1.20 1.26
Netback 15.36 18.60 13.15 14.36 4.91 9.03 3.40 4.11 0.87 5.24
Total Operations Netback
Price 35.54 39.57 34.20 32.85 20.30 24.20 18.94 20.81 13.80 22.10
Production, mineral and other taxes 1.42 1.57 1.44 1.23 0.87 0.91 0.85 0.99 0.55 1.01
Transportation and processing 7.19 7.17 7.42 6.96 6.44 6.30 6.48 6.62 6.44 6.40
Operating 3.00 2.98 2.82 3.22 2.92 2.83 2.96 2.72 2.97 3.17
Netback 23.93 27.85 22.52 21.44 10.07 14.16 8.65 10.48 3.84 11.52
(1) Netback is a common metric used in the oil and gas industry to measure operating performance on a per-unit basis and is considered a non-GAAP measure. The netbacks disclosed above do not
meet the requirements outlined in National Instrument 51-101 and have been calculated on a BOE basis using upstream product revenues, excluding the impact of realized gains and losses on risk
management, less costs associated with delivering the product to market, including production, mineral and other taxes, transportation and processing expense and operating expense. For additional
information regarding non-GAAP measures, including Netback reconciliations, see the Company’s website.
Other Per-unit Results
2021 2020
(US$/BOE)
Year-to-
Date Q3 Q2 Q1 Year Q4
Q3 Year-
to-date Q3 Q2 Q1
Upstream Operating Expense 3.00 2.98 2.82 3.22 2.92 2.83 2.96 2.72 2.97 3.17
Upstream Operating Expense, Excluding Long-Term Incentive Costs 2.86 2.85 2.68 3.07 2.88 2.63 2.98 2.69 2.86 3.34
Administrative Expense 2.34 2.06 2.44 2.52 1.98 1.90 2.01 1.68 3.38 1.02
Administrative Expense, Excluding Long-Term Incentive Costs,
Restructuring and Legal Costs, and Current Expected Credit
Losses 1.50 1.44 1.36 1.67 1.41 1.29 1.46 1.55 1.38 1.42
Total Costs (1) 12.97 13.03 12.90 12.93 11.60 11.13 11.77 11.85 11.23 12.17
(1) Total Costs is a non-GAAP measure which includes the summation of production, mineral and other taxes, upstream transportation and processing expense, upstream operating expense and
administrative expense, excluding the impact of long-term incentive costs, restructuring and legal costs, and current expected credit losses. It is calculated as total operating expenses excluding
non-upstream operating costs and non-cash items which include operating expenses from the Market Optimization and Corporate and Other segments, depreciation, depletion and amortization,
impairments, accretion of asset retirement obligation, long-term incentive costs, restructuring and legal costs, and current expected credit losses. When presented on a per BOE basis, Total Costs
is divided by production volumes.

Third quarter report
for the period ended September 30, 2021
Ovintiv Inc. 5 Supplemental Information (prepared in US$)
Supplemental Oil and Gas Operating Statistics (unaudited)
Operating Statistics
Per-Unit Prices, Excluding the Impact of Realized Gains (Losses) on Risk Management
2021 2020
(US$)
Year-to-
Date Q3 Q2 Q1
Year Q4
Q3 Year-
to-date Q3 Q2 Q1
Oil Price ($/bbl)
USA Operations 62.82 68.69 63.65 56.32 36.84 40.59 35.51 39.41 22.95 43.49
Canadian Operations 55.51 64.95 60.68 52.84 32.58 39.52 29.79 34.38 11.90 38.95
Total Operations 62.80 68.69 63.65 56.30 36.83 40.59 35.49 39.40 22.91 43.47
NGLs - Plant Condensate Price ($/bbl)
USA Operations 56.84 62.84 55.54 51.14 26.68 31.59 25.05 27.98 12.47 34.54
Canadian Operations 63.62 68.78 64.85 57.24 35.87 41.45 33.69 36.71 20.48 43.99
Total Operations 62.25 67.49 62.98 56.09 33.92 39.55 31.79 34.60 18.79 42.02
Oil & Plant Condensate Price ($/bbl)
USA Operations 62.41 68.24 63.12 56.00 36.15 40.01 34.79 38.54 22.22 42.92
Canadian Operations 63.54 68.77 64.82 57.15 35.82 41.43 33.64 36.69 20.38 43.89
Total Operations 62.65 68.36 63.47 56.24 36.08 40.31 34.56 38.18 21.83 43.12
NGLs - Other Price ($/bbl)
USA Operations 23.29 28.77 20.10 20.56 9.52 12.73 8.52 10.47 7.83 7.33
Canadian Operations 27.38 31.73 23.88 26.79 11.53 16.48 9.68 13.16 9.56 6.97
Total Operations 24.09 29.31 20.83 21.90 9.87 13.47 8.72 10.91 8.11 7.27
NGLs - Total Price ($/bbl)
USA Operations 27.85 33.52 24.76 24.76 11.85 15.40 10.74 12.92 8.48 10.70
Canadian Operations 53.39 58.56 53.16 48.55 29.37 34.94 27.22 30.24 17.85 33.22
Total Operations 38.78 43.78 36.79 35.51 18.99 24.09 17.25 19.45 12.30 19.69
Oil & NGLs Price ($/bbl)
USA Operations 50.59 55.63 50.05 45.99 28.09 32.28 26.66 29.59 17.91 31.90
Canadian Operations 53.41 58.57 53.19 48.62 29.40 34.99 27.24 30.27 17.79 33.29
Total Operations 51.18 56.23 50.70 46.56 28.34 32.85 26.77 29.72 17.88 32.16
Natural Gas Price ($/Mcf)
USA Operations 3.13 3.80 2.60 2.98 1.60 2.18 1.42 1.52 1.33 1.41
Canadian Operations 3.18 3.63 2.81 3.12 2.01 2.48 1.83 1.96 1.69 1.86
Total Operations 3.17 3.69 2.75 3.08 1.87 2.39 1.69 1.81 1.57 1.70
Total Price ($/BOE)
USA Operations 42.08 46.59 40.87 38.66 23.00 27.20 21.60 23.91 15.09 25.46
Canadian Operations 27.38 30.61 25.67 25.92 16.42 20.18 15.05 16.22 11.99 16.98
Total Operations 35.54 39.57 34.20 32.85 20.30 24.20 18.94 20.81 13.80 22.10

Third quarter report
for the period ended September 30, 2021
Ovintiv Inc. 6 Supplemental Information (prepared in US$)
Supplemental Oil and Gas Operating Statistics (unaudited)
Operating Statistics (continued)
Per-unit Impact of Realized Gains (Losses) on Risk Management
2021 2020
(US$)
Year-to-
Date Q3 Q2 Q1
Year Q4
Q3 Year-
to-date Q3 Q2 Q1
Oil ($/bbl)
USA Operations (12.20 ) (15.39 ) (12.41 ) (8.92 ) 7.88 7.19 8.12 2.00 16.85 5.54
Canadian Operations - - - - - - - - - -
Total Operations (12.16 ) (15.38 ) (12.38 ) (8.86 ) 7.85 7.16 8.09 1.99 16.79 5.52
NGLs - Plant Condensate ($/bbl)
USA Operations - - - - - - - - - -
Canadian Operations (8.79 ) (10.40 ) (9.25 ) (6.71 ) 8.85 6.51 9.77 7.10 15.95 6.04
Total Operations (7.01 ) (8.15 ) (7.39 ) (5.44 ) 6.97 5.26 7.62 5.39 12.58 4.78
Oil & Plant Condensate ($/bbl)
USA Operations (11.37 ) (14.22 ) (11.59 ) (8.36 ) 7.34 6.72 7.56 1.85 15.67 5.19
Canadian Operations (8.69 ) (10.37 ) (9.19 ) (6.56 ) 8.73 6.42 9.63 7.02 15.76 5.93
Total Operations (10.80 ) (13.39 ) (11.08 ) (7.97 ) 7.62 6.65 7.97 2.86 15.69 5.34
NGLs - Other ($/bbl)
USA Operations (4.46 ) (6.66 ) (3.06 ) (3.51 ) (0.56 ) (3.14 ) 0.25 (1.09 ) 1.08 0.76
Canadian Operations - - - - (0.02 ) - (0.02 ) - (0.08 ) -
Total Operations (3.59 ) (5.45 ) (2.46 ) (2.76 ) (0.46 ) (2.53 ) 0.20 (0.92 ) 0.90 0.62
NGLs - Total ($/bbl)
USA Operations (3.85 ) (5.73 ) (2.66 ) (3.03 ) (0.48 ) (2.70 ) 0.22 (0.94 ) 0.93 0.67
Canadian Operations (6.31 ) (7.54 ) (6.61 ) (4.79 ) 6.48 4.81 7.13 5.15 12.09 4.28
Total Operations (4.90 ) (6.47 ) (4.33 ) (3.82 ) 2.36 0.64 2.95 1.36 5.48 2.11
Oil & NGLs ($/bbl)
USA Operations (9.28 ) (11.81 ) (9.00 ) (6.99 ) 4.95 3.93 5.30 0.91 11.30 3.82
Canadian Operations (6.26 ) (7.52 ) (6.58 ) (4.72 ) 6.42 4.76 7.06 5.11 11.98 4.22
Total Operations (8.65 ) (10.93 ) (8.50 ) (6.50 ) 5.24 4.10 5.63 1.69 11.43 3.90
Natural Gas ($/Mcf)
USA Operations (0.24 ) (0.65 ) (0.03 ) (0.01 ) 0.38 - 0.50 0.41 0.60 0.50
Canadian Operations (0.22 ) (0.69 ) - 0.03 0.20 (0.09 ) 0.31 0.30 0.47 0.15
Total Operations (0.22 ) (0.67 ) (0.01 ) 0.02 0.26 (0.06 ) 0.38 0.34 0.52 0.27
Total ($/BOE)
USA Operations (7.18 ) (9.63 ) (6.64 ) (5.19 ) 4.22 2.88 4.66 1.34 9.11 3.59
Canadian Operations (2.49 ) (4.93 ) (1.61 ) (0.99 ) 2.53 0.85 3.14 2.61 5.04 1.75
Total Operations (5.09 ) (7.57 ) (4.44 ) (3.27 ) 3.52 2.01 4.04 1.85 7.41 2.86

Third quarter report
for the period ended September 30, 2021
Ovintiv Inc. 7 Supplemental Information (prepared in US$)
Supplemental Oil and Gas Operating Statistics (unaudited)
Operating Statistics (continued)
Per-Unit Results, Including the Impact of Realized Gains (Losses) on Risk Management
2021 2020
(US$)
Year-to-
Date Q3 Q2 Q1
Year Q4
Q3 Year-
to-date Q3 Q2 Q1
Oil Price ($/bbl)
USA Operations 50.62 53.30 51.24 47.40 44.72 47.78 43.63 41.41 39.80 49.03
Canadian Operations 55.51 64.95 60.68 52.84 32.58 39.52 29.79 34.38 11.90 38.95
Total Operations 50.64 53.31 51.27 47.44 44.68 47.75 43.58 41.39 39.70 48.99
NGLs - Plant Condensate Price ($/bbl)
USA Operations 56.84 62.84 55.54 51.14 26.68 31.59 25.05 27.98 12.47 34.54
Canadian Operations 54.83 58.38 55.60 50.53 44.72 47.96 43.46 43.81 36.43 50.03
Total Operations 55.24 59.34 55.59 50.65 40.89 44.81 39.41 39.99 31.37 46.80
Oil & Plant Condensate Price ($/bbl)
USA Operations 51.04 54.02 51.53 47.64 43.49 46.73 42.35 40.39 37.89 48.11
Canadian Operations 54.85 58.40 55.63 50.59 44.55 47.85 43.27 43.71 36.14 49.82
Total Operations 51.85 54.97 52.39 48.27 43.70 46.96 42.53 41.04 37.52 48.46
NGLs - Other Price ($/bbl)
USA Operations 18.83 22.11 17.04 17.05 8.96 9.59 8.77 9.38 8.91 8.09
Canadian Operations 27.38 31.73 23.88 26.79 11.51 16.48 9.66 13.16 9.48 6.97
Total Operations 20.50 23.86 18.37 19.14 9.41 10.94 8.92 9.99 9.01 7.89
NGLs - Total Price ($/bbl)
USA Operations 24.00 27.79 22.10 21.73 11.37 12.70 10.96 11.98 9.41 11.37
Canadian Operations 47.08 51.02 46.55 43.76 35.85 39.75 34.35 35.39 29.94 37.50
Total Operations 33.88 37.31 32.46 31.69 21.35 24.73 20.20 20.81 17.78 21.80
Oil & NGLs Price ($/bbl)
USA Operations 41.31 43.82 41.05 39.00 33.04 36.21 31.96 30.50 29.21 35.72
Canadian Operations 47.15 51.05 46.61 43.90 35.82 39.75 34.30 35.38 29.77 37.51
Total Operations 42.53 45.30 42.20 40.06 33.58 36.95 32.40 31.41 29.31 36.06
Natural Gas Price ($/Mcf)
USA Operations 2.89 3.15 2.57 2.97 1.98 2.18 1.92 1.93 1.93 1.91
Canadian Operations 2.96 2.94 2.81 3.15 2.21 2.39 2.14 2.26 2.16 2.01
Total Operations 2.95 3.02 2.74 3.10 2.13 2.33 2.07 2.15 2.09 1.97
Total Price ($/BOE)
USA Operations 34.90 36.96 34.23 33.47 27.22 30.08 26.26 25.25 24.20 29.05
Canadian Operations 24.89 25.68 24.06 24.93 18.95 21.03 18.19 18.83 17.03 18.73
Total Operations 30.45 32.00 29.76 29.58 23.82 26.21 22.98 22.66 21.21 24.96
Total Netback ($/BOE)
USA Operations 23.61 25.44 23.20 22.18 17.90 20.88 16.89 16.13 15.09 19.24
Canadian Operations 12.87 13.67 11.54 13.37 7.44 9.88 6.54 6.72 5.91 6.99
Total Operations 18.84 20.28 18.08 18.17 13.59 16.17 12.69 12.33 11.25 14.38

Third quarter report
for the period ended September 30, 2021
Ovintiv Inc. 8 Supplemental Information (prepared in US$)
Supplemental Oil and Gas Operating Statistics (unaudited)
Results by Play
2021 2020
(average)
Year-to-
Date Q3 Q2 Q1 Year Q4
Q3 Year-
to-date Q3 Q2 Q1
Oil Production (Mbbls/d)
USA Operations
Permian 69.5 72.2 75.2 61.1 63.2 64.3 62.8 60.1 64.0 64.3
Anadarko 40.3 39.9 40.6 40.4 43.0 42.3 43.3 39.2 43.8 46.7
Other Upstream Operations (1)
Eagle Ford 7.7 - 7.5 15.7 17.7 21.2 16.5 14.9 15.1 19.8
Bakken 13.4 13.4 13.3 13.5 16.1 17.9 15.5 13.7 14.5 18.4
Uinta 12.4 11.1 11.5 14.7 10.7 11.6 10.4 10.4 8.3 12.5
Other 0.2 0.1 0.1 0.2 0.2 - 0.2 0.2 0.3 -
Total USA Operations 143.5 136.7 148.2 145.6 150.9 157.3 148.7 138.5 146.0 161.7
Canadian Operations
Montney 0.1 0.1 0.1 0.1 0.1 0.1 0.1 0.1 0.1 0.2
Other Upstream Operations (1)
Duvernay 0.3 - 0.2 0.8 0.5 0.6 0.5 0.3 0.4 0.6
Other - - - - - - - - - -
Total Canadian Operations 0.4 0.1 0.3 0.9 0.6 0.7 0.6 0.4 0.5 0.8
Total 143.9 136.8 148.5 146.5 151.5 158.0 149.3 138.9 146.5 162.5
NGLs - Plant Condensate Production (Mbbls/d)
USA Operations
Permian 3.0 3.6 3.0 2.4 2.6 2.7 2.6 3.0 2.8 2.3
Anadarko 6.1 6.6 6.0 5.8 6.6 6.2 6.7 6.6 6.6 6.9
Other Upstream Operations (1)
Eagle Ford 0.4 - 0.5 0.7 1.0 1.0 1.0 1.0 0.9 0.9
Bakken 0.8 0.8 0.8 0.7 0.7 0.7 0.7 0.7 0.5 0.7
Uinta 0.2 0.2 0.2 0.1 0.1 0.2 0.1 0.1 0.1 0.1
Other - 0.1 - - 0.1 0.1 - - 0.1 0.1
Total USA Operations 10.5 11.3 10.5 9.7 11.1 10.9 11.1 11.4 11.0 11.0
Canadian Operations
Montney 40.4 40.6 41.1 39.4 37.1 42.8 35.2 31.9 36.5 37.0
Other Upstream Operations (1)
Duvernay 1.0 - 0.7 2.3 3.9 3.1 4.2 3.9 4.3 4.7
Other - - - - - - - - - -
Total Canadian Operations 41.4 40.6 41.8 41.7 41.0 45.9 39.4 35.8 40.8 41.7
Total 51.9 51.9 52.3 51.4 52.1 56.8 50.5 47.2 51.8 52.7
(1) Other Upstream Operations includes production volumes from plays that are not part of the Company's current strategic focus. Production volumes associated with Eagle Ford were included in
USA Other Upstream Operations until the asset was divested on May 19, 2021. Production volumes associated with Duvernay were included in Canadian Other Upstream Operations until the
asset was divested on April 28, 2021.

Third quarter report
for the period ended September 30, 2021
Ovintiv Inc. 9 Supplemental Information (prepared in US$)
Supplemental Oil and Gas Operating Statistics (unaudited)
Results by Play (continued)
2021 2020
(average)
Year-to-
Date Q3 Q2 Q1 Year Q4
Q3 Year-
to-date Q3 Q2 Q1
Oil & Plant Condensate Production (Mbbls/d)
USA Operations
Permian 72.5 75.8 78.2 63.5 65.8 67.0 65.4 63.1 66.8 66.6
Anadarko 46.4 46.5 46.6 46.2 49.6 48.5 50.0 45.8 50.4 53.6
Other Upstream Operations (1)
Eagle Ford 8.1 - 8.0 16.4 18.7 22.2 17.5 15.9 16.0 20.7
Bakken 14.2 14.2 14.1 14.2 16.8 18.6 16.2 14.4 15.0 19.1
Uinta 12.6 11.3 11.7 14.8 10.8 11.8 10.5 10.5 8.4 12.6
Other 0.2 0.2 0.1 0.2 0.3 0.1 0.2 0.2 0.4 0.1
Total USA Operations 154.0 148.0 158.7 155.3 162.0 168.2 159.8 149.9 157.0 172.7
Canadian Operations
Montney 40.5 40.7 41.2 39.5 37.2 42.9 35.3 32.0 36.6 37.2
Other Upstream Operations (1)
Duvernay 1.3 - 0.9 3.1 4.4 3.7 4.7 4.2 4.7 5.3
Other - - - - - - - - - -
Total Canadian Operations 41.8 40.7 42.1 42.6 41.6 46.6 40.0 36.2 41.3 42.5
Total 195.8 188.7 200.8 197.9 203.6 214.8 199.8 186.1 198.3 215.2
NGLs - Other Production (Mbbls/d)
USA Operations
Permian 24.0 26.5 25.8 19.5 22.7 22.6 22.8 22.7 23.2 22.1
Anadarko 35.5 36.8 36.1 33.5 39.2 34.5 40.7 39.4 36.7 46.2
Other Upstream Operations (1)
Eagle Ford 1.7 - 1.9 3.3 4.2 4.5 4.1 3.8 3.8 4.7
Bakken 4.7 5.3 4.8 4.1 3.6 4.2 3.4 3.5 3.0 3.9
Uinta 0.6 0.6 0.6 0.5 0.5 0.4 0.5 0.6 0.4 0.5
Other 0.1 0.2 - 0.1 0.1 0.3 0.2 0.2 0.1 0.1
Total USA Operations 66.6 69.4 69.2 61.0 70.3 66.5 71.7 70.2 67.2 77.5
Canadian Operations
Montney 16.1 15.5 16.6 16.2 13.9 15.6 13.3 12.9 11.9 15.3
Other Upstream Operations (1)
Duvernay 0.2 - 0.1 0.5 1.1 0.5 1.2 0.7 1.0 1.8
Other - - - - - - - - - -
Total Canadian Operations 16.3 15.5 16.7 16.7 15.0 16.1 14.5 13.6 12.9 17.1
Total 82.9 84.9 85.9 77.7 85.3 82.6 86.2 83.8 80.1 94.6
(1) Other Upstream Operations includes production volumes from plays that are not part of the Company's current strategic focus. Production volumes associated with Eagle Ford were included in
USA Other Upstream Operations until the asset was divested on May 19, 2021. Production volumes associated with Duvernay were included in Canadian Other Upstream Operations until the
asset was divested on April 28, 2021.

Third quarter report
for the period ended September 30, 2021
Ovintiv Inc. 10 Supplemental Information (prepared in US$)
Supplemental Oil and Gas Operating Statistics (unaudited)
Results by Play (continued)
2021 2020
(average)
Year-to-
Date Q3 Q2 Q1 Year Q4
Q3 Year-
to-date Q3 Q2 Q1
NGLs - Total Production (Mbbls/d)
USA Operations
Permian 27.0 30.1 28.8 21.9 25.3 25.3 25.4 25.7 26.0 24.4
Anadarko 41.6 43.4 42.1 39.3 45.8 40.7 47.4 46.0 43.3 53.1
Other Upstream Operations (1)
Eagle Ford 2.1 - 2.4 4.0 5.2 5.5 5.1 4.8 4.7 5.6
Bakken 5.5 6.1 5.6 4.8 4.3 4.9 4.1 4.2 3.5 4.6
Uinta 0.8 0.8 0.8 0.6 0.6 0.6 0.6 0.7 0.5 0.6
Other 0.1 0.3 - 0.1 0.2 0.4 0.2 0.2 0.2 0.2
Total USA Operations 77.1 80.7 79.7 70.7 81.4 77.4 82.8 81.6 78.2 88.5
Canadian Operations
Montney 56.5 56.1 57.7 55.6 51.0 58.4 48.5 44.8 48.4 52.3
Other Upstream Operations (1)
Duvernay 1.2 - 0.8 2.8 5.0 3.6 5.4 4.6 5.3 6.5
Other - - - - - - - - - -
Total Canadian Operations 57.7 56.1 58.5 58.4 56.0 62.0 53.9 49.4 53.7 58.8
Total 134.8 136.8 138.2 129.1 137.4 139.4 136.7 131.0 131.9 147.3
Oil & NGLs Production (Mbbls/d)
USA Operations
Permian 96.5 102.3 104.0 83.0 88.5 89.6 88.2 85.8 90.0 88.7
Anadarko 81.9 83.3 82.7 79.7 88.8 83.0 90.7 85.2 87.1 99.8
Other Upstream Operations (1)
Eagle Ford 9.8 - 9.9 19.7 22.9 26.7 21.6 19.7 19.8 25.4
Bakken 18.9 19.5 18.9 18.3 20.4 22.8 19.6 17.9 18.0 23.0
Uinta 13.2 11.9 12.3 15.3 11.3 12.2 11.0 11.1 8.8 13.1
Other 0.3 0.4 0.1 0.3 0.4 0.4 0.4 0.4 0.5 0.2
Total USA Operations 220.6 217.4 227.9 216.3 232.3 234.7 231.5 220.1 224.2 250.2
Canadian Operations
Montney 56.6 56.2 57.8 55.7 51.1 58.5 48.6 44.9 48.5 52.5
Other Upstream Operations (1)
Duvernay 1.5 - 1.0 3.6 5.5 4.2 5.9 4.9 5.7 7.1
Other - - - - - - - - - -
Total Canadian Operations 58.1 56.2 58.8 59.3 56.6 62.7 54.5 49.8 54.2 59.6
Total 278.7 273.6 286.7 275.6 288.9 297.4 286.0 269.9 278.4 309.8
(1) Other Upstream Operations includes production volumes from plays that are not part of the Company's current strategic focus. Production volumes associated with Eagle Ford were included in
USA Other Upstream Operations until the asset was divested on May 19, 2021. Production volumes associated with Duvernay were included in Canadian Other Upstream Operations until the
asset was divested on April 28, 2021.

Third quarter report
for the period ended September 30, 2021
Ovintiv Inc. 11 Supplemental Information (prepared in US$)
Supplemental Oil and Gas Operating Statistics (unaudited)
Results by Play (continued)
2021 2020
(average)
Year-to-
Date Q3 Q2 Q1 Year Q4
Q3 Year-
to-date Q3 Q2 Q1
Natural Gas Production (MMcf/d)
USA Operations
Permian 127 142 133 106 124 122 124 121 126 125
Anadarko 296 307 304 278 331 303 340 315 340 367
Other Upstream Operations (1)
Eagle Ford 14 - 14 27 31 33 30 28 27 35
Bakken 29 30 29 28 28 33 26 27 24 26
Uinta 12 11 11 13 11 10 11 10 11 12
Other 6 5 6 7 4 7 6 6 8 3
Total USA Operations 484 495 497 459 529 508 537 507 536 568
Canadian Operations
Montney 1,050 1,038 1,063 1,049 918 979 898 855 926 913
Other Upstream Operations (1)
Duvernay 13 - 9 31 41 33 44 40 46 46
Other 36 33 38 37 41 39 41 40 42 42
Total Canadian Operations 1,099 1,071 1,110 1,117 1,000 1,051 983 935 1,014 1,001
Total 1,583 1,566 1,607 1,576 1,529 1,559 1,520 1,442 1,550 1,569
Total Production (MBOE/d)
USA Operations
Permian 117.7 126.0 126.2 100.8 109.1 110.0 108.9 106.0 111.0 109.6
Anadarko 131.3 134.4 133.3 125.9 143.9 133.5 147.4 137.7 143.7 161.0
Other Upstream Operations (1)
Eagle Ford 12.1 - 12.2 24.2 28.0 32.1 26.6 24.3 24.2 31.3
Bakken 23.7 24.5 23.8 22.9 25.1 28.4 24.0 22.5 22.0 27.4
Uinta 15.1 13.8 14.2 17.4 13.1 14.0 12.8 12.7 10.6 15.0
Other 1.3 1.3 1.1 1.6 1.3 1.3 1.2 1.4 1.9 0.5
Total USA Operations 301.2 300.0 310.8 292.8 320.5 319.3 320.9 304.6 313.4 344.8
Canadian Operations
Montney 231.5 229.2 235.0 230.5 204.2 221.5 198.3 187.4 202.9 204.7
Other Upstream Operations (1)
Duvernay 3.7 - 2.5 8.7 12.3 9.8 13.2 11.5 13.3 14.8
Other 6.1 5.5 6.3 6.3 6.8 6.6 6.9 6.7 7.0 7.0
Total Canadian Operations 241.3 234.7 243.8 245.5 223.3 237.9 218.4 205.6 223.2 226.5
Total 542.5 534.7 554.6 538.3 543.8 557.2 539.3 510.2 536.6 571.3
Total Production (MBOE/d)
Total Core Assets 480.5 489.6 494.5 457.2 457.2 465.0 454.6 431.1 457.6 475.3
% of Total 89% 92% 89% 85% 84% 83% 84% 84% 85% 83%
(1) Other Upstream Operations includes total production volumes from plays that are not part of the Company's current strategic focus. Canadian Other primarily includes natural gas volumes in
Horn River. Production volumes associated with Eagle Ford were included in USA Other Upstream Operations until the asset was divested on May 19, 2021. Production volumes associated with
Duvernay were included in Canadian Other Upstream Operations until the asset was divested on April 28, 2021.

Third quarter report
for the period ended September 30, 2021
Ovintiv Inc. 12 Supplemental Information (prepared in US$)
Supplemental Oil and Gas Operating Statistics (unaudited)
Results by Play (continued)
2021 2020
(US$ millions)
Year-to-
Date Q3 Q2 Q1 Year Q4
Q3 Year-
to-date Q3 Q2 Q1
Capital Expenditures, Excluding Capitalized Internal Costs
USA Operations
Permian 422 115 147 160 559 128 431 105 101 225
Anadarko 219 86 78 55 407 78 329 58 47 224
Other Upstream Operations (1)
Eagle Ford (1 ) (1 ) (1 ) 1 104 6 98 27 9 62
Bakken 39 22 9 8 88 5 83 18 16 49
Uinta 30 15 10 5 62 25 37 4 6 27
Other 4 - 3 1 7 2 5 3 2 -
Total USA Operations 713 237 246 230 1,227 244 983 215 181 587
Canadian Operations
Montney 264 89 95 80 344 76 268 96 22 150
Other Upstream Operations (1)
Duvernay (1 ) - (1 ) - 6 1 5 1 1 3
Other 3 3 - - (1 ) (2 ) 1 1 (2 ) 2
Total Canadian Operations 266 92 94 80 349 75 274 98 21 155
Total Capital Expenditures, Excluding Capitalized Internal Costs 979 329 340 310 1,576 319 1,257 313 202 742
Capitalized Directly Attributable Internal Costs
USA Operations
Permian 53 16 18 19 63 10 53 16 20 17
Anadarko 29 9 11 9 39 6 33 10 12 11
Other Upstream Operations (1)
Eagle Ford - - - - 7 1 6 1 1 4
Bakken 4 - 3 1 9 1 8 1 2 5
Uinta 5 3 1 1 6 1 5 1 1 3
Other 1 - - 1 2 - 2 - 1 1
Total USA Operations 92 28 33 31 126 19 107 29 37 41
Canadian Operations
Montney 25 7 9 9 27 3 24 8 11 5
Other Upstream Operations (1)
Duvernay (1 ) - (1 ) - 2 - 2 1 - 1
Other 1 - 1 - 2 2 - (1 ) 1 -
Total Canadian Operations 25 7 9 9 31 5 26 8 12 6
Total Capitalized Directly Attributable Internal Costs 117 35 42 40 157 24 133 37 49 47
Total Capital Expenditures
USA Operations
Permian 475 131 165 179 622 138 484 121 121 242
Anadarko 248 95 89 64 446 84 362 68 59 235
Other Upstream Operations (1)
Eagle Ford (1 ) (1 ) (1 ) 1 111 7 104 28 10 66
Bakken 43 22 12 9 97 6 91 19 18 54
Uinta 35 18 11 6 68 26 42 5 7 30
Other 5 - 3 2 9 2 7 3 3 1
Total USA Operations 805 265 279 261 1,353 263 1,090 244 218 628
Canadian Operations
Montney 289 96 104 89 371 79 292 104 33 155
Other Upstream Operations (1)
Duvernay (2 ) - (2 ) - 8 1 7 2 1 4
Other 4 3 1 - 1 - 1 - (1 ) 2
Total Canadian Operations 291 99 103 89 380 80 300 106 33 161
Corporate & Other 2 1 1 - 3 - 3 1 1 1
Total Capital Expenditures 1,098 365 383 350 1,736 343 1,393 351 252 790
Net Acquisitions & (Divestitures) (1,014 ) 8 (1,021 ) (1 ) (70 ) (20 ) (50 ) (38 ) (7 ) (5 )
Net Capital Investment 84 373 (638 ) 349 1,666 323 1,343 313 245 785
(1) Other Upstream Operations includes capital expenditures in plays that are not part of the Company's current strategic focus. Capital expenditures in Eagle Ford were included in USA Other
Upstream Operations until the asset was divested on May 19, 2021. Capital expenditures in Duvernay were included in Canadian Other Upstream Operations until the asset was divested on
April 28, 2021.

Third quarter report
for the period ended September 30, 2021
Ovintiv Inc. 13 Supplemental Information (prepared in US$)
Supplemental Oil and Gas Operating Statistics (unaudited)
Results by Play (continued)
2021 2020
Year-to-
Date Q3 Q2 Q1 Year Q4
Q3 Year-
to-date Q3 Q2 Q1
Drilling Activity (net wells drilled)
USA Operations
Permian 60 17 21 22 102 22 80 25 23 32
Anadarko 42 12 16 14 71 11 60 10 13 37
Other Upstream Operations (1)
Eagle Ford - - - - 18 - 18 - 3 15
Bakken 7 4 1 2 10 - 10 - 3 7
Uinta 6 6 - - 8 - 8 - 3 5
Total USA Operations 115 39 38 38 209 33 176 35 45 96
Canadian Operations
Montney 67 23 18 26 73 22 51 11 12 28
Other Upstream Operations (1)
Duvernay - - - - 1 - 1 - - 1
Other 1 1 - - - - - - - -
Total Canadian Operations 68 24 18 26 74 22 52 11 12 29
Total 183 63 56 64 283 55 228 46 57 125
Completions Activity (net wells on production)
USA Operations
Permian 77 20 33 24 95 29 66 16 13 37
Anadarko 39 10 22 7 77 28 49 5 17 27
Other Upstream Operations (1)
Eagle Ford - - - - 18 7 11 6 - 5
Bakken 4 2 2 - 15 8 7 - - 7
Uinta - - - - 8 8 - - - -
Total USA Operations 120 32 57 31 213 80 133 27 30 76
Canadian Operations
Montney 64 16 30 18 78 28 50 14 8 28
Total Canadian Operations 64 16 30 18 78 28 50 14 8 28
Total 184 48 87 49 291 108 183 41 38 104
(1) Other Upstream Operations includes net wells drilled and net wells on production in plays that are not part of the Company's current strategic focus. Net wells drilled and net wells on production
in Eagle Ford were included in USA Other Upstream Operations until the asset was divested on May 19, 2021. Net wells drilled in Duvernay were included in Canadian Other Upstream Operations
until the asset was divested on April 28, 2021.
Recommended