Overview: Tobacco-Related Disparities Among Hispanics/Latinos
TM
2005 National Conference on Tobacco or HealthMay 4, 2005
Centers for Disease Control and PreventionOffice on Smoking and Health

Introduction
Overview: Tobacco-Related Disparities Among Hispanics/Latinos
2005 National Conference on Tobacco or HealthMay 4, 2005
Nisha Gupta, MPHOffice on Smoking and Health
TM

Topics
Program Development and Capacity BuildingDebra Torres
Smoking among Hispanics/LatinosRalph Caraballo
Border Region Opportunities and OSH Initiatives Nisha Gupta
Hispanic/Latino Adult Tobacco SurveyRalph Caraballo
Program Development& Capacity Building
Debra S. Torres, MPHOffice on Smoking and Health
2005 National Conference on Tobacco or HealthMay 4, 2005
TM

Why Focus on Hispanic/Latinos?
Fastest growing sub-group of the U.S. population
Younger than general population

Who are Hispanic/Latinos ?
Heterogeneous – Country of origin
– Geographic region
– Immigration status
– Language
– Acculturation levels
– Education
– Socio-economic status

Social Context
Most likely to live in poverty
Lower proportion of people aged 25 > with at least a high school diploma
More likely to be unemployed
Less likely to be covered by health insurance
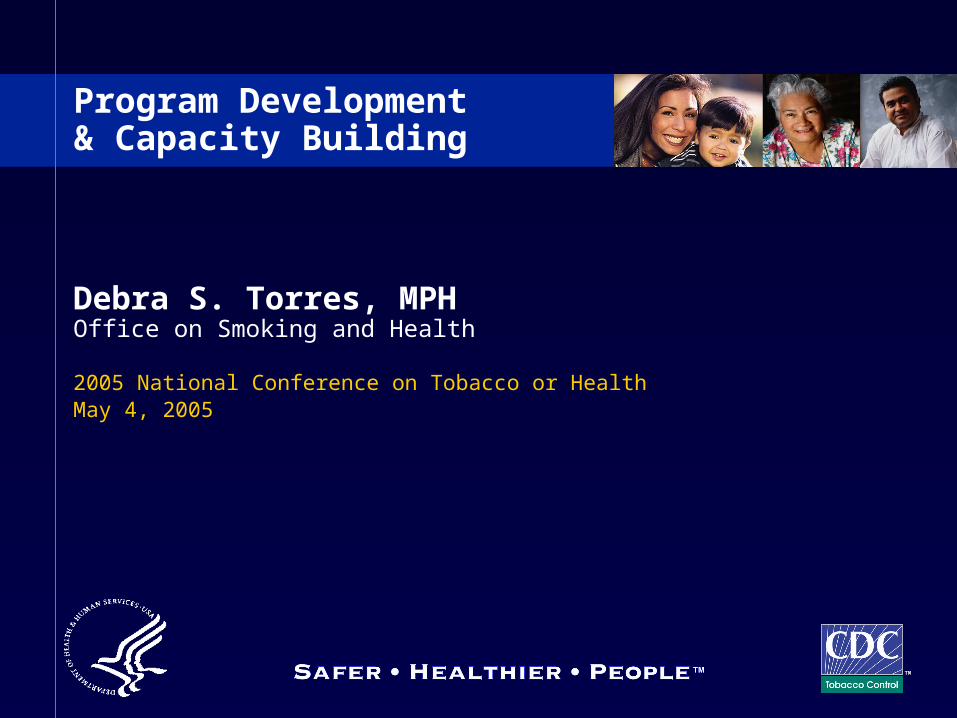
Social Context - 2
Hispanic/Latinos similar mortality outcomes as non-Hispanic Whites?
– Data aggregated for Hispanic/Latino’s as a whole
– Socio-demographic characteristics
– Some studies not conducted in Spanish
Program Planning,Development & Implementation
Consider challenges and opportunities

Challenges
Competing priorities social and health issues
Targeting by tobacco industry
– Advertising
– Sponsorship
– Philanthropy
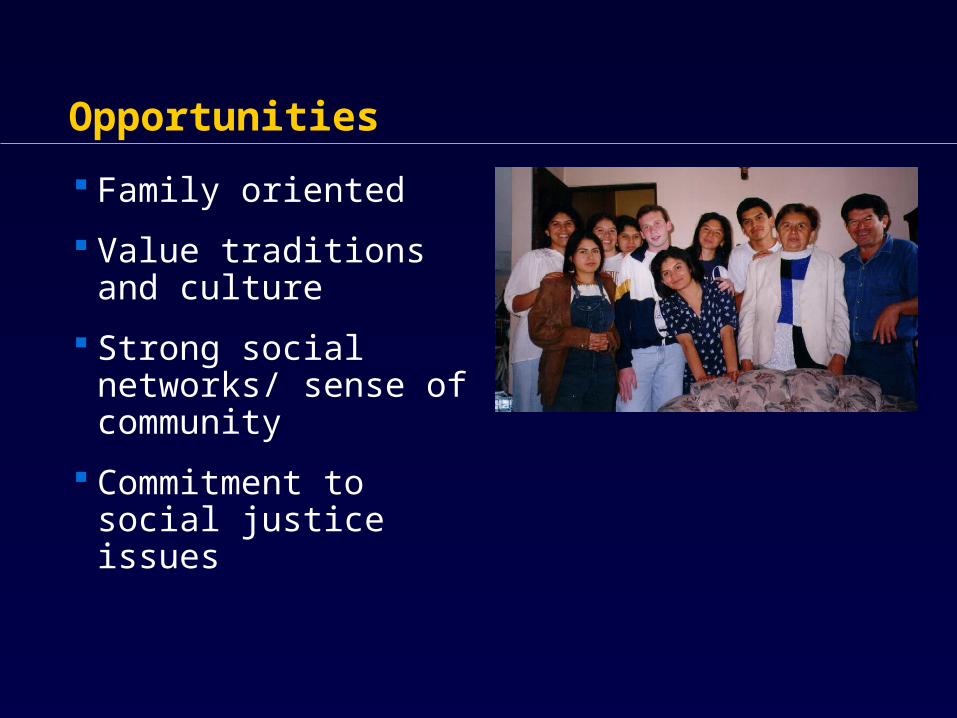
Opportunities
Family oriented
Value traditions and culture
Strong social networks/ sense of community
Commitment to social justice issues

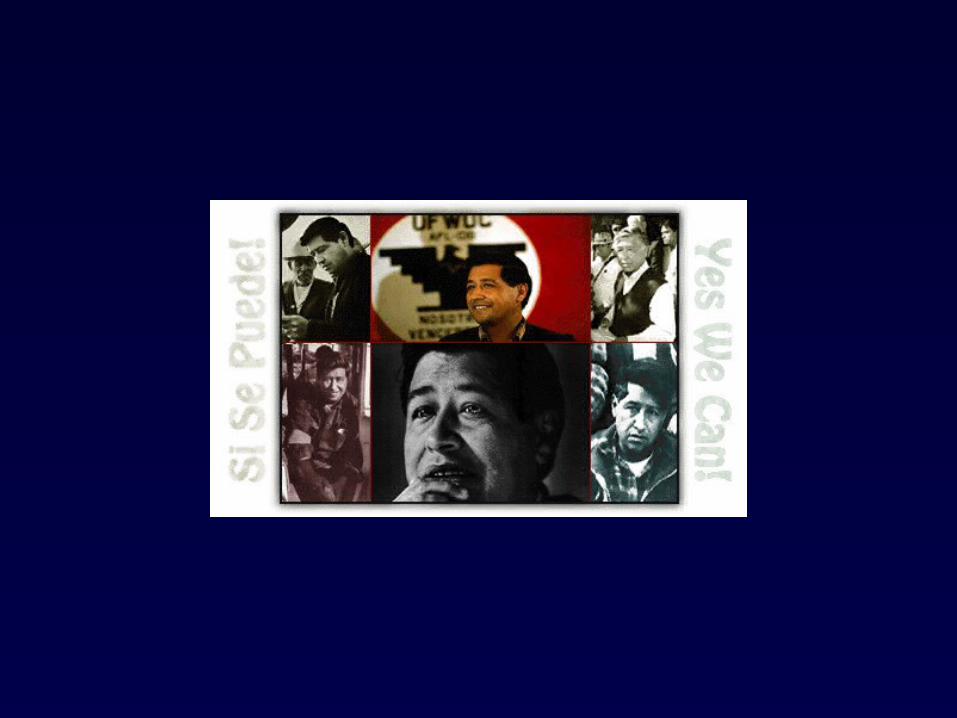
“Forty Years ago, Cesar Chavez led the struggle for better working conditions for Hispanic/Latino farm workers in the United States. As a leader, he made sure workers were paid fair wages and were protected from the dangerous chemicals in the fields.”
Latino/a Research & Policy Center

Today Hispanic/Latinos still struggle with exposure to deadly chemicals in the workplace exposure to secondhand
smoke.

Hispanic/Latino’s are the least protected group by comprehensive smoke-free
policies in the workplace.

Program Planning Strategies
Identify stakeholders
Engage stakeholders
Obtain skilled Hispanic/Latino facilitator

Program Planning/Development Strategies Increase quantitative and qualitative data
Tailor interventions

Program Strategies
Develop and implement
– Community competent
– Comprehensive interventions
• Prevent initiation: youth and young adults
• Promote quitting among adults and youth
• Reduce exposure to secondhand smoke

Program Strategies - 2
Monitor industry marketing tactics
Link tobacco control with other health and social issues
EVALUATE, EVALUATE, EVALUATE
Publish findings

On-Going Program Activities
Cultivate partnerships
Foster inclusivity

On-Going Program Activities - 2
Build capacity
Allocate resources
Sustain funding
Provide training and technical assistance

Health Communications
Avoid direct translations
Develop tailored messages
Use local Hispanic/Latino media outletsie., Univision, radio, newspapers
Place messages in mainstream media outlets

Take Home Message
Get to know your community
Engage community
One size doesn’t fit all
Context is key

Conclusion
“Envision a future where those responsible for addressing tobacco prevention and cessation take on a major role in ensuring culturally competent services and participate in advocacy initiatives to reduce tobacco related disparities among Hispanic Latinos.”
Hispanic Latino Education Network of California

Program Development& Capacity Building
Debra S. Torres, MPHOffice on Smoking and Health
2005 National Conference on Tobacco or HealthMay 4, 2005
TM
Smoking among Hispanics/Latinos
TM
2005 National Conference on Tobacco or HealthMay 4, 2005
Ralph Caraballo, PhD, MPHOffice on Smoking and Health
Topics to be Covered
Hispanic/Latino Demographics in the U.S.
Tobacco Industry Advertising for Latinos
Smoking Prevalence and Trends
Secondhand Smoke Exposure
Smoking during pregnancy
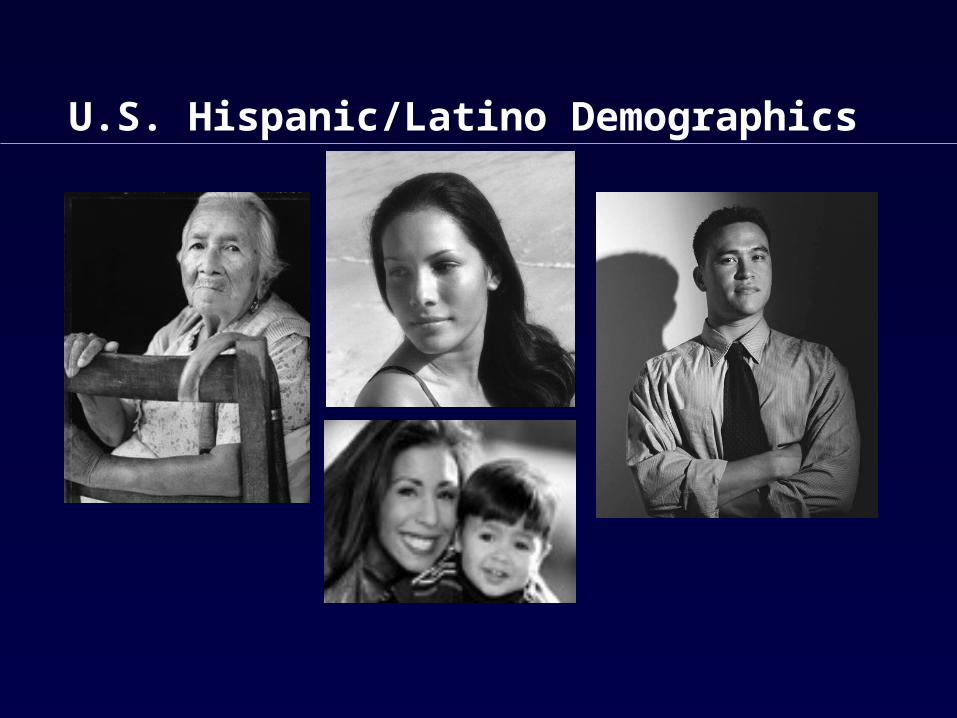
U.S. Hispanic/Latino Demographics
Uniqueness: Specific Population Groups Important to understand the diversity
and uniqueness of specific populations
What we think is one group may be several, with varying customs and needs

Percent Distribution of Hispanics/ Latinos by Ancestry: 2004
Source: Hispanics: A People in Motion; The Pew Hispanic Center, January 2005
5%
7%
3%
4%
10%
8%
Mexican
South American
Central American
Dominican
Cuban
Puerto Rican
All Other Hispanic
63%
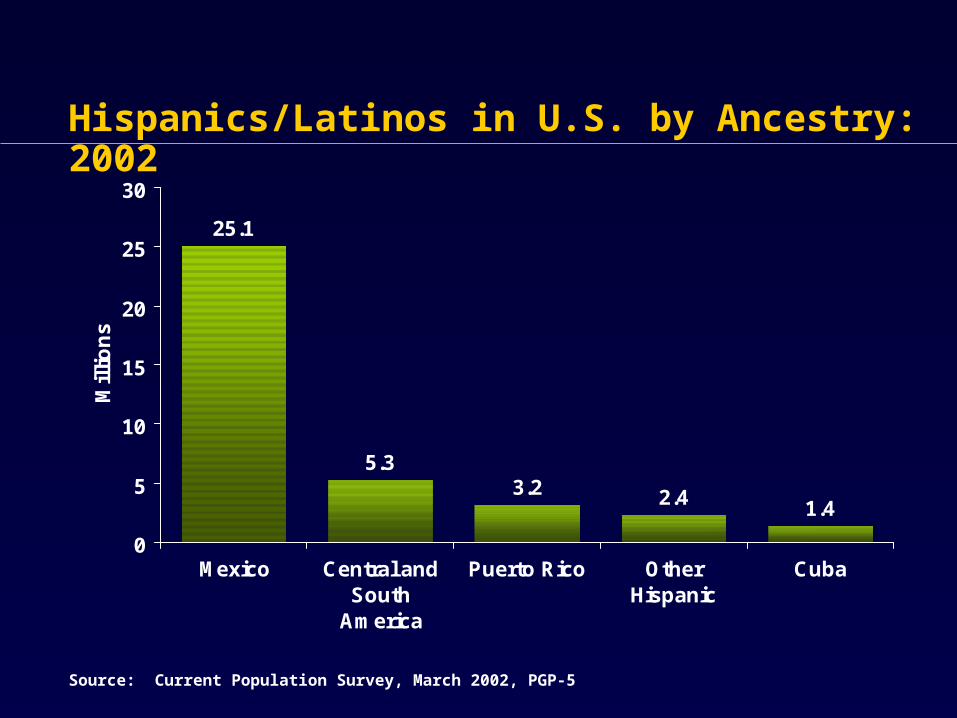
25.1
5.33.2 2.4 1.4
0
5
10
15
20
25
30
Mexico Central andSouth
America
Puerto Rico OtherHispanic
Cuba
Mil
lio
ns
Source: Current Population Survey, March 2002, PGP-5
Hispanics/Latinos in U.S. by Ancestry: 2002

Source: U.S. Census Bureau, 2004, "U.S. Interim Projections by Age, Sex, Race, and Hispanic Origin," www.census.gov/ipc/www/usinterimproj Internet Release Date: March 18, 2004
Population Growth:U.S. Population by Race/Ethnicity
AAPI AIANBlackWhite Hispanic
12.6%
69.4%
2000
24.4%
50.1%
2050

Source: U.S. Census Bureau, 2004, "U.S. Interim Projections by Hispanic Origin," www.census.gov/ipc/www/usinterimproj Internet Release Date: March 18, 2004
Hispanic/Latino Population—United States
47.7
35.6
22.4
59.7
73.1
87.6
102.6
0
10
20
30
40
50
60
70
80
90
100
110
1990 2000 2010 2020 2030 2040 2050
Po
pu
lati
on
in m
illio
ns


High Percent of Hispanics Lower Percent of Hispanics
10 U.S. States Where 80% of Hispanics Reside (Year 2000)
CA
NV
AZ
CO
NM
TX
IL
NY
FL
NJ

Census 2000: Top 10 States by Hispanic Percent Change Since 1990
155
166
173
208
211
278
300
337
394
217
Percent change
Nebraska
N. Carolina
Arkansas
Georgia
Tennessee
Nevada
S. Carolina
Alabama
Kentucky
Minnesota

47.0
25.028.0
0
10
20
30
40
50
Mil
lio
ns
Source: Pew Hispanic Center/Kaiser Family Foundation National Survey of Latinos, December 2002
Language Use Among U.S. Hispanic/Latino Adults, 2002
Spanish Dominant Bilingual English Dominant

55.4
44.6
0
10
20
30
40
50
60
70
Pe
rce
nt
Source: Pew Hispanic Center tabulations from the Annual Social and Economic Supplement, Current Population Survey, March 2004
Native/Foreign Born U.S. Hispanics/Latinos: 2004
Native Born Foreign Born
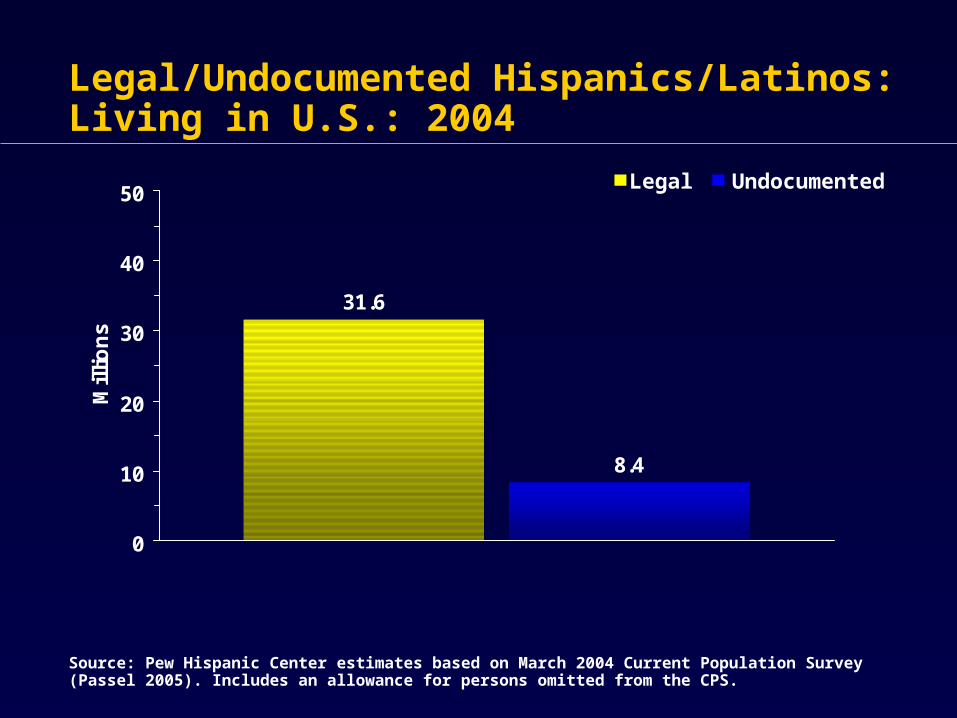
Legal/Undocumented Hispanics/Latinos: Living in U.S.: 2004
31.6
8.4
0
10
20
30
40
50
Mil
lio
ns
Source: Pew Hispanic Center estimates based on March 2004 Current Population Survey (Passel 2005). Includes an allowance for persons omitted from the CPS.
Legal Undocumented
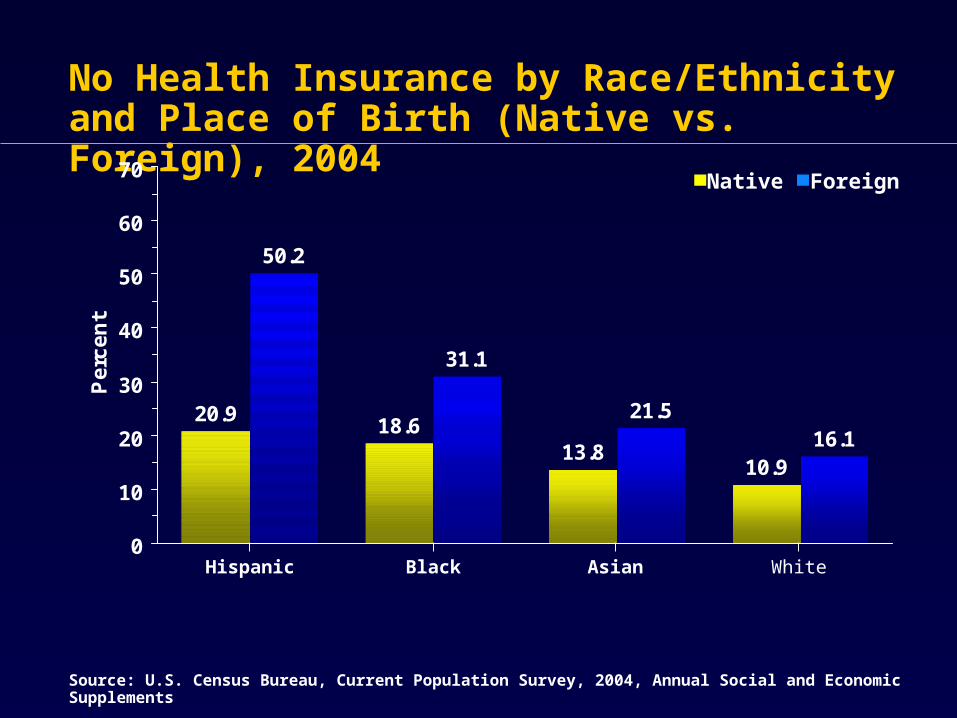
No Health Insurance by Race/Ethnicity and Place of Birth (Native vs. Foreign), 2004
20.918.6
13.810.9
31.1
21.516.1
50.2
0
10
20
30
40
50
60
70
Pe
rce
nt
Source: U.S. Census Bureau, Current Population Survey, 2004, Annual Social and Economic Supplements
Hispanic Black Asian White
Native Foreign

(Population 25 years and over)32.1
22.3
19.2
15.4
4.0
0
5
10
15
20
25
30
35
Mexican Central andSouth
American
Cuban Puerto Rican Non-HispanicWhite
Pe
rce
nt
Source: Current Population Survey, March 2002, PGP-5
Percent with Less Than 9th Grade Completed by Hispanic/Latino Origin: 2002

Smoking among Youth

Targeted Marketing and Promotion
Magazines
Point of purchase advertising


Current Smoking among Latino Adolescents (12-17 years), by Gender, 1999-2001
Source: National Survey on Drug Use and Health, 1999-2001
Boy Girl
14.3
11.4 11.29.9
10.6 10.49.3
10.0
0
2
4
6
8
10
12
14
16
18
20
Pe
rce
nt
Cuban Mexican
Puerto Rican
Central and South American

15.4
4.8
10.111.3
1.0
6.1
11.4 10.6 11
0
10
20
30
Boy Girl Overall
Pe
rce
nt
Source: Encuesta Nacional de Adicciones, México, 2002, and National Survey on Drug Use and Health, 1999-2001
Current Smoking among Youth 12-17 Years:Mexico (urban), Mexico (rural), and U.S. Mexican/Mexican-American
Urban Rural Mexican/Mexican Americans

13.0
20.7
0
10
20
30
Overall
Pe
rce
nt
Source: Encuesta Nacional de Adicciones, México, 2002, and National Survey on Drug Use and Health, 1999-2001
Current Smoking among Youth 12-17 Years: Urban vs. Rural: United States, 2002
Urban Rural

Smoking among Adults

Smoking* Trends: Adults, 1983-2002
* Smoking on 1 or more of the previous 30 days.Source: National Health Interview Surveys, 1983-2002, selected years, aggregate data
American Indian/Alaska Native
African American
Asian/Pacific Islander
White
HP 2010Goal(12%)
Hispanic/Latino
0
10
20
30
40
50
1983-1985
1987-1988
1990-1991
1992-1993
1994-1995
1997-1998
1999-2000
2001-2002
Years
Pe
rce
nt
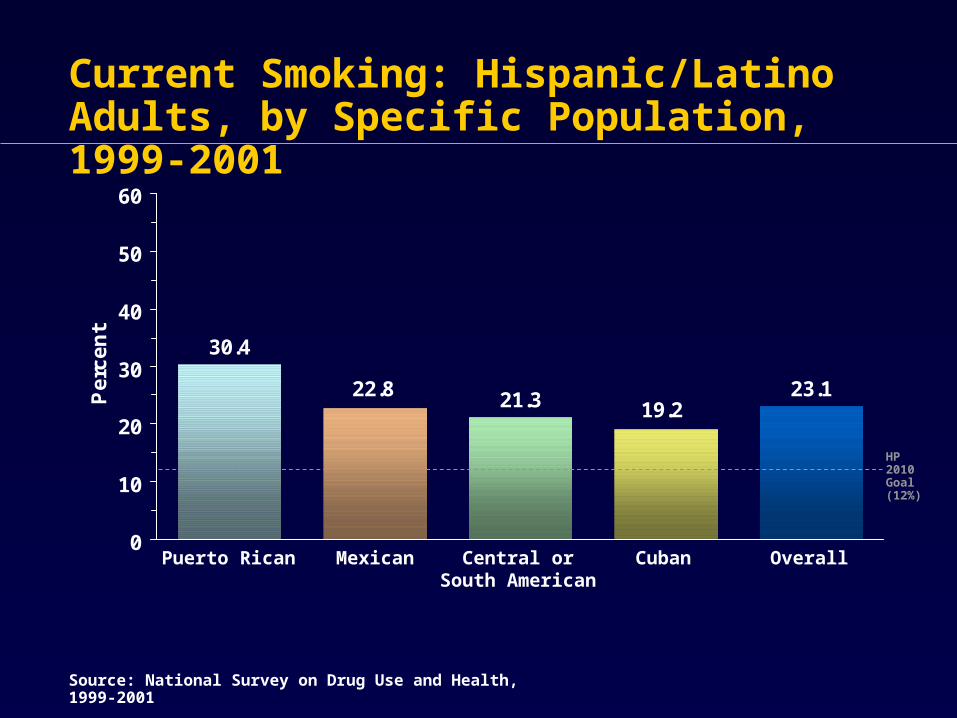
30.4
23.122.8 21.3 19.2
0
10
20
30
40
50
60
Pe
rce
nt
Current Smoking: Hispanic/Latino Adults, by Specific Population, 1999-2001
Source: National Survey on Drug Use and Health, 1999-2001
Puerto Rican Mexican Central orSouth American
Cuban Overall
HP 2010Goal(12%)

34.2
29.8
26.3
21.1
15.616.9 17.5
27.3
0
10
20
30
40
50
Pe
rce
nt
Current Smoking Among Adults, by Specific Population Gender: 1999-2001
Source: National Survey on Drug Use and Health, 1999-2001
PuertoRican
Mexican
Central and South
American
Cuban
Men Women

45.3
18.4
30.232.3
4.2
16.6
29.8
15.6
22.8
0
10
20
30
40
50
60
Men Women Overall
Pe
rce
nt
Source: Encuesta Nacional de Adicciones, México, 2002, and National Survey on Drug Use and Health, 2002
Current Smoking among Adults:Mexico (urban), Mexico (rural), and U.S. Mexican/Mexican-American
Urban Rural Mexican/Mexican Americans

n Percent 95% C.I.Men
English 265 25 19.3 - 29.7
Spanish 355 20 16.1 - 24.5
Women
English 371 20 16.1 - 24.3
Spanish 300 3 0.8 - 4.5
Adult Smoking Prevalence Among Hispanics, by Gender And Survey Language, Oregon, 2000-01

Projection*: Adult Smokers (in millions) by Race/Ethnicity and Year
Population 2000 2025 2050Am. Indian <1.0 <1.0 1.0
Asian Am. 1.1 2.3 4.1
NH-Black 5.6 7.9 9.9
Hispanic 3.8 7.6 12.6
White 36.8 40.3 41.1
*Assumption: Same smoking rates of Year 2000 (NHIS) apply

Secondhand Smoke Exposure (SHS)

Secondhand Smoke Exposure (SHS)
SHS causes lung cancer and heart disease morbidity and mortality in adults, as well as respiratory problems, SIDS, low birth weight, and middle ear infections in children
CAL EPA Report, 1997

Secondhand Smoke Risks
Children at home
Non-smoking spouses at home
Non-smoking workers in workplaces
Non-smoking patrons in restaurants, bars, and gaming venues

Source: National Health and Nutrition Examination Survey, 1999-2000
Percentage of Nonsmokers Exposed to Secondhand Smoke in the U.S., 1999-2000 74% of African Americans
52% of Whites
47% of Mexican Americans / Mexicans

Percentage of Children (nonsmokers) Exposed to Secondhand Smoke, by Age and Race/Ethnicity—United States, 1999-2000
Source: National Health and Nutrition Examination Survey, 1999-2000
76.5
86.7
66.562.6
54.747.5
0
10
20
30
40
50
60
70
80
90
100
3 to 4 years 5 to 11 years
Pe
rce
nta
ge
African American White Mexican American
HP 2010 Goal (45%)

Percentage of Nonsmokers Aged 12 – 19 Years Exposed to Secondhand Smoke, by Race/Ethnicity—United States, 1999-2000
Source: National Health and Nutrition Examination Survey, 1999-2000
80.9
65
50.9
0
10
20
30
40
50
60
70
80
90
100
Pe
rce
nta
ge
HP 2010 Goal (45%)
African American White Mexican American

Percentage of Adult Nonsmokers Exposed to Secondhand Smoke, by Race/Ethnicity and Age—United States, 1999-2000
Source: National Health and Nutrition Examination Survey, 1999-2000
68.8 65.959.3
47.6 47.3
39.545.5
38.6
29.7
0
10
20
30
40
50
60
70
80
90
100
20 - 34 35 - 64 65+ years
Pe
rce
nta
ge
HP 2010 Goal (45%)
African American White Mexican American

54.7
38.6
29.7
47.550.9
45.5
0
10
20
30
40
50
60
Pe
rce
nt
Percentage of Mexicans/Mexican Americans (nonsmokers) Exposed to Secondhand Smoke, by Age—United States, 1999-2000
Source: National Survey on Drug Use and Health, 1999-2001
3 – 4 5 – 11 12 – 19 20 – 34 35 – 64
HP 2010 Goal(45%)
65+
AGE

Smoking During Pregnancy

Percent of Mothers Who Smoked During Pregnancy by Race/Ethnicity of Mother—United States, 1999
Source: National Vital Statistics Report, Vol. 49, No. 7, August 28, 2001Note: California and South Dakota did not report in 1999
AmericanIndian/
Alaska Native
White Hawaiian PuertoRican
Japanese Cuban Filipino Mexican ChineseBlack Central/South
American
20.2
15.914.7
10.59.4
4.53.3 3.3 2.6
1.40.5
0
5
10
15
20
25
Pe
rce
nt

TM
2005 National Conference on Tobacco or HealthMay 4, 2005
Ralph Caraballo, PhD, MPHOffice on Smoking and Health
Smoking among Hispanics/Latinos

Border Region Opportunities and OSH Initiatives
TM
2005 National Conference on Tobacco or HealthMay 4, 2005
Nisha Gupta, MPHOffice on Smoking and Health
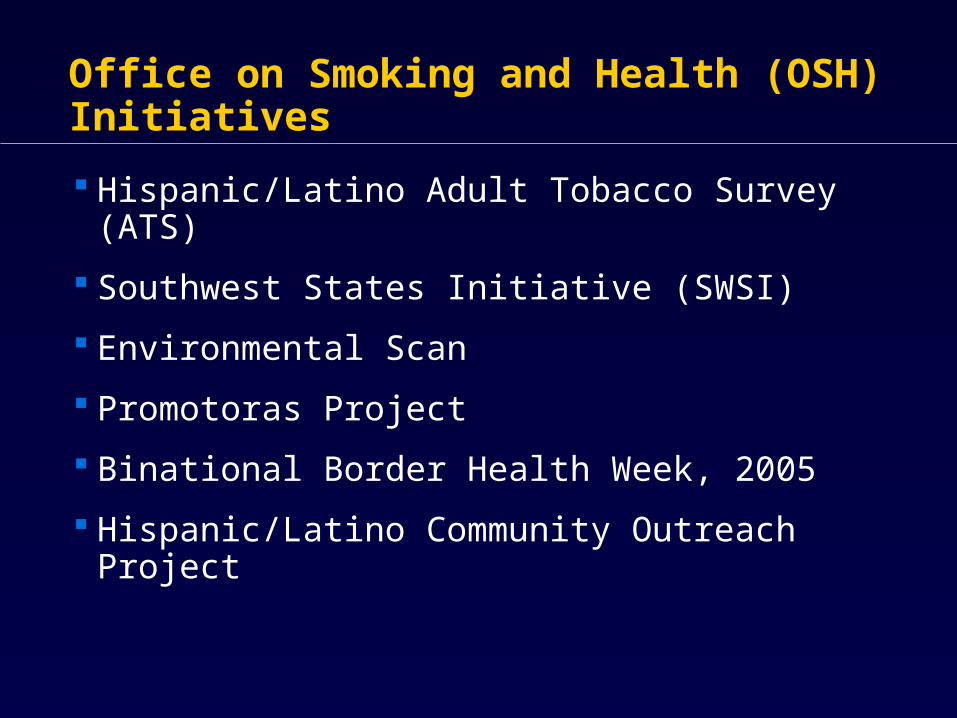
Office on Smoking and Health (OSH) Initiatives
Hispanic/Latino Adult Tobacco Survey (ATS)
Southwest States Initiative (SWSI)
Environmental Scan
Promotoras Project
Binational Border Health Week, 2005
Hispanic/Latino Community Outreach Project

Strategic Approaches
Community Competency approach: history, culture, context, geographic, heterogeneity, etc.
Address tobacco related disparities in Hispanic/ Latino specific populations
Link tobacco control to other health, social and environmental issues
Extrapolate and plan for future tobacco burden

U.S. Mexico Border Region
2,000 miles – 62.5 miles north/south
12 million inhabitants (double by 2025)
25 Native American tribes in Border Region
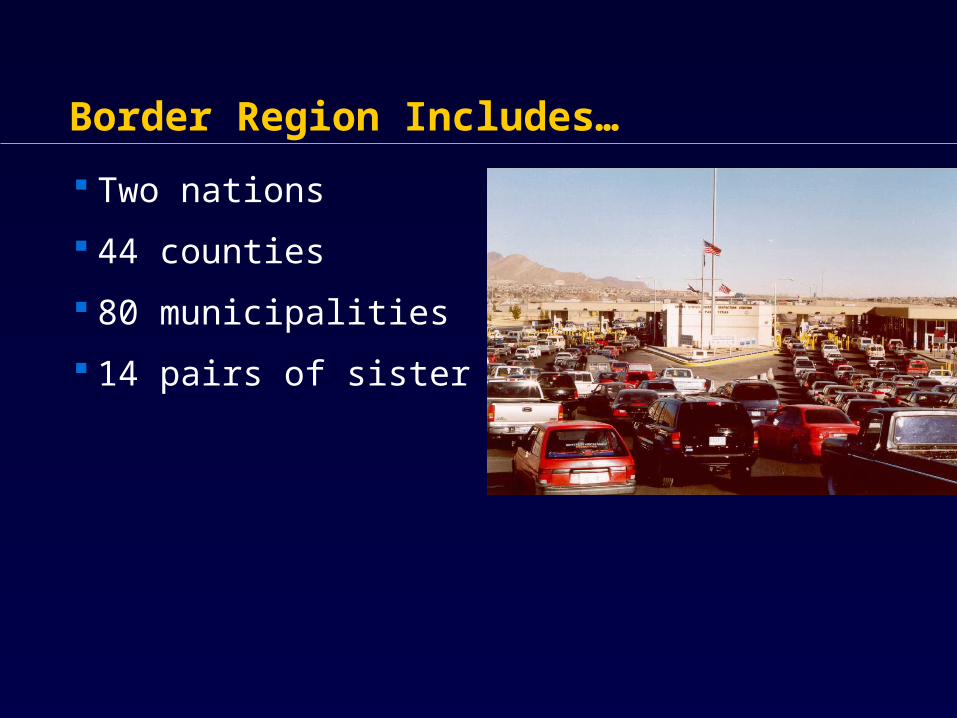
Border Region Includes…
Two nations
44 counties
80 municipalities
14 pairs of sister cities
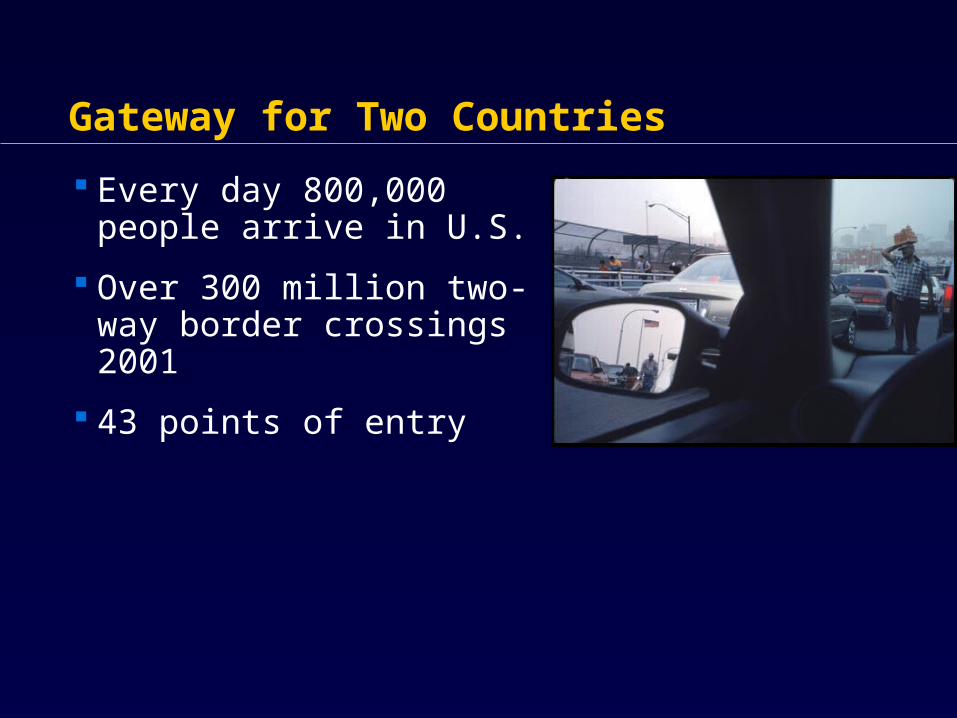
Gateway for Two Countries
Every day 800,000 people arrive in U.S.
Over 300 million two-way border crossings 2001
43 points of entry
Southwest States Profile
Proportion of smoking, lack of physical activity, and obesity among Hispanics/Latinos in 4 border states much greater than the US Hispanic/Latino population
Southwest States Profile
Avg. yearly income $14,560
3 of 10 poorest counties in U.S.
Almost ½ of the counties economically distressed
1,200 rural colonias with over 432,000 inhabitants—TX & NM
Unemployment 250-300 percent higher

Southwest States Profile
If the border region were a state, it would rank…
Last in per capita income
First in numbers of school children living in poverty
First in numbers of children uninsured

Southwest States Profile
Last in access to health care
Second in death rates hepatitis
Third in diabetes deaths
High alcohol consumption

Alcohol Use Among Hispanic/Latinos
U.S. born are 3 times more likely todrink and drive than those born inother countries but living in the U.S
Abstention reported greater amongwomen immigrants to USA*
Mexican-Americans have second highest alcohol-related fatality rates
Level of alcohol use strongly associated with illicit drug use (2003) and tobacco use
Source: NSDUH, 2003Gilbert, J. Alcohol consumption patterns in immigrant and later generation Mexican American women. Hispanic Journal of Behavioral Sciences 9 (3): 299-313, 1987

Border Region Assets/Opportunities
Culturally rich region
Strong sense of community
Grassroots self-help initiatives
Promotora model
Ranks better on some health-related behaviors and outcomes than rest of U.S.
Protective effect of cultural preservation/low acculturation
Commitment and expertise of state and local health depts.
Opportunities/Objectives for OSH
Address disparities in the border region
Build capacity
Collaboration and linkage with other health salient health issues in border region
Compatibility with STEPS awards
Accelerate inclusion of tobacco in BHC(Border Health Commission) 2010 HP Objectives

Border Region Opportunities and OSH Initiatives
TM
2005 National Conference on Tobacco or HealthMay 4, 2005
Nisha Gupta, MPHOffice on Smoking and Health

Hispanic LatinoAdult Tobacco Survey
Ralph Caraballo, PhD, MPHOffice on Smoking and Health
2005 National Conference on Tobacco or HealthMay 4, 2005
TM
Topics
Background of Hispanic/LatinoAdult Tobacco Survey (ATS)
Development Hispanic/Latino ATS
Latino ATS Cognitive Testing
Conduct survey with Latino ATS in 2006
End Products as a result of Latino ATS

Latino ATS: What Is It?
A questionnaire that can be used for surveillance and evaluation purposes
Used state-based ATS questionnaire as a template

Latino ATS Questionnaire Sections
Cigarette Smoking
Smoking Cessation
Secondhand Smoke Exposure
Risk Perception and Social Influences
Demographics
CORE
ATS Questionnaire Sections (cont.)
Other questions can be added for specific purposes
– Tobacco Use (Other tobacco products)
– Policy Issues
– Parental Involvement
– Media Exposure
– Additional Demographic Items
– Other selected topics

Latino ATS: How It’s Used?
Can provide surveillance and evaluation data at state, regional and community (local) level
Can direct culturally appropriate program planning, evaluation and policy development
May serve to develop culturally appropriate prevention programs

Modifications to State ATS
Expert Panel identified several tobacco-related needs for Latinos
Expert input on modifications to ATS
Suggested changes implemented
The final survey included 58 items:
– 35 original items
– 4 original items modified
– 19 new items added to questionnaire
Key Added Questions to Latino ATS
Cessation Section– In the past 12 months, have you seen a
• medicine Man (curandero)
• santero
• spiritist (Espiritista)
• herbalist (yerbero)
• religious leaders (priest, pastor, rabbi)
• other non-health professionals to help you quit smoking?

Key Added Questions to Latino ATS
Demographics– With which group do you identify yourself (please
select only one)?1. Mexican, Mexican American, Chicano2. Puerto Rican3. Cuban4. Other Caribbean5. Central American6. South American7. Spanish, from Spain8. Mixed Latino9. Other (specify): __________

Key Added Questions to Latino ATS
Demographics– What is your country of birth?
1. Argentina 12. Honduras2. Bolivia 13. Mexico3. Brazil 14. Nicaragua4. Chile 15. Panama5. Colombia 16. Paraguay6. Costa Rica 17. Peru7. Cuba 18. Puerto Rico8. Dominican Republic 19. Spain9. Ecuador 20. Uruguay10. El Salvador 21. Venezuela11. Guatemala 22. United States
23. Other (specify): ____________

Key Added Questions to Latino ATS
Demographics– How old were you when you first came to live in
the United States?AGE: ________
Key Added Questions to Latino ATS
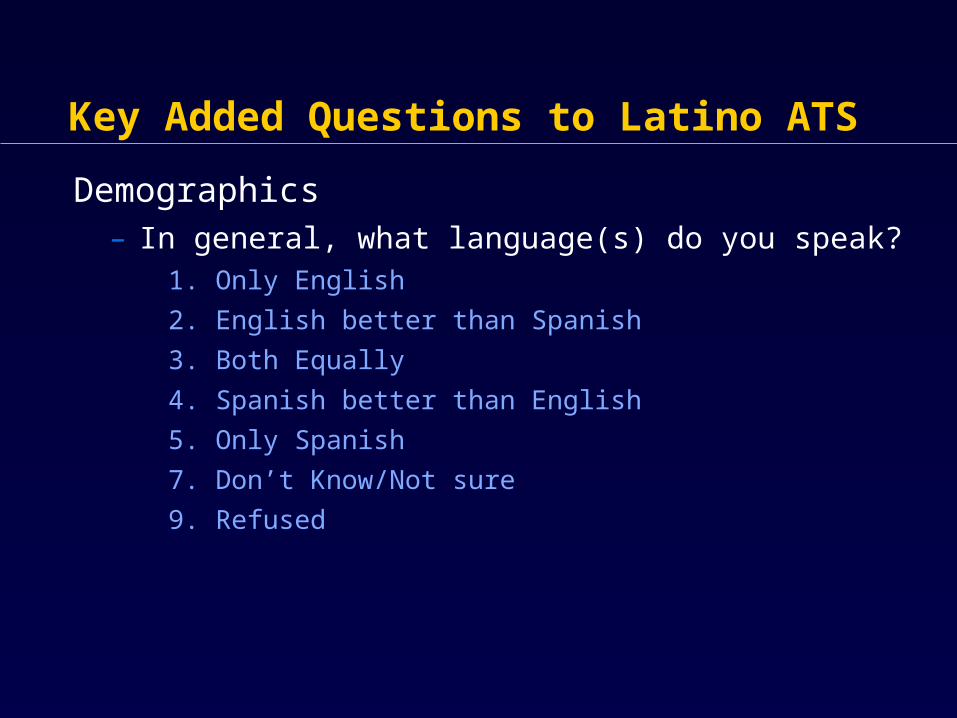
Demographics– In general, what language(s) do you speak?
1. Only English
2. English better than Spanish
3. Both Equally
4. Spanish better than English
5. Only Spanish
7. Don’t Know/Not sure
9. Refused

Cognitive Testing of Hispanic/Latino ATS Round 1 (end of 2004 and beginning of 2005)
– Chicago, Illinois
– El Paso, Texas
Round 2 (March and April 2005)
– New York city, New York
– Miami, Florida
A total of 80 interviews

Cognitive Testing of Hispanic/Latino ATSRound 1: Chicago, Illinois and El Paso, Texas
– 40 completed interviews• 28 in Chicago• 12 in El Paso
– 35 interviews in Spanish and 5 in English• 14 Mexicans 3 Honduras• 5 Guatemalan2 Dominican Republic• 4 Puerto Ricans 2 Ecuador• 4 Colombians 2 Peru• 3 Salvadorians 1 Cuban

Cognitive Testing of Hispanic/Latino ATSRound 1: Chicago, Illinois and El Paso, Texas
– Breakdown by Gender:
• Males: 14
• Females: 26

Cognitive Testing of Hispanic/Latino ATSRound 1: Chicago, Illinois and El Paso, Texas
– Breakdown by Education:
• 0 – 8th grade: 7
• 9 – 11th grade: 4
• HS (or GED): 10
• 13+: 19
Cognitive Testing of Hispanic/Latino ATSRound 1: Chicago, Illinois and El Paso, Texas
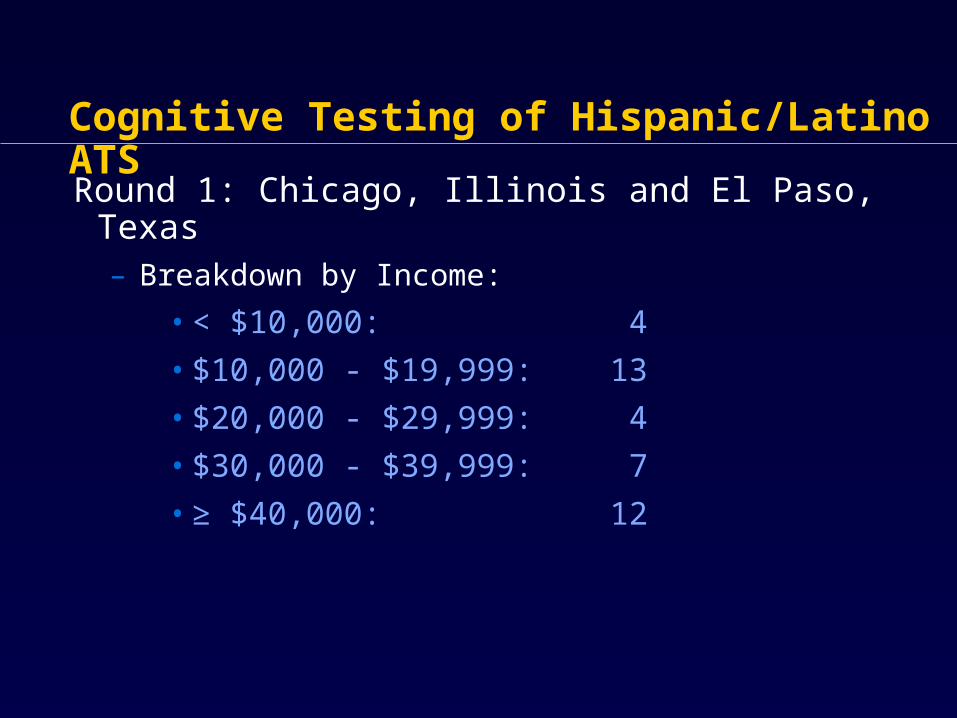
– Breakdown by Income:
• < $10,000: 4
• $10,000 - $19,999: 13
• $20,000 - $29,999: 4
• $30,000 - $39,999: 7
• ≥ $40,000: 12
Cognitive Testing of Hispanic/Latino ATSRound 1: Chicago, Illinois and El Paso, Texas
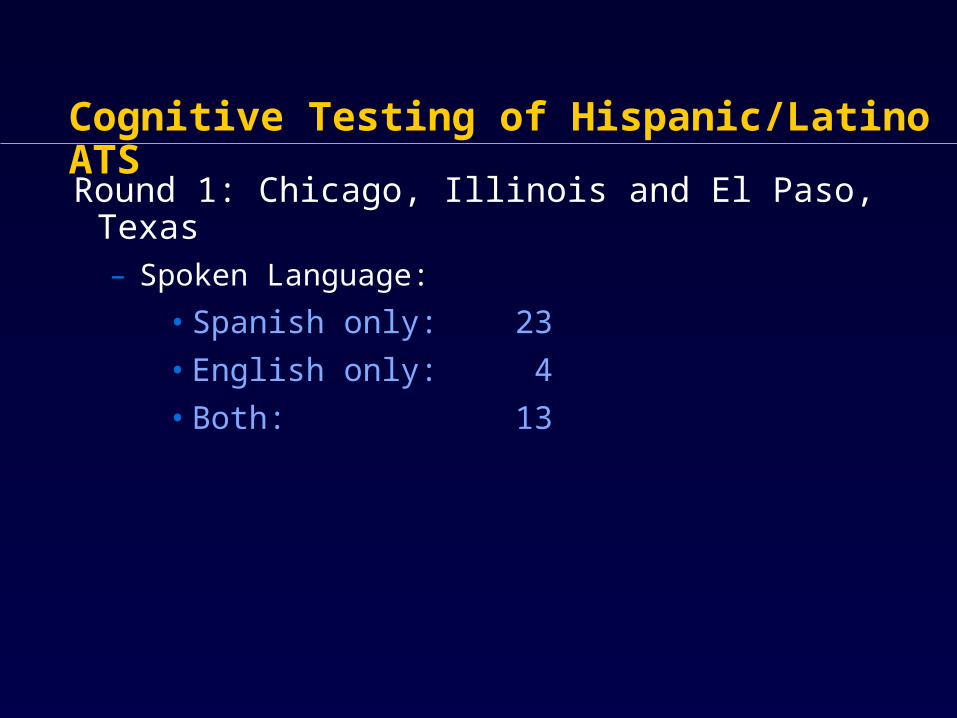
– Spoken Language:
• Spanish only: 23
• English only: 4
• Both: 13

Cognitive Testing of Hispanic/Latino ATSRound 1: Chicago, Illinois and El Paso, Texas
– Cigarette Smoker?:
• Yes: 16
• No: 24
Findings From the Cognitive Interviews Terminology
Secondhand Smoke Exposure
Policy Issues
Demographic Items

Findings From the Cognitive InterviewsTerminology Would you say that breathing smoke from
other people’s cigarettes causes sudden infant death?
– The word “crib death” was better understood by participants compared to the word “sudden infant death syndrome”
Findings From the Cognitive InterviewsSecondhand Smoke Exposure How concerned are you about the health
impact of breathing smoke from other people’s cigarettes?
– Not worried answers mean different things. Some are not worried because never exposed; others because smokers themselves; others don’t think it’s so bad.

Findings From the Cognitive InterviewsPolicy Issues When a smoking policy is already in place
there is no meaning for a “stronger workplace policy.”Most participants support strong enforcement.

Findings From the Cognitive InterviewsDemographic Items Which one or more of the following would you
say is your race?– Need to include Hispanic/Latino as a category as
well

Next Steps
Finalize cognitive testing (2005)– New York city, New York
– Miami, Florida
Finalize Spanish and English questionnaires (2005)
Develop a Latino ATS Instructional Manual (2005)
Make Latino ATS questionnaire and manual available (2006)
Conduct Latino ATS surveys in 3 locations (2006)– El Paso, TX (face-to-face)
– New York city, NY (telephone)
– Miami, FL (telephone)

Overview: Tobacco-Related Disparities Among Hispanics/Latinos
TM
Any questions?
Recommended


![Introductory video [click here] Black Hispanics? “Hispanics come in all colors and shapes. There are Asian Hispanics, white Hispanics, black Hispanics](https://img.dokumen.tips/doc/110x75/56649c825503460f9493a192/introductory-video-click-here-black-hispanics-hispanics-come-in-all-colors.jpg)