@EducateIN
Overcoming Data:
Session One

@EducateIN
Is data
scary?
Welcome and Introductions
Agenda:
• Welcome and intros
• Review of pre-work
questions
• Review foundations of
assessment
• Review components of ISRs
• Reflect on key points in your
ISRs
• Actions!

@EducateIN
Welcome!
Four sessions:
● Start with ISRs and individual reporting
● Focus on aggregate reports and how to manage
expectations for groups of students

@EducateIN
Introductions
In the chat, tell us a little bit about yourself!
● What is your name?
● What is your role (classroom teacher, building administrator,
data coach, etc.)?
● What corporation do you work for?
● What are you hoping to get out of this training?

@EducateIN
Pre-Work
Discuss the outcomes from your pre-work activity.
• What types of assessments do you provide in your classroom?
• What do you see as the values of these assessments? In
other words, why do you give them?
• What do you commonly do with the data after you give an
assessment?
@EducateIN
Foundations of AssessmentWhy do we ask the questions?
@EducateIN
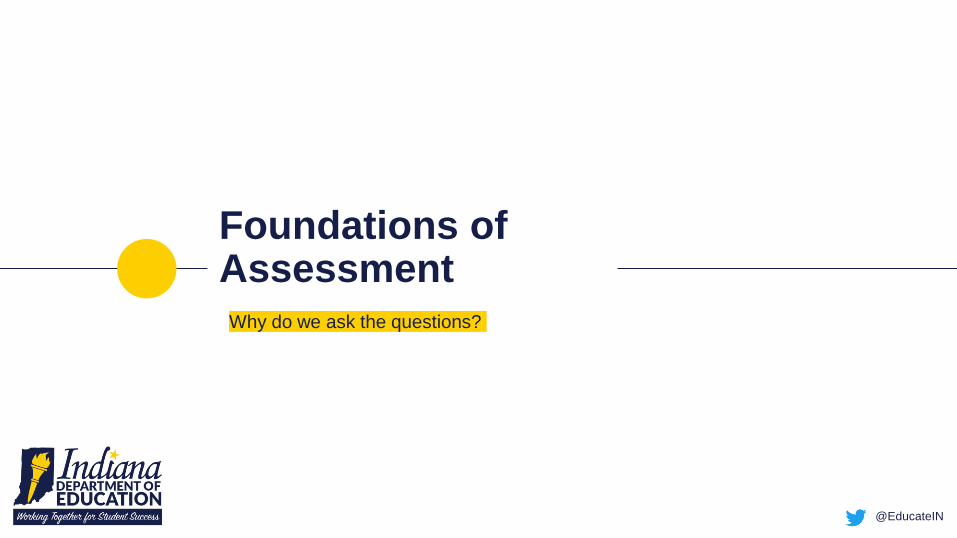
What is assessment?
• Cognition: Aspects of achievement to be assessed
• Observation: Tasks used to collect evidence
• Interpretation: Methods used to analyze the evidence collected
• Every assessment is based on theory about how people learn, what they know, and how this understanding may change over time.
@EducateIN
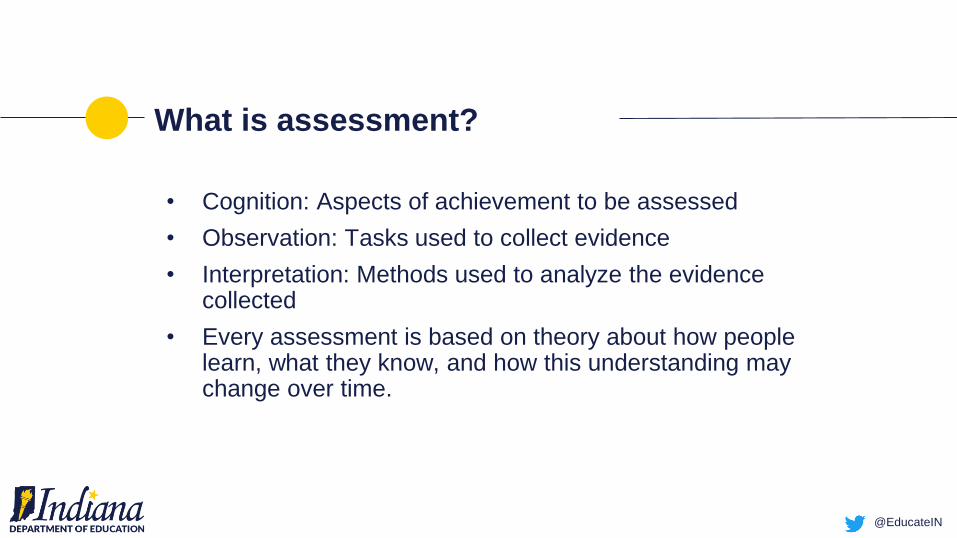
How did assessment begin?
• First standardized assessment in Massachusetts in 1800s
○ Served two purposes:
■ Enable external authorities to monitor school systems
■ Classification of students in pursuit of more efficient learning
• What do you view as the purpose of standardized assessment now?
• Are there certain populations that assessments best serve or the data can help inform?
@EducateIN
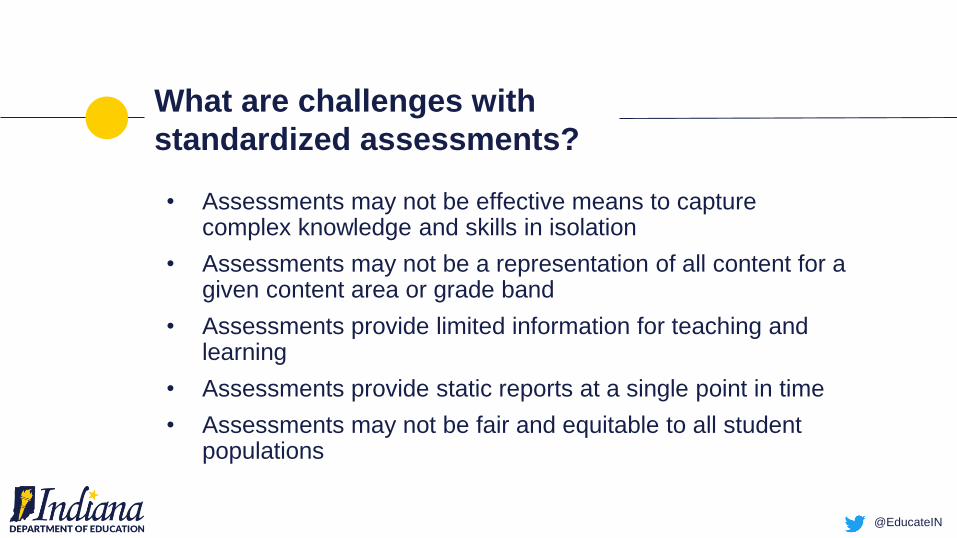
What are challenges with
standardized assessments?
• Assessments may not be effective means to capture complex knowledge and skills in isolation
• Assessments may not be a representation of all content for a given content area or grade band
• Assessments provide limited information for teaching and learning
• Assessments provide static reports at a single point in time
• Assessments may not be fair and equitable to all student populations

@EducateIN
Reflection
• Have you identified certain content that is difficult to assess and therefore to know if students have mastered knowledge or skills?
• How can educators gather additional information to make stronger and more valid interpretations about what a student knows?

@EducateIN
How does a standardized
assessment make these
inferences?
• Sampling content○ Fixed form blueprint—strengths/weaknesses?
○ CAT blueprint—strengths/weaknesses?

@EducateIN

@EducateIN
Key Components in the ISRWhat do they mean?

@EducateIN
Understanding the Individual Student Report (ISR)
● Scale Score● Proficiency Level● Reported Lexile®
(ELA) or Quantile® (Mathematics) Measure
● College and Career Readiness Indicator
Scale Score: Represents the student’s overall numerical score placed on an alternative scale rather than just using percent correct or raw score.
Proficiency Level: Indicates which proficiency level the student is placed into based on the overall scale score. There are four proficiency levels for ILEARN. These include Below Proficiency, Approaching Proficiency, At Proficiency, and Above Proficiency.
Reported Lexile® Measure (ELA only): Represents the student’s reading ability and serves as a guide in selecting books.Reported Quantile® Measure (Mathematics only): Represents the student’s mathematics skills and helps identify activities to support the student in gaining mathematical skills and understanding.
College and Career Readiness Indicator: Indicates whether the student meets the college-and-career readiness standards.
@EducateIN
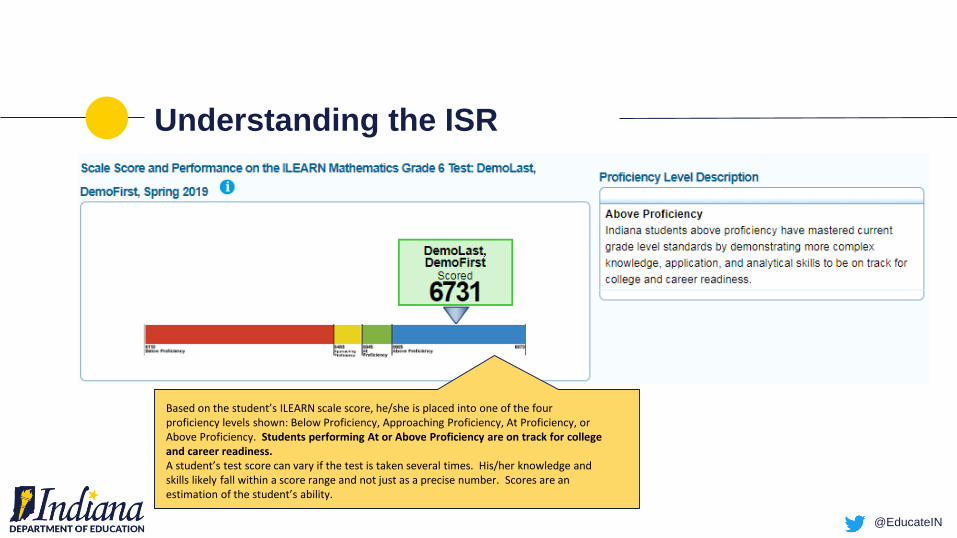
Based on the student’s ILEARN scale score, he/she is placed into one of the four proficiency levels shown: Below Proficiency, Approaching Proficiency, At Proficiency, or Above Proficiency. Students performing At or Above Proficiency are on track for college and career readiness.A student’s test score can vary if the test is taken several times. His/her knowledge and skills likely fall within a score range and not just as a precise number. Scores are an estimation of the student’s ability.
Understanding the ISR
@EducateIN
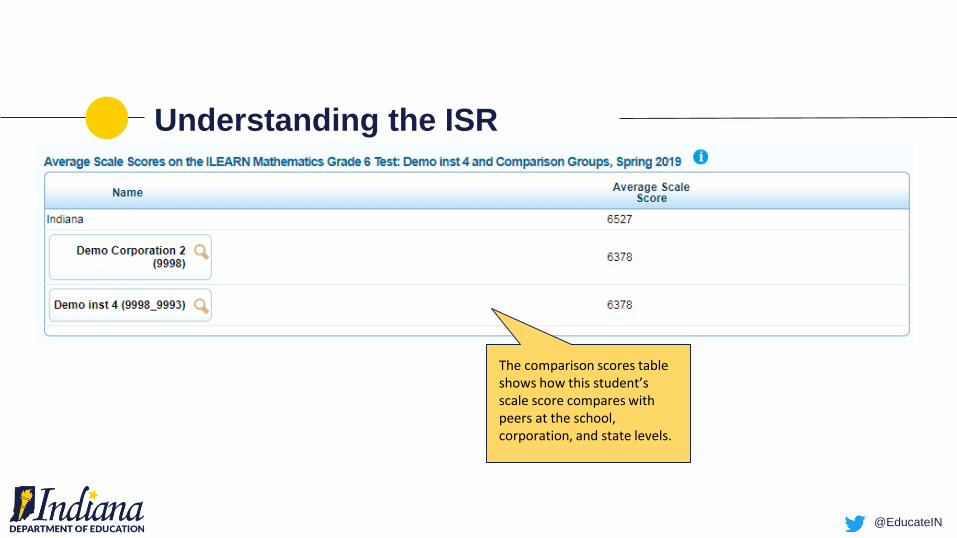
The comparison scores table shows how this student’s scale score compares with peers at the school, corporation, and state levels.
Understanding the ISR
@EducateIN
Understanding the ISR
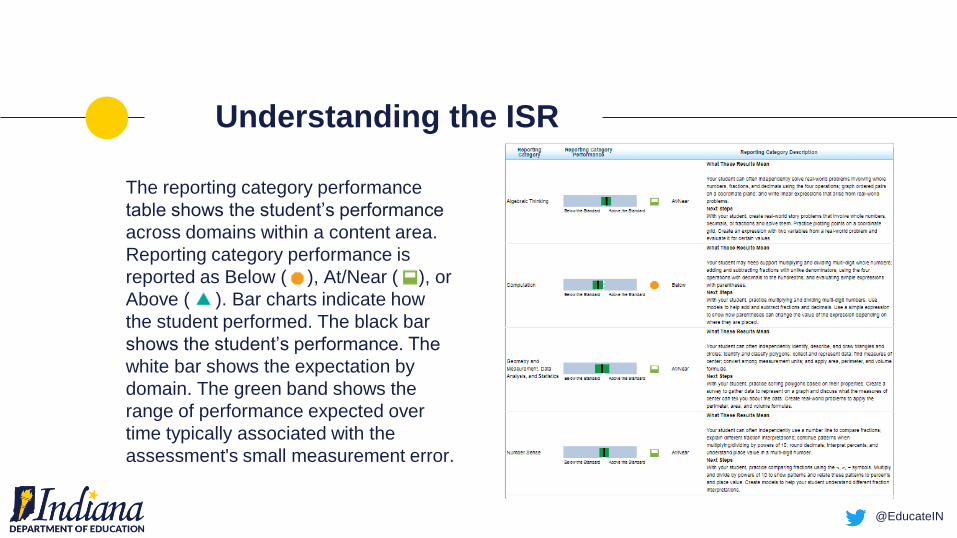
The reporting category performance
table shows the student’s performance
across domains within a content area.
Reporting category performance is
reported as Below ( ), At/Near ( ), or
Above ( ). Bar charts indicate how
the student performed. The black bar
shows the student’s performance. The
white bar shows the expectation by
domain. The green band shows the
range of performance expected over
time typically associated with the
assessment's small measurement error.

@EducateIN
English/Language Arts reports include descriptions of the student's performance on the Performance Task (i.e., writing portion). If a condition code appears, the student’s response could not be scored. Unscorable responses include responses that are blank, insufficient, written in a non-scorable language, off-topic, off-purpose, or illegible. In this example, the sixth grade student earned a scale score of 5587, At Proficiency.
Understanding the ISR
@EducateIN
Reflect and Respond to
Students
● Pull out one of your student ISRs.
● Reflect on:
○ Where is this student on the continuum toward proficiency?
The reporting category performance graph will help you identify
this information.
○ Using the Lexile and Quantile levels, are there certain
resources in your room you might review based on their level of
performance? What are some examples of places you could
look? Use an asset based model (build on the identified
strengths of the student to leverage your instruction to facilitate
the filling of knowledge gaps)
@EducateIN
CAUTIONS
● These results are a snapshot and should be combined
with other quality, valid, and reliable data you collect as
a classroom teacher.
● Small groups should be fluid and students should move
in and out of groups based on skills.
● ALL students should consistently be provided grade
level material and assignments in order maintain a
culture of high expectations.
@EducateIN
Reflect and Respond to
Parents
● Help parents understand where the student is on the
continuum toward proficiency? The reporting category
performance table will help you explain this information.
● Always use an asset based model when discussing students
● Encourage a growth mindset- they may not be there YET-
but they will get there
@EducateIN
Preparing for Session TwoWhat should I review and consider for next time?

@EducateIN
Next Time
We will focus on standard-level reporting.
Post-work:
◉ Choose five ISRs from your classroom and think about
points you would discuss with the parent or student about
what the ISR is telling them.
◉ Post these points PRIOR to the meeting session. Student
identifiable information should not be included. We only want
a brief summary of the areas or examples that you might use
for discussion.
Recommended