1
Transitioning Towards Environmentally Sustainable Growth in Asia & the Pacific:
Key issues, progress and drivers of change
Asia Environment Lecture
Bindu N. Lohani
Vice President for Knowledge Management & Sustainable Development
Asian Development Bank 1
Outline
1 Asia 2050: what does the future look like?
2 Shaping development: environmental policies and the sustainability agenda
3 Environmental issues: current status, trends and drivers
4 Transitioning to green growth: important approaches
5 Knowledge Management and the Environment
2
2
I. LOOKING TO ASIA 2050
What progress has been made in development in Asia-Pacific?
What does the future of Asia look like in 2050?
3
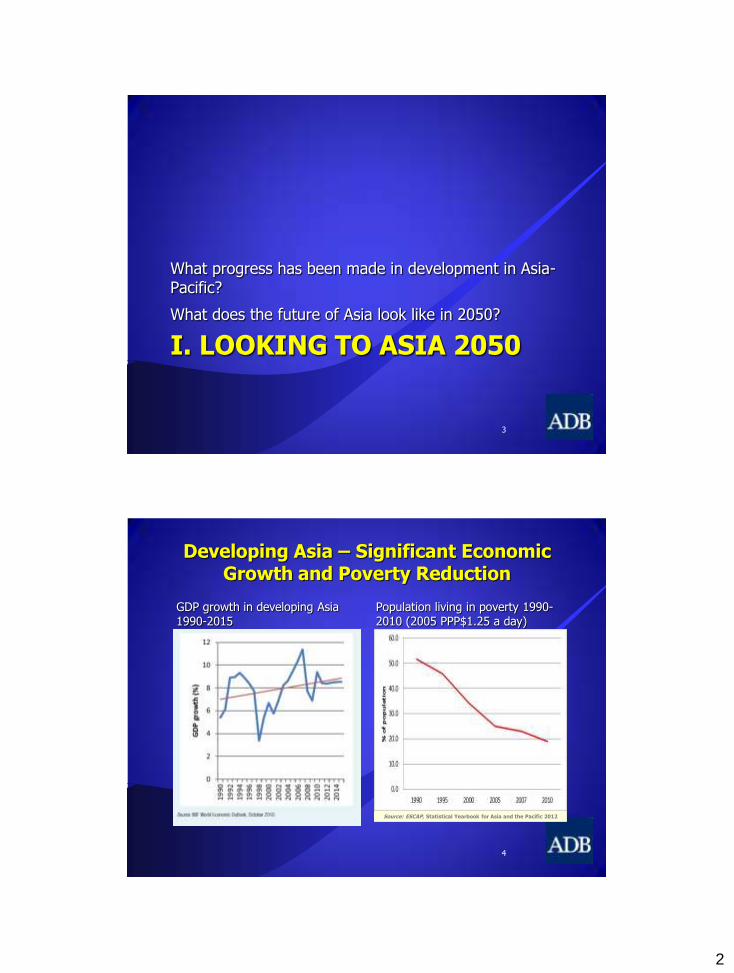
Developing Asia – Significant Economic Growth and Poverty Reduction
GDP growth in developing Asia 1990-2015
Population living in poverty 1990-2010 (2005 PPP$1.25 a day)
Source: ESCAP, Statistical Yearbook for Asia and the Pacific 2012
4

3
GDP growth and inequality
5
y = 0.6948x - 4.9101 R² = 0.0962
-25
-20
-15
-10
-5
0
5
10
15
0.0 2.0 4.0 6.0 8.0 10.0 12.0 14.0 16.0
Ch
an
ge
in
Gin
i (e
arl
y 1
99
0s t
o l
ate
st)
Average annual GDP growth (early 1990s to late 2000s)
GDP growth vs change in Gini coefficient
Economic growth & the environment
Data source: ESCAP (2013) http://www.unescap.org/stat/data/statdb/DataExplorer.aspx
0
5000000
10000000
15000000
20000000
0
1
2
3
4
5
1990
1991
1992
1993
1994
1995
1996
1997
1998
1999
2000
2001
2002
2003
2004
2005
2006
2007
2008
2009
Asia-Pacific - CO2 emissions
Tonnes per capita Thousand metric tonnes (total)
0
5000
10000
15000
20000
25000
30000
35000
40000
45000
1990
1991
1992
1993
1994
1995
1996
1997
1998
1999
2000
2001
2002
2003
2004
2005
2006
2007
2008
2009
Thousa
nd t
onnes
PRC (China) - SO2 Emissions
0
5000000
10000000
15000000
20000000
25000000
30000000
1990
1991
1992
1993
1994
1995
1996
1997
1998
1999
2000
2001
2002
2003
2004
2005
2006
2007
2008
2009
Mill
ion P
PP inte
rnational
dolla
rs (
2012)
Asia-Pacific – GDP (Total at PPP)
0
20
40
60
80
100
120
140
1990
1991
1992
1993
1994
1995
1996
1997
1998
1999
2000
2001
2002
2003
2004
2005
2006
2007
2008
2009
Mic
rogra
ms
per
m3 (
ave
rage)
PRC (China) - Urban PM10 Concentration
WHO (2005) AQG - 20 μg/m3 annual mean
6

4
Millennium Development Goals - Progress
7
Country groups on and off track for the MDGs
Source: UNESCAP, ADB & UDP (2013)
Progress in MDG 7 in Selected Countries
REGION COUNTRY FOREST
COVER
PROTECTED
AREA
CO2
EMISSIONS
ODP
SUBSTANCE
CONSUMPTION
SAFE
DRINKING
WATER
BASIC
SANITATION
EAST ASIA CHINA
MONGOLIA
SOUTHEAST
ASIA
INDONESIA
LAO PDR
PHILIPPINES
VIET NAM
SOUTH ASIA
BANGLADESH
INDIA
MALDIVES
NEPAL
CENTRAL ASIA
PAKISTAN
KAZAKHSTAN
UZBEKISTAN
PACIFIC
PAPUA NEW
GUINEA
TONGA
Early achiever On track Slow Regressing/No progress
Source: Asia Pacific MDG Report 2012 8

5
9
Asia, 52%
North
America, 13%
Latin
America & Caribbean,
10%
Europe,
18%
Sub
Saharan Africa, 2%
Middle East
& North Africa, 3%
Rest of
World, 2%
Asian Century Scenario: 2050
GDP at market exchange rate (Trillion)
World 333
Asia 174
United States 38
GDP per capita at constant PPP
World 37,300
Asia 40,800
United States 94,900
Asian century driven by Asia 7: India, Indonesia, Japan, Malaysia, PRC, Republic of Korea, and Thailand projected to account for 90% of Asia’s growth between 2010 and 2050.
LOOKING AHEAD ASIA 2050 - The Asian Century?
0.0%
2.0%
4.0%
6.0%
8.0%
10.0%
12.0%
1960-1970 1970-1980 1980-1990 1990-2010
GD
P G
row
th R
ate
Asian Growth Rates
Japan
NIC's
China & India
• Asia began to re-emerge after 1950, spurred first by Japan, then NICs
• Starting in 1980s, first PRC then India, Indonesia and Viet Nam, gave further boost
10
Re-Emergence of Asia
• Asia accounted for about 60% of world economy before Industrial Revolution
• In the following two centuries, Asia’s share declined to 15%
• Asia’s share today is 28%
PRC & India
Asia’s Share of Global GDP, 1700-2010

6
11
Avoiding the
Middle Income Trap
• Inclusive growth and creation of large middle class
• Sound and efficient financial systems
• Technologically capable, skilled labor force
• Specialization to gain competitiveness
• Corruption under check
• Inequities within countries (e.g. across geographical regions, rural vs. urban) major risks to social stability
• Disparities across countries increase risks: migration; tensions and even conflict
• Regional cooperation necessary to mitigate such risks
Addressing Inequities
and Disparities
• Urban poverty
• Environmental stress and climate change
• Strain on urban mobility
• Need for livable cities
Massive
Urbanization
Asia Faces 6 MEGA Challenges
• Gap between region’s advanced and least-developed economies larger than in any other region – region must find ways to spread prosperity
• Disparities left unaddressed will create significant risks
12
• Environmental constraints to growth – eg clean water • Climate change impacts eg. extreme floods • Opportunities for new growth model
eg – green jobs & sustainable consumption
Environment & Climate Change
Global Competition
for Finite Resources
• Increasing affluence could lead to unsustainable pressure on finite natural resources
• Growth patterns and lifestyle must change dramatically
Asia Faces 6 MEGA Challenges
Disparities across
Countries and Subregions
7
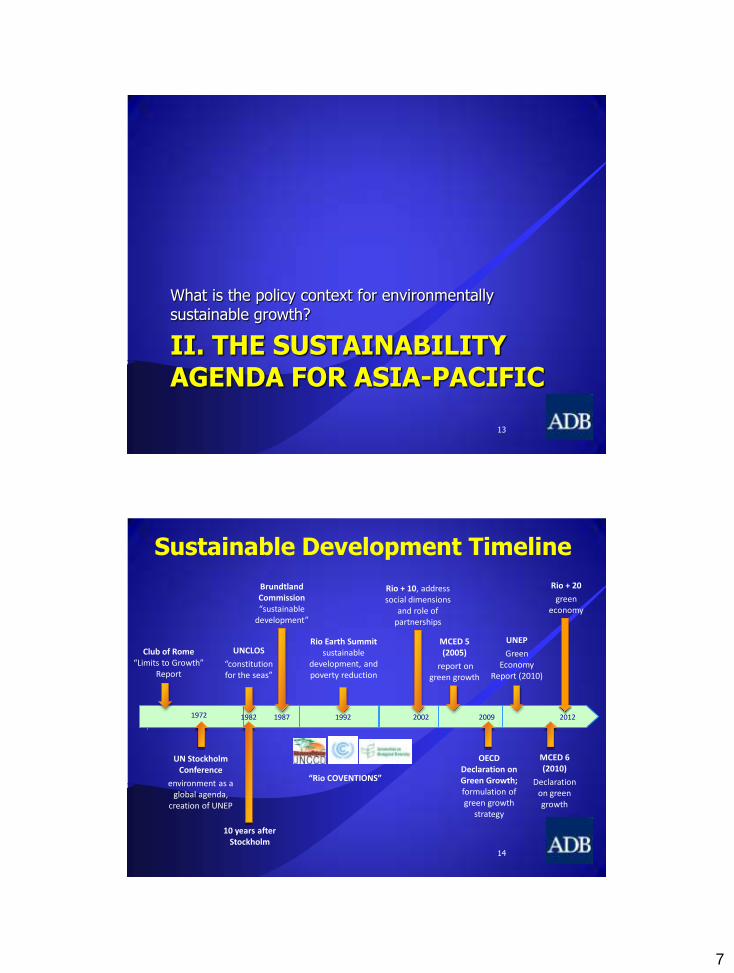
II. THE SUSTAINABILITY AGENDA FOR ASIA-PACIFIC
What is the policy context for environmentally sustainable growth?
13
Club of Rome “Limits to Growth”
Report
Rio + 20
green economy
1987 1992 2002 2009 1972 2012
Brundtland Commission “sustainable
development”
Rio Earth Summit sustainable
development, and poverty reduction
OECD Declaration on Green Growth; formulation of green growth
strategy
UN Stockholm Conference
environment as a global agenda,
creation of UNEP
Rio + 10, address social dimensions
and role of partnerships
MCED 5 (2005)
report on green growth
MCED 6 (2010)
Declaration on green growth
UNEP
Green Economy
Report (2010)
Sustainable Development Timeline
UNCLOS
“constitution for the seas”
1982
10 years after Stockholm
“Rio COVENTIONS”
14
8
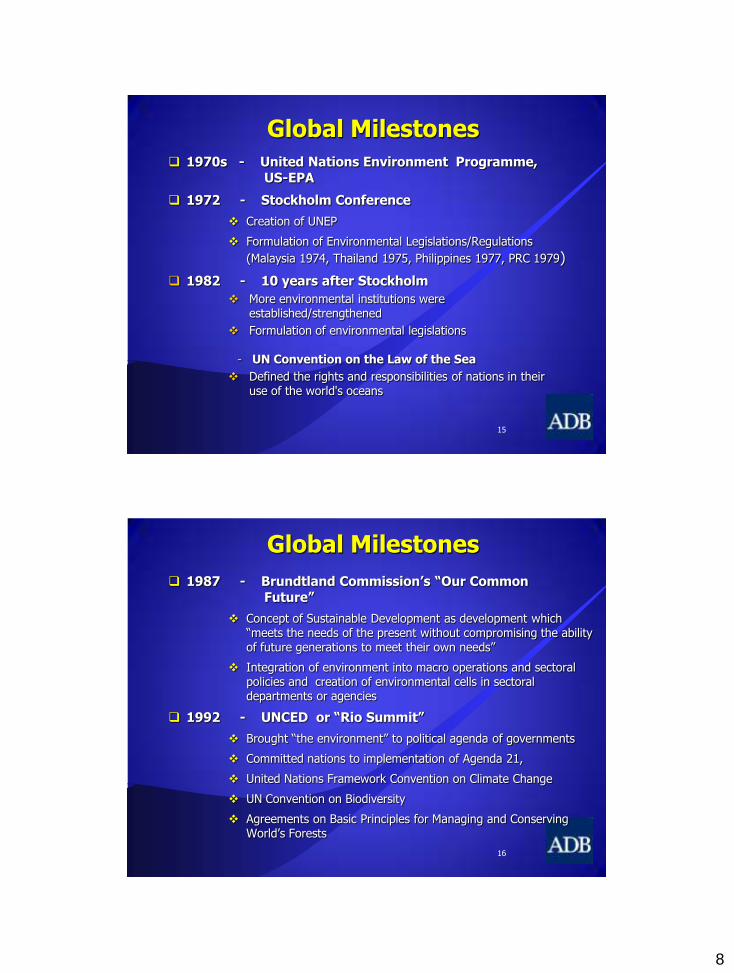
Global Milestones
1970s - United Nations Environment Programme, US-EPA
1972 - Stockholm Conference
Creation of UNEP
Formulation of Environmental Legislations/Regulations
(Malaysia 1974, Thailand 1975, Philippines 1977, PRC 1979)
1982 - 10 years after Stockholm
More environmental institutions were established/strengthened
Formulation of environmental legislations
- UN Convention on the Law of the Sea
Defined the rights and responsibilities of nations in their use of the world's oceans
15
1987 - Brundtland Commission’s “Our Common Future”
Concept of Sustainable Development as development which “meets the needs of the present without compromising the ability of future generations to meet their own needs”
Integration of environment into macro operations and sectoral policies and creation of environmental cells in sectoral departments or agencies
1992 - UNCED or “Rio Summit”
Brought “the environment” to political agenda of governments
Committed nations to implementation of Agenda 21,
United Nations Framework Convention on Climate Change
UN Convention on Biodiversity
Agreements on Basic Principles for Managing and Conserving World’s Forests
Global Milestones
16

9
17
1994 - Convention to Combat Desertification
1997 - Kyoto Protocol
established legally binding obligations for developed countries to reduce GHG emissions
2002 - WSSD / Rio + 10
Stockholm Convention (POPs) in 2004
2006 - Stern Review
Helped galvanize attention to climate change among finance ministers
2009 - UNFCCC Copenhagen Accord (Climate Change)
Commitments on the establishment of a “Green Climate Fund”
Global Milestones
2009 - Declaration on Green Growth (OECD)
Pursue green growth strategies as part of response to crisis and beyond
2010 - Incheon Declaration on Green Growth (ESCAP)
strengthen efforts to purse green growth strategies as part of response to the current crisis and beyond”
ASEAN Leaders’ Statement on Sustained Recovery and Development – promote green growth, investments in long term sustainability and sustainable use of natural resources
PRC, Japan and Republic of Korea pursued green growth initiatives
2010 - Aichi Biodiversity Targets and Nagoya Protocol 20 ambitious targets on biodiversity Access to Genetic Resources and the Fair and Equitable Sharing of
Benefits Arising from their Utilization
18
Global Milestones
10
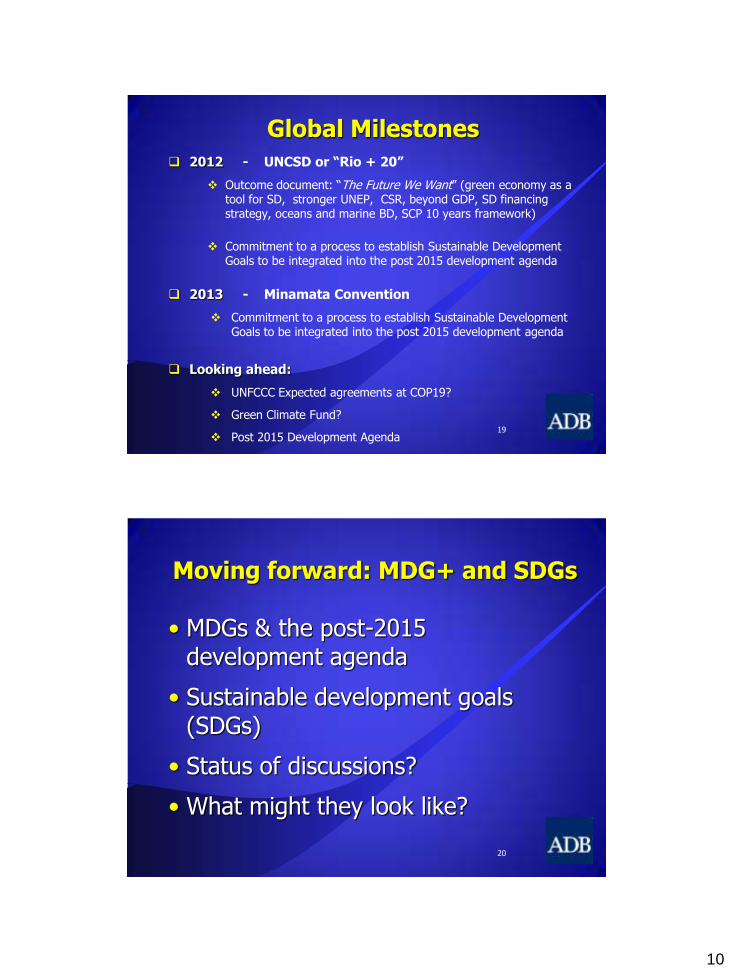
2012 - UNCSD or “Rio + 20”
Outcome document: “The Future We Want” (green economy as a tool for SD, stronger UNEP, CSR, beyond GDP, SD financing strategy, oceans and marine BD, SCP 10 years framework)
Commitment to a process to establish Sustainable Development
Goals to be integrated into the post 2015 development agenda
2013 - Minamata Convention
Commitment to a process to establish Sustainable Development Goals to be integrated into the post 2015 development agenda
Looking ahead:
UNFCCC Expected agreements at COP19?
Green Climate Fund?
Post 2015 Development Agenda
19
Global Milestones
Moving forward: MDG+ and SDGs
• MDGs & the post-2015 development agenda
• Sustainable development goals (SDGs)
• Status of discussions?
• What might they look like?
20

11
Post 2015 Agenda Three main types of proposals
Options Prospects
1) MDG+ (base case) Retain current 8 MDGs, which apply to
developing countries, but make MDG7 and MDG8 applicable to all countries.
Most discussion in the MDG HLP context falls into this category.
2) Integrated SD Model (MDG++) Adopt a broader set of 10-12 goals, that
include additions like access to energy, food security, governance etc.
Represent what many aspired to in the SDG discussion, but no practical proposals for action.
3) Transformational model Adopt a broader set of 10-12 goals (like
MDG++) . Plus, integrate all 3 dimensions of sustainability within each goal.
Attempts to capture the different domains within which poverty, inequality and sustainability can be addressed.
21
MDG+: Asia-Pacific goals?
22
12
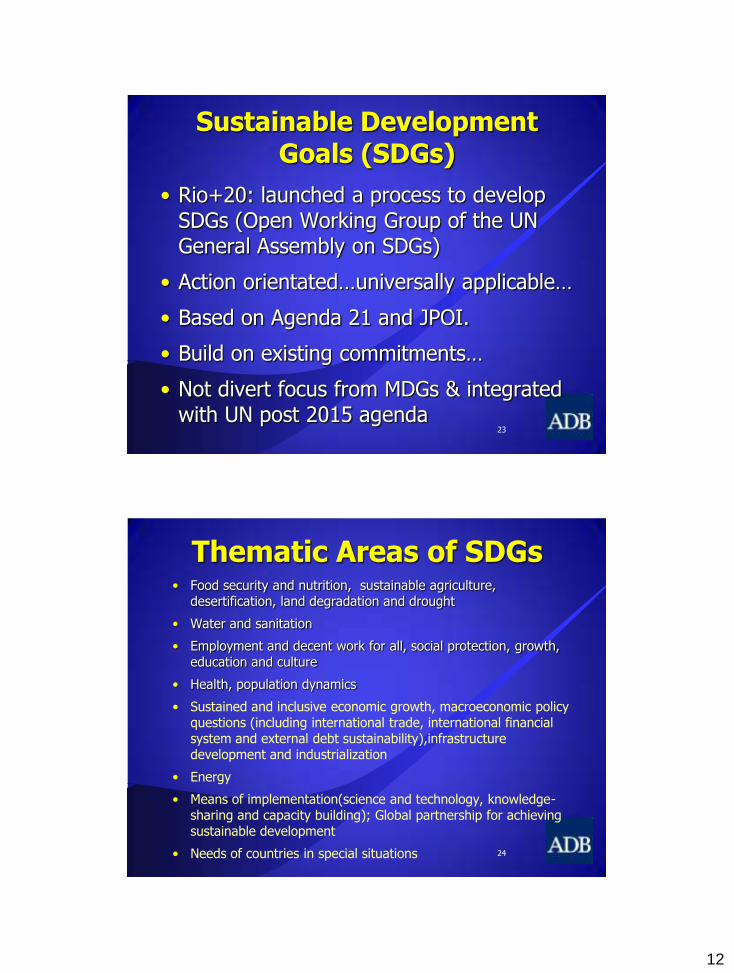
Sustainable Development Goals (SDGs)
• Rio+20: launched a process to develop SDGs (Open Working Group of the UN General Assembly on SDGs)
• Action orientated…universally applicable…
• Based on Agenda 21 and JPOI.
• Build on existing commitments…
• Not divert focus from MDGs & integrated with UN post 2015 agenda
23
Thematic Areas of SDGs • Food security and nutrition, sustainable agriculture,
desertification, land degradation and drought
• Water and sanitation
• Employment and decent work for all, social protection, growth, education and culture
• Health, population dynamics
• Sustained and inclusive economic growth, macroeconomic policy questions (including international trade, international financial system and external debt sustainability),infrastructure development and industrialization
• Energy
• Means of implementation(science and technology, knowledge-sharing and capacity building); Global partnership for achieving sustainable development
• Needs of countries in special situations
24
13
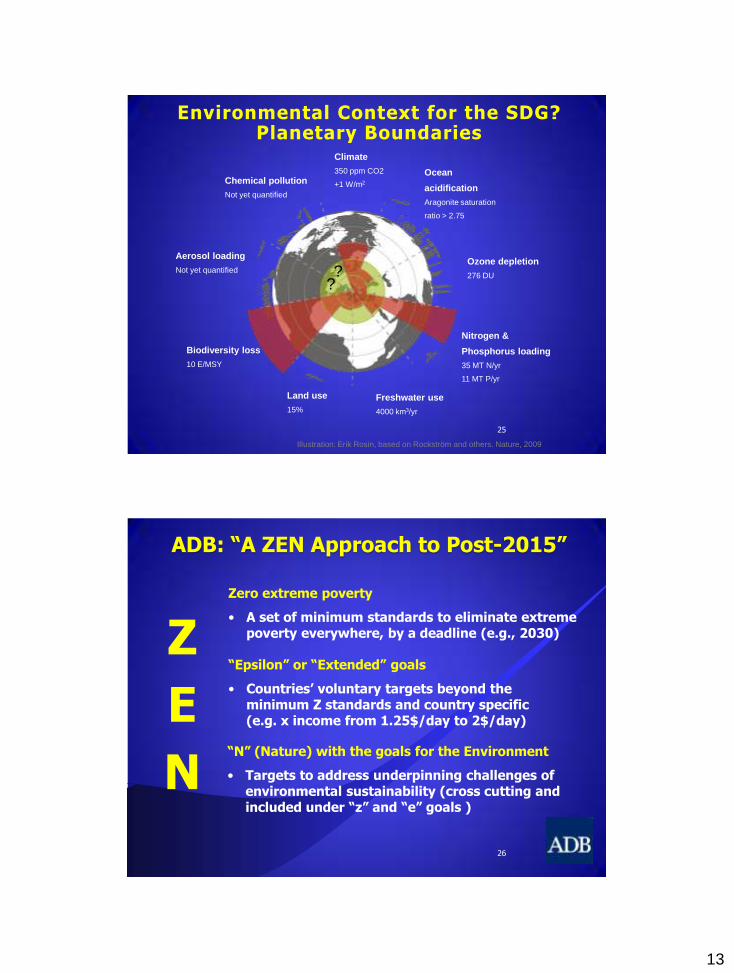
Illustration: Erik Rosin, based on Rockström and others. Nature, 2009
Climate
350 ppm CO2
+1 W/m2
Biodiversity loss
10 E/MSY
Land use
15%
Chemical pollution
Not yet quantified
Aerosol loading
Not yet quantified Ozone depletion
276 DU
Ocean
acidification
Aragonite saturation
ratio > 2.75
Nitrogen &
Phosphorus loading
35 MT N/yr
11 MT P/yr
? ?
Freshwater use
4000 km3/yr
Environmental Context for the SDG? Planetary Boundaries
25
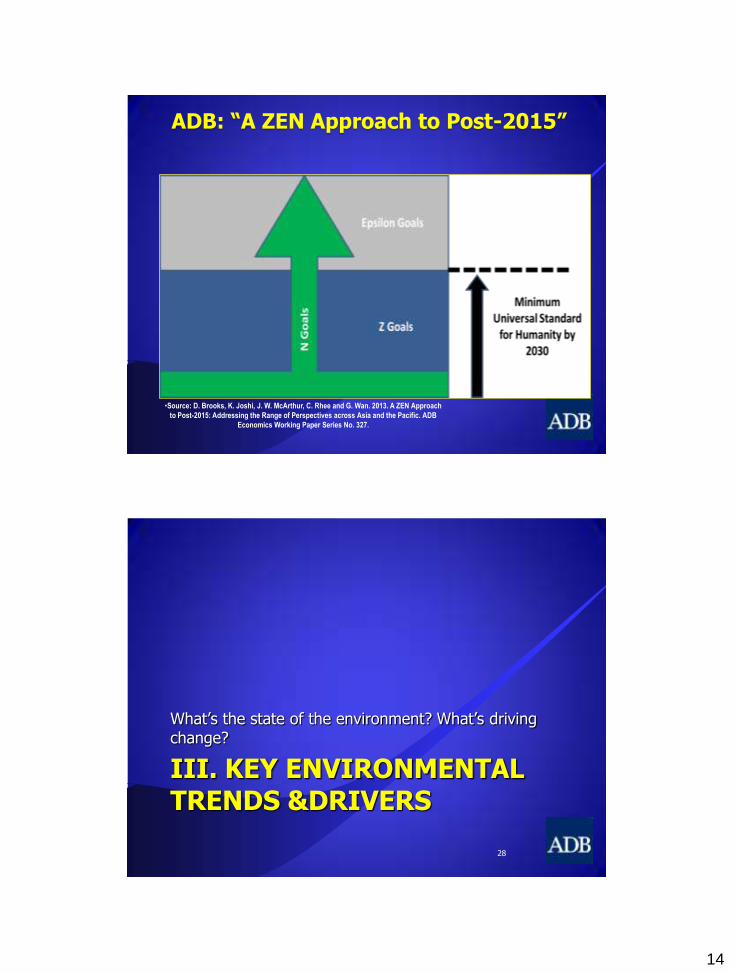
ADB: “A ZEN Approach to Post-2015”
Z
E
N
Zero extreme poverty
• A set of minimum standards to eliminate extreme poverty everywhere, by a deadline (e.g., 2030)
“Epsilon” or “Extended” goals
• Countries’ voluntary targets beyond the minimum Z standards and country specific (e.g. x income from 1.25$/day to 2$/day)
“N” (Nature) with the goals for the Environment
• Targets to address underpinning challenges of environmental sustainability (cross cutting and included under “z” and “e” goals )
26
14
•Source: D. Brooks, K. Joshi, J. W. McArthur, C. Rhee and G. Wan. 2013. A ZEN Approach
to Post-2015: Addressing the Range of Perspectives across Asia and the Pacific. ADB
Economics Working Paper Series No. 327.
ADB: “A ZEN Approach to Post-2015”
III. KEY ENVIRONMENTAL TRENDS &DRIVERS
What’s the state of the environment? What’s driving change?
28
15
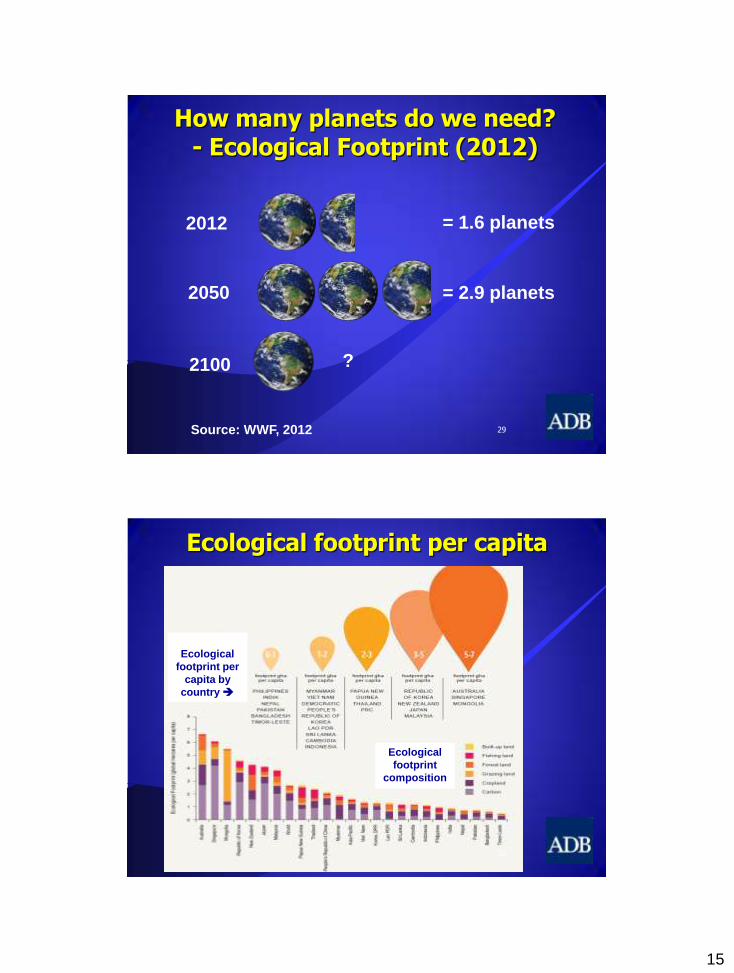
How many planets do we need? - Ecological Footprint (2012)
29
2012
2050
2100 ?
= 1.6 planets
= 2.9 planets
Source: WWF, 2012
Ecological footprint per capita
Ecological
footprint per
capita by
country
Ecological
footprint
composition
30

16
Environmental trends in Asia-Pacific
1. Energy: demand is projected to almost double in the Asia and Pacific region by 2030.
2. Transport: Asia’s fastest growing source of CO2. Vehicle fleet has more than doubled in the past decade.
3. Urban: 44 million people/yr are added to Asian cities.
4. Water: Demand is expected to significantly exceed sustainable supply in India and PRC by 2030.
5. Biodiversity: Key populations declined by 60% in 30 years. Trends likely to continue without mitigation
6. Climate vulnerability: 7 of the world’s 10 countries at greatest vulnerability to climate change and variability.
31
1. Energy: Developing Asia’s Share in Global Energy-Related CO2 Emissions
Rest of the Word 37%
63%
47%
Rest of the Word
53%
2010
Actual (World)
Total = 31,305 million tons CO2
2035
Projection (World)
Total = 43,220 million tons CO2
Source: ADB, APERC 2013
32
17
Hydro
2.5%
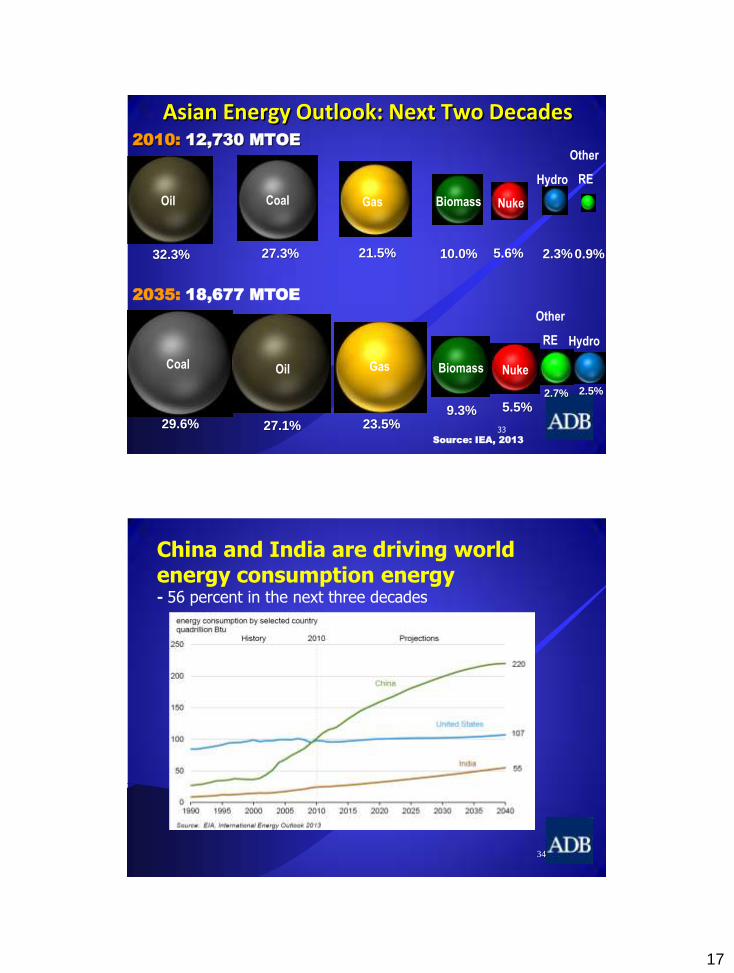
2010: 12,730 MTOE
32.3%
Oil
27.3%
Coal
21.5%
Gas
10.0%
Biomass
5.6%
Nuke
2.3% 0.9%
Other
RE
Source: IEA, 2013
2035: 18,677 MTOE
29.6%
Coal
27.1%
Oil
23.5%
Gas
9.3%
Biomass
5.5%
Nuke
2.7%
Other
RE
Hydro
Asian Energy Outlook: Next Two Decades
33
34
China and India are driving world energy consumption energy - 56 percent in the next three decades
18
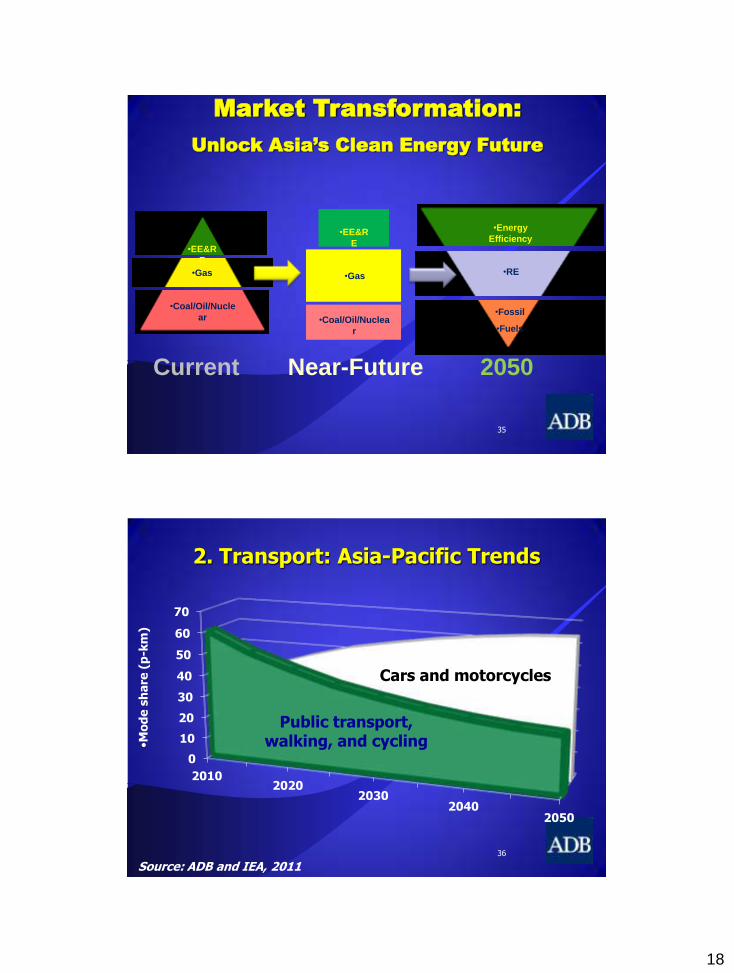
•Energy
Efficiency
•RE
•Fossil
•Fuels
2050
Market Transformation:
Unlock Asia’s Clean Energy Future
•EE&R
E
•Gas
•Coal/Oil/Nucle
ar
Current
•EE&R
E
•Gas
•Coal/Oil/Nuclea
r
Near-Future
35
2. Transport: Asia-Pacific Trends
36
0
10
20
30
40
50
60
70
2010 2020
2030 2040
2050
Source: ADB and IEA, 2011
Public transport, walking, and cycling
Cars and motorcycles
•Mo
de
sh
are
(p
-km
)
19
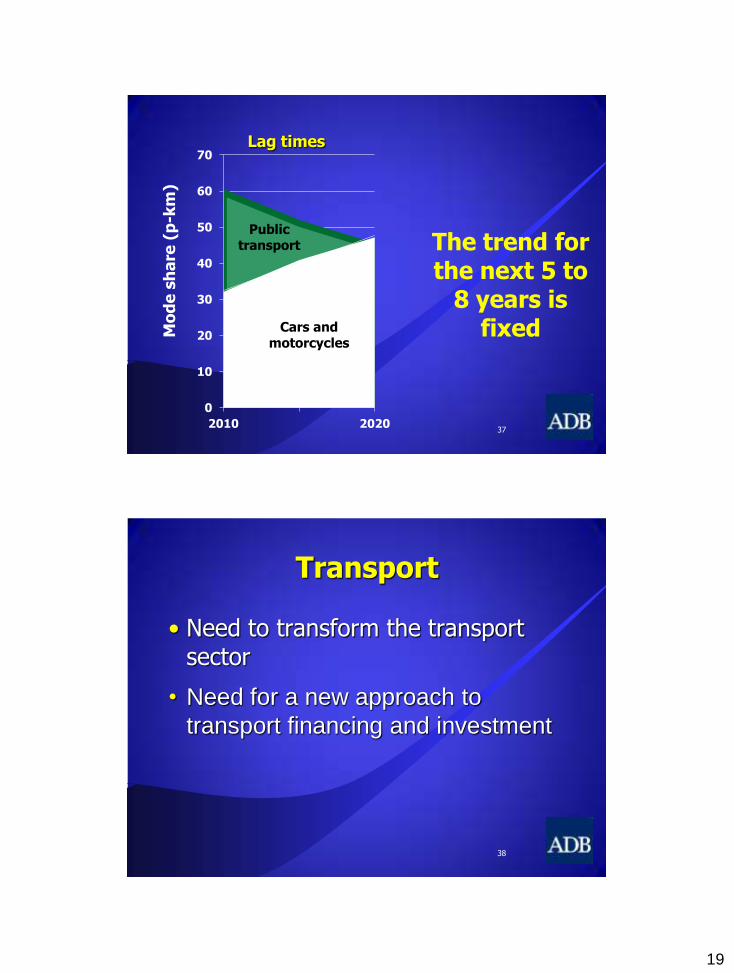
Lag times
37
0
10
20
30
40
50
60
70
2010 2020
Public transport
Cars and motorcycles
Mo
de
sh
are
(p
-km
)
The trend for the next 5 to
8 years is fixed
Transport
• Need to transform the transport sector
• Need for a new approach to
transport financing and investment
38
20
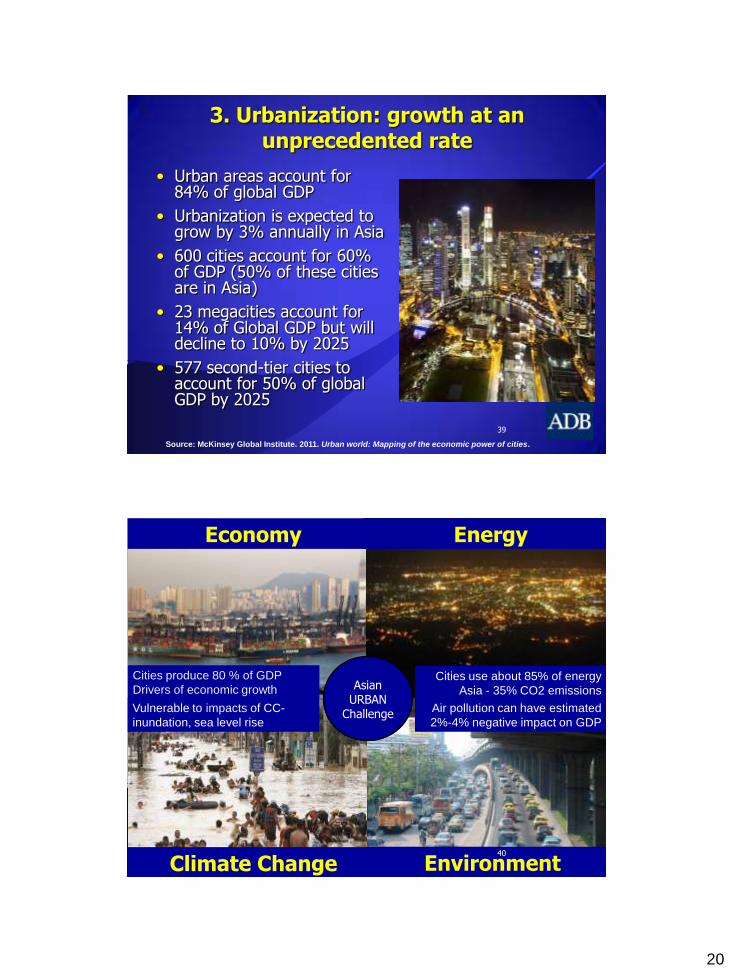
3. Urbanization: growth at an unprecedented rate
39
• Urban areas account for 84% of global GDP
• Urbanization is expected to grow by 3% annually in Asia
• 600 cities account for 60% of GDP (50% of these cities are in Asia)
• 23 megacities account for 14% of Global GDP but will decline to 10% by 2025
• 577 second-tier cities to account for 50% of global GDP by 2025
Source: McKinsey Global Institute. 2011. Urban world: Mapping of the economic power of cities.
Climate Change Environment
Energy Economy
Air pollution can have estimated
2%-4% negative impact on GDP
Cities use about 85% of energy
Asia - 35% CO2 emissions
Cities produce 80 % of GDP
Drivers of economic growth
Vulnerable to impacts of CC-
inundation, sea level rise
Asian URBAN
Challenge
40

21
Asia’s Urban Challenges (1)
• Two faces of Asian urbanization: economic prosperity of cities and increasing urban poverty
Out of 1.6 billion urban people in Asia, more than 500 million are urban poor
Growing inequality
• High levels of environmental stress
Urban areas account for 60-80% of energy consumption and 75% of carbon emissions.
Climate change brings a new layer to environmental unsustainability.
41
Asia’s Urban Challenges (2)
• Urbanization is placing an enormous strain on urban mobility
Economic cost of up to 2%-4% of GDP in many countries
650,000 lives lost annually in region
• Cities face more complex public financial management challenges
42

22
Urbanization
• Need to turn cities to green, smart, inclusive and competitive cities
• Make them livable cities
43
Source: The 2030 Water Resources Group. 2009. Charting Our Water Future
4. Water demand & security 40% supply gap projected by 2030
44

23
Water Security
45
5. Declining biodiversity
• Populations of mammals, birds, fish, reptiles &
amphibians have declined by 64% in Asia-Pacific
(twice the global average!) 46
24
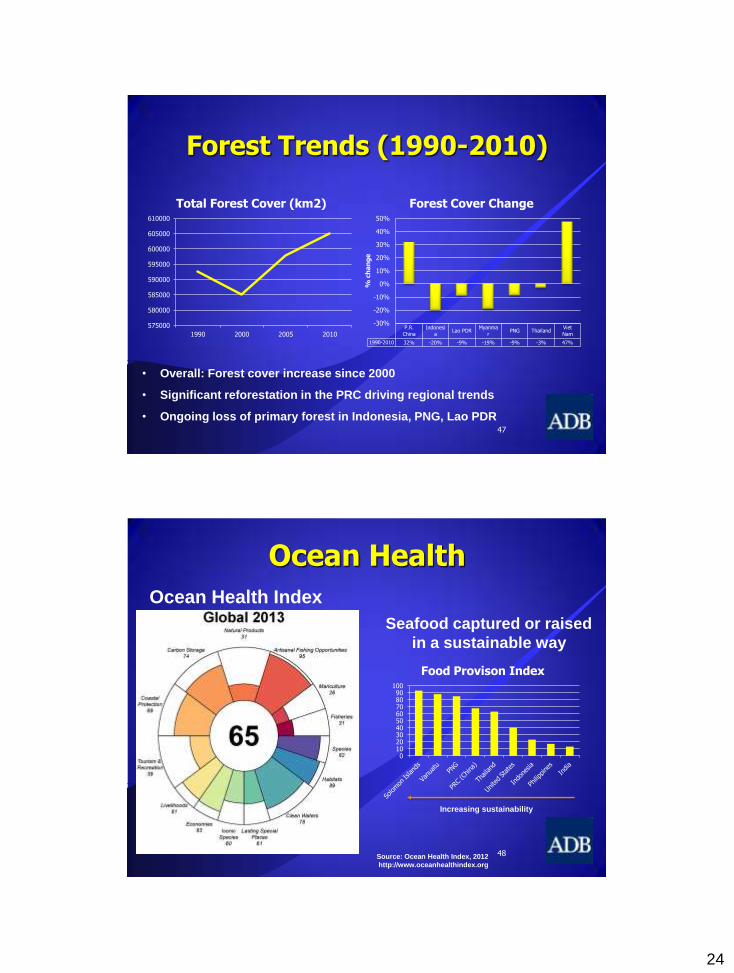
Forest Trends (1990-2010)
47
575000
580000
585000
590000
595000
600000
605000
610000
1990 2000 2005 2010
Total Forest Cover (km2)
P.R.
China
Indonesi
a Lao PDR
Myanma
r PNG Thailand
Viet
Nam
1990-2010 32% -20% -9% -19% -9% -3% 47%
-30%
-20%
-10%
0%
10%
20%
30%
40%
50%
% c
ha
ng
e
Forest Cover Change
• Overall: Forest cover increase since 2000
• Significant reforestation in the PRC driving regional trends
• Ongoing loss of primary forest in Indonesia, PNG, Lao PDR
Ocean Health
48
Ocean Health Index
0 10 20 30 40 50 60 70 80 90
100
Food Provison Index
Seafood captured or raised
in a sustainable way
Source: Ocean Health Index, 2012
http://www.oceanhealthindex.org
Increasing sustainability

25
Biodiversity
• Need to protect, restore and enhance the management of ecosystems
• Greater attention needed on oceans and coasts
• Economic valuation of ecosystems services needs to be integrated in decision-making
49
6. Climate vulnerability in Asia
50

26
Droughts Floods Storms Sea Level rise (1m) Agriculture
Malawi Bangladesh Philippines low-lying Island States
Sudan
Ethiopia China, PR Bangladesh Viet Nam Senegal
Zimbabwe India Madagascar Egypt Zimbabwe
India Cambodia Viet Nam Tunisia Mali
Mozambique Mozambique Moldova Indonesia Zambia
Niger Lao PDR Mongolia Mauritania Morocco
Mauritania Pakistan Haiti China, PR Niger
Eritrea Sri Lanka Samoa Mexico India
Sudan Thailand Tonga Myanmar Malawi
Chad Viet Nam China, PR Bangladesh Algeria
Kenya Benin Honduras Senegal Ethiopia
Iran Rwanda Fiji Libya Pakistan
Note: The typology is based on both absolute effects (e.g., total number of people affected) and relative effects (e.g., number affected as a share of GDP). Source: IPCC data
Most Affected Asian Countries by Climate-Related Threats
51
Economics of Climate Change • The costs and risks of climate change is equivalent to
losing at least 5-20% of global GDP per year
• Economics of containing the global warming below 2°C will mean an annual cost of 1% GDP
• India and S.E. Asia could lose on average 2-3% and as much as a 9-13% (95 percentile) of GDP by 2100
• Based on ADB studies, economy-wide loss by 2100 can be as high as:
6.7% of GDP per year for Indonesia, Philippines, Thailand and Viet Nam
8.8% of GDP per year for Bangladesh, Bhutan, India, Maldives, Nepal, Sri Lanka
5.3% of GDP per year PRC, Japan, Republic of Korea, and Mongolia
• 300,000 people dead, lives of 325 million people affected and economic losses of $125 billion yearly
52
27
5,000
4,000
3,000
2,000
1,000
0 1970 1975 1980 1985 1990 1995 2000 2005 2010
Fitted
Loss
Curve
GDP
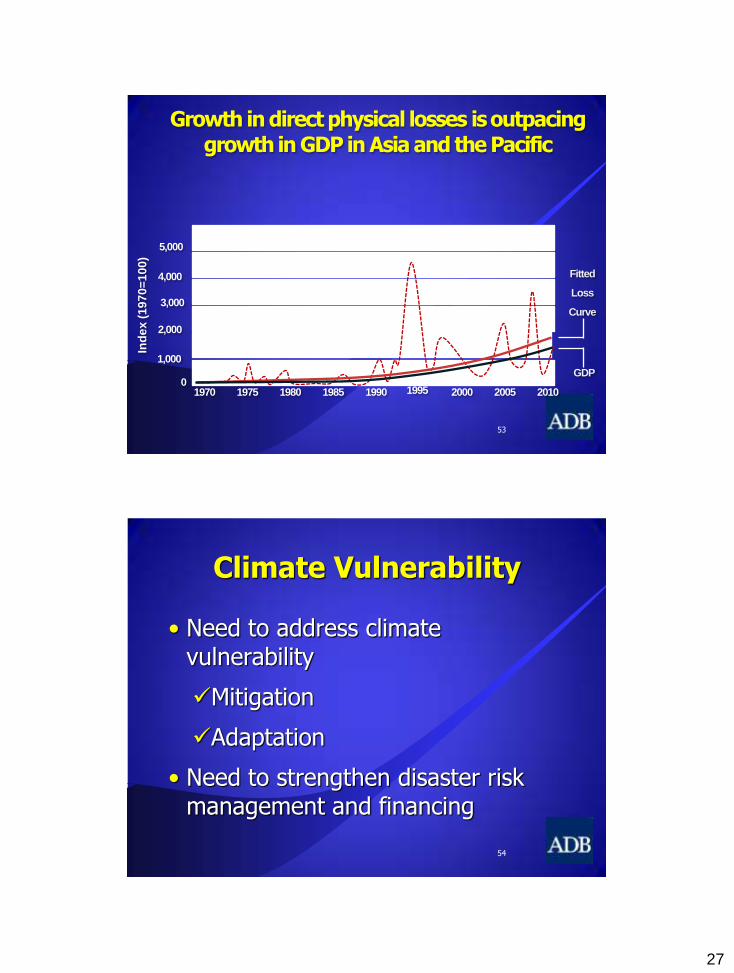
Disaster Losses
Ind
ex
(1
97
0=
10
0)
Growth in direct physical losses is outpacing
growth in GDP in Asia and the Pacific
53
Climate Vulnerability
• Need to address climate vulnerability
Mitigation
Adaptation
• Need to strengthen disaster risk management and financing
54

28
IV. TRANSITIONS TO GREEN GROWTH – ADB’S APPROACH
What approaches do we need?
55
Green growth
• Alternative path that will bring about transformational change
Shift to more resilient infrastructure development
Achieve gains in resource-use efficiency
Achieve resilience against climate change and other shocks and stresses
56

29
25
Year n Year n+10 Year n+20 Year n +30
Decoupling growth?
Less climate change
Resource risks mitigated
Biodiversity maintained
Increased resilience
Absolute
decoupling
Relative
decoupling
Rapid climate change
Increasing resource risks
Declining biodiversity
Reduced resilience
50
75
100
125
150
175
200
Year n = 100
57
ADB Environment Operational Directions (2013-2020)
Promoting a shift to
sustainable infrastructure
Investing in natural capital
Strengthening governance and management
capacities
Climate change (mitigation and adaptation)
58

30
Infrastructure: Huge Demand
Infrastructure promotes economic growth and makes growth more inclusive
“Infrastructure for a Seamless Asia”, May 2009
National infrastructure needs $8 trillion between 2010 to 2020; 68% for new investments and 32% for maintenance and replacements
$287 billion for regional infrastructure ($205 for transport and $82 billion for energy)
Estimates at 6.9% of China’s GDP; 3.6% for middle income countries; and 6.3% for low-income countries
Infrastructure lending accounts for around 70% of ADB operations
59
•Clean Energy Program aims to invest $2 billion annually for
renewable energy and energy efficiency systems
• Energy efficiency
• Renewable (solar, wind, hydro)
• Clean coal technology
•Sustainable Transport Initiative aims to invest around $2 billion annually by 2020 for clean, safe
and affordable transport systems
• Public transport infrastructure
• Rail infrastructure
• Inland waterways
•Water Financing Program aims to invest over $2 billion annually
by 2020 for safe water and sanitation
• Water efficiency
• Climate-resilient water resource management
• Energy-water-food nexus
Sustainable Infrastructure
•Urban Operations Program aims to invest $2 billion annually for
improved environmental infrastructure
• Integrated urban planning
• Green (low carbon) cities
• Innovative financing 60
31
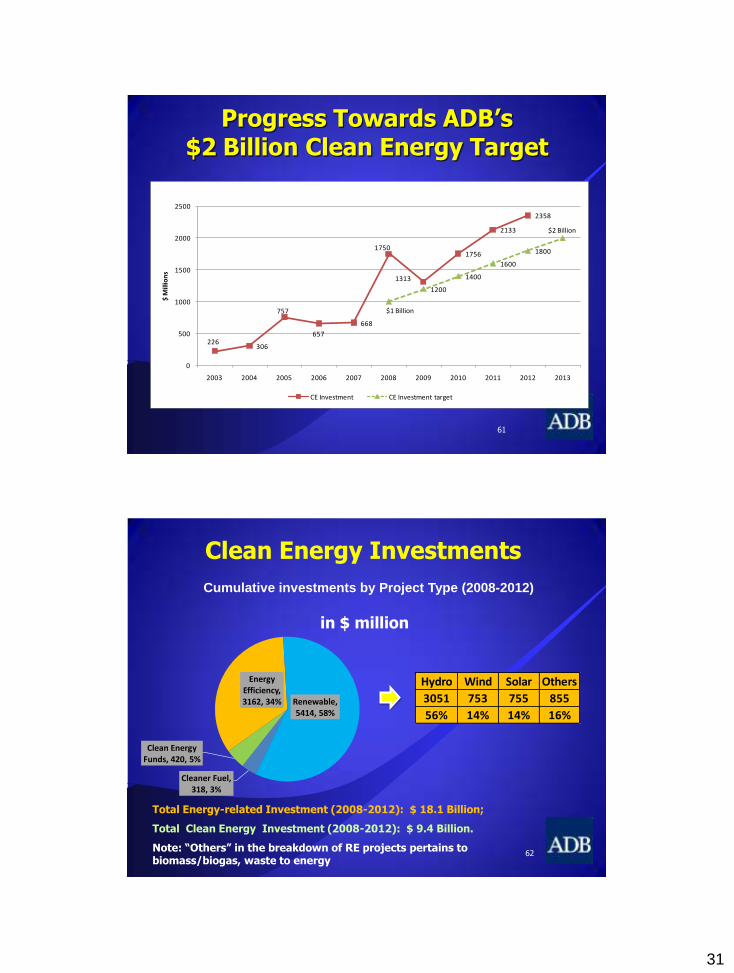
226306
757
657
668
1750
1313
1756
2133
2358
$1 Billion
1200
1400
1600
1800
$2 Billion
0
500
1000
1500
2000
2500
2003 2004 2005 2006 2007 2008 2009 2010 2011 2012 2013
$ M
illio
ns
Progress towards ADB's $2 Billion Clean Energy Investment Target
CE Investment CE Investment target
Progress Towards ADB’s $2 Billion Clean Energy Target
61
Clean Energy Investments
in $ million
Total Energy-related Investment (2008-2012): $ 18.1 Billion;
Total Clean Energy Investment (2008-2012): $ 9.4 Billion.
Note: “Others” in the breakdown of RE projects pertains to biomass/biogas, waste to energy
Cleaner Fuel, 318, 3%
Clean Energy Funds, 420, 5%
Energy Efficiency, 3162, 34% Renewable,
5414, 58%
Hydro Wind Solar Others
3051 753 755 855
56% 14% 14% 16%
62
Cumulative investments by Project Type (2008-2012)
32
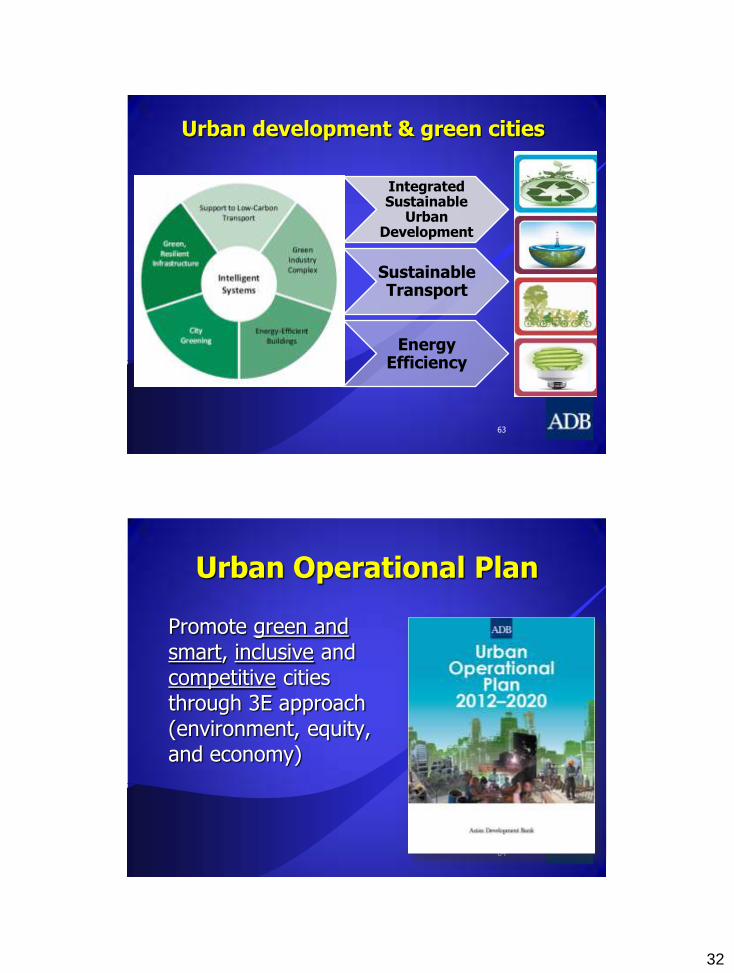
Integrated Sustainable
Urban Development
Sustainable Transport
Energy Efficiency
Urban development & green cities
63
Urban Operational Plan
Promote green and smart, inclusive and competitive cities through 3E approach (environment, equity, and economy)
64

33
ADB Urban Operations
65
• Total urban lending is around $20 billion
• Investment pipeline: $6.5 billion
2011: $1.7 billion
2012: $2.1 billion
2013: $2.7 billion
• Smart growth • Zoning regulations • Information and communications
technologies (ICT) • Transit-oriented development
• Public transport • Non-motorized transport • Transportation demand
management (TDM) • Shift to rail freight
• Alternative fuels • Fuel efficiency standards • Vehicle maintenance • Vehicle testing
Avoid unnecessary vehicle kilometers
Shift to the lowest-emitting modes
Improve vehicle/fuel technology towards cleaner and more efficient options
Strategy for sustainable transport
66

34
Rio+20 Commitment
67
US$ 175 billion committed to transport by the 8 major multilateral
development banks over the next 10 years
Transport sector investments
68
2000 - 2009 historical
2012-2014 pipeline
2020 target
2%
21% 30% •Urban
•Railway
•Road
35
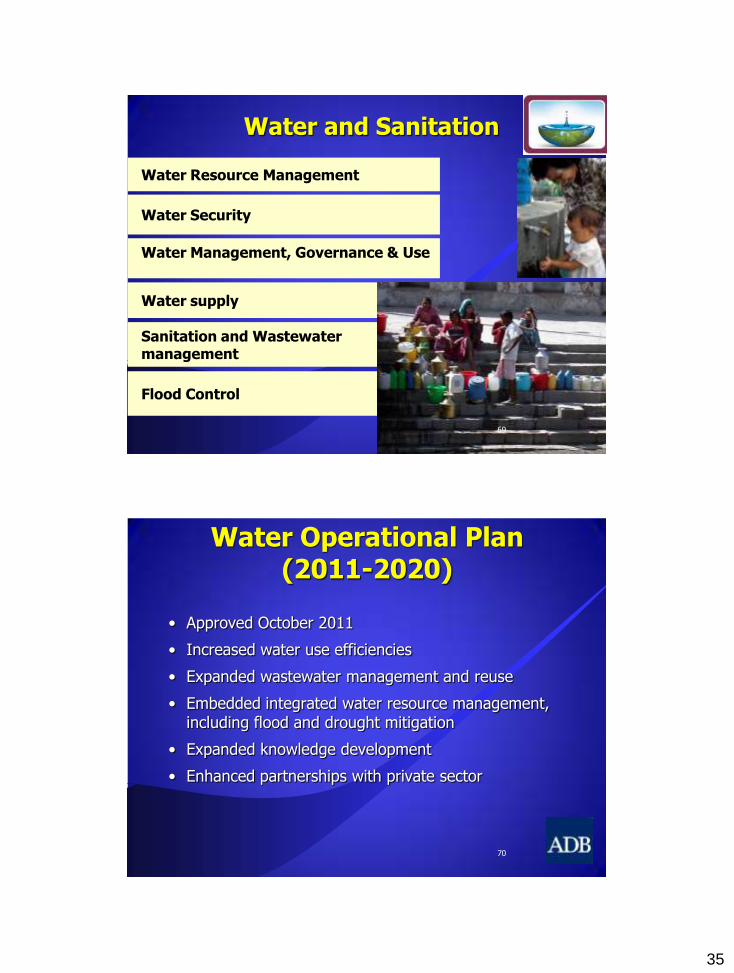
Water and Sanitation
Water Resource Management
Water Security
Water supply
Sanitation and Wastewater management
Flood Control
Water Management, Governance & Use
69
Water Operational Plan
(2011-2020)
• Approved October 2011
• Increased water use efficiencies
• Expanded wastewater management and reuse
• Embedded integrated water resource management, including flood and drought mitigation
• Expanded knowledge development
• Enhanced partnerships with private sector
70
36
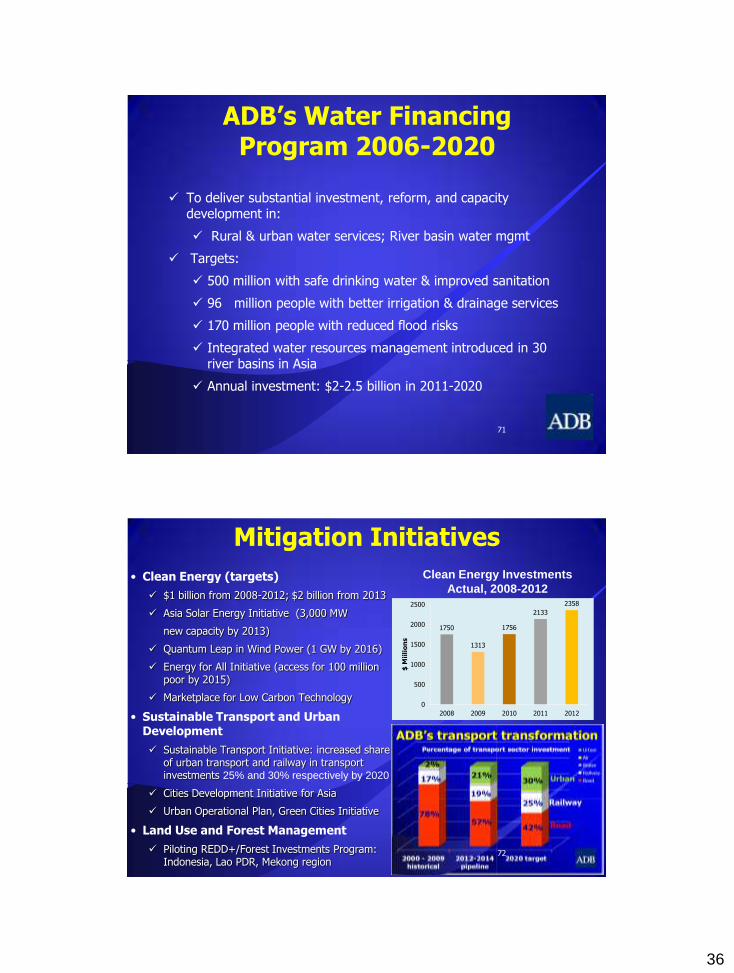
ADB’s Water Financing Program 2006-2020
To deliver substantial investment, reform, and capacity development in:
Rural & urban water services; River basin water mgmt
Targets:
500 million with safe drinking water & improved sanitation
96 million people with better irrigation & drainage services
170 million people with reduced flood risks
Integrated water resources management introduced in 30 river basins in Asia
Annual investment: $2-2.5 billion in 2011-2020
71
• Clean Energy (targets)
$1 billion from 2008-2012; $2 billion from 2013
Asia Solar Energy Initiative (3,000 MW
new capacity by 2013)
Quantum Leap in Wind Power (1 GW by 2016)
Energy for All Initiative (access for 100 million poor by 2015)
Marketplace for Low Carbon Technology
• Sustainable Transport and Urban Development
Sustainable Transport Initiative: increased share of urban transport and railway in transport investments 25% and 30% respectively by 2020
Cities Development Initiative for Asia
Urban Operational Plan, Green Cities Initiative
• Land Use and Forest Management
Piloting REDD+/Forest Investments Program: Indonesia, Lao PDR, Mekong region
Clean Energy Investments
Actual, 2008-2012
1750
1313
1756
2133
2358
0
500
1000
1500
2000
2500
2008 2009 2010 2011 2012
$ M
iili
on
s
Mitigation Initiatives
72

37
Adaptation Initiatives
• Mainstreaming climate resilience in core development planning, sectors
- Pilot Program on Climate Resilience for Bangladesh, Cambodia, Nepal, Tajikistan and the Pacific
• Climate proofing vulnerable projects
- roads, port facilities, water supply
• Increasing resilience of vulnerable sectors
- natural resources, water, energy,
transport
• Addressing social dimensions: - migration, gender, health impacts
• Greater emphasis on integration of adaptation and disaster risk
reduction
73
Mobilizing Climate Financing
74
Internally-managed funds • Clean Energy Financing
Partnership Facility (CEFPF)
• Climate Change Fund (CCF)
• Others with bilaterals Externally-managed funds • Climate Investment
Funds (CIFs) • Global Environment
Facility (GEF) • soon the Green Climate
Fund (GCF)
• Upfront carbon finance Asia Pacific Carbon
Fund Future Carbon Fund
• Carbon Market Technical Support Facility CDM support domestic emissions
trading • Supporting other
market mechanisms (e.g. renewable energy credits; feed in tariffs)
• Direct project finance (lending, guarantees, syndications), and equity investment
• Public private
partnerships: (PPPs) working with client DMCs across stages of PPPs
Deploying concessional
resources
Maximizing market mechanisms
Catalyzing private capital
38
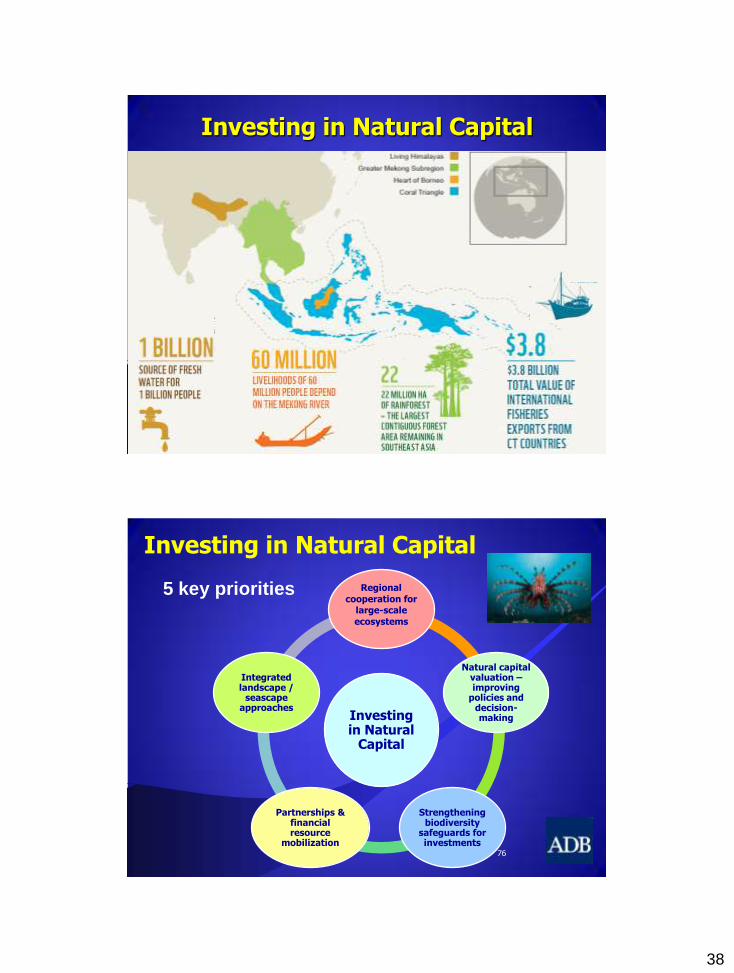
Investing in Natural Capital
75
Investing in Natural
Capital
Regional
cooperation for large-scale
ecosystems
Natural capital valuation – improving
policies and decision-making
Strengthening biodiversity
safeguards for investments
Partnerships & financial resource
mobilization
Integrated landscape /
seascape approaches
Investing in Natural Capital
5 key priorities
76
39
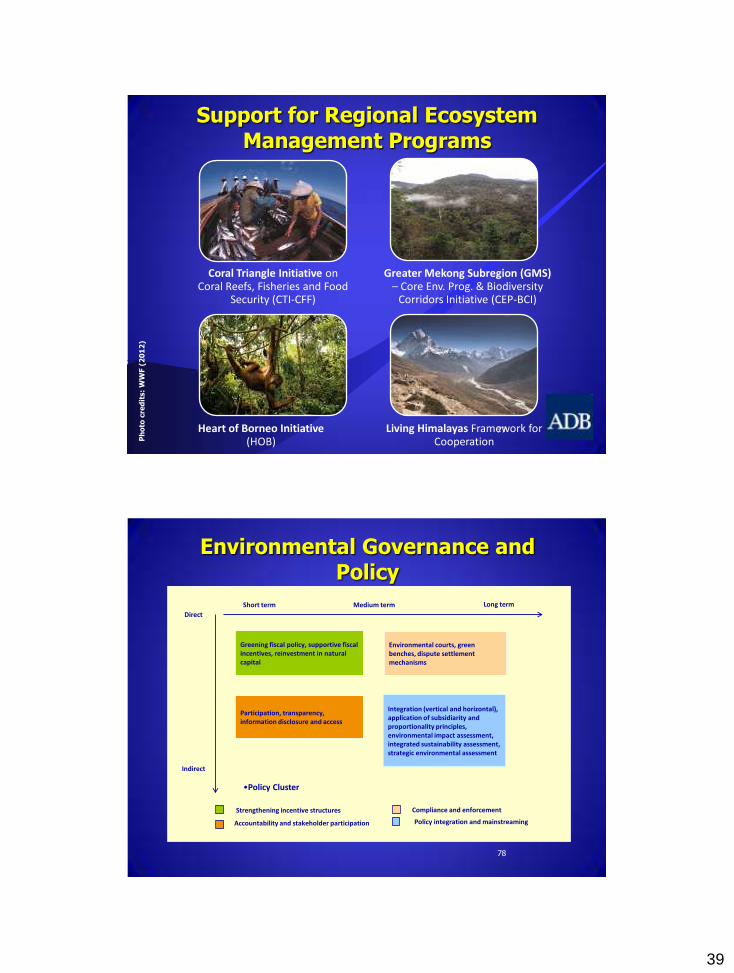
Coral Triangle Initiative on Coral Reefs, Fisheries and Food
Security (CTI-CFF)
Greater Mekong Subregion (GMS) – Core Env. Prog. & Biodiversity
Corridors Initiative (CEP-BCI)
Heart of Borneo Initiative (HOB)
Living Himalayas Framework for Cooperation
Support for Regional Ecosystem Management Programs
Ph
oto
cre
dit
s:
WW
F (
20
12
)
77
Environmental Governance and Policy
78
Short term Medium term Long term
Direct
Indirect
Greening fiscal policy, supportive fiscal incentives, reinvestment in natural capital
Participation, transparency, information disclosure and access
Environmental courts, green benches, dispute settlement mechanisms
Integration (vertical and horizontal), application of subsidiarity and proportionality principles, environmental impact assessment, integrated sustainability assessment, strategic environmental assessment
•Policy Cluster
Strengthening incentive structures
Accountability and stakeholder participation
Compliance and enforcement
Policy integration and mainstreaming
40
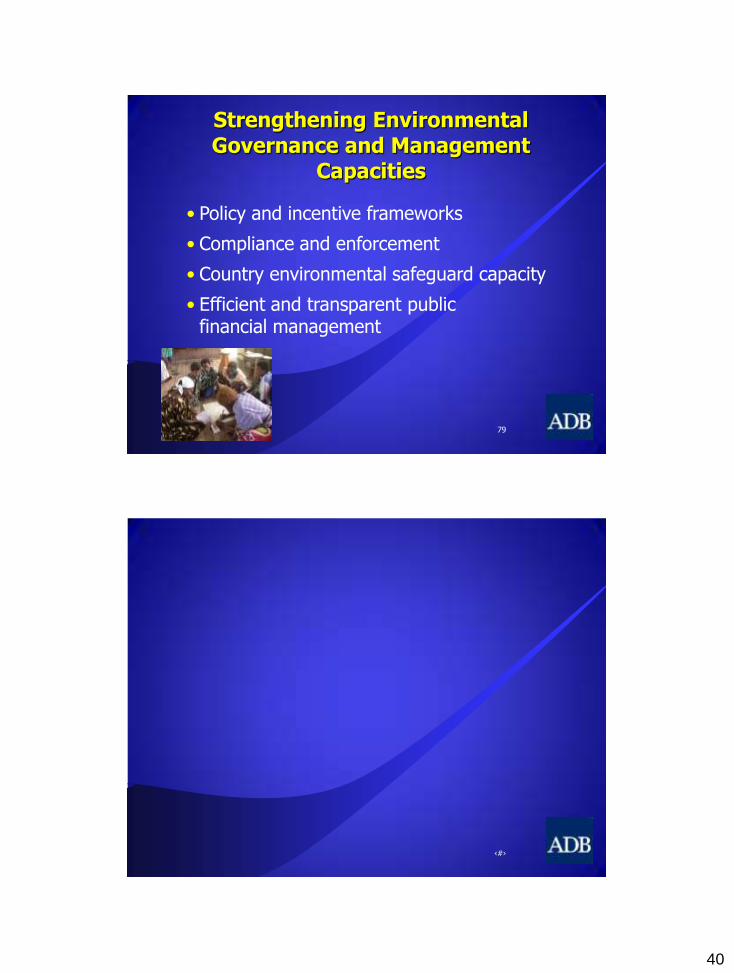
Strengthening Environmental Governance and Management
Capacities
• Policy and incentive frameworks
• Compliance and enforcement
• Country environmental safeguard capacity
• Efficient and transparent public financial management
79
‹#›
41
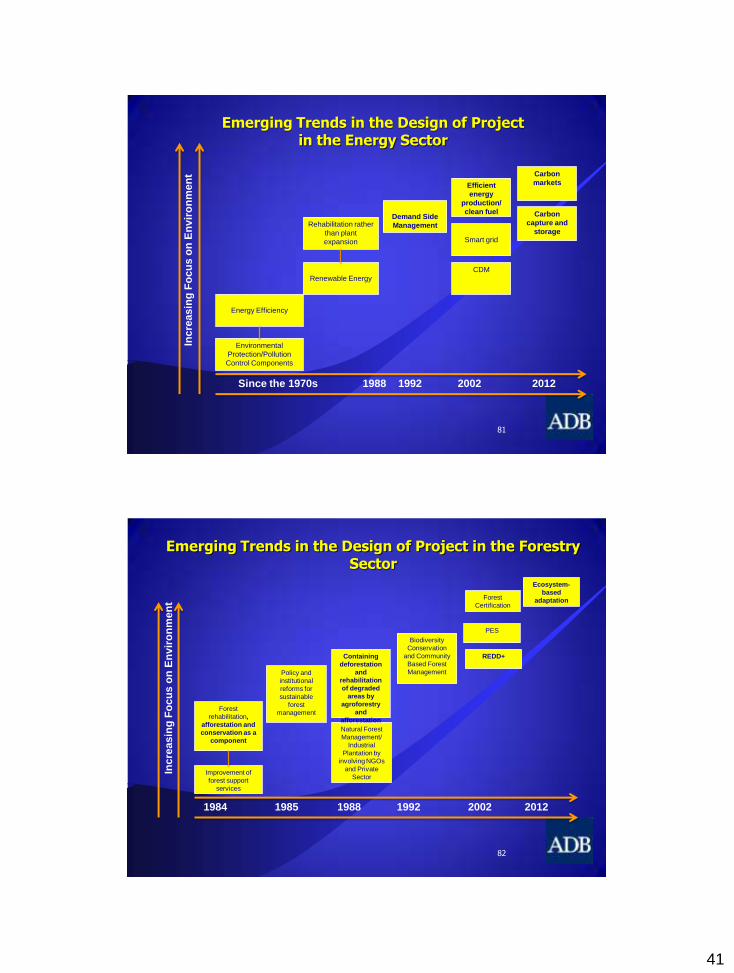
Emerging Trends in the Design of Project in the Energy Sector
In
cre
asin
g F
oc
us o
n E
nv
iro
nm
en
t
Since the 1970s 1988 1992 2002 2012
Environmental
Protection/Pollution
Control Components
Energy Efficiency
Renewable Energy
Rehabilitation rather
than plant
expansion
Demand Side
Management
Efficient
energy
production/
clean fuel
Smart grid
CDM
Carbon
markets
Carbon
capture and
storage
81
Emerging Trends in the Design of Project in the Forestry Sector
Inc
reasin
g F
oc
us o
n E
nv
iro
nm
en
t
1984 1985 1988 1992 2002 2012
Improvement of
forest support
services
Forest
rehabilitation,
afforestation and
conservation as a
component
Policy and
institutional
reforms for
sustainable
forest
management
Natural Forest
Management/
Industrial
Plantation by
involving NGOs
and Private
Sector
Containing
deforestation
and
rehabilitation
of degraded
areas by
agroforestry
and
afforestation
Biodiversity
Conservation
and Community
Based Forest
Management
PES
Forest
Certification
REDD+
Ecosystem-
based
adaptation
82
42
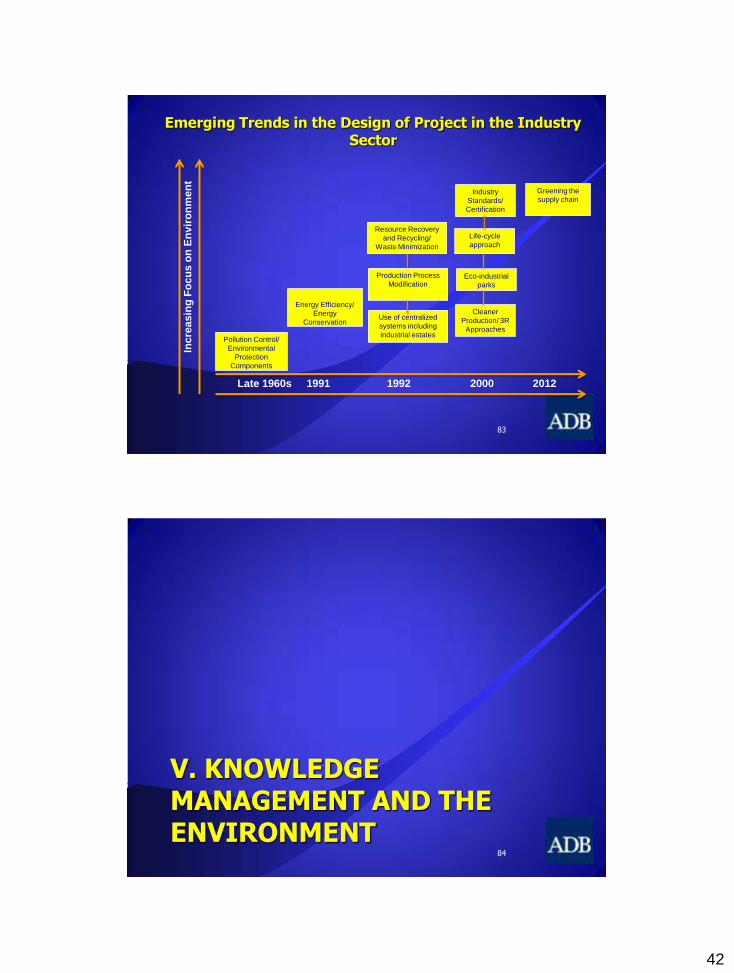
Emerging Trends in the Design of Project in the Industry Sector
In
cre
asin
g F
oc
us o
n E
nv
iro
nm
en
t
Late 1960s 1991 1992 2000 2012
Pollution Control/
Environmental
Protection
Components
Resource Recovery
and Recycling/
Waste Minimization
Energy Efficiency/
Energy
Conservation Use of centralized
systems including
industrial estates
Production Process
Modification
Industry
Standards/
Certification
Greening the
supply chain
Life-cycle
approach
Eco-industrial
parks
Cleaner
Production/ 3R
Approaches
83
V. KNOWLEDGE MANAGEMENT AND THE ENVIRONMENT
84
43
“Finance ++” at ADB
85
ADB’s own finance plus leveraging
resources through partnership plus
providing knowledge to developing
member countries to maximize and
accelerate development effectiveness
86
44
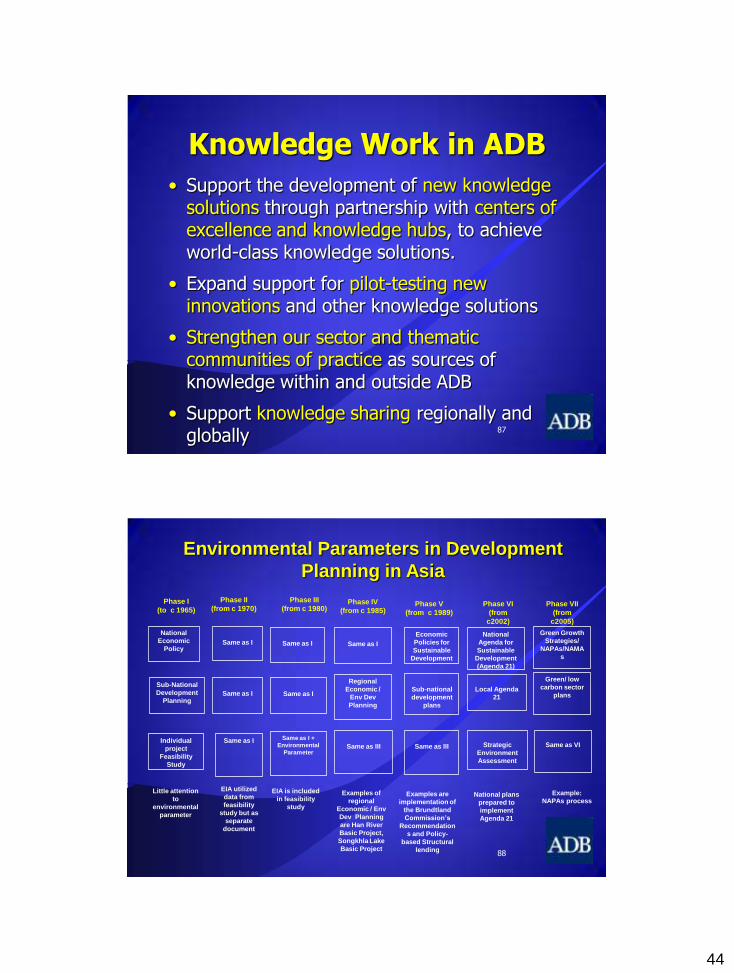
Knowledge Work in ADB
• Support the development of new knowledge solutions through partnership with centers of excellence and knowledge hubs, to achieve world-class knowledge solutions.
• Expand support for pilot-testing new innovations and other knowledge solutions
• Strengthen our sector and thematic communities of practice as sources of knowledge within and outside ADB
• Support knowledge sharing regionally and globally
87
Environmental Parameters in Development
Planning in Asia
Phase I
(to c 1965)
Phase II
(from c 1970)
Phase III
(from c 1980) Phase IV
(from c 1985)
National
Economic
Policy
Same as I
Same as I
Same as I
Sub-National
Development
Planning
Same as I
Same as I
Regional
Economic /
Env Dev
Planning
Individual
project
Feasibility
Study
Same as I Same as I +
Environmental
Parameter
Same as III
Little attention
to
environmental
parameter
EIA utilized
data from
feasibility
study but as
separate
document
EIA is included
in feasibility
study
Examples of
regional
Economic / Env
Dev Planning
are Han River
Basic Project,
Songkhla Lake
Basic Project
Phase V
(from c 1989)
Economic
Policies for
Sustainable
Development
Sub-national
development
plans
Same as III
Examples are
implementation of
the Brundtland
Commission’s
Recommendation
s and Policy-
based Structural
lending
Phase VII
(from
c2005)
Local Agenda
21
Strategic
Environment
Assessment
National
Agenda for
Sustainable
Development
(Agenda 21)
Phase VI
(from
c2002)
Green Growth
Strategies/
NAPAs/NAMA
s
Green/ low
carbon sector
plans
Same as VI
National plans
prepared to
implement
Agenda 21
Example:
NAPAs process
88

45
Regulatory Frameworks Time Frame Scope of Regulatory
Activities Regulatory Mechanics
Monitoring Activities
From About 1989-1995
Concerns on Global Environment Issues/ Rio
Conventions
•Reduction of Chemical use such as CFCs and
Discharge of CO2 and Sox
Monitoring of CO2, Sox, Ozone, etc.
From About 1985
Environmental and Natural Resources Management and
Wildlife Protection
Natural Resource Protection, Rare and Endangered Species
Monitoring of Resource Depletion, Protected Area,
Rare and Endangered Species
From About 1980
Comprehensive Environmental Protection
Environmental Impact Statement
Monitoring of Various Environmental Parameters
as Required
About 1975
Environmental Pollution Control (Water, Solid and Liquid
Wastes, Gaseous Emissions, Noise Control)
Permit Procedure Environmental Pollution Monitoring
To About 1970
Sanitation (Water Supply, Waste Management, Food Sanitation, Water Pollution
Control)
Permit Procedure Water Quality Monitoring (with Hydrologic Data
Collection)
•Emission reductions/
Monitoring of relevant parameters
•Kyoto Protocol From About 1996 - 2005
•CDM/Carbon markets/ Market-based
instruments/ Information Disclosure
From About 2006
•Green Growth Strategies/Policies
•Green new deal/ green investments
•Budget allocation for green investments/ green
economy reporting
Environmental Education
1960s - narrow focus on pollution prevention and environmental quality (US NEPA, Earth Day)
1970s/1980s
- knowledge, values, attitudes and skills to protect the environment
- economic, social political and ecological interdependence
(Stockholm conference)
- environmental standards, regulations and laws
time
focus 1990s
- increased orientation on the
science of environment
- environmental awareness
programs
2000s
- education for
sustainable
development
- environmental
leadership programs
- Green growth
environment
sustainable
development
Increasing emphasis on
multi-disciplinary
approaches over time
90

46
Role of Universities, R&D and Centers of Excellence
• High concentration of talent, both in faculty and students
• World-class universities are well resourced
• World-class universities are well-governed
• World-class universities network with each other
• World-class universities are reaching out to people everywhere
91
92
Thank You
Recommended