______________________________________________________________________________________________________________________
OSHE/EOF FY15 ANNUAL REPORT
NARRATIVE
Success Matters
11/11/2015 Brookdale Community College

OSHE/EOF FY15 Annual Report Narrative
Page 1
OSHE/EOF FY15 Annual Report Narrative B R O O K D A L E C O M M U N I T Y C O L L E G E
his report highlights program performance outcomes across several student progress indicators, and presents a status update on FY15 EOF Contract Attachment D2 goals and objectives.
I. Student Progress Indicators
We are experiencing: a) stability in the academic achievement of our students, b) a continued downturn in triple remedial students, c) a
downturn in attrition, d) modest retention gains in FTFT cohort third-year returns and an off the chart 90% second year return for the fall 14
cohort, e) climbing annual graduate yields, and f) improving FTFT cohort graduation rates.
A. Academic Achievement Outcomes Remain Stable Analysis of annual report tables on Student Progress Indicators show incremental improvements in the percentage of students making satisfactory academic progress towards the degree or meeting SAP standards, an uptick in credit completion rates, and a small downturn in the proportion of student enrollment maintaining a CGPA =>2.00.
Success Matters!
More Students in Good Standing
More Credits Earned
T
Table 1 Academic Achievement Outcomes
Measure 10-11 11-12 12-13 13-14
14-15
% Change 10-11 to 14-15
Meeting SAP Regs
72%
63%
72%
73%
74%
+2%
Credit Completion
71%
73%
76%
76%
78%
+ 7%
=>2.00 CGPA
79%
78%
84%
80%
78%
-1%

OSHE/EOF FY15 Annual Report Narrative
Page 2
B. Basic Skills Remediation: Triple-Remedial Downturn Continues
Entering basic skill needs at point of entry for fall and spring continue to decline when examining for triple remedial students- students with basic skill needs in reading, writing and math. This is attributable to a number of factors. These include decreases in triple remedial for new admits upon entry, and increased basic skill course completion rates, and a decrease in annual program enrollments.
Success Matters!
Less triple remedial at point of program entry & high basic skill credit completion rates helps to change the landscape
Table 2 Entering Basic Skill Needs: Decline in Students Who Are Triple Remedial
Term 10-11 11-12
12-13
13-14 14-15
% Change
10-11 to 14-15
Fall
53
51
44
25
22
-58%
Spring
18
16
15
9
5
-72%

OSHE/EOF FY15 Annual Report Narrative
Page 3
C. Attrition Down and Stabilized For the purpose of this table transfers are removed as attrites for spring 14 to fall 14, and fall 14 to spring 15. Transfers are a positive educational outcome. Also removed are within term withdrawals- as they are term enrolled. This adjustment allows for a clearer picture of the number of students who are spring 14 or fall 14 term enrolled, but do not return for the next term.
Success Matters! Change for the better can be for the moment, but is at its best when maintained
Table 3
Spring 14 to Fall 14 and Fall 14 to Spring 15 Attrite Pool Adjusted for Transfers and Within Term Withdrawals
10-11 11-12
12-13 13-14
14-15
% Change 10-11 to 14-15
185
142
141
136
145
-22%

OSHE/EOF FY15 Annual Report Narrative
Page 4
D. First Time Full Time (FTFT) Cohort Return Rates- Record Setting Achievement for Fall 14 Cohort
FTFT cohort return rates are a common quantitative program outcome indicator in the areas of retention and student progress. The fall 14 FTFT cohort second year return rate is off the chart. Just as impressive for this cohort- 97% are full-time for fall 15 and 84% are in good academic standing! Third year return rates are ticking up as well.
Success Matters!
90% FTFT SECOND YEAR RETURN RATE
A RECORD-SETTING ACHIEVEMENT
Table 4 FTFT Cohort Retention Rates
Second and Third Year Return
Measure
Fall 10
(N=102)
Fall 11
(N=104)
Fall 12 (N=87)
Fall 13 (N=89)
Fall 14 (N=52)
% Change
Fall 10 to Fall 14
2nd Year Return
72%
78%
76%
76%
90%
+18%
3rd Year Return
36%
66%
47%
49%
NA
+13%
OSHE/EOF FY15 Annual Report Narrative
Page 5
E. Annual Graduate Yield Continues to Climb Increases in the total annual yield- fall, spring, and summer graduates combined, is up by 39% when compared to 10-11. Admission practices also target students with a prior history of enrollment at Brookdale. These students while having a background showing basic skill need, are admitted based on meeting credit accumulation and GPA standards associated with their college enrollment.
Success Matters!
Every student counts More Are Graduating
Year 10-11
Year 11-12
Year 12-13
Year 13-14
Year
14-15 % Change
10-11 to 14-15
62
70
62
81
86
+39%
Table 5
Annual Graduate Yield
OSHE/EOF FY15 Annual Report Narrative
Page 6
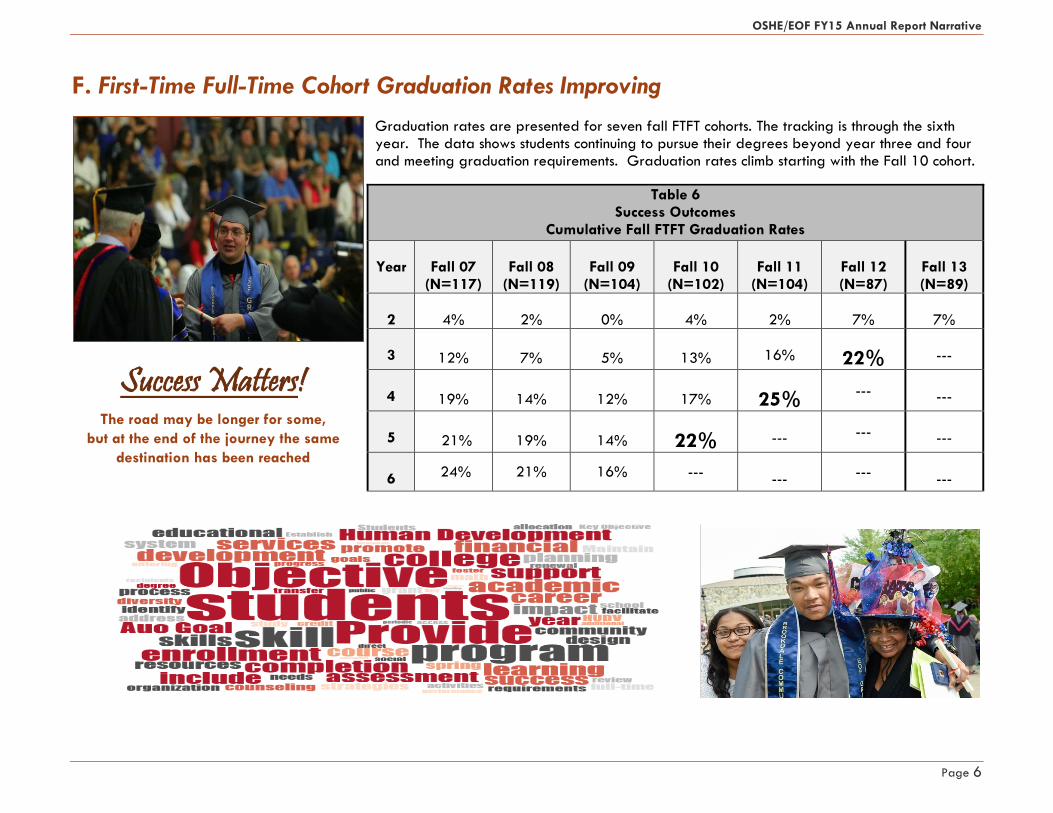
F. First-Time Full-Time Cohort Graduation Rates Improving Graduation rates are presented for seven fall FTFT cohorts. The tracking is through the sixth year. The data shows students continuing to pursue their degrees beyond year three and four and meeting graduation requirements. Graduation rates climb starting with the Fall 10 cohort.
Success Matters!
The road may be longer for some,
but at the end of the journey the same
destination has been reached
Table 6 Success Outcomes
Cumulative Fall FTFT Graduation Rates
Year
Fall 07
(N=117)
Fall 08
(N=119)
Fall 09
(N=104)
Fall 10
(N=102)
Fall 11
(N=104)
Fall 12 (N=87)
Fall 13 (N=89)
2
4%
2%
0%
4%
2%
7%
7%
3
12%
7%
5%
13%
16%
22%
---
4
19%
14%
12%
17%
25% ---
---
5
21%
19%
14%
22%
--- ---
---
6
24% 21% 16% ---
--- ---
---
Recommended