HAL Id: halshs-01222928https://halshs.archives-ouvertes.fr/halshs-01222928
Submitted on 31 Oct 2015
HAL is a multi-disciplinary open accessarchive for the deposit and dissemination of sci-entific research documents, whether they are pub-lished or not. The documents may come fromteaching and research institutions in France orabroad, or from public or private research centers.
L’archive ouverte pluridisciplinaire HAL, estdestinée au dépôt et à la diffusion de documentsscientifiques de niveau recherche, publiés ou non,émanant des établissements d’enseignement et derecherche français ou étrangers, des laboratoirespublics ou privés.
Organizing the Cartographic Series – New Technical andConceptual Contexts
Jean-Luc Arnaud
To cite this version:Jean-Luc Arnaud. Organizing the Cartographic Series – New Technical and Conceptual Contexts.Yap, Joseph; Perez, Martin; Ayson, Maria; Entico, Gladys. Special Library Administration Standard-ization and Technological Integration, IGI Globval, pp.267-304, 2015, 2326-4136. �halshs-01222928�

Arnaud 77 - Organizing the Cartographic Series – New Technical and Conceptual Contexts
1
Organizing the Cartographic Series New Technical and Conceptual Contexts
Jean-Luc Arnaud, CNRS, [email protected]
D’après : « Organizing the Cartographic Series – New Technical and
Conceptual Context », chap. 12 de J. Yap, M. Perez, M. Ayson et G.
Entico (dir.), Special Library Administration Standardization and
Technological Integration, Hershey (Penn.), IGI Global, 2015, p. 267-304.
Texte original, figures originales
Résumé
L'auteur rappelle tout d'abord que les séries cartographiques sont assez mal traitées dans
les bibliothèques et il explique les raisons de cette situation. Le chapitre est ensuite
partagé en cinq parties. La première présente les caractéristiques générales, l'histoire et
les particularités des séries de cartes. La seconde est dédiée à un type particulier de
documents : les tableaux d'assemblage. Elle montre combien ils sont importants pour
comprendre l'organisation géographique de chaque série. La troisième partie traite des
mentions portées sur les documents et sur la manière dont elles peuvent rendre compte
des particularités d'une série. La quatrième expose comment le site web CartoMundi
constitue une avancée importante dans le monde des cartothèques. Enfin, la dernière
partie est consacrée à l'avenir de ces établissements dans un contexte en forte évolution.
Abstract
The author identifies structural shortcomings in the management of cartographic
resources in libraries and presents the difficulties involved in cataloguing cartographic
series. Following this introduction, the chapter is divided into five sections. The first
presents the general features, history and peculiarities of cartographic series. The second
focuses on a particular type of documents: sheet indexes. It demonstrates why they are an
essential tool for understanding the geographic organization of each series. The third
section deals with the statements printed on the sheets and shows that, though very useful,
they are often misleading. The fourth section introduces the new website CartoMundi

Arnaud 77 - Organizing the Cartographic Series – New Technical and Conceptual Contexts
2
which represents an advance in the world of map libraries. Finally, the conclusion points
out future issues to be faced by map libraries in the context of an evolving world.
Arnaud 77 - Organizing the Cartographic Series – New Technical and Conceptual Contexts
3
Organizing the Cartographic Series New Technical and Conceptual Contexts
Introduction
Literature on the treatment of cartographic materials in libraries is rare.
The main reason for this situation is that maps are treated as books, or rather that
librarians tend to treat them as books, with only limited success. The standard used
currently for classifying cartographic documents is in fact an adaptation of the standard
used for books. As a result, it is difficult to produce consistent descriptions of maps and
yet, at the same time, many readers are disappointed in their search for cartographic
documents in library catalogs.
The reason is very simple. When searching for a map, the reader will look first for
the representation of a physical place, usually by its name. The second step is to include
other research criteria, whether generic (author, title, publisher, date, etc.) or specific
(scale, subject, projection method, etc.). However, while the tools available offer high
performance searches on generic criteria, the results are usually inadequate when
searching for geographic data. At best, each document will be described by a few
geographic names - five or six - which correspond to the most important places on the
map, regardless of the hundreds or thousands of other locations it contains. Thus, catalogs
are most often unable to respond to requests from readers.
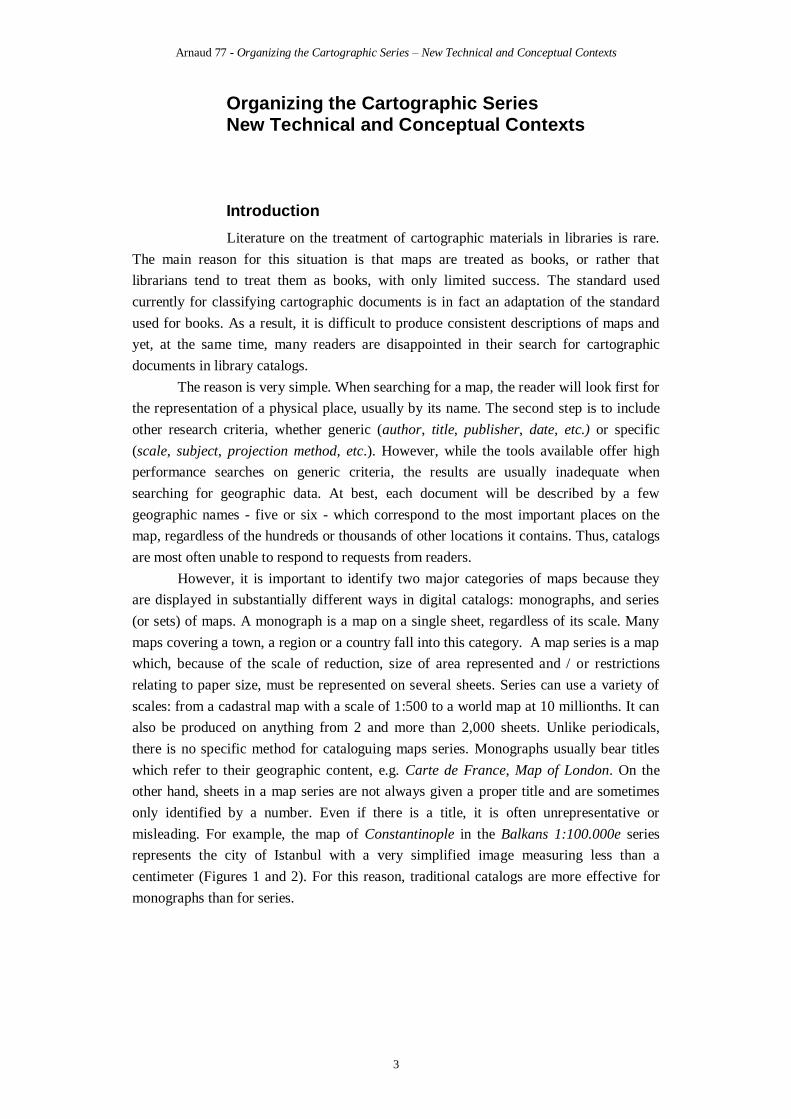
However, it is important to identify two major categories of maps because they
are displayed in substantially different ways in digital catalogs: monographs, and series
(or sets) of maps. A monograph is a map on a single sheet, regardless of its scale. Many
maps covering a town, a region or a country fall into this category. A map series is a map
which, because of the scale of reduction, size of area represented and / or restrictions
relating to paper size, must be represented on several sheets. Series can use a variety of
scales: from a cadastral map with a scale of 1:500 to a world map at 10 millionths. It can
also be produced on anything from 2 and more than 2,000 sheets. Unlike periodicals,
there is no specific method for cataloguing maps series. Monographs usually bear titles
which refer to their geographic content, e.g. Carte de France, Map of London. On the
other hand, sheets in a map series are not always given a proper title and are sometimes
only identified by a number. Even if there is a title, it is often unrepresentative or
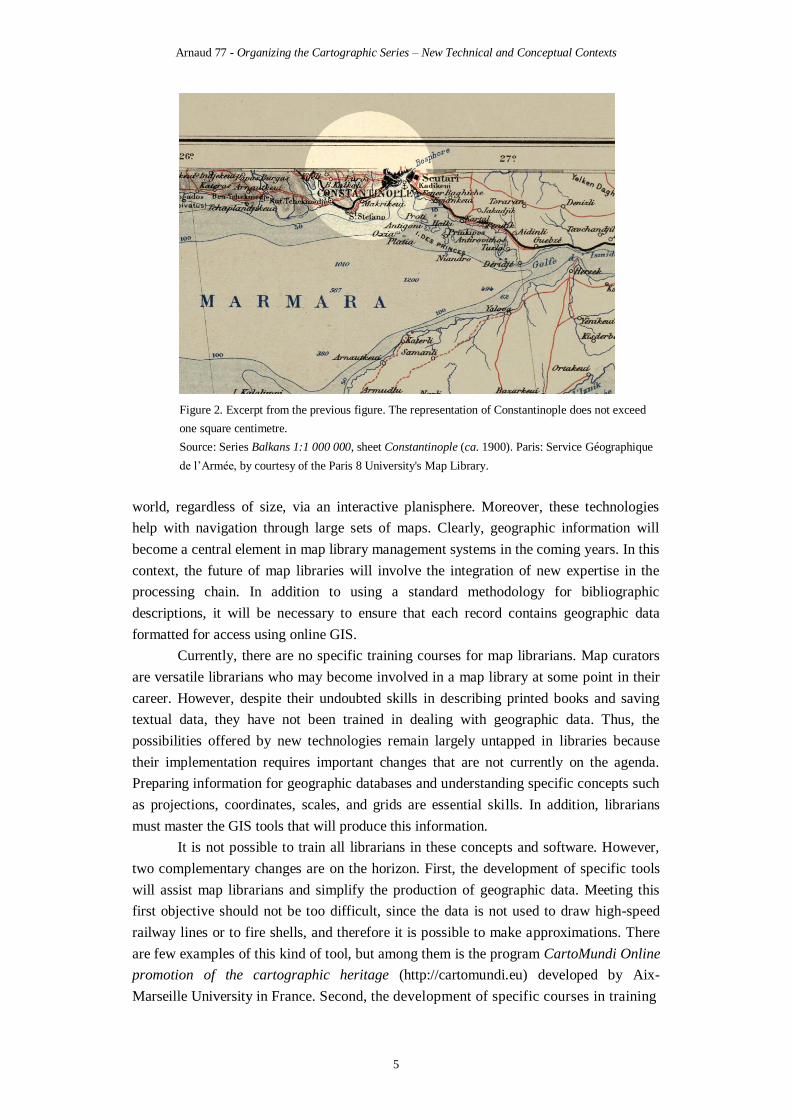
misleading. For example, the map of Constantinople in the Balkans 1:100.000e series
represents the city of Istanbul with a very simplified image measuring less than a
centimeter (Figures 1 and 2). For this reason, traditional catalogs are more effective for
monographs than for series.
Arnaud 77 - Organizing the Cartographic Series – New Technical and Conceptual Contexts
4
Figure 1. The sheet Constantinople represents an area of several thousands of square kilometres
Source: Series: Balkans 1:1 000 000, sheet Constantinople (ca. 1900). Paris: Service géographique
de l’Armée, by courtesy of the Paris 8 University's Map Library.
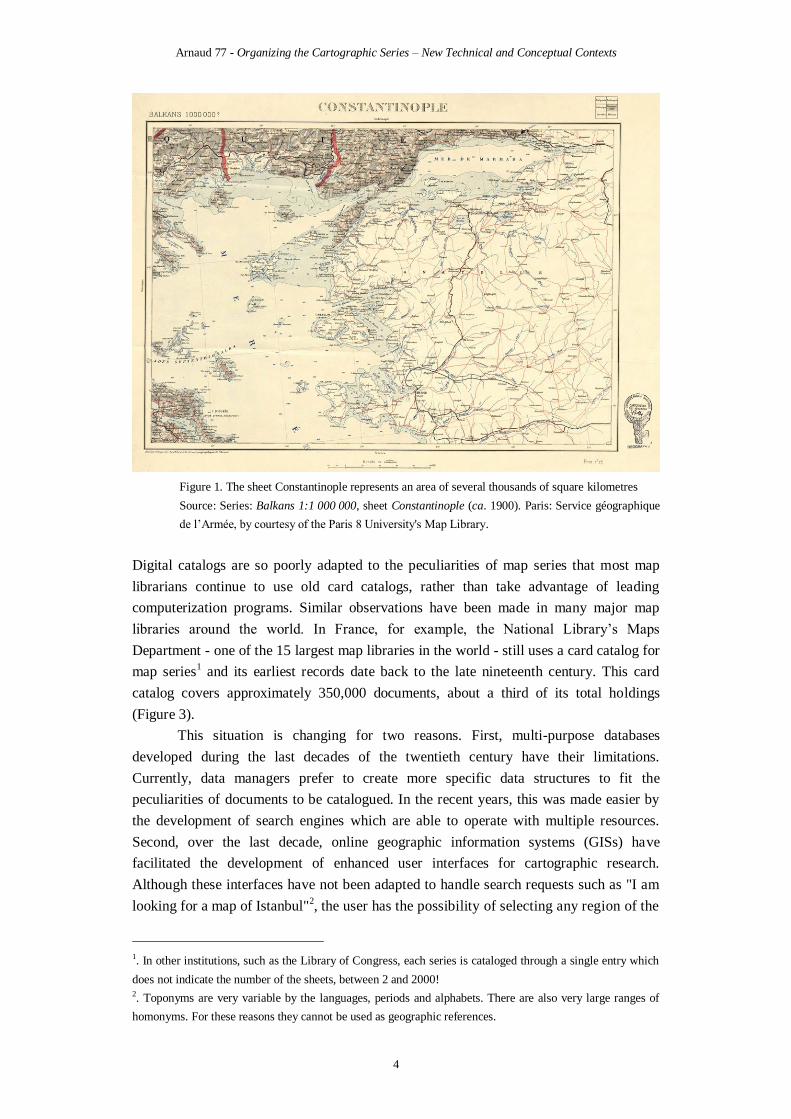
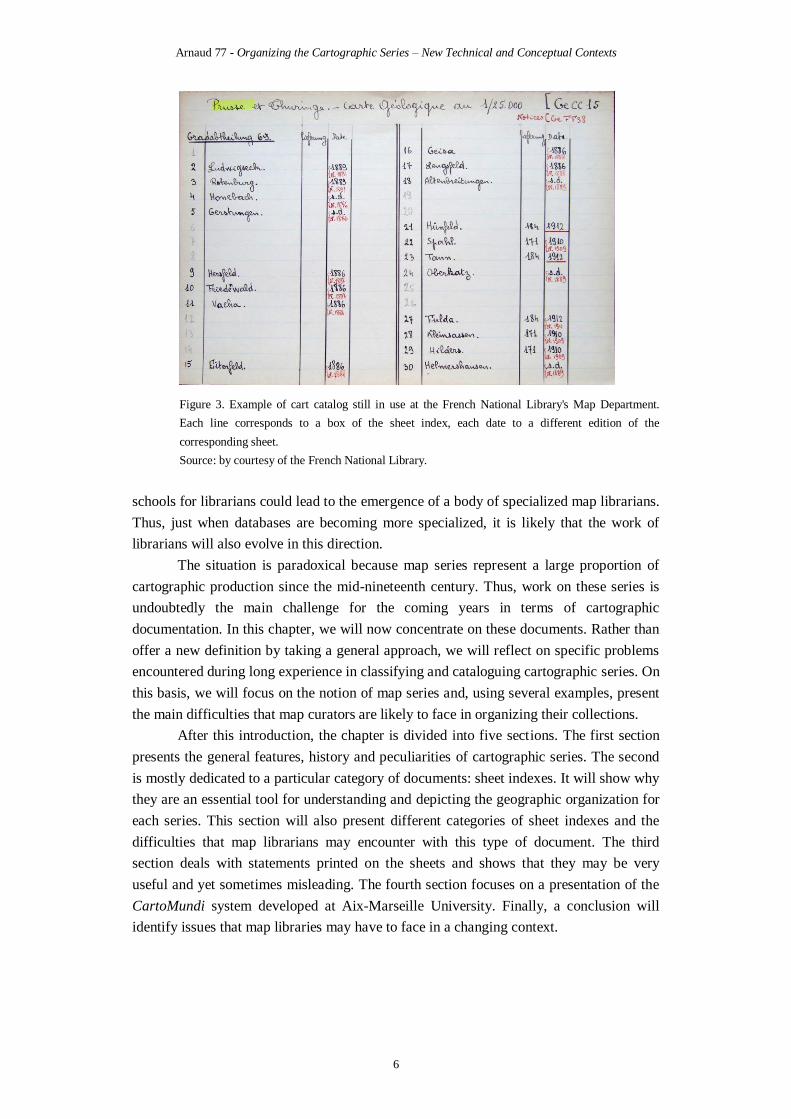
Digital catalogs are so poorly adapted to the peculiarities of map series that most map
librarians continue to use old card catalogs, rather than take advantage of leading
computerization programs. Similar observations have been made in many major map
libraries around the world. In France, for example, the National Library’s Maps
Department - one of the 15 largest map libraries in the world - still uses a card catalog for
map series1 and its earliest records date back to the late nineteenth century. This card
catalog covers approximately 350,000 documents, about a third of its total holdings
(Figure 3).
This situation is changing for two reasons. First, multi-purpose databases
developed during the last decades of the twentieth century have their limitations.
Currently, data managers prefer to create more specific data structures to fit the
peculiarities of documents to be catalogued. In the recent years, this was made easier by
the development of search engines which are able to operate with multiple resources.
Second, over the last decade, online geographic information systems (GISs) have
facilitated the development of enhanced user interfaces for cartographic research.
Although these interfaces have not been adapted to handle search requests such as "I am
looking for a map of Istanbul"2, the user has the possibility of selecting any region of the
1. In other institutions, such as the Library of Congress, each series is cataloged through a single entry which
does not indicate the number of the sheets, between 2 and 2000! 2. Toponyms are very variable by the languages, periods and alphabets. There are also very large ranges of
homonyms. For these reasons they cannot be used as geographic references.
Arnaud 77 - Organizing the Cartographic Series – New Technical and Conceptual Contexts
5
Figure 2. Excerpt from the previous figure. The representation of Constantinople does not exceed
one square centimetre.
Source: Series Balkans 1:1 000 000, sheet Constantinople (ca. 1900). Paris: Service Géographique
de l’Armée, by courtesy of the Paris 8 University's Map Library.
world, regardless of size, via an interactive planisphere. Moreover, these technologies
help with navigation through large sets of maps. Clearly, geographic information will
become a central element in map library management systems in the coming years. In this
context, the future of map libraries will involve the integration of new expertise in the
processing chain. In addition to using a standard methodology for bibliographic
descriptions, it will be necessary to ensure that each record contains geographic data
formatted for access using online GIS.
Currently, there are no specific training courses for map librarians. Map curators
are versatile librarians who may become involved in a map library at some point in their
career. However, despite their undoubted skills in describing printed books and saving
textual data, they have not been trained in dealing with geographic data. Thus, the
possibilities offered by new technologies remain largely untapped in libraries because
their implementation requires important changes that are not currently on the agenda.
Preparing information for geographic databases and understanding specific concepts such
as projections, coordinates, scales, and grids are essential skills. In addition, librarians
must master the GIS tools that will produce this information.
It is not possible to train all librarians in these concepts and software. However,
two complementary changes are on the horizon. First, the development of specific tools
will assist map librarians and simplify the production of geographic data. Meeting this
first objective should not be too difficult, since the data is not used to draw high-speed
railway lines or to fire shells, and therefore it is possible to make approximations. There
are few examples of this kind of tool, but among them is the program CartoMundi Online
promotion of the cartographic heritage (http://cartomundi.eu) developed by Aix-
Marseille University in France. Second, the development of specific courses in training
Arnaud 77 - Organizing the Cartographic Series – New Technical and Conceptual Contexts
6
Figure 3. Example of cart catalog still in use at the French National Library's Map Department.
Each line corresponds to a box of the sheet index, each date to a different edition of the
corresponding sheet.
Source: by courtesy of the French National Library.
schools for librarians could lead to the emergence of a body of specialized map librarians.
Thus, just when databases are becoming more specialized, it is likely that the work of
librarians will also evolve in this direction.
The situation is paradoxical because map series represent a large proportion of
cartographic production since the mid-nineteenth century. Thus, work on these series is
undoubtedly the main challenge for the coming years in terms of cartographic
documentation. In this chapter, we will now concentrate on these documents. Rather than
offer a new definition by taking a general approach, we will reflect on specific problems
encountered during long experience in classifying and cataloguing cartographic series. On
this basis, we will focus on the notion of map series and, using several examples, present
the main difficulties that map curators are likely to face in organizing their collections.
After this introduction, the chapter is divided into five sections. The first section
presents the general features, history and peculiarities of cartographic series. The second
is mostly dedicated to a particular category of documents: sheet indexes. It will show why
they are an essential tool for understanding and depicting the geographic organization for
each series. This section will also present different categories of sheet indexes and the
difficulties that map librarians may encounter with this type of document. The third
section deals with statements printed on the sheets and shows that they may be very
useful and yet sometimes misleading. The fourth section focuses on a presentation of the
CartoMundi system developed at Aix-Marseille University. Finally, a conclusion will
identify issues that map libraries may have to face in a changing context.
Arnaud 77 - Organizing the Cartographic Series – New Technical and Conceptual Contexts
7
Background
Since the mid-nineteenth century, most cartographic documentation has been
organized in series. This massive production was achieved thanks to technical advances
in printing and a growing demand for precision from civil and military administrations.
While they form the largest part of map collections, descriptions of their contents are
often unsatisfactory. Until a few years ago, this was due to the lack of appropriate tools
for map librarians. However, this context is now changing, as recent technological
progress allows more specific descriptions of series in response to demand.
The main difference between monographs and map series is their physical form.
Monographs consist of one document, while each map series is composed of several
documents. There is no equivalent category in library holdings, the closest comparison
could be in the field of book collections. However, organizing a map series is much more
complex. A collection of books includes documents dealing with a similar subject,
published over a period of time. In general, this has developed along a single dimension,
time, and this makes it easier to use a simple list to describe its contents.
Map series, on the other hand, are organized in two dimensions: space (sheets tile
the area covered), and time based on two determinants. The first determinant refers to the
time required to achieve tasks such as survey, mapping, and editing on all sheets in a
series: for example, publication of the topographic map of France, at scale 1:80,000, on
274 sheets, spanned more than half a century. The second determinant is linked to
changes occurring in the represented area: creation of new roads, expansion of cities,
changes in land use, etc. Such transformations lead to revisions on each sheet and to new
editions which are dictated by user demand and the number of changes involved. Thus,
while the whole French territory was not fully covered by the series mentioned above, the
sheet Paris has been produced in six different versions3.
According to the standard definition, a map series is a "map document containing
a specified number of sheets and whose publication is considered as a whole". This
definition is simple and general enough to cover documents in several different categories
and can be used to describe a political world map published in two sheets of the same
date, a detailed topographic map of a country on hundreds of sheets published over a long
period of time, or a town’s cadastral map. Despite the diversity of objects that may
constitute a ‘map series’, the standard definition is not sufficient for representing the
reality of map production, on the one hand, and organizing collections, on the other.
Thus, map curators encounter many difficulties in defining the geographic, temporal and
legal perimeters for the series they hold.
The situation is made even more difficult because IT systems used by libraries to
store data are designed for monographs and therefore do not easily allow for grouping
individual units of cataloguing in higher level sets. In this context, titles of map series are
3. The first edition of this map was published between 1832 and 1880. During this period, the sheet Paris was
published for the first time in 1843, then updated and republished in 1864, 1869, 1872, 1873 and 1876
(Rapport…, 1889, 28-29).

Arnaud 77 - Organizing the Cartographic Series – New Technical and Conceptual Contexts
8
considered as supplements to descriptions of the sheets they contain. This data is not
checked either upstream, in lists of series, or downstream, after cataloguing. In this
context, each librarian selects or composes the title that seems the most relevant on the
basis of the information, usually partial, provided in the documents in the collection.
When the process of cataloguing a series is carried out by several map librarians, it gives
rise to disparities that cancel out the suitability of the title in gathering sets of sheets4.
This issue is of paramount importance with the emergence of civil and military
authorities and of expansionism in several European countries, in the mid-nineteenth
century, and as a result, series became the main method for map production. About 90%
of sheets published since then have been produced in map series. The definition of the
map series is another issue for the management of libraries and sharing of information.
Map librarians carry out combinations and / or divisions that are even more difficult to
operate when some of their collections are incomplete. They must decide between two
options: gathering together documents that may have major differences, or dividing
collections into multiple subcategories. It is not always easy to find a solution between
these two extremes.
The definition of map series is also a challenge for sharing information. As each
library uses different criteria, and there are no controlled and standardized lists, each
institution or map curator proceeds as they think best, according to their existing
collections and this is obviously not conducive to data sharing. It is no coincidence that,
in the largest map libraries, the catalogs for most series have not yet been computerized.
According to these standards, the definition of map series is short enough to
suggest that it could be operative immediately, but this is not always the case. In general,
the larger the number of sheets in a series, the more its production was spread over a long
period and the more exceptions there are to the rule. For example, for the most recent
map of Bulgaria at scale 1:200,000, all 22 sheets were first published in 1994 by the same
publisher, using the same graphic chart and a homogeneous system of sheet numbering.
On the other hand, some series have required decades of work and, over such a long
period, the political situation and / or the producing institutions may change, as may such
information as titles of the map series or national boundaries.
A Recent Class
Map series were born from a technical constraint. In order to print these series,
the area covered was divided into units defined by the size of the paper available and the
capacity of the printing press, which relates back to the time when the engraving process
4. For example, the topographic map of Algeria at scale 1:50 000, published between 1882 and 1984 by the
French authorities, constitutes a series. It was cataloged into the SUDOC (Système unifié de documentation
universitaire) by different librarians who each holds a very partial collection. In the catalog, sheets of this
map are organized under eight different titles: [Carte d'Algérie - 1:50,000] ; [Carte d'Algérie au 1/50,000,
(Type 1922)] ; Carte d'Algérie - 1:50,000 (Type 1922) ; Carte d'Algérie (département de Constantine)
1:50,000 (Type 1922) ; Carte d'Algérie (département d'Oran) 1:50,000 ; Carte d'Algérie au 1:50,000 ; Carte
d'Algérie échelle 1/50.000 ; Carte topographique de l'Algérie 1:50,000. Some titles are enclosed in brackets,
others not. The result is a totally artificial impression of dispersion.

Arnaud 77 - Organizing the Cartographic Series – New Technical and Conceptual Contexts
9
was developed. For example, the bird-eye’s view of Rome published by A. Tempesta in
the late sixteenth century (Tempesta, 1664) was divided into 12 engraved copper plates.
The prints must be assembled to compose the whole picture, because their size far
exceeds the capacity of machines and the paper size available at the time, i.e. 105 x 241
cm. This technique is also used for cartographic materials when their size exceeds that of
the resources available, as shown in the next two examples. The first example dates back
to the early 17th century: a map of France by François de la Guillotière published in 1613
on nine sheets. This document is a good example of a mixed mode of figuration including
a bird’s-eye view and maps. However, the printing units are not independent editorial
units since they do not bear dates, nor any specific information such as titles, or a
statement of responsibility. This information was printed on a single sheet with the
general title of the map and the name of its author. On the contrary, a map of Corsica was
published by Tranchot in 1824 on eight sheets (four large and four small sheets). The four
small sheets were placed in pairs and engraved on two plates of copper. In other words,
these four sheets were printed on only two pieces of paper. Neither Tranchot’s, nor de la
Guillotière’s maps are not strictly speaking series, rather they are monographs whose
division into sheets was first determined by the printing resources available at the time.
The fact that these maps were not sold as separate sheets confirms their unity.
The earliest example of a major map series dates back to the second half of the
eighteenth century: a map of France drawn up and published by the Cassini family in
1749. This map, at scale 1:86,400, covers no less than 180 sheets and its total surface area
is 125 sq.m. Given its size, it was impossible to assemble all the sheets as a single layout.
Each sheet is not only a unit in terms of its production, but also in terms of editorial
criteria and commercial requirements. Depending on needs and resources, it was possible
to buy a single sheet or a set of sheets for a given region, or the entire series. The Cassini
map sheets have all the characteristics of a map series: they are cut according to a regular
grid, and each map bears a specific title and number, an indication of scale, and its date of
publication.
After 1760, the authors of this map had two activities. They produced additional
sheets for the series and they are also responsible for updating previously published
sheets by incorporating changes in the kingdom’s territorial organization (Pelletier, 2013,
p. 146). These updates were local and only affected sheets where changes in the area’s
spatial organization were substantial enough to warrant a new version. From then on,
each sheet became a fully published unit. Maps of cities and ports, for example, were
more likely to be updated frequently than those depicting sparsely populated and less
exploited mountain regions. Thus, because it was technically impossible to produce all
the sheets of a series simultaneously and each sheet was an updatable unit, assembling the
series - as practiced for monographs with several cuts – became an aberrant monster in
terms of temporal cohesion. The juxtaposition of the sheets, which placed surveys from
different periods side by side, resulted in discontinuities in the depiction of new forms of
infrastructure (roads, canals, etc.) and of urban areas.
Moreover, for some series, updates did not systematically cover all the elements
portrayed on the original map. For example, in the early twentieth century, the French

Arnaud 77 - Organizing the Cartographic Series – New Technical and Conceptual Contexts
10
Figure 4. A “nine boxes” sheet index, the central box corresponds to the sheet where it is printed
Source: Series Madagascar 1:100 000, sheet Nosy-Ambositra (1927). Tananarive: Service
Géographique de Madagascar, by courtesy of the IGN's Map Library.
Service géographique de l’Armée (SGA) continued to publish nineteenth-century maps
with poor geodetic control, but, in the absence of more recent documents, they were still
useful. Until they were replaced by new maps using controlled geodetic data, they were
regularly updated with the inclusion of railway lines, but other data remained unchanged5.
This method was affordable because it did not require additional field surveys, but it
produced diachronic figurations: the railway lines were drawn across an outdated
topographic background. The dates assigned to these sheets could not correspond to the
contents of such a diachronic monster. On other series, geographic names may be out of
date. In this case, the sheets bear a statement of a specific date that corresponds to the
initial survey of names on the map6. Thus, cutting a large document into multiple sheets
constitutes in fact the first act in creating a map series. The second phase, which relates to
the editorial autonomy of each sheet, is equally important and involves two separate
categories: monographs with several cuts; and, series containing several sheets.
Geographic Aspects
Geographic aspects of a cartographic series are summarized in a specific
document called the sheet index. This is a graphic document that shows the relative
positions of individual sheets. It is drawn on a white background or is a small-scale map
showing main landmarks such as coastlines, borders and major cities. It can be printed on
a separate sheet or in the margin of each sheet of the whole map. In the latter case, it may
be partial or show only the sheets adjacent to the sheet on which it is printed (Figures 4
and 5).
5. That is the case for example with the map of France at scale 1:320 000, for the version dated 1914
(Rapport…, 1921, 47). 6. That is the case for example with the map of Algeria at scale 1:50 000. Several sheets published at the end
of the 1950s bear the statement “Toponymie mise à jour en 193- “.

Arnaud 77 - Organizing the Cartographic Series – New Technical and Conceptual Contexts
11
Figure 5. Example of a sheet index published into a German catalog during the Second World War
Source : Länderweise Zuzammenstellung aller Karten und Mil-Geo-Arbeiten .Berlin: Ober-
kommando des Heeres. General Staab, 1943, pl. 98.
For a monograph with several cuts, the sheet index acts as a guide for the bookbinder and
disappears after use. Real sheet indexes are produced at the same time as the series and,
most often, when each sheet becomes a separate editorial unit. They are used to evaluate
the area represented by the series and by each sheet and include information on the title
and / or number. As such, they are multipurpose tools and offer many solutions. For
readers, they help to choose the sheets that are of specific interest to them. For librarians,
they are very useful for recording the state of their collections while, for producers, they
can be used to manage and organize the work schedule. Thus many publishers’ catalogs
and reports include sheet indexes which provide information on progress in geodesic
operations, surveying, mapping, and printing for each series (Figure 5).
Whether printed or handwritten, sheet indexes are easy to use and to produce.
Indeed, without special training, most map librarians know how to make a sheet index on

Arnaud 77 - Organizing the Cartographic Series – New Technical and Conceptual Contexts
12
Figures 6-7. System of coordinates and type of dividing grids
6. Coordinates expressed in degrees: limits of the sheet follow a grid of meridians and parallels
Source: Series Poland 1:300 000, Sheet Witebsk. Warsaw: Wojskowy Instytut Geograficzny, 1931,
by courtesy of the IGN's Map Library.
a piece of graph paper. It is no more complicated than drawing a game of Battleships. But
while paper versions of sheet indexes are easy to use locally, they are difficult to record in
a database. This difficulty is probably the main reason why a large proportion of
bibliographic catalogs of map series have not yet been converted into databases. Thirty
years ago, the tools needed to carry out digitalization programs did not exist but, over the
last decade, several excellent software programs have been developed.7 However, this
latest evolution has not yet resulted in significant changes in the work of most map
librarians, although change is coming, as has been shown in several recent experiments
(Arnaud, 2014).
Sharing the Territory
The first element in the diversity of map series is the way in which territory is
divided into multiple sheets. Although there is endless geometric patterns for cutting up
the plan, the aim of editors is not to create difficulties. They have developed several ways
of sharing the territory, each of which provides solutions and is adapted to specific uses.
For each series, authors have to choose the method that best suits their needs.
Independently of the method chosen, individual sheets in a series can be
organized either edge-to-edge or overlapping. The most common method is edge-to-edge
7. Geographic information systems – GIS – are available since the early 1960s. From this period, they are
very useful to build georeferenced sheet indexes but it remained difficult to share them online before the
development of the method called mashup. This method allows to represent the perimeter of each document
on a planisphere online. That was the last stage of development of the tools needed to implement online
search engine by geographic location.

Arnaud 77 - Organizing the Cartographic Series – New Technical and Conceptual Contexts
13
7. Coordinates expressed in linear units: limits of the sheet follow a flat grid, determined after
projection
Source: Series Rumänien 1:100 000, Sheet Beius. Vienna: Militärgeographisches Institut, 1938, by
courtesy of the Paris 8 University's Map Library.
which shows each part of the territory once and only once. This principle has the
advantage of avoiding confusion when exchanging information. On the other hand, it is
necessary to consult several sheets at the same time in order to have an overview of the
geographic areas near the edges. The smaller the sheets, the greater the need to consult
several documents simultaneously. For example, for the map of France at scale 1:200,000
published between 1881 and 1899, each sheet measures 42 x 30 cm. It is estimated that
readers must consult two sheets at a time to see a fifth to a quarter of the whole map. The
overlap system overcomes this difficulty, but usually increases the number of sheets and
updating them becomes more complex because up to four documents must be changed
for any place located in the corner of one sheet. Given the time lapses between updates, it
is conceivable that the same place could be represented in four different ways. Such
inconsistencies may be acceptable for a road map, but they are unacceptable for military,
administrative or legal uses. For this reason, most editors prefer edge-to-edge sheets.
Apart from this first distinction, different systems may be used to draw the lines
separating the sheets. Options include topographic, legal or and administrative borders or
a regular grid organized independently of the places represented. Topographic system is
rare and used mainly for cadastral maps. The limits of the area displayed on the sheet
follow streets or roads in order to delimit blocks. According to this method, property units
(which are the main purpose of a cadaster) are never divided across several sheets. To
optimize the use of paper, each section of the territory is drawn to fit onto the sheet. On a
smaller scale, the current map of French counties is based on administrative boundaries,

Arnaud 77 - Organizing the Cartographic Series – New Technical and Conceptual Contexts
14
Figure 8. A sheet index with overlapped sheets
Source: drawing of the author, base map Europe, 1:750 000, sheet Saloniki, Seres, Xanthi, Kastro,
Pharsalos (1897). Vienna: K.u.K. militär-geographishes Institut. By courtesy of the Paris 8
University's Map Library.
but creates a rather complicated sheet index and sheets can vary in size with a ratio of one
to two8.
Regular grids are the most common way of dividing maps into several parts and
this makes it possible to produce sheets of the same size. For larger series, regular grids
are of paramount importance when working with or classifying a large number of sheets.
However, the earth’s surface is approximately spherical (i.e. three-dimensional) and
sheets of paper are planar (two-dimensional) so transferring the earth's geometry onto a
flat map has to be a projection. There are several methods for overcoming this difficulty,
each with their specific properties. It is necessary to choose a system on a case-by-case
basis taking into account the geographic area to be represented, the scale of reduction and
the specific objective for the map. Thus, conformal projections (which display relative
angles correctly) are favored for nautical charts; while equivalent projections (which
display areas accurately) are preferred for topographic maps. Dividing lines between the
sheets can be determined in two ways: either, where they are drawn on the terrestrial
sphere before projection, they follow a grid of meridians and parallels and their limits are
given as angular values, degrees or grades; or they are drawn after projection (i.e. as a
two-dimensional drawing), in which case they make a flat grid for which the coordinates
are expressed as linear values (meters, yards, miles, etc.). These options are very useful
for identifying the type of division system to be used for each map (Figures 6-7).
Finally, the division of maps into sheets can also take advantage of a vague notion
of territory, for example, a series of overlapped sheets as in the map of Macedonia (figure 8)
8. Series « Départementale, routière et administrative », Institut géographique national. Series in service since
2005.
Arnaud 77 - Organizing the Cartographic Series – New Technical and Conceptual Contexts
15
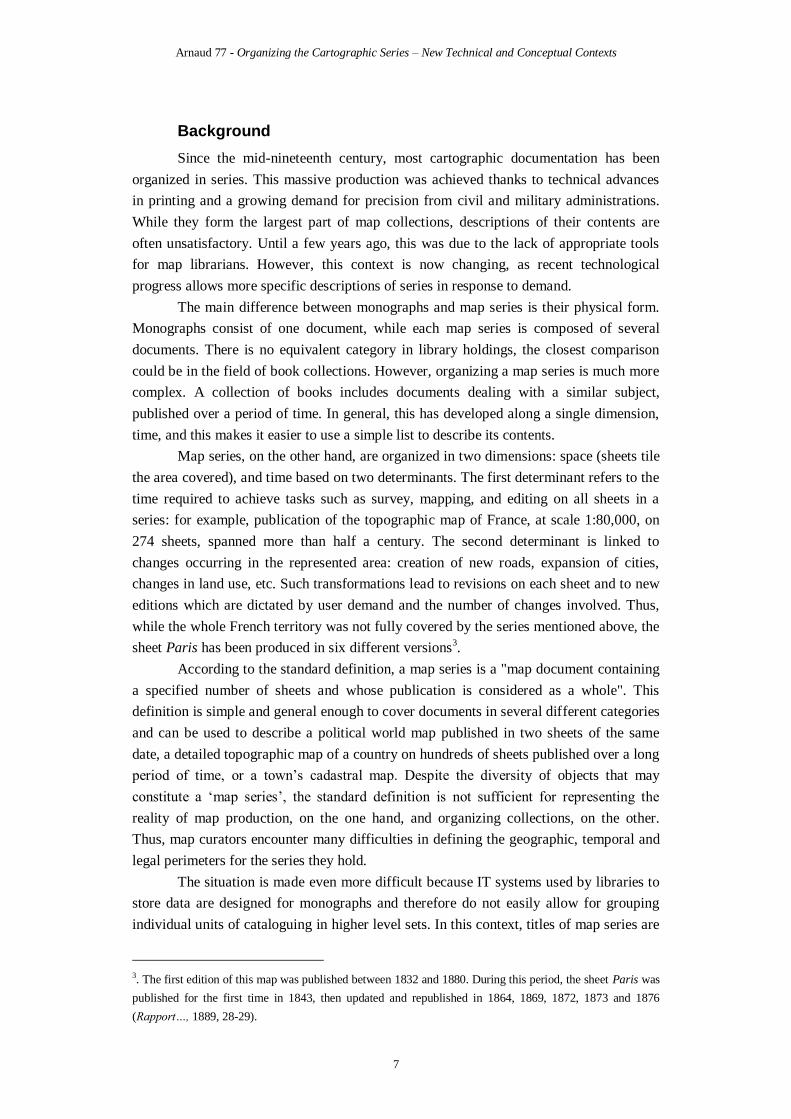
Figure 9. A sheet – unit of edition – divided into two units of production
Source: Series: Indochina, 1:400 000, sheet: Hanoï; Western part (ca. 1939); Eastern part (1939).
Hanoï: Service géographique de l’Indochine, by courtesy of the IGN's Map Library.
In addition, there are hybrid divisions, such as a cadastral map showing the area
surrounding the city of Alexandria, at scale 1:1000, is divided into rectangular sheets
using a metric grid, but each property appearing on two sheets is entirely redrawn in the
margin of the sheet where the largest section is displayed.9
Producing sheet indexes becomes particularly complex when sheets in the series,
even when divided, are still too large for the press. This is the case for several maps of
Morocco and Indochina published between 1900 and 1930 by the French colonial
authorities. For Indochina, and in particular the general map at scale 1:400,000, is
probably the most interesting example. Each sheet was divided into two printing units,
East and West. Next, these two sheets were bound together, each sheet having a frame on
three sides and a simple ‘cutting line’ on the fourth. Thus, each editorial unit corresponds
to two printing units.
Similarly, textual information is printed across both sheets with each statement
placed in the middle of a sheet divided into two parts: for example, “Edition de” appears
on the western unit (left side) and “Juillet 1928” on the eastern unit (right side).
Moreover, with regard to the borders for the series, units representing the sea or an area
outside the scope of the map were not included. On these sheets, the other unit was
printed as a whole half-size sheet - with a four-sided frame (Figure 9).
Many collections of this map contain units that have not been bound together. In
some cases, despite the plurality of editions, it is not possible to restore the original pairs.
Thus, several Western parts, which are undated, are similar (according to their
statements) although it is obvious that they were published at different times. For this
series, ten years after its publication with two printed units per sheet, the publisher
decided to match the publishing units (or sheets) with the printing units. This allowed
each document to become a whole bibliographic unit with a much simpler description.
9. This map was published at the beginning of the 1930s by the Survey of Egypt. It has 175 sheets (Arnaud,
1989, p. 62).
Arnaud 77 - Organizing the Cartographic Series – New Technical and Conceptual Contexts
16
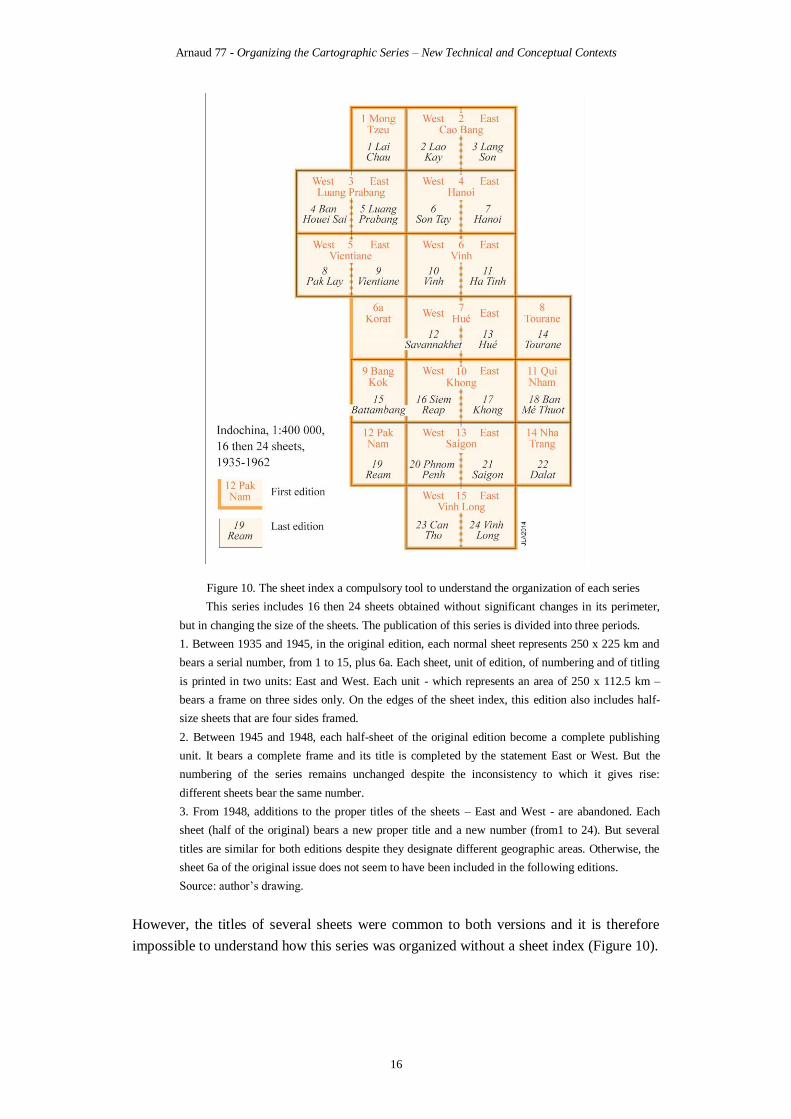
Figure 10. The sheet index a compulsory tool to understand the organization of each series
This series includes 16 then 24 sheets obtained without significant changes in its perimeter,
but in changing the size of the sheets. The publication of this series is divided into three periods.
1. Between 1935 and 1945, in the original edition, each normal sheet represents 250 x 225 km and
bears a serial number, from 1 to 15, plus 6a. Each sheet, unit of edition, of numbering and of titling
is printed in two units: East and West. Each unit - which represents an area of 250 x 112.5 km –
bears a frame on three sides only. On the edges of the sheet index, this edition also includes half-
size sheets that are four sides framed.
2. Between 1945 and 1948, each half-sheet of the original edition become a complete publishing
unit. It bears a complete frame and its title is completed by the statement East or West. But the
numbering of the series remains unchanged despite the inconsistency to which it gives rise:
different sheets bear the same number.
3. From 1948, additions to the proper titles of the sheets – East and West - are abandoned. Each
sheet (half of the original) bears a new proper title and a new number (from1 to 24). But several
titles are similar for both editions despite they designate different geographic areas. Otherwise, the
sheet 6a of the original issue does not seem to have been included in the following editions.
Source: author’s drawing.
However, the titles of several sheets were common to both versions and it is therefore
impossible to understand how this series was organized without a sheet index (Figure 10).
Arnaud 77 - Organizing the Cartographic Series – New Technical and Conceptual Contexts
17
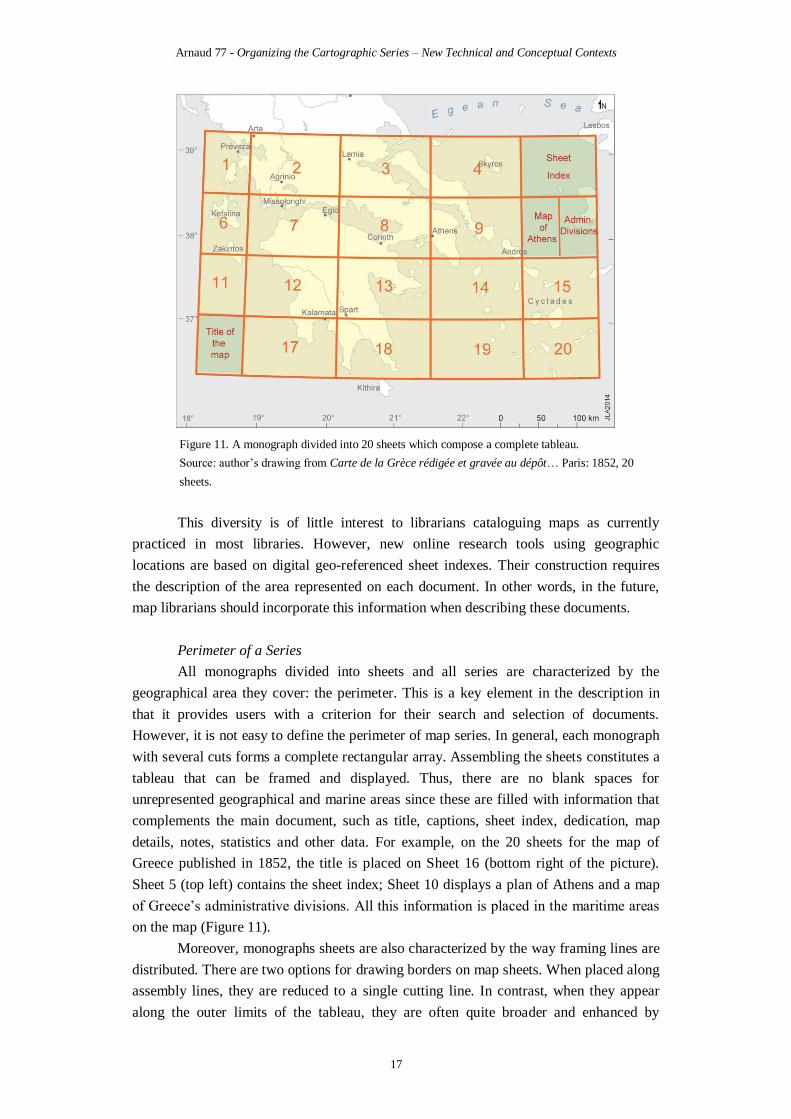
Figure 11. A monograph divided into 20 sheets which compose a complete tableau.
Source: author’s drawing from Carte de la Grèce rédigée et gravée au dépôt… Paris: 1852, 20
sheets.
This diversity is of little interest to librarians cataloguing maps as currently
practiced in most libraries. However, new online research tools using geographic
locations are based on digital geo-referenced sheet indexes. Their construction requires
the description of the area represented on each document. In other words, in the future,
map librarians should incorporate this information when describing these documents.
Perimeter of a Series
All monographs divided into sheets and all series are characterized by the
geographical area they cover: the perimeter. This is a key element in the description in
that it provides users with a criterion for their search and selection of documents.
However, it is not easy to define the perimeter of map series. In general, each monograph
with several cuts forms a complete rectangular array. Assembling the sheets constitutes a
tableau that can be framed and displayed. Thus, there are no blank spaces for
unrepresented geographical and marine areas since these are filled with information that
complements the main document, such as title, captions, sheet index, dedication, map
details, notes, statistics and other data. For example, on the 20 sheets for the map of
Greece published in 1852, the title is placed on Sheet 16 (bottom right of the picture).
Sheet 5 (top left) contains the sheet index; Sheet 10 displays a plan of Athens and a map
of Greece’s administrative divisions. All this information is placed in the maritime areas
on the map (Figure 11).
Moreover, monographs sheets are also characterized by the way framing lines are
distributed. There are two options for drawing borders on map sheets. When placed along
assembly lines, they are reduced to a single cutting line. In contrast, when they appear
along the outer limits of the tableau, they are often quite broader and enhanced by

Arnaud 77 - Organizing the Cartographic Series – New Technical and Conceptual Contexts
18
spandrels, gadroons, and interlaces. Whatever the chosen form or quality of execution for
these borders, their inclusion clearly indicates that these sheets were not intended to be
self-contained units. Each monograph is therefore the result of an overall project which
determines both the scope of the area represented and the distribution of information in
the tableau. They are designed as finished articles and the authors did not intend to extend
the geographical area.
For map series, in so far as each sheet is conceived as a separate editorial unit, the
perimeter of each series can take several forms and may change over time or even be
increased or reduced in terms of the number of sheets used. All scenarios are possible.
Some map series show territorial discontinuities, e.g. for countries with many islands
(Greece, Indonesia) or, in rare cases, they may represent only the shore areas, leaving a
‘hole’ in the middle. A good example of this option is the map of the vast island of
Greenland at scale 1:250,000.
For each series, several sheet indexes can contain different perimeters and were
used as working tools. For this reason, they sometimes display projects, rather than the
final result. During the production process for a series, the political or military context
may change substantially and thus result in modifications to the original project. Such
changes are particularly important when the publisher prepares a map of regions in
another country, e.g. which a foreign country requires for military purposes. It is no
coincidence that, in 1915, the British army extended a map series covering Eastern
Turkey, produced at the beginning of the century, with additional maps to the south
(Syria and Iraq)10
. A more recent example is a map of Central Africa at scale 1:500,000.
The French Institut geographique national (IGN)’s catalog for 1968 indicates that this
series should have 31 sheets whereas in fact, there are only nine. This 1968 version is
clearly the result of an underestimation of the ability of African countries (Cameroon,
Central African Republic and Congo, which became independent in 1960) to establish
their organizations for cartographic production. Thus, the scope of a map series will often
have to be adjusted in response to changing governmental and political decisions.
When the numbering of sheets in a map series is not organized systematically, as
it is the case with a map of the world which indicates a priori the perimeter and the
number of each sheet, we can use this numbering system to identify the geographic
changes of the series. For example, an early twentieth-century map of Transvaal
published by Major Jackson, the numbering of the sheets clearly indicates the chronology
of progress on the geographical survey (Liebenberg, 2014, p. 224).
Less obviously, and therefore more difficult to document, the perimeters of map
series are often subject to adjustments at the margins, particularly for coasts and borders.
Sometimes the application of a regular grid produces sheets representing very small areas.
For this reason, these sheets are often removed and the areas they represent are integrated
on neighboring sheets with wider perimeters. But such decisions are not easy to make and
many examples attest to numerous hesitations. For example, the Cap Sigli sheet from a
map of Algeria at scale 1:50,000 covers only a few square kilometers (the rest of the sheet
10. Series Eastern Turkey in Asia, published from 1901 in 34 sheets, extended by 16 sheets south from 1915
without change to the title of the series and to its proper number: IDWO 1522.
Arnaud 77 - Organizing the Cartographic Series – New Technical and Conceptual Contexts
19
represents the Mediterranean to the north of the coast). It was published in four editions
between 1888 and 1922, but for the period 1913 to 1964, this area was also included on
the sheet covering Djeblaa immediately to the south. In this situation, it is not easy to
identify how many sheets the series originally contained. The way the sheets are
numbered increases the difficulties: the Cap Sigli sheet bears number 10 and the Djeblaa
sheet is Number 25 between 1894 and 1921, while the extended sheet is entitled Cap Sigli
– Djeblaa and bears the number 10-25. In other words, in terms of production units, this
situation corresponds to two sheets but, in terms of publication units, there are several
documents and three different perimeters.
The number of sheets in a series is very difficult to assess when the division is
based on a theoretical grid for which certain cells become published sheets when
necessary. This occurs on many large-scale maps of emerging countries where some
regions (usually sparsely inhabited) do not require maps at the same scale. For example, a
map of Tanzania at scale 1:50,000 has 1,803 sheets according to its sheet index. The
index follows a standardized method of divisions based on the international map of the
world and therefore the sheet numbers are allocated a priori. However, the current
version has only 1,117 sheets, the rest going through a potentially evolving process. On
the one hand, the objective is not to cover the whole country, but on the other, it is
conceivable that new sheets will be added to the list in the coming years in response to
future developments and needs. Here, the number of sheets in the series can be defined in
two different ways, either by the 1803 boxes indicated in the sheet index, even though it
is unlikely that all these sheets will in fact be published, or by the number of sheets
published when the series is being catalogued, even though this figure will probably
increase at a later date. In fact, it will only be possible to indicate a final number when
this series is replaced by a new document based on a new method for dividing the
territory or a different method of production.
Perimeters of map series are also influenced by political changes and areas
covered by some series may be subject to sharing arrangements between different States
due to the collapse of a common sovereignty. For example, at the end of World War I, the
Austro-Hungarian monarchy was split up and its territories reorganized into several new
states. The map of Central Europe at scale 1:200,000 published in Vienna at the end of
the War was reproduced by Hungary, Czechoslovakia, Yugoslavia. Later, the sheets for
this map were copied by most European armies during World War II. In total, more than
80 series, including 29 published in Czechoslovakia between 1918 and 1955, were
produced from the same matrix.
Editor Catalogs and Real Publications
Several sheets include information on contiguous sheets. Their titles are written
directly in the margins, e.g. the name of the eastern sheet is in the right margin.
Sometimes, partial sheet indexes (in 3 x 3 boxes) indicate the titles of neighboring sheets.
Where general indexes or lists are not available, this information is often valuable for
constructing, step by step, the sheet index for the whole series. However, it also reflects
the variability of a series’ perimeter during its production. Comparison of these indexes

Arnaud 77 - Organizing the Cartographic Series – New Technical and Conceptual Contexts
20
with lists of the published sheets sometimes shows that many sheets for the initial project
were not published and/or their titles were changed several times. Thus, the perimeter for
a series and the estimation of the number of sheets it contains must still be checked
against lists of sheets currently preserved in several collections, regardless of the quality
of this documentation.
In some rare cases, the series were combined for various reasons. For example,
between 1910 and 1914, SGA published a map of Tunisia at scale 1:500,000 with seven
sheets divided on the basis of the international system. After World War I, IGN, which
replaced SGA in 1943, launched the publication of a new series using the same scale and
the same division system as for a map series for Algeria. This series has 44 sheets, three
of which are also included in the map of Tunisia. In IGN’s annual reports, work on these
two documents was covered in two separate chapters while, in the IGN's catalog of
publications (1949), the two series are grouped together (Catalogue, 1949, 11). Given the
small number of sheets for the map of Tunisia and its overlap with that of Algeria, it was
decided to bring them together under a single title "Carte d’Afrique du Nord", which is
only found in this catalog. At the same time, the titles printed on these sheets were not
changed and did not take into account this consolidation which seems to be carried out
only for commercial purposes. In addition, the sheets for the map of Algeria representing
the Sahara regions, which are less well-documented than for the north, follow a different
graphic chart and bear a different title. In other words, there are two major differences
between the titles found in the catalog and those printed on the sheets. Obviously,
production offices were organized into geographic divisions that do not correspond to the
way the results of their work were displayed in the catalog of publications. Such
differences indicate that each phase in the process has its specific requirements. Operating
perimeters for the service of production - depending on terrain - are different from
perimeters used by the sales department. Here, map curators have several equally relevant
possibilities for organizing their collections.
In setting the scope for a series in its various interpretations, it is always fruitful to
compare actual documents with reports and catalogs published by the production
institution. This is even more important when individual sheets bear little information
about the series in which they are published. These examples show that it is not enough
just to give a description of all sheets in a series to describe the series itself. In other
words, it is necessary to analyze the series from two perspectives in order to grasp the
multiple peculiarities of a single series. A bottom-up approach (the printed units
themselves, i.e. sheets) and a top-down approach must be used for establishing rules for
organizing the relationship between lower-level sheets. The sheet index is one of the main
tools for this analysis.
From Sheets to Map Series
Each sheet in a series bears several statements and the concepts of series and
sheets correspond to two levels of description. Thus, depending on how each statement
refers to these levels, it may be classified into three different categories:
Arnaud 77 - Organizing the Cartographic Series – New Technical and Conceptual Contexts
21
1. Information common to the entire series or to a subset of sheets: title, collective
responsibility, etc.
2. Information specific to each sheet which refers to the serial organization of the
series: sheet number (spatial organization), and edition number (temporal organization);
3. Information specific to each sheet: individual title, person or agency
responsible for its production, date, etc.
The first two categories are more likely to be used in describing and defining a
map series. Like the sheet index, individual statements relating to the serial organization
are a good source for understanding the relationship between individual sheets and the
whole series. The following section discusses ways in which statements of the first two
categories are used, but may lead to confusion.
Edition Number
In the field of cartography, the concept of edition is quite elastic. It can include
prints, reprints, publications, and republications, and of course their equivalents in other
languages and may vary from one publisher to another and from one map-maker to
another. In addition, some sheets bear explicit edition numbers, generally,
chronologically (the 3rd
edition following the 2nd
). On this basis, numbering can be used
to set up a list of published versions for each sheet. However, this exercise is not as
simple it sounds. In several cases, the first version of a sheet does not bear any edition
number at all and it is only with the publication of the second version that the publisher
adds a reference to, say, a second edition. In other cases, such as a map of
Czechoslovakia at scale 1:200,000, versions of which have an edition number between
two and six, depending on the quantity of versions estimated for each sheet published
before the introduction of numbering11
. For many other series, the published sheets bear
no edition statement. For example, for the Austro-Hungarian map of Central Europe at
scale 1:200,000, the sheet Laibach bears no edition statement for the first eleven versions
published between 1893 and 1907. The next version, published in 1909, is marked
"provisorische ausgabe" [Provisional Edition]. After this, there are no statements of
edition on the six versions published between 1910 and 1913. Finally, the five versions
published between 1913 and 1916 are marked "2 Ausgabe" [Second Edition]. Moreover,
this periodization is not related to dates indicated on the sheets and expressed by the
terms "Nachträge" [additions] or "Teilweise berichtigt bis" [partially corrected to].
Further investigation shows that the concept of Ausgabe [edition] is used by the Austro-
Hungarian Army’s Geographic Institute to refer to changes in the geometric organization
of the sheets, but is not related to updates of topographic contents on each sheet, which
are expressed in the titles quoted above.
These examples are old, but a more recent experience shows that edition numbers
printed on the documents can still be poor indicators. The civil version – there is also a
military version – of the map of France at scale 1:50,000, published by IGN between
1974 and 2010, has a particular feature. For many sheets, the edition numbers are
11. Topographic map of Czechoslovakia, 1:200 000, 1918-1938, 59 sheets. The sheets of this series does not
bear proper title of the series.

Arnaud 77 - Organizing the Cartographic Series – New Technical and Conceptual Contexts
22
discontinuous. For example, for the sheet Molsheim (No. 3716), the 5th edition was
published in 1991, the 7th in 1999 but the 6th seems to have disappeared. This map,
which was primarily designed for military purposes, was drawn up using a specific
production process. In order to meet the needs of both civil and military users, a single
printed matrix was produced for printing two separate versions without duplication of the
production process. On this matrix, each sheet is framed by four wide margins in which
information required for one or other type of user can be printed: statements for the civil
edition are printed on the left margin; and those for military purposes on the three other
margins. Once printed, the map will be cut differently with statements, legends and
edition number that are specific to each type of end user. Thus, each new military edition
has its civil equivalent.
However, when changes for military purposes are not sufficiently important to
warrant a new civil version and/or there are still adequate stocks of this version, IGN has
not always published an updated civil edition. In fact, the complete collection of civil
editions is in the matrix, but they have not all been published. This explains
discontinuities in the numbering for the civil version of this map. Finally, in 1995,
changing the coordinates grid printed on the sheets (Lambert / WGS84) led to a renewal
of the edition numbering for the military series, but not for the civil series. Thus, for the
Plouarzel - Ile d'Ouessant sheet, No. 3016, the first new military edition (M762), dated
March 2002, corresponds to the fourth civil edition (dated 2001), while the cartographic
content of these two documents is exactly the same. In addition to the specific problem
with edition numbers, this example shows that an investigation into the production
process may lead to a better understanding of the peculiarities that appear a priori as
anomalies. It also demonstrates the potentially misleading information in the date
assigned to each document.
Series Titles
Generally, though not systematically, sheets of maps organized in series bear the
title of the series in which they are produced and this title will be helpful for sorting the
sheets. However, sometimes these titles can be misleading. For example, during the first
half of the twentieth century, SGA issued a set of 60 sheets with the generic title “Asie 1
000 000e" without any additional information. Each sheet bears also its own title which
corresponds to the name of the most important place within its perimeter and a number
based on the geographic coordinates of its northeast corner. On this basis, these sheets are
classified together in most map libraries. From a geographic point of view, they are
organized into two groups. The first group covers a large part of Central Asia between
Turkey and India, while the second represents northern Viet Nam, China and parts of
Japan. In this context, map librarians think that the few sheets covering the twelve
degrees of longitude that would ensure the connection between these two sets are missing
in their collections. SGA’s annual reports indicate that it is not the case and that the set is
composed of two non-contiguous groups of sheets: the first group, corresponding to
twenty sheets, is called "Asie centrale", the second, "Asie orientale". Sheet indexes
published in the same reports confirm this geographic distribution. That is to say, when

Arnaud 77 - Organizing the Cartographic Series – New Technical and Conceptual Contexts
23
Figure 12. Two titles – One series. Mapping the proper titles of the series on the sheet index shows
that all the sheets belong to the same series in spite of their different titles.
Source: author’s drawing.
titles are similar, it does not always mean that the corresponding sheets belong to the
same series. However, the reverse is more frequent.
Early in 1940, the German army published several Central European maps at
scale 1:200,000, based on the same sheet index. A first group bears the title Generalkarte
v. Mitteleuropa and contains sheets published between 1940 and 1944. Another set of
sheets is designated Generalkarte v. Mitteleuropa Balkan and was published during the
same period. Most collections are divided into two sets of sheets that match these
designations. Unfortunately, this situation is not confirmed by the geographic distribution
of the sheets, since the difference in titles does not correspond to a difference in the
geographic location of the sheets. On the contrary, comparison of the two sheet indexes
shows that all the sheets belong to a single series. In this case, the titles printed on the
sheets are not relevant (Figure 12).
More recently, in France, a topographic map at scale 1:50,000 presents similar
characteristics. This map covers the entire French territory in 1100 sheets. In 1974, the
publisher, IGN, decided to fold the sheets and rename them "Carte topographique
1:50 000". In order to help with the identification and classification of sheets from
different IGN series on the basis of scale, the series titles were printed in different colors,
and orange was chosen for the map at scale 1:50,000. Ten years later, noting the
effectiveness of this method of identification, each series was renamed according to its

Arnaud 77 - Organizing the Cartographic Series – New Technical and Conceptual Contexts
24
color. Thus the "Carte topographique 1:50 000" became "Série orange 1:50,000" and this
title was applied to all new editions for the next ten years. But from 1994 onwards, sheets
for which no new edition had been issued during the previous ten years were reprinted,
one or more times, under the original title. Of the 1100 sheets in the series, at least 240
sheets fall into this category. They do not present any particular geographic distribution.
Thus, the two titles are by no means a sure basis for dividing sheets into two series. In
general, when a series has been in service for a long time, the number of different series
titles becomes increasingly important.
For example, for the map of Algeria at scale 1:50 000, whose production spanned
almost a whole century, there are not less than twelve different series titles. One might be
tempted to organize the collections on this basis and to share them into as many sets as
there are titles. Because these titles do not correspond to a division of the Algerian
territory, such a proposal would not withstand scrutiny of the geographic distribution for
each set of sheets. Analyzing them in terms of their temporal distribution is not
satisfactory either, since several titles were used simultaneously.
Similarly, there may be a wide range of statements of responsibility printed on
sheets in the same series. This is the case for the map of West Africa at scale 1:200,000
produced during the French colonization period. Production of this map was shared
among offices in Dakar, Brazzaville and Yaoundé. Designation of these offices varies
according to the redactors. Without any explanation, they can be named "Centre",
"Annexe" or sometimes "Service géographique" of Dakar, Brazzaville or Yaoundé, i.e.
nine different designations. Serial numbers are more reliable. Generally, they are used by
the military forces and take the form of one or more letters followed by a number: e.g. M
000 for the French Military; AMS 000 for the US Army Map Service; – or, GSGS 000 for
the British Army’s General Staff Geographical Section.
Series / Subsets
A map series can expand simultaneously in terms of time and of two horizontal
dimensions of space. In addition to these three vectors of change, some series often
contain a fourth dimension. From a “mother series”, the publisher produces subsets that
are relatively autonomous, but closely linked to the original series. The Central Europe
map at scale 1:200,000, published by the Austro-Hungarian Army in the late nineteenth
century, offers a particularly interesting example.
Each sheet of this series is designated by a specific title and a specific four-digit
number based on the geographic coordinates of its center. Many sheets bear an additional
number printed in bold and composed of one, two or three digits. Despite its apparent
homogeneity, the second numbering system does not correspond to an easy-to-use list of
the sheets. Indeed, some sheets representing the same geographic area may have
additional numbers. For example, for the sheet Bolgrad (# 46° 46°), there are three
additional numbers (15, 24 and 181) on three different versions, corresponding to
different dates of issue: 1913, 1914 and 1916. In this example, one might think that the
additional numbers relate to the date of publication for these sheets, but other examples
contradict this first hypothesis. The Odessa sheet (# 48° 46°), is numbered 183 in 1910
Arnaud 77 - Organizing the Cartographic Series – New Technical and Conceptual Contexts
25
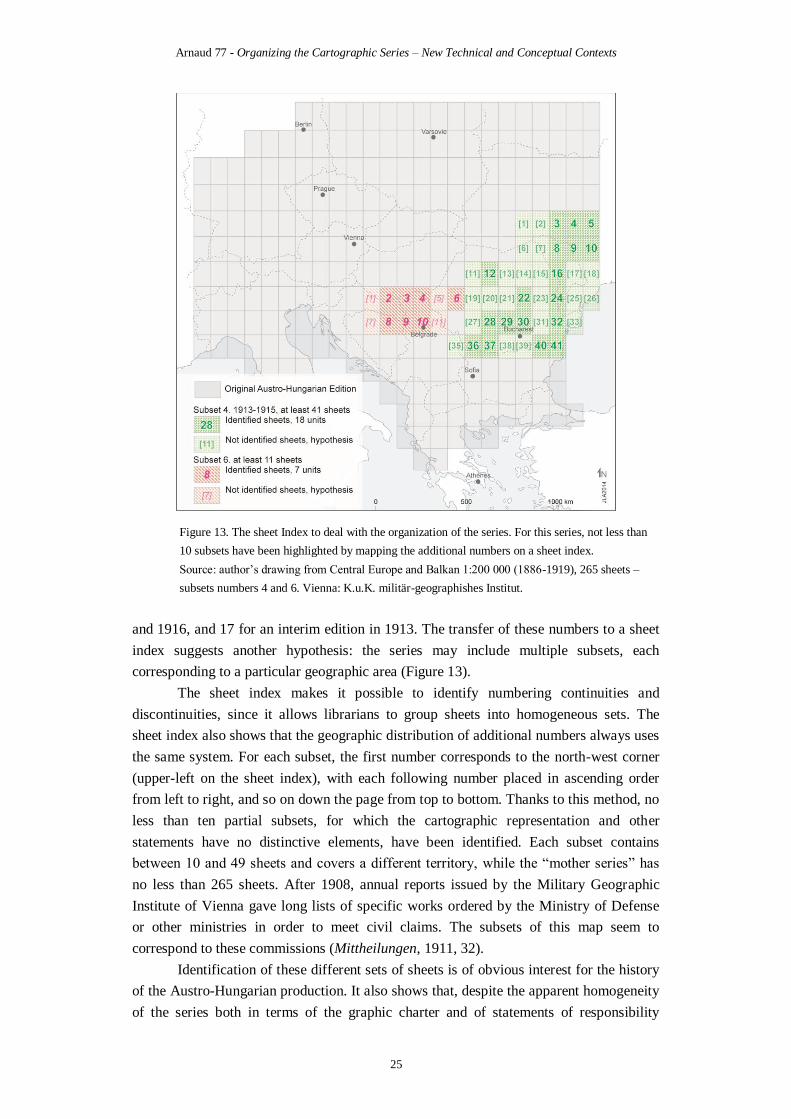
Figure 13. The sheet Index to deal with the organization of the series. For this series, not less than
10 subsets have been highlighted by mapping the additional numbers on a sheet index.
Source: author’s drawing from Central Europe and Balkan 1:200 000 (1886-1919), 265 sheets –
subsets numbers 4 and 6. Vienna: K.u.K. militär-geographishes Institut.
and 1916, and 17 for an interim edition in 1913. The transfer of these numbers to a sheet
index suggests another hypothesis: the series may include multiple subsets, each
corresponding to a particular geographic area (Figure 13).
The sheet index makes it possible to identify numbering continuities and
discontinuities, since it allows librarians to group sheets into homogeneous sets. The
sheet index also shows that the geographic distribution of additional numbers always uses
the same system. For each subset, the first number corresponds to the north-west corner
(upper-left on the sheet index), with each following number placed in ascending order
from left to right, and so on down the page from top to bottom. Thanks to this method, no
less than ten partial subsets, for which the cartographic representation and other
statements have no distinctive elements, have been identified. Each subset contains
between 10 and 49 sheets and covers a different territory, while the “mother series” has
no less than 265 sheets. After 1908, annual reports issued by the Military Geographic
Institute of Vienna gave long lists of specific works ordered by the Ministry of Defense
or other ministries in order to meet civil claims. The subsets of this map seem to
correspond to these commissions (Mittheilungen, 1911, 32).
Identification of these different sets of sheets is of obvious interest for the history
of the Austro-Hungarian production. It also shows that, despite the apparent homogeneity
of the series both in terms of the graphic charter and of statements of responsibility
Arnaud 77 - Organizing the Cartographic Series – New Technical and Conceptual Contexts
26
attributed to each sheet, its production was perhaps not as centralized as it seems. Indeed,
comparisons of the way the sheets were dated and shared into numbered sub-series show
that some sheets were published simultaneously by different services within the Military
Geographic Institute.
Question of Time
As explained earlier, it is not always easy to define the scope of a series. Its
period of issue expressed as a range of years is also difficult to investigate. It is necessary
to identify specific phases in the life of a series. The history of a series starts with the
decision to launch its production. The relevant date is never transferred to the sheets but
is usually found, though not always, in the activity reports. On the other hand, the most
recent date will be that indicating the end of service for a map when it is replaced by
another and / or removed from sale. It is also difficult to find this date because it was
often not recorded. Moreover, once the decision is made to stop producing a series, the
replacement version will be implemented sheet by sheet and it is only when all the sheets
of the new series are available that the previous version will be withdrawn from service.
Thus, substitution of a series is necessarily spread over a long period. For example, the
first sheets of the geological map of France at scale 1:50,000 were published in the 1950s
to replace the previous series at scale 1:80,000. Several sheets for the new edition have
still not been published. Thus, while more of 260 sheets of the former edition are out of
service, about a dozen of sheets from this edition remain the only detailed geological map
of the regions concerned.
Pragmatically, map curators are more interested in a document’s publication date.
However, it is not the purpose of this chapter to go into details about the dating of
documents. In order to identify a series, they generally use a range of dates corresponding
to the initial and final dates of production assigned to the sheets. However, this system
implies that the collection was almost complete but this is not always the case.
CartoMundi – A new Generation Platform
As pointed out in the introduction to this chapter, the program CartoMundi
(Online Promotion of the Cartographic Heritage (http://cartomundi.eu)) offers great
potential for handling changes in cartographic documentation that loom on the horizon12
.
CartoMundi is a collective catalog dedicated to cartographic documents. Its principal
feature, compared to other catalogs, is that it was developed by a research laboratory at
Aix-Marseille University in France in collaboration with the French National Center for
Scientific Research (CNRS). Thus, it was conceptualized by a social scientist, a historian
and user of old maps who was not satisfied by responses to his searches in conventional
12. CartoMundi is developed by the Mediterranean Center for Social Sciences in Aix-en-Provence, under the
auspices of the University of Aix-Marseille, with the support of the French National Center for Scientific
Research - CNRS and several local authorities. Participations to the collective catalog and/or to the state of
production are organized by agreements.

Arnaud 77 - Organizing the Cartographic Series – New Technical and Conceptual Contexts
27
Figure 14. The geographic field, a new type of data at the heart of CartoMundi
Source: author’s drawing.

Arnaud 77 - Organizing the Cartographic Series – New Technical and Conceptual Contexts
28
map catalogs. CartoMundi has a number of features and offers a unique combination of
various tools, such as databases, application programming interfaces, mashup, and a
collaborative platform. There is no other equivalent system for map consultation. In other
words, CartoMundi is the only collective georeferenced online catalog dedicated to
cartographic documents. In addition, the system has been conceived for data sharing and
is a central element in a network of map libraries, of which the most important partners
are IGN and the Bibliothèque nationale de France. As at December 2014, some 15 other
establishments, including universities, libraries, and museums in France and other
countries, were involved in developing CartoMundi.
An Innovative Tool
The search interface for CartoMundi operates mainly with geographic locations.
Users are invited to select the place for which they need maps on a planisphere. The
textual data for each document also contains a description of the perimeter of the area
represented. This data is recorded using a specific format in a geographic field which
fulfills two major functionalities: 1. a geographic engine that compares the selected zone
on the planisphere with the area represented by each document allowing searches by
geographic location; 2. the search results can be displayed on the same planisphere
indicating the zones covered by each document matching the chosen criteria (Figure 14).
In order to ensure interdependence between map series, on the one hand, and
between sheets, on the other, the catalog is organized into two levels: the top level refers
to descriptions of the series; and the bottom level searches on descriptions of the sheets.
Each description for a series corresponds to several descriptions of sheets, while each
description for a sheet corresponds to the description of a single series. To ensure
CartoMundi’s interoperability with other digital catalogs (only one level), the complete
bibliographic notice for each document represents both the general bibliographic notice
for the series and the specific notice for the sheet.
A Double Interface
CartoMundi consists of two complementary elements: a website largely open to
the public, and a collaborative platform restricted to the site’s partners and not accessible
to most visitors. The public interface is first and foremost a tool for searching and
consulting documents. It is organized around an interactive planisphere with which users
can display any part of the world at different scales and select a specific location (Figure
15). This operation initiates a search that generates a list of cartographic documents by
taking into account two variables: 1. the geographical zone selected; and 2. the scales
offering a selected level of zoom for the planisphere. This second variable is one of
CartoMundi’s special features, as the user does not have to display references for detailed
maps (of cities, for example) when consulting a large section of the planisphere, even
though those cities are localized within the selected perimeter. When the user selects a
narrow area on the planisphere (a city, for example), the results do not display references
of general maps (of the world, for example), even if these maps also cover the city in
question. As shown in figure 2, a user looking for a map of Istanbul is not interested in its
representation at scale 1 million.

Arnaud 77 - Organizing the Cartographic Series – New Technical and Conceptual Contexts
29
Figure 15. The main search screen of CartoMundi is composed of two closely related windows.
Textual data are displayed on the left, geographic data are on the right. Source: http://cartomundi.eu
Four criteria allow the user to trim this list: 1.the reduction scale, through a range
of limited / given values; 2. the period of publication, through a range of delimited / given
dates; 3. the subject, through a thesaurus; and, 4. the place where the documents are
stored, through a list of geographic zones organized in several levels (continent,
countries, cities, institutions). Responses are organized into two lists: one for the series,
and the other for the sheets. The user then selects an item in a list and a new screen
displays the data related to the selected document (sheet or series). Textual information
(ISBD block, list of institutions holding the document) are displayed in the left window;
geographic information (sheet index, perimeter of the sheets) in the right window.
Finally, if the document is free of rights and has been reproduced, it can be displayed
with an impressive fluidity (Figure 16).
With regard to the second part of the interface, only map curators whose identity
has been positively checked through a secure system will be granted access to this
collaborative platform which, depending on each partner’s activities and responsibilities,
gives access to three levels of participation to CartoMundi.
1. International Directory. The directory is open to all institutions holding,
producing or selling cartographic documents. This feature is expected to take over the
directory by the International Federation of Library Association (IFLA)’s Geographic and
Cartographic Section published in 2000.
2. State of production. This part of the database gathers together generic
descriptions of cartographic series and sheets. It has been developed upstream from major
collections or/and catalogs of editors. For each referenced series, the state of production
presents a description of all the sheets, regardless of the state of the collection or catalog.
The interface allows online recording of data but, broadly speaking, the source
files for the state of production are generated through external software (spreadsheet and
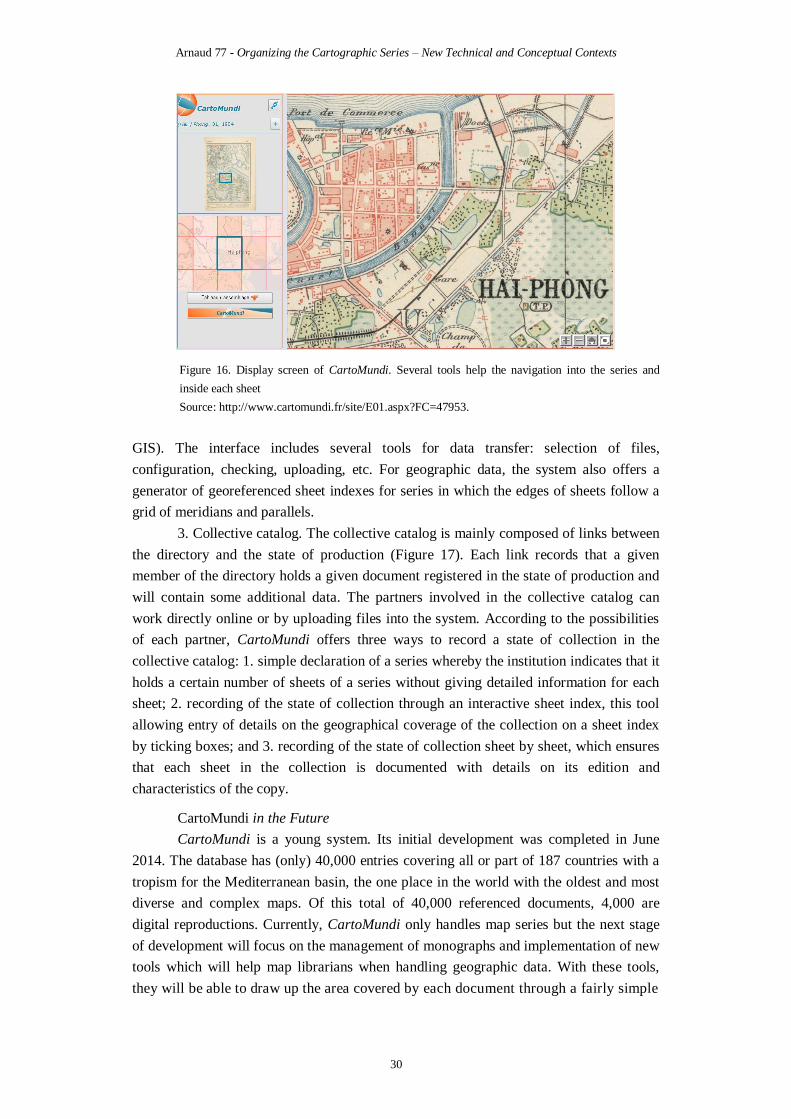
Arnaud 77 - Organizing the Cartographic Series – New Technical and Conceptual Contexts
30
Figure 16. Display screen of CartoMundi. Several tools help the navigation into the series and
inside each sheet
Source: http://www.cartomundi.fr/site/E01.aspx?FC=47953.
GIS). The interface includes several tools for data transfer: selection of files,
configuration, checking, uploading, etc. For geographic data, the system also offers a
generator of georeferenced sheet indexes for series in which the edges of sheets follow a
grid of meridians and parallels.
3. Collective catalog. The collective catalog is mainly composed of links between
the directory and the state of production (Figure 17). Each link records that a given
member of the directory holds a given document registered in the state of production and
will contain some additional data. The partners involved in the collective catalog can
work directly online or by uploading files into the system. According to the possibilities
of each partner, CartoMundi offers three ways to record a state of collection in the
collective catalog: 1. simple declaration of a series whereby the institution indicates that it
holds a certain number of sheets of a series without giving detailed information for each
sheet; 2. recording of the state of collection through an interactive sheet index, this tool
allowing entry of details on the geographical coverage of the collection on a sheet index
by ticking boxes; and 3. recording of the state of collection sheet by sheet, which ensures
that each sheet in the collection is documented with details on its edition and
characteristics of the copy.
CartoMundi in the Future
CartoMundi is a young system. Its initial development was completed in June
2014. The database has (only) 40,000 entries covering all or part of 187 countries with a
tropism for the Mediterranean basin, the one place in the world with the oldest and most
diverse and complex maps. Of this total of 40,000 referenced documents, 4,000 are
digital reproductions. Currently, CartoMundi only handles map series but the next stage
of development will focus on the management of monographs and implementation of new
tools which will help map librarians when handling geographic data. With these tools,
they will be able to draw up the area covered by each document through a fairly simple
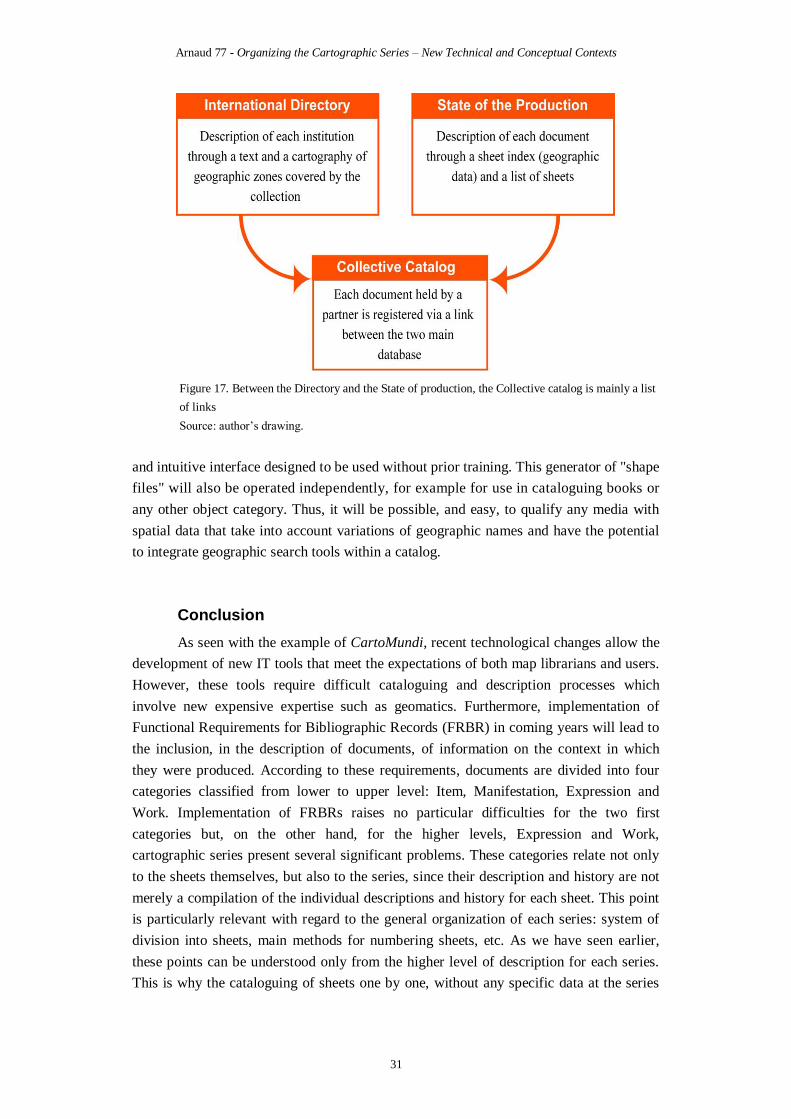
Arnaud 77 - Organizing the Cartographic Series – New Technical and Conceptual Contexts
31
Figure 17. Between the Directory and the State of production, the Collective catalog is mainly a list
of links
Source: author’s drawing.
and intuitive interface designed to be used without prior training. This generator of "shape
files" will also be operated independently, for example for use in cataloguing books or
any other object category. Thus, it will be possible, and easy, to qualify any media with
spatial data that take into account variations of geographic names and have the potential
to integrate geographic search tools within a catalog.
Conclusion
As seen with the example of CartoMundi, recent technological changes allow the
development of new IT tools that meet the expectations of both map librarians and users.
However, these tools require difficult cataloguing and description processes which
involve new expensive expertise such as geomatics. Furthermore, implementation of
Functional Requirements for Bibliographic Records (FRBR) in coming years will lead to
the inclusion, in the description of documents, of information on the context in which
they were produced. According to these requirements, documents are divided into four
categories classified from lower to upper level: Item, Manifestation, Expression and
Work. Implementation of FRBRs raises no particular difficulties for the two first
categories but, on the other hand, for the higher levels, Expression and Work,
cartographic series present several significant problems. These categories relate not only
to the sheets themselves, but also to the series, since their description and history are not
merely a compilation of the individual descriptions and history for each sheet. This point
is particularly relevant with regard to the general organization of each series: system of
division into sheets, main methods for numbering sheets, etc. As we have seen earlier,
these points can be understood only from the higher level of description for each series.
This is why the cataloguing of sheets one by one, without any specific data at the series

Arnaud 77 - Organizing the Cartographic Series – New Technical and Conceptual Contexts
32
level, is inadequate for meeting FRBR criteria. In this context, sharing experiences and
pooling information are key issues.
As pointed out above, cartographic series suffer from neglect by libraries for
decades. Card catalogs and paper sheet Indexes, still widely used to describe map series,
were developed by each map library and reflected the particularities of its collection,
needs and resources. The enormous diversity that results of this type of organization does
not pose major problems as long as these catalogs are only used at the local level, but the
new technical and conceptual framework based on sharing and interoperability that is
now emerging will obviously impose many changes in these practices. Neither national
institutions, nor production establishments have full lists of cartographic series. The only
lists available have been produced as part of independent publications by libraries without
any attempt at standardization13
.
The few examples quoted above are not exceptions. Each series presents details
that must be reported in order to understand the organization of the sheet index, the
numbering and/or titles of sheets, and particular statements. This information is of little
interest to map librarians working with conventional catalogs, but they are of paramount
importance for the implementation of FRBR and, in particular, for defining the more
abstract concepts of this model (Work and Expression) for cartographic series14
. The first
elements proposed in this chapter for defining map series are clearly part of this new
context. But, almost everything remains to be done in order to provide a database of
cartographic series on the basis of a shared structure.
International working groups are essential vectors for achieving such a goal.
Unfortunately the International Federation of Library Association (IFLA)’s Geography
and Map Libraries Section was dismantled at the end of 2009. Similarly, the Association
of European Research Libraries (LIBER)’s Map Librarians Group was disbanded a few
years ago. European map librarians are now gathered together under the umbrella of the
International Cartographic Association (ICA)’s Commission on Digital Technologies in
Cartographic Heritage but the construction of a common structure for listing (before
describing) cartographic series produced by countries during the last two centuries is not
on the agenda. The situation in the USA is the same with the American Library
Association (ALA)’s Map & Geospatial Information Round Table15
. Moreover, historians
of cartography are not particularly interested in series printed by mass (military)
production institutions on bad paper even though these maps constitute the largest
proportion of cartographic production since the mid-nineteenth century. Currently, the
context is not very promising and we may have to wait a few more years before map
13. The book of Nicholson and Sebert (1981), is a very good reference for the cartography of Canada. There
are only few equivalents. 14. In their recent book P. Andrew, S. M. More and M. Larsgaard (2014) explain that the implementation of
the FRBR to cartographic series is not an easy task. Then they give only one example about an American map
published by the United States Geological Survey. Indeed, the European cases are even more complex for, at
least, two reasons. In Europe, history of cartography begins long before the American one. During the
nineteenth Century in Europe, a large part of the cartographic production of each national army was dedicated
to abroad territories and established by copy of foreign sources, without corresponding statements. 15. P. Andrew (2015).
Arnaud 77 - Organizing the Cartographic Series – New Technical and Conceptual Contexts
33
librarians develop an interest in cartographic series; this chapter can be seen as a first step
towards this future.
References
Andrew, P., More, S. M., Larsgaard, M. (2014). RDA and Cartyographic Resources. Chicago: American
Library Association.
Andrew, P. (2015). What’s MAGIRT up to? Current and Future endeavors. Association of Canadian Map
Libraries and Archives Bulletin, 149, 12-15.
Arnaud, J.-L. (2014). Cataloguer, rechercher des cartes. Le référencement géographique en question.
Documentaliste – Sciences de l’information, 2014-3, 68-79.
Berthaut, H.M.A. (1898), La carte de France, 1750-1898, étude historique. Paris: Service géographique de
l’Armée, 2 volumes.
Catalogue des publications (1949). Paris: Institut géographique national.
Duchemin, P.-Y. (2003). Les documents cartographiques. In M.-R. Cabuzon (Ed.), Le catalogage : méthodes
et pratiques. Paris: Edition du Cercle de la librairie, 375-549.
Liebenberg, E. (2014). The « Major Jackson’s Transvaal and Natal Series » of the Anglo-Boers War (1899-
1902): A Cartobibliographic Framework. In E. Liebenberg, P. Colier and Z. G. Török (Ed.), History of
Cartograpy, International Symposium of the ICA, 2012. Heidelberg: Springer, 211-232.
Mittheilungen des Kaiserl. Königl., Militär-Geographischen Institutes (1911). Vienna: Kaiserlich Königlich,
Militär-Geographischen Institutes.
Nicholson, N. L., Sebert, L. M. (1981). The maps of Canada. Folkestone: Wm Dawson & Sons Ltd.
Pelletier, M. (2013). Les Cartes des Cassini. La science au service de l’Etat et des provinces. Paris: Comité
des travaux historiques et scientifiques.
Rapport sur les travaux exécutés en 1888 (1889). Paris: Service géographique de l’Armée.
Rapport sur les travaux exécutés en 1914 (1921). Paris: Service géographique de l’Armée.
Tempesta, A. (1664). Disegno e prospetto dell'alma città di Roma…. Roma: Gio. Iacomo Rossi.
Key Terms and Definitions
Cartographic series: Map which represents a too large area – depending on its scale –and
which is shared into several sheets.
Monograph: Map printed in a unique sheet.
Sheet index: Graphic document that shows the geographic distribution of the sheets of a
cartographic series. It can be drawn on a white background or on a small-scale base map
showing landmarks such as coastlines, borders or major cities.
Recommended