
J. Green, D. Cutajar, S. Guatelli, & Rosenfeld, A.B.
Optimisation of eye plaque dosimetry using Monte Carlo method

Cancer of the eye is a rare and challenging disease
Uveal melanoma is the most prevalent of ocular malignancies in adults
Australia holds one of the highest rates of incidence worldwide
In 2006 – 99 new cases in NSW1
Projected outcomes set to rise to 100 cases per year in the new decade1
Intraocular melanoma: Iris with nodular melanoma (left) and large choroidal melanoma (right)2

Survival is generally poor
Reported 25% five-year mortality3
Metastasis is the main cause of death
Almost 50% of patients will lose vision or the eye due to the disease and/or the treatment

Ocular melanoma is typically treated by resection of the surgical mass or for progressed large tumours, via enucleation (removal of the eye)
Phototherapy
Stereotactic radiosurgery
Radiotherapy:
- Proton Therapy
- Episcleral eye plaque brachytherapy is the preferred treatment method

Surgical insertion (suturing) of a radioactive plaque to the sclera, close to the tumour
Good results in terms of tumour control as well as improved vision retention
I-125 is the most widely used isotope in eye brachytherapy4
Survival rates for patients treated with I-125 plaque brachytherapy are high and compare favourably to those of external beam radiotherapy and enculeation
Ru-106 is preferred for treatment of small tumours -90% tumour control rate5

I-125- 15mm ROPES plaque
Ru-106- Bebig applicators

TLDs
Extrapolation Chambers
Film
Fibre Optic Scintillators

I-125 Brachytherapy Source
AAPM Task Group No. 43 (TG43) Report6
Air Kerma Strength, Geometry, Radial Dose and
Anisotropy Functions
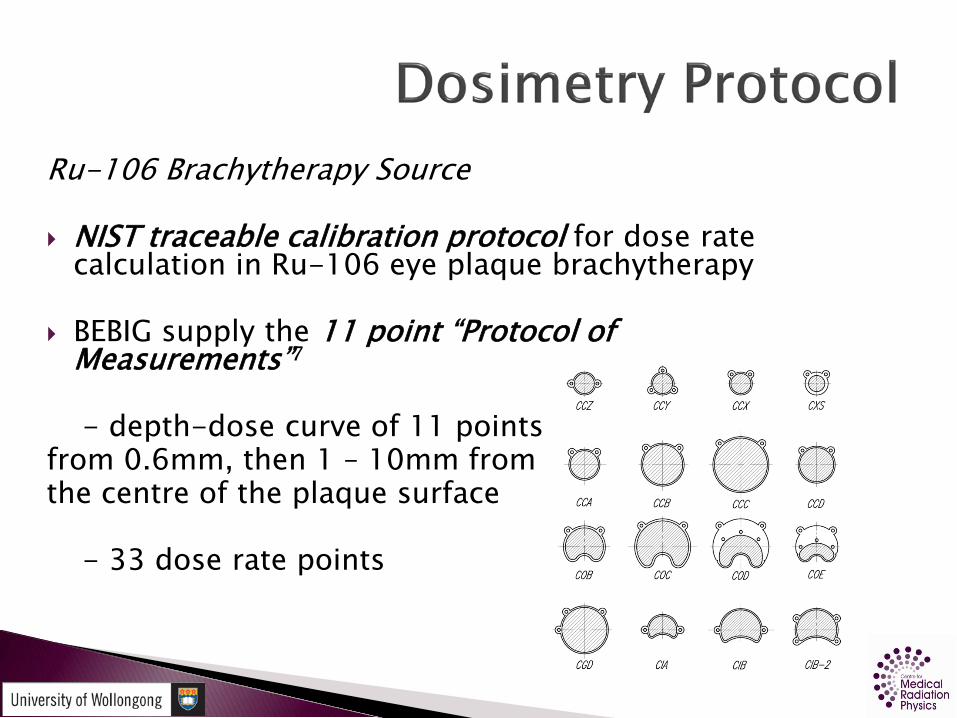
Ru-106 Brachytherapy Source
NIST traceable calibration protocol for dose rate calculation in Ru-106 eye plaque brachytherapy
BEBIG supply the 11 point “Protocol of Measurements”7
- depth-dose curve of 11 points from 0.6mm, then 1 – 10mm from the centre of the plaque surface
- 33 dose rate points

Plaque Simulator (BEBIG GmbH, Berlin, Germany)
Interactive 3D simulation of desired treatment plan
A variety of sources and plaque types are available
Integrates 3D CT information of the eye
Allows the selection of any seed configuration and activity, providing depth dose and isodose curves

TG43 Protocol- the quality of the radial dose function fit for calculating dose data is reduced for values of r ≤0.5cm8
- non-physical fluctuations and significant inaccuracy for values of r ≤ 0.25cm8
- single Amersham Health model 6711 source data for radii between 0.5cm and 7cm
Bebig Protocol of Measurements- measuring 1mm away from the surface of the source decreases resolution

Steep dose gradients
Surrounding critical structures
TPS inaccuracy around border of eye9
Variations in seed activity
Detector size

Three-dimensional semiconductor detectors such as the Medipix2 have been used successfully to provide high spatial resolution X-ray imaging
Radiography, neutronography, and micro-tomography
Single-particle-counting pixel detector with a high detection efficiency and an unlimited dynamic range
256 x 256 sensitive silicon pixel array
real time intensity read-out

Three-dimensional dosimetric images of the dose distribution from a 15mm ROPES plaque loaded with I-125 seeds and the Ru-106 CCD plaque obtained using the Medipix2 detector placed below the plaque within a tissue equivalent phantom of eye matching dimensions10

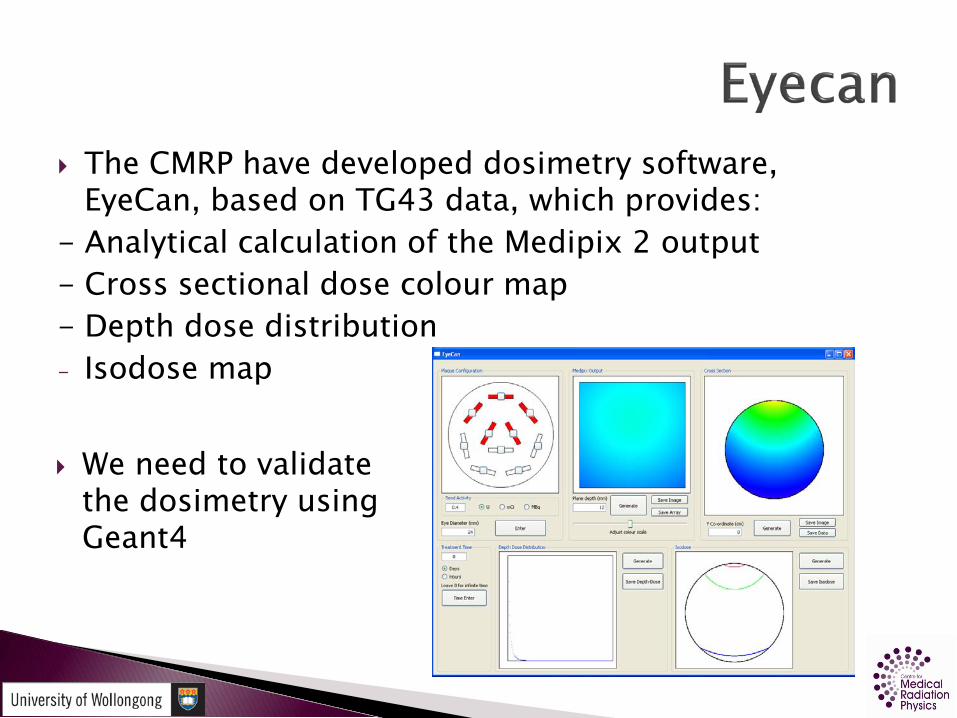
The CMRP have developed dosimetry software, EyeCan, based on TG43 data, which provides:
- Analytical calculation of the Medipix 2 output- Cross sectional dose colour map- Depth dose distribution- Isodose map
We need to validate the dosimetry using Geant4

Monte Carlo methods of dosimetry: - handle complex geometry of the brachytherapy
sources - can achieve even distribution of radioactivity from
the source
Both I-125 and Ru-106 Monte Carlo dosimetry have been performed with good results
new experimental methods such as the Medipix2 developed at CMRP, necessitate Monte Carlo methods to verify dosimetry
Geant4.9.3 Monte Carlo Toolkit for dose optimisation?
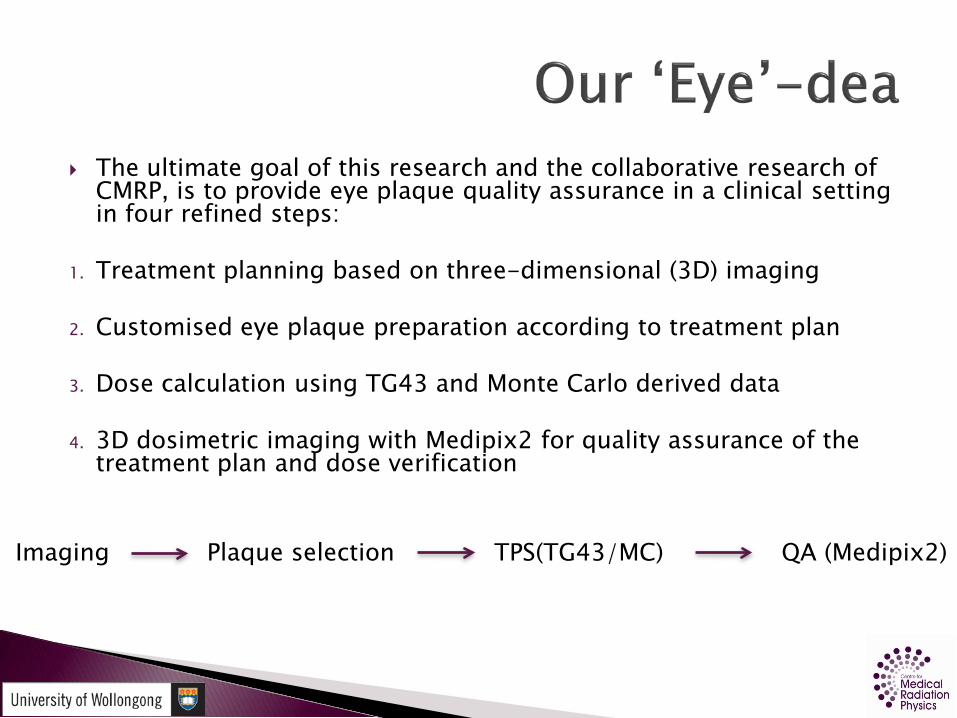
The ultimate goal of this research and the collaborative research of CMRP, is to provide eye plaque quality assurance in a clinical setting in four refined steps:
1. Treatment planning based on three-dimensional (3D) imaging
2. Customised eye plaque preparation according to treatment plan
3. Dose calculation using TG43 and Monte Carlo derived data
4. 3D dosimetric imaging with Medipix2 for quality assurance of the treatment plan and dose verification
i
Imaging Plaque selection TPS(TG43/MC) QA (Medipix2)

Monte Carlo simulation of eye plaque brachytherapy sources using GEANT4 to obtain comprehensive dose data for TPS optimisation
Simulation 1:I-125 single Amersham 6711 seed
Simulation 2:Ru-106 Bebig CCD plaque

Monte Carlo simulation techniques were used to model a single Amersham Health model 6711 I-125 seed in water using the Geant4.9.3 Monte Carlo toolkit
Obtain TG43 parameters

Cylindrical geometry
Source encapsulated within a titanium shell
Fattened endcaps as opposed to curved (Williamson et al. 1988)11
Set of concentric cylinders with an inner silver rod

Eye diameter = 24mm
Radial distances ranging from 1mm – 25mm
Sets of 25 concentric toroids
Positioned every 1mm at an angle, θ, from the centre of the source (assuming radial symmetry), every five degrees
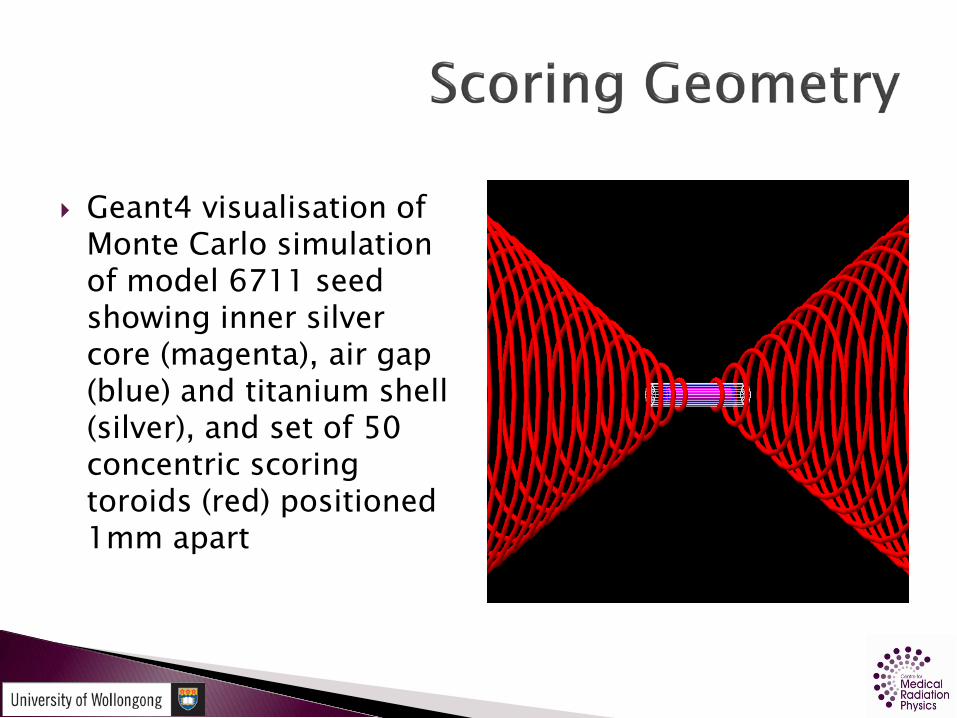
Geant4 visualisation of Monte Carlo simulation of model 6711 seed showing inner silver core (magenta), air gap (blue) and titanium shell (silver), and set of 50 concentric scoring toroids (red) positioned 1mm apart

To measure at zero degrees,scoring toroids were replaced with solid cylinders of varying radius and thickness to score the dose over the 25mm range
Larger radius cylinders used for 1cm and greater distances
Geant4 visualisation of Monte Carlo simulation of single 6711 seed with scoring tubes (red) positioned every 1mm on the
source central axis

Random energy based on spectra
I-125 is a low energy photon emitter
Half-life of 59.4 days6
G4EMLOW.6.9 low-energy data set
Range Cuts - 1μm
Photon energy (keV)
Photons per disintegration
27.2 0.405
27.47 0.756
30.98 0.202
31.88 0.043
35.45 0.067

Cylindrical Geometry considered for random particle generation
Random Coordinate: - side of cylinder - two endcaps
Generate random coordinate between zero and 2AE + AS
The y coordinate was defined by rcosθ and the x coordinate by rsinθ

Geant4 visualisation of Monte Carlo simulation of model 6711 seed

The results of the I-125 simulation were used to calculate the TG43 dosimetric parameters and were in good agreement with the published data
Radial dose functions over the scoring range fell within 3% with a maximum deviation from the TG43 data of only 2.8% (occurring 1mm away from the source on the plaque central axis)
Anisotropy functions were obtained within 5% uncertainty for all polar angles

Monte Carlo derived radial dose function demonstrating the depth-dose delivered on the central axis compared with TG43 data
0
0.2
0.4
0.6
0.8
1
1.2
0 0.5 1 1.5 2 2.5 3
r/cm
g(r) MC
TG43

0
0.2
0.4
0.6
0.8
1
1.2
0 10 20 30 40 50 60 70 80 90
Polar Angle (deg)
Ani
sotr
opy
Func
tion
r = 0.5 (TG43)r = 1cm (TG43)r = 2cm (TG43)Poly. (r = 0.5cm (MC))Poly. (r = 1cm (MC))Poly. (r = 2cm (MC))
Monte Carlo anisotropy functions compared with tabulated data provided by the TG43 protocol

Upturn in dose from 90 to 70 degrees about the source for small values of r
Lower anisotropy functions at small values of theta
Attenuation and geometry effects seed endcaps12
Seed geometry assumed by MC code did not have curved endcaps nor did it consider generating from beneath the silver surface of the inner rod
Results verify the suitability of Geant4 based dosimetry methods for I-125 eye brachytherapy dose optimization

The BEBIG CCD Ru-106 plaque was modelled using the Geant4.9.3 toolkit
BEBIG Ru-106 CCD plaque
Two Monte Carlo simulations to obtain:
1. depth dose data on the central axis for calibration
2. dose rate array spanning the entire volume of the eye for future input into treatment planning software

Plaque Geometry:- Rim diameter = 17.9mm- Height = 4.3mm- Radius of curvature =12mm
Silver spherical cap :- Inner radius = 12.1mm- Inner height = 4.3mm- Two eyelets excluded- 0.1mm added to radius to
account for silver window

Calibration simulation performed using a series of scoring cylinders (G4Tubs) 0.5mm thick and 0.2mm in radius
positioned at 90 degrees, 1mm from the centre of the plaque
Total of 25 cylinders, positioned 1mm apart along plaque central axis to provide comparison data with the BEBIG “Protocol of Measurements”

Sets of 25 concentric scoring rings were positioned at a variable distance along the central axis of the plaque
Rings were 0.2mm thick and of radius ranging from 1mm –25mm
When combined with the central axis calibration data, a total of 650 sampled regions encompassed the eye

Ruthenium-106 decays by beta emission via Rhodium-106
Max energy - 39.4keV
Rhodium-106 half life - only 30seconds
Main electron contribution from the decay of Rh-106
Photon contamination contribution from Rh-106 is significant
Rh-106 beta energy emission:- max 3.54MeV - average 1.41MeV
*Decay data for Ru-106 from the National Nuclear Data Center (2001) was obtained from Appendix A of the ICRU Report 72 (2004) (see Tables 4 & 5)13

Spherical cap uniformly coated with Ru-106 Particles may be emitted from any point on
surface Surface area is proportional to h
Random Height:- random height, z generated between zero and h- consider series of rings located at any point, z- ring radius determined by height in plaque
Random Coordinate:- generated at any point x,y on ring- determine radius of ring

Geant4 visualisation of Monte Carlo simulation of Ru-106 plaque showing silver curved surface

Geant4 simulation successfully generated particles from a uniform distribution of Ru-106 on the surface of the plaque
Scoring over wide range was possible
650 dose point array obtained
Monte Carlo uncertainty within 10% for small distances
Improved statistics required for large distances

0.01
0.1
1
10
100
1000
0 2 4 6 8 10 12 14 16
Rel
etiv
eD
ose
Depth (mm)
MC
Bebig
Monte Carlo derived Ru-106 CCD plaque central axis depth dose compared with central axis dose generated from the Plaque Simulator
Monte Carlo results differed considerably from TPS generated depth dose data
Greatest deviation occurring at very close distances to the plaque surface
A significantly higher dose at small distances (r ≤1cm) in comparison with the TPS results, likely due to:
- source thickness- depth of particle generation
Simulation generated particles from the surface of an infinitesimally thin layer of silver 0.1mm beneath the plaque surface (Bebig)
Astrahan (2003) determined that the radioactivity of the plaque is a distribution through 0.2mm of the silver
Indicates a 0.6 – 0.75mm thick gap between where the radioactive part begins and the edge of the plaque itself

Cross et al. (2001)14 performed Monte Carlo dosimetry of various Ru-106 plaque types and compared the results with experimental measurements performed in Soares et al. (2001)15
Findings:- planar source results within 10%- curved plaque results differed by about 30%
Conclusions:- while limited, experimental approach is more accurate- likely to be a result of differences in source geometry definitions and specifications

Producing unifrom distribution of activity on complex curved surface
Replicating the complicated energy spectrum of Ru-106
Results emphasise the importance of experimental 2D and 3D dosimetric imaging of Ru-106 plaques with devices such as the Medipix2 used in the recent experimental work at the CMRP

Geant4 is a useful tool for dosimetry of plaque brachytherapy sources used in the treatment of ocular melanoma
The dose point array obtained for the 6711 seed can be input into the dose planning software for dose optimisation and the quality assurance of eye plaque brachytherapy treatment
Ru-106 results highlight the complexity of eye brachytherapy source dosimetry, consistent with current literature

Revised source models and scoring –‘babushka’
3D dose imaging and reconstruction of Ru-106 using Medipx2
Monte Carlo modeling of Medipix2 with eye plaque and brachytherapy sources
Monte Carlo modeling of 15mm ROPES plaque
Effect on surrounding critical structures using Geant4

“And so we say ‘Hooray for eyes! Hooray, hooray,
hooray . . . for eyes!”
(Theo. LeSieg)

1. Cancer Institute NSW. (2009). Cancer in New South Wales: Incidence and Mortality 2007. NSW: Cancer Institute NSW.
2. Shields, C.L., & Shields, J.A. (2009). Ocular melanoma: Relatively rare butrequiring respect. Clinics in Dermatology, 27(1), 122 – 133.
3. Chang, A.E., Karnell, L.H., & Menck, H.R. (1998). The National Cancer Data Basereport on cutaneous and noncutaneous melanoma: A summary of 84,836 casesfrom the past decade. The American College of Surgeons Commission on Cancerand the American Cancer Society. Cancer, 83(8), 1664 – 1678.
4. Chan, M.F, Fung, A.Y.C., Hu, Y., Chui, C., Amols, H., Zaider, M., et al. (2001). Themeasurements of three-dimensional dose distribution of a ruthenium-106ophthalmological applicator using magnetic resonance imaging of BANGpolymer gels. Journal of Applied Clinical Medical Physics, 2(2), 85 – 89.
5. Eichmann, M., Flühs, D., & Spaan, B. (2009). Development of a high precision dosimetry system for the measurement of surface dose rate distribution for eye applicators. Medical Physics, 36(10), 4634 – 4643.
6. Rivard, M.J., Coursey, B.M., DeWerd, L.A., Hanson, W.F., Huq, M.S., Ibbott, G.S.,et al. (2004). Update of AAPM Task Group No. 43 Report: A revised AAPMprotocol for brachytherapy dose calculations. Medical Physics, 31(3), 633 – 674.

7. Astrahan, M.A. (2003). A patch source model for treatment planning ofruthenium ophthalmic applicators. Medical Physics, 30(6), 1219 – 1228.
8. Taylor, R.E.P., & Rogers, D.W.O. (2008). More accurate fitting of I-125 and Pd-103 radial dose functions. Medical Physics, 35(9), 4242 – 4250.
9. Granero, D., Perez-Calatayud, J., Ballester, F., Casal, E., & de Frutos, J.M. (2004).Dosimetric studies of the 15 mm ROPES eye plaque. Medical Physics, 31(12),3330 – 3336.
10. Weaver, M., Green, J., Petasecca, M., Lerch, M.L.F., Cutajar, D., Franklin, D., et al.(2010). Three-dimensional dosimetry imaging technique of I-125 plaque for eyecancer treatment. Proceedings of the 11th International Workshop on RadiationImaging Detectors. Nuclear Instruments and Methods in Physics ResearchSection A: Accelerators, Spectrometers, Detectors and Associated Equipment,doi:10.1016/j.nima.2010.06.187
11. Williamson, J.F. (1988). Monte Carlo evaluation of specific dose constants in water for I-125 seeds. Medical Physics, 15(5), 686 – 694
12. Dolan, J., Li, Z., & Williamson, J.F. (2006). Monte Carlo and experimentaldosimetry of an 125I brachytherapy seed. Medical Physics, 33(12), 4675 – 4684.

13. ICRU (2004). Sources and their application in brachytherapy (Report 72).Journal of the ICRU, 4(2), 21 – 89.
14. Cross, W.G., Hokkanen, J., Mourtada, F., Sipila, P., Soares, C.G., &Vynckier, S. (2001). Calculation of beta-ray dose distributions fromophthalmic applicators and comparison with measurements in a modeleye. Medical Physics, 28(7), 1385 – 1396.
15. Soares, C.G., Vynckier, S., Järvinen, H., Cross, W.G., Sipila, P., Flühs, D., etal. (2001). Dosimetry of beta-ray ophthalmic applicators: Comparison ofdifferent measurement methods. Medical Physics, 28(7), 1373 – 1384.
Recommended


