Page 1 of 15
Operation at the Antamina Copper-Zinc Mine
in Central Peru
T. Eldridge and K. Moffitt Golder Associates Ltd., Vancouver, BC.
S. Botts, and C. Dechert Compania Minera Antamina, Peru
Production at the Antamina Copper-Zinc mine in central Peru started in
June, 2001. The operation was designed for a nominal milling production rate of 70,000 tpd. Components of the tailings management facility include a 130 m high concrete faced rockfill dam, 1300 m of decant tunnel and 14 km of water diversion channels and pipelines. At start-up, the tailings pond was 90 m deep and contained 15 million m3 of water. The dam and foundation are instrumented with settlement cells, total stress cells and piezometers. This paper presents the performance of the dam during filling of the impoundment with water and then tailings. The tailings deposition plan is compared to the actual tailings configuration as determined by the periodic bathymetric surveys. During mill commissioning, the tailings pond water was not suitable for discharge. The changes implemented in the mill and tailings impoundment to achieve water quality criteria are presented. These changes achieved the water quality objectives as well as reduced the overall re-agent costs.
Les opérations à la mine de cuivre-zinc Antamina, située au centre du Pérou, ont commencé en Juin 2001. Les opérations de raffinage ont été concu pour un taux de production de 70,000 tpj. Le parc a résidus de la mine est constitué d’un barrage d’enrochement avec façade en béton d’une hauteur de 130 m, d’un tunnel de décantation de 1,300 m de longueur et de 14 km de canaux de diversion et de conduites. Au début des opérations, le parc à résidus avait une profondeur de 90 m et pouvait contenir 15 million m3 d’eau. Des capteurs de tassements, des capteurs de contraintes et des piézomètres ont été installé dans le barrage et ses fondations. Le présent article discute de la performance du barrage lors du remplissage du parc à résidus avec de l’eau, puis avec des résidus. Le scénario de déposition des résidus est comparé à la configuration réelle des résidus, telle que déterminée par les relevés de données bathymétriques. Au moment de la construction des opérations, la qualité de l’eau du parc à résidus ne rencontrait pas les critères de rejet à l’environnement. Des modifications ont du être apporté à l’usine ainsi qu’au parc à résidus. Ces modifications ont permis aux opérations de rencontrer les critères de qualité de l’eau pour le rejet à l’environnement, de réduire les impacts en aval des opérations et de réduire les coûts de traitement.
Introduction
The Antamina Copper-Zinc mine is located in the Andes Mountains of Peru, approximately 200 km north of Lima. Compania Minera Antamina (CMA), a Peruvian company, owned by BHP Billiton, Noranda, Teck Cominco and Mitsubishi, operates the Antamina Project. The mine was designed as an open
Page 2 of 15
pit, truck and shovel operation. The mine and related facilities are at elevations of 3800 to 4800m. The mine will recover approximately 575 million tones of ore and move 1.4 billion tonnes of mined rock during a 24-year project life.
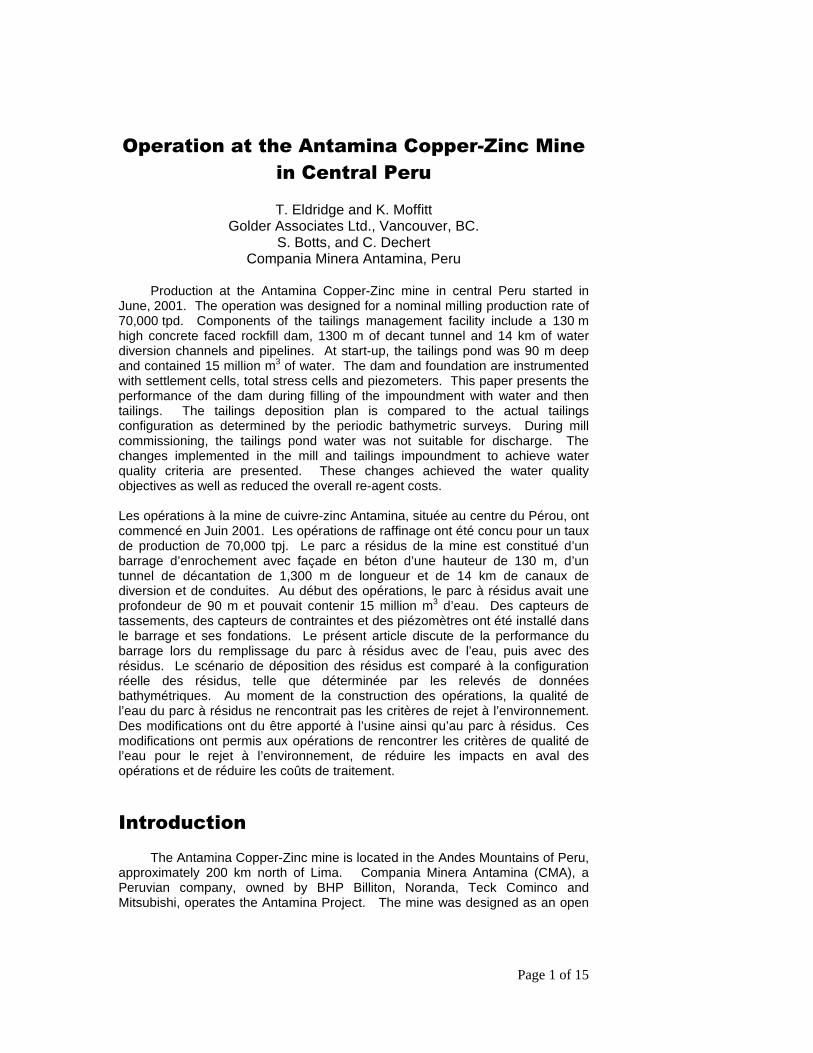
The milling operation will produce about 546 million tonnes of tailings. These are deposited in a tailings impoundment facility constructed within the drainage basin of Quebrada Huincush. The impoundment was created by construction of a rockfill dam that will eventually reach 240 m high. Runoff from the areas upstream of the tailings impoundment are diverted around the impoundment in a series of open channels, pipelines and a 1300 m long tunnel. Other components of the tailings management facility, shown in Figure 1, include the decant intake structures, the tailings pipelines, the reclaim water barge and pipeline and the freshwater supply dam.
Due to the complex site conditions and stringent scheduling and operational considerations, the successful completion of the tailings dam relied on the development of innovative design and construction techniques. This paper provides a brief discussion of design considerations and the performance of the tailings impoundment facility.
Figure 1 Antamina Tailings Impoundment Facility
Page 3 of 15
Site Characteristics
The dam lies in an asymmetrically sloped valley, as shown in Figure 1. The topography of the site has been shaped by alpine glaciers with subsequent erosion. Within the impoundment, valley slopes are typically 26 degrees or flatter. The slopes higher up the valley walls are as steep as 35 degrees.
The climate at Antamina is characterized by wet and dry seasons and year-round moderate temperatures. Precipitation patterns are highly variable, the mean annual precipitation is estimated to be in the range of 950 to 1550 mm.
The region is located in a relatively quiescent part of the active arc region of the convergent plate margin between the subducting oceanic Nazca plate on the west and the overriding South American continental plate on the east. The site is located in the high Andes of the South American plate, which is characterized by widely distributed active normal-slip faulting and earthquakes. A design peak ground acceleration value of 0.48 g was used for design.
Sub-Surface Conditions
A thin blanket of soil, typically glacial till or colluvium covers the valley bottom and lower valley walls. Soil thickness ranges from a few tens of centimeters to several tens of metres. The upper valley walls have a thin veneer of soil or exposed rock. Small side valleys are filled with soft peat deposits, with thickness up to 5 m. Within the stream channel at the tailings dam location, alluvial deposits extend to depths of 10 to 15 m.
The bedrock geology comprises an upstream dipping sequence of siltstones and mudstones with an interbedded limestone layer along most of the dam length. The sedimentary formations are divided into three units; the argillaceous Upper Celendin Formation, and the higher carbonate Lower Celendin and Jumasha formations. Discontinuities include an upstream shear zone, several downstream dipping back thrust faults and a series of deeply dipping joints that cross the dam axis. Site investigations prior to construction revealed a relatively pervious near surface zone, becoming progressively less pervious with depth. Depressed phreatic surfaces in the carbonate-rich Lower Celendin and Jumasha Formations in the right abutment of the dam indicated the potential for karst conditions.
Construction Overview
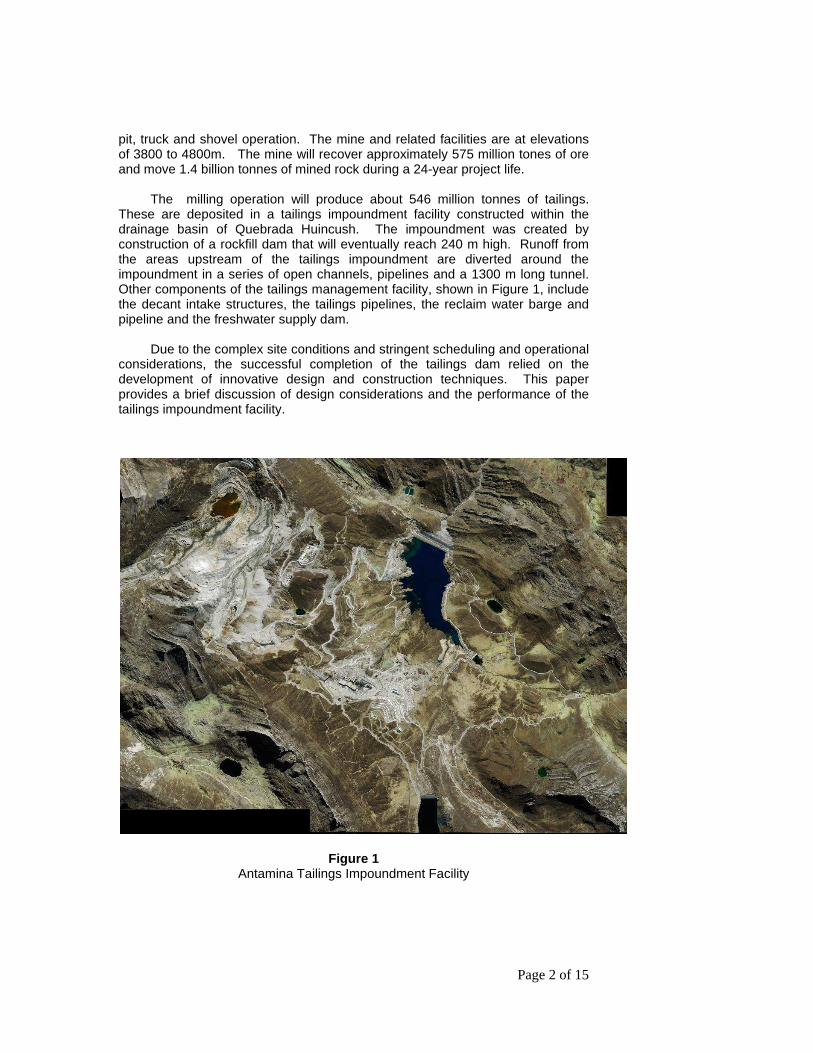
The tailings dam provides tailings containment as well as an impoundment for process water for the concentrator. The dam will be constructed from mined rock in stages over the life of the mine, reaching a maximum height of 240 m. A typical section is provided in Figure 2.
The dam is constructed with an upstream face inclined at 1.4H:1V and with a downstream face inclined at 1.5H:1V. The main construction access to the
Page 4 of 15
dam is located upstream, requiring material to be hauled down from the dam crest for each raise. Haul roads are constructed on the downstream face for the staged construction, resulting in the downstream face having an overall slope flatter than 1.5H:1V.
The starter dam was built as a 130 m high, concrete faced rockfill dam and was substantially completed in April 2001. It was designed to provide a 15 million m3 pool of water for concentrator start-up and to provide for tailings containment during the first two years of operation. The water retaining elements of the starter dam are a reinforced concrete face connected with water stops to a reinforced concrete plinth anchored to a prepared bedrock surface. Consolidation and curtain grouting of the bedrock have been carried out through the plinth to provide a continuous, low permeability element extending from the crest of the starter dam to the maximum depth of the grout curtain.
The design incorporates a cast-in-place concrete curb (Figure 2) to
provide uniform support to the concrete face of the starter dam. The concrete curb also provided erosion protection for the filter during construction of the starter dam. Above the starter dam, the concrete curb will be the only facing element and seepage through the dam will be controlled by maintaining a wide beach of tailings against the dam.
Figure 2 Tailings Dam Cross Section
Tailings are retained by an engineered filter between the tailings and the
rockfill (Zone 2B, Figure 2). The filter is designed to be internally stable under very high hydraulic gradients, to retain the tailings, to have a relatively low permeability and not to maintain a crack. The internal stability and the ability of the filter to retain the tailings were confirmed with laboratory tests in a large diameter permeameter specifically designed for this project. (Eldridge and Gilmer, 2002).
Page 5 of 15
Starter dam construction was substantially complete in April 2001, and
ongoing construction continues as the Stage I raise of the dam. In April 2003 the crest elevation was at approximately 4045 m.
Foundation PreparationFoundation PreparationFoundation PreparationFoundation Preparation
Wet, soft or organic soils were removed from the dam footprint prior to fill placement. Alluvial deposits and travertine were removed from the bed of Quebrada Hiuncush for a distance of 80 m downstream from the plinth foundation to avoid excessive movements of the upstream face of the dam. Talus along the valley walls and the alluvium in the riverbed beneath the downstream wedge of the dam were removed if the density was less than that of the fill to be placed or if these deposits were considered to be unstable based on field evaluation.
Based on the geotechnical investigations, the foundation level for the plinth
was set at 5 m below ground surface in the valley bottom and between 3.5 and 4.0 m on the abutments. The width of the excavation was based on a maximum hydraulic gradient of 10 across the plinth founded on the poorer quality Upper Celendin rocks and on providing a suitable foundation for the Zone 2B filter material. At the valley bottom, the excavation was a minimum of 18 m wide.
Seepage ControlSeepage ControlSeepage ControlSeepage Control A grout curtain was constructed along the upstream toe of the dam by
grouting through the plinth. At the deepest section of the water pool the grout curtain had a width of 10 m and at the top of the dam it had a width of 4 m. The grout curtain had a target of 2 Lugeons.
Site investigations prior to dam construction indicated the upper 35 m of
bedrock had a hydraulic conductivity of about 40 Lugeons, with several instances of hydraulic conductivity exceeding 100 Lugeons. In addition, the presence of adversely oriented structural features and the potential for karstic conditions in the carbonate-rich rock units provided challenges to the design of an effective grout curtain. The key concern for ensuring that the grout curtain met all seepage requirements involved proper optimization of surface and deep grouthole layouts and injection controls to achieve the required permeability reduction, without hydro-jacking the weaker formations. Details of the grout curtain design and construction are documented in Amaya, Carter, Eldridge and Jefferies, 2002.
The grout curtain is 780 m long, as deep as 95 m, and involved nearly 40,000 m of drilling with the injection of 2800 tons of cement. Adequacy of the grout curtain was established by water pressure testing, secondary holes being drilled at every location in the central curtain row and subjected to comprehensive Lugeon water tests. The overall 780 m long curtain had an average central-row closure conductivity of less than 1.5 Lugeons (including the karst region). Many zones indicated around 0.1 Lugeons. The excellent results are attributed to the high injection pressures relative to conventional grouting, the
Page 6 of 15
use of stable mixes, and detailed electronic monitoring, Amaya, Garcia, Jefferies and Ritchie, 2002.
The effectiveness of the grout curtain was determined during reservoir impoundment by the measured responses of the piezometers installed in the foundations downstream of the grout curtain. The measured piezometer responses were approximately 15 to 30% of the reservoir head change during impoundment.
Seepage Collection and Pump back System
A seepage collection system was constructed downstream of the
toe of the starter dam. The collection system consists of a reinforced concrete wall on a grouted foundation. Two large diameter HDPE pipes carry the collected water to a pond located outside the ultimate footprint of the dam. Depending on the quality of the collected water, it is either released downstream or pumped back to the tailings pond.
Tailings Deposition and Water Management
A life-of-mine tailings deposition plan was developed to demonstrate that all the tailings produced could be stored within the impoundment. Modelling was carried out using the tailings deposition module within Surpac and assuming that the tailings beach would have a slope in the range from 0.5 to 1.0 percent above water and 5 to 10 percent below water. Constraints on the deposition plan included:
• The decant located on the right abutment 500 m upstream of the dam; • The reclaim barge located near the centre of the basin; • A minimum pond volume requirement of 7,000,000 m3 of water; • The need for a tailings beach against the dam and right abutment to
control seepage from the impoundment; and, • The ability to provide a flooded cover for at least a portion of the tailings.
The deposition plan involves discharging from the north end of the basin for
the first three years of operation to create a wide beach along the dam. After this, the tailings will be discharged from both the north and south ends of the basin to maintain the pond near the centre of the basin for proper operation of the reclaim barge and decant system. Near the end of the mine life, the basin will be managed so that the southern end will be flooded for closure. A beach will remain against the dam.
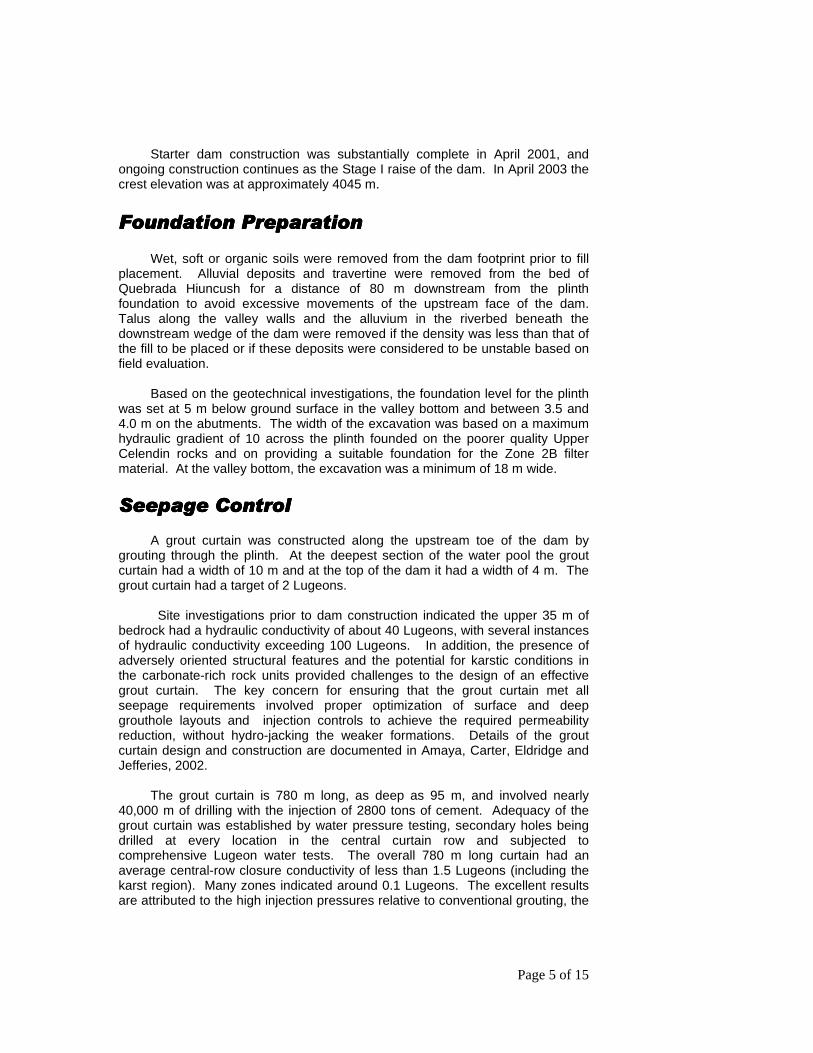
Tailings deposition began in late May 2001. To date, tailings have been discharged from the dam crest, and from the left abutment of the dam into the impoundment. A photograph of the tailings basin in September, 2002 is shown in Figure 3.
Page 7 of 15
Figure 3
Tailings Impoundment Facility: September 2002
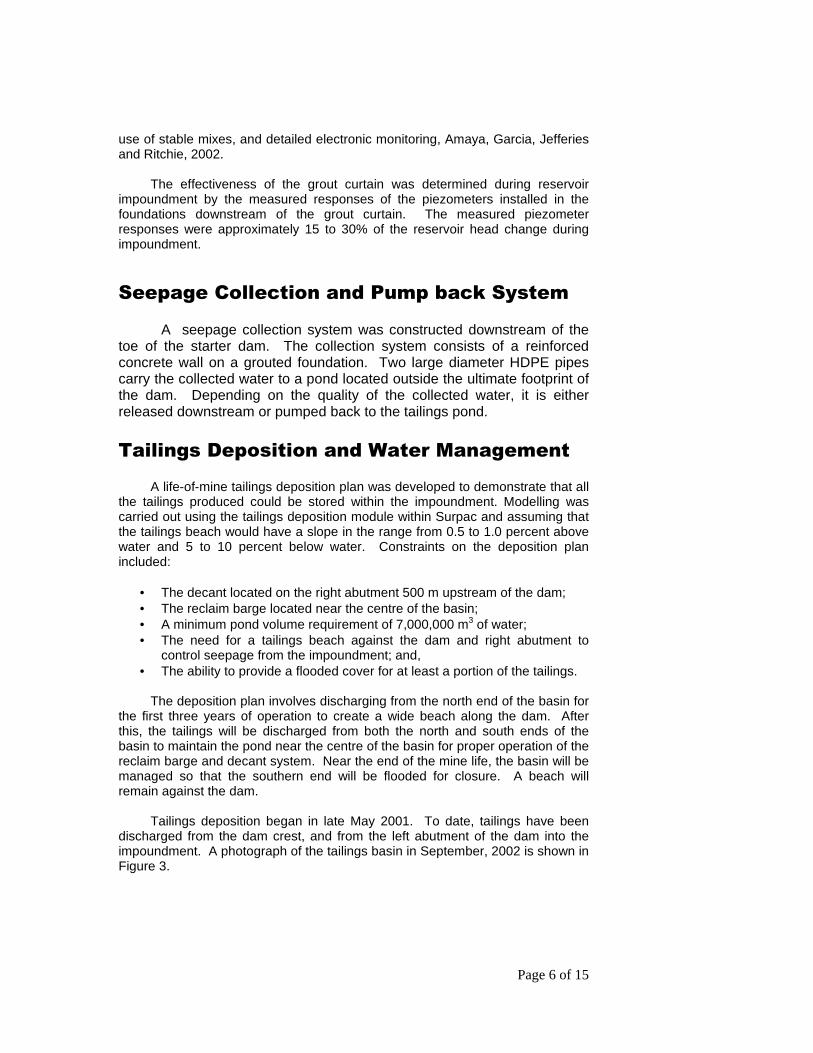
Periodic bathymetry surveys are carried out to determine the profile of the tailings. The results of the latest survey, performed in January 2003, are shown below in Figure 4.
Page 8 of 15
Figure 4 Bathymetry Survey: January, 2003
The tailings beach currently extends approximately 400 m from the tailings
dam face at an average slope of approximately 1%. This is in general agreement with the tailings deposition plan. Below water, the average slope is approximately 5% over a height of approximately 10 to 15 m, at which point the slope flattens.
The design density of the tailings was estimated at 1.8 tonnes/m3. Based on the bathymetry results and the volume of tailings placed, the average
Page 9 of 15
achieved density of the tailings is approximately 1.7 tonnes/m3, and has remained relatively constant with each successive bathymetry survey.
The dam crest elevation is determined so as to allow the reservoir to retain
the design storm whilst maintaining the minimum operational freeboard of 2 m. During the first two years of operation, the design store is one-half the volume of the Probable Maximum Flood, and after that period, it is the Probable Maximum Flood. The dam crest elevation and the maximum allowable operating pond level are shown in the chart. The maximum operating pond level is calculated from the crest elevation, less the required freeboard, less the height required to store the volume from the design flood. During the first two years of operation, the pond level has been consistently maintained below the maximum allowable operating level.
Tailings Dam Performance
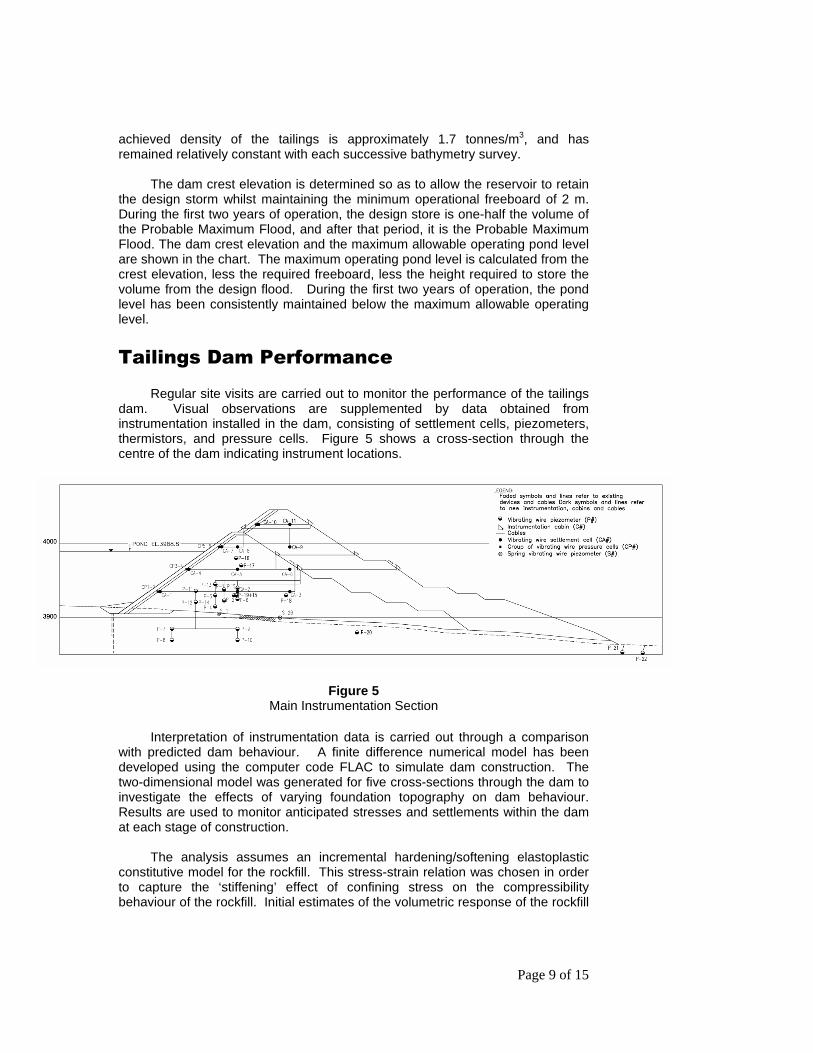
Regular site visits are carried out to monitor the performance of the tailings dam. Visual observations are supplemented by data obtained from instrumentation installed in the dam, consisting of settlement cells, piezometers, thermistors, and pressure cells. Figure 5 shows a cross-section through the centre of the dam indicating instrument locations.
Figure 5
Main Instrumentation Section
Interpretation of instrumentation data is carried out through a comparison with predicted dam behaviour. A finite difference numerical model has been developed using the computer code FLAC to simulate dam construction. The two-dimensional model was generated for five cross-sections through the dam to investigate the effects of varying foundation topography on dam behaviour. Results are used to monitor anticipated stresses and settlements within the dam at each stage of construction.
The analysis assumes an incremental hardening/softening elastoplastic constitutive model for the rockfill. This stress-strain relation was chosen in order to capture the ‘stiffening’ effect of confining stress on the compressibility behaviour of the rockfill. Initial estimates of the volumetric response of the rockfill
Page 10 of 15
to applied stress were obtained from the results of large-scale one-dimensional consolidation testing of rockfill (Marsal, 1973). Parameters were calibrated to measured deformations of the dam during the preliminary stages of starter dam construction.
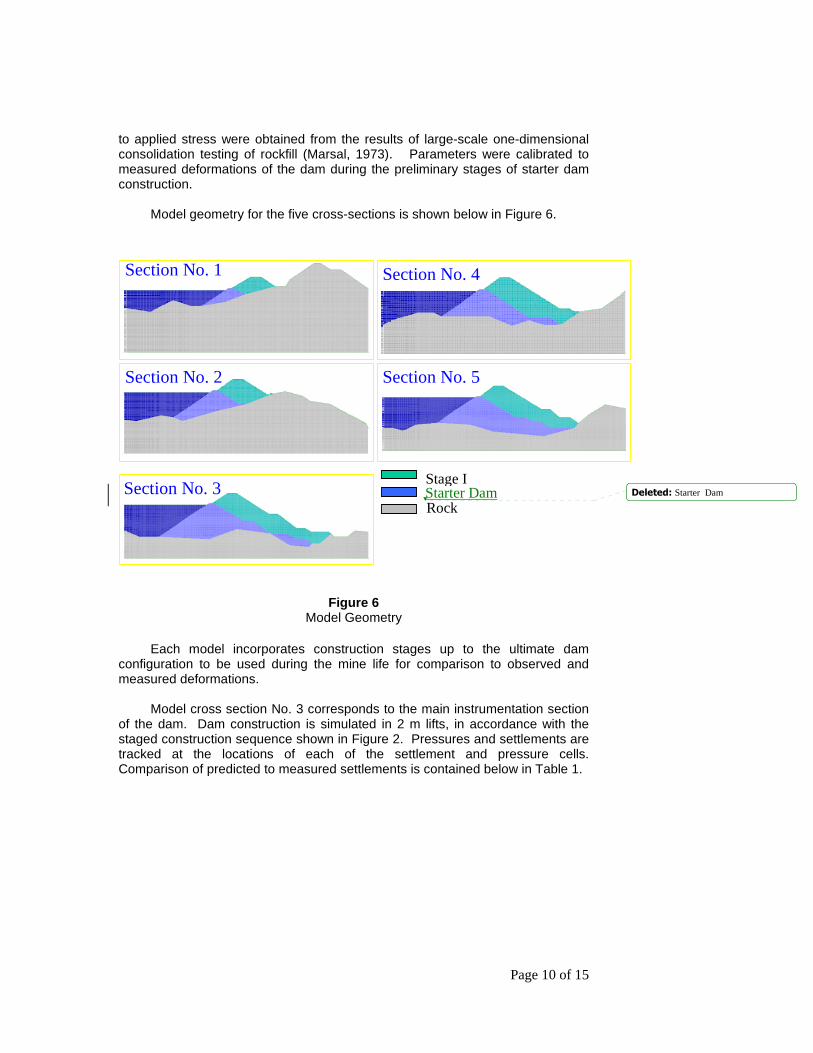
Model geometry for the five cross-sections is shown below in Figure 6.
Figure 6
Model Geometry
Each model incorporates construction stages up to the ultimate dam configuration to be used during the mine life for comparison to observed and measured deformations.
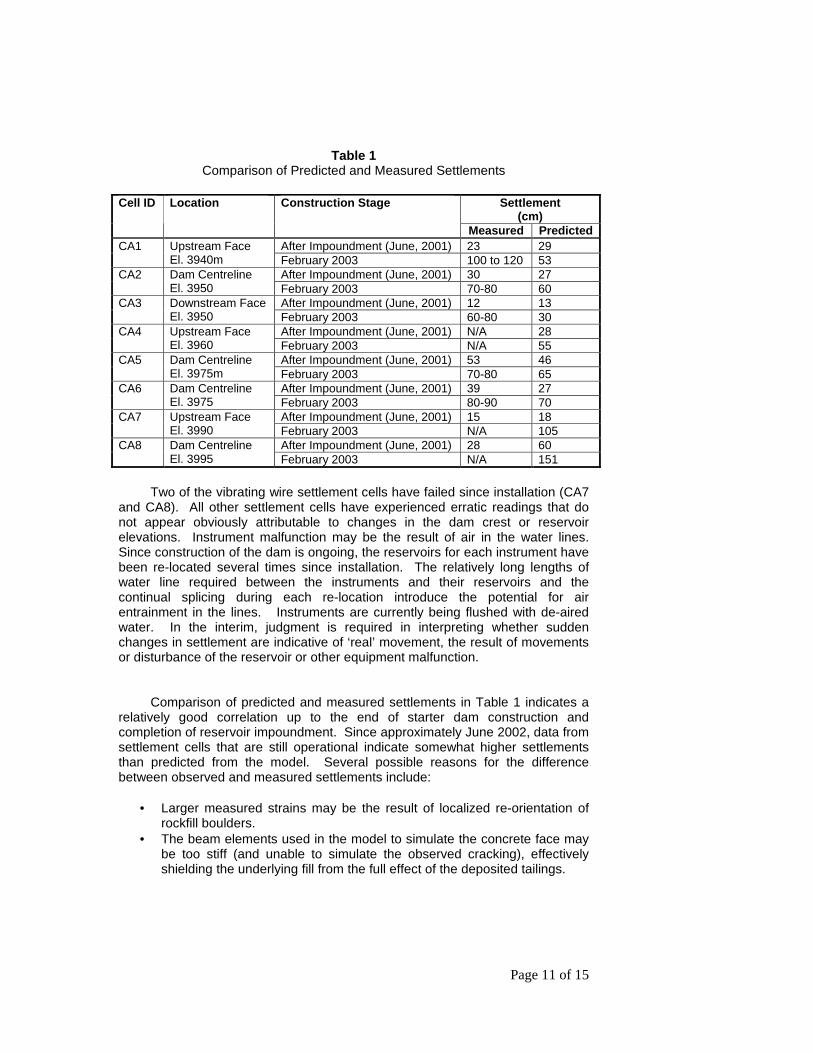
Model cross section No. 3 corresponds to the main instrumentation section of the dam. Dam construction is simulated in 2 m lifts, in accordance with the staged construction sequence shown in Figure 2. Pressures and settlements are tracked at the locations of each of the settlement and pressure cells. Comparison of predicted to measured settlements is contained below in Table 1.
Section No. 3
Section No. 2
Section No. 1
Section No. 5
Section No. 4
Rock
Stage I Starter Dam Deleted: Starter Dam
Page 11 of 15
Table 1
Comparison of Predicted and Measured Settlements
Settlement (cm)
Cell ID Location Construction Stage
Measured Predicted After Impoundment (June, 2001) 23 29 CA1 Upstream Face
El. 3940m February 2003 100 to 120 53 After Impoundment (June, 2001) 30 27 CA2 Dam Centreline
El. 3950 February 2003 70-80 60 After Impoundment (June, 2001) 12 13 CA3 Downstream Face
El. 3950 February 2003 60-80 30 After Impoundment (June, 2001) N/A 28 CA4 Upstream Face
El. 3960 February 2003 N/A 55 After Impoundment (June, 2001) 53 46 CA5 Dam Centreline
El. 3975m February 2003 70-80 65 After Impoundment (June, 2001) 39 27 CA6 Dam Centreline
El. 3975 February 2003 80-90 70 After Impoundment (June, 2001) 15 18 CA7 Upstream Face
El. 3990 February 2003 N/A 105 After Impoundment (June, 2001) 28 60 CA8 Dam Centreline
El. 3995 February 2003 N/A 151
Two of the vibrating wire settlement cells have failed since installation (CA7
and CA8). All other settlement cells have experienced erratic readings that do not appear obviously attributable to changes in the dam crest or reservoir elevations. Instrument malfunction may be the result of air in the water lines. Since construction of the dam is ongoing, the reservoirs for each instrument have been re-located several times since installation. The relatively long lengths of water line required between the instruments and their reservoirs and the continual splicing during each re-location introduce the potential for air entrainment in the lines. Instruments are currently being flushed with de-aired water. In the interim, judgment is required in interpreting whether sudden changes in settlement are indicative of ‘real’ movement, the result of movements or disturbance of the reservoir or other equipment malfunction.
Comparison of predicted and measured settlements in Table 1 indicates a relatively good correlation up to the end of starter dam construction and completion of reservoir impoundment. Since approximately June 2002, data from settlement cells that are still operational indicate somewhat higher settlements than predicted from the model. Several possible reasons for the difference between observed and measured settlements include:
• Larger measured strains may be the result of localized re-orientation of
rockfill boulders. • The beam elements used in the model to simulate the concrete face may
be too stiff (and unable to simulate the observed cracking), effectively shielding the underlying fill from the full effect of the deposited tailings.
Page 12 of 15
• The predicted compressibility of the rockfill is dependent on the stress level, and model calibration was carried out for the relatively low stress levels prior to reservoir filling.
Given the preliminary level of model calibration, the disparity between the
predicted and measured settlement is considered to be consistent with the level of confidence in the input parameters. More rigorous calibration, incorporating data up to the end of Stage I construction is required for more accurate predictions of deformation from subsequent construction stages.
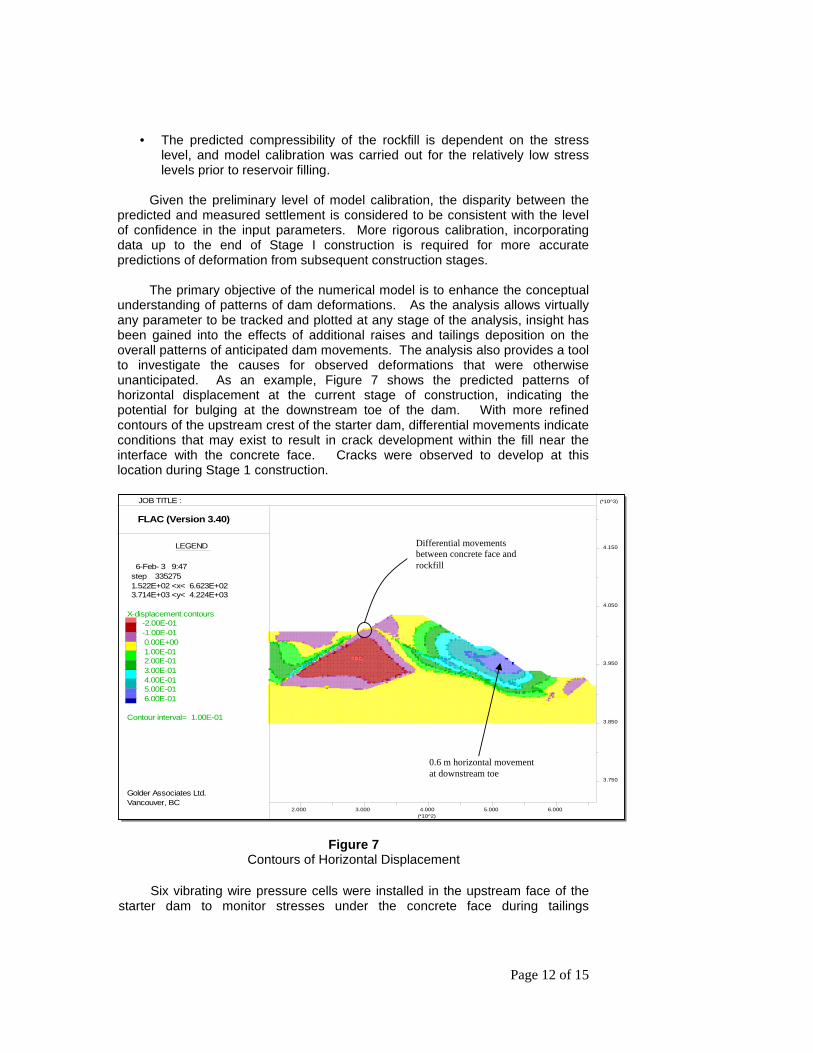
The primary objective of the numerical model is to enhance the conceptual understanding of patterns of dam deformations. As the analysis allows virtually any parameter to be tracked and plotted at any stage of the analysis, insight has been gained into the effects of additional raises and tailings deposition on the overall patterns of anticipated dam movements. The analysis also provides a tool to investigate the causes for observed deformations that were otherwise unanticipated. As an example, Figure 7 shows the predicted patterns of horizontal displacement at the current stage of construction, indicating the potential for bulging at the downstream toe of the dam. With more refined contours of the upstream crest of the starter dam, differential movements indicate conditions that may exist to result in crack development within the fill near the interface with the concrete face. Cracks were observed to develop at this location during Stage 1 construction.
Figure 7 Contours of Horizontal Displacement
Six vibrating wire pressure cells were installed in the upstream face of the
starter dam to monitor stresses under the concrete face during tailings
FLAC (Version 3.40)
LEGEND
6-Feb- 3 9:47 step 335275 1.522E+02 <x< 6.623E+02 3.714E+03 <y< 4.224E+03
X-displacement contours -2.00E-01 -1.00E-01 0.00E+00 1.00E-01 2.00E-01 3.00E-01 4.00E-01 5.00E-01 6.00E-01
Contour interval= 1.00E-01
3.750
3.850
3.950
4.050
4.150
(*10^3)
2.000 3.000 4.000 5.000 6.000(*10^2)
JOB TITLE :
Golder Associates Ltd. Vancouver, BC
Differential movements between concrete face and rockfill
0.6 m horizontal movement at downstream toe
Page 13 of 15
deposition. Currently only one cell is still operational. Cell PC2, oriented at 45 degrees under the upstream face, indicates a stress of 1100 kPa, equal to the estimated vertical total stress in the tailings at that depth. The model predicts a stress of 800 kPa at this location, again suggesting that the stiff, rigidly connected concrete face elements in the model are not adequately transferring the loads resulting from tailings deposition through to the dam fill. The model will be reformulated to allow yielding of hinges between the face elements in order to address this possible shortcoming.
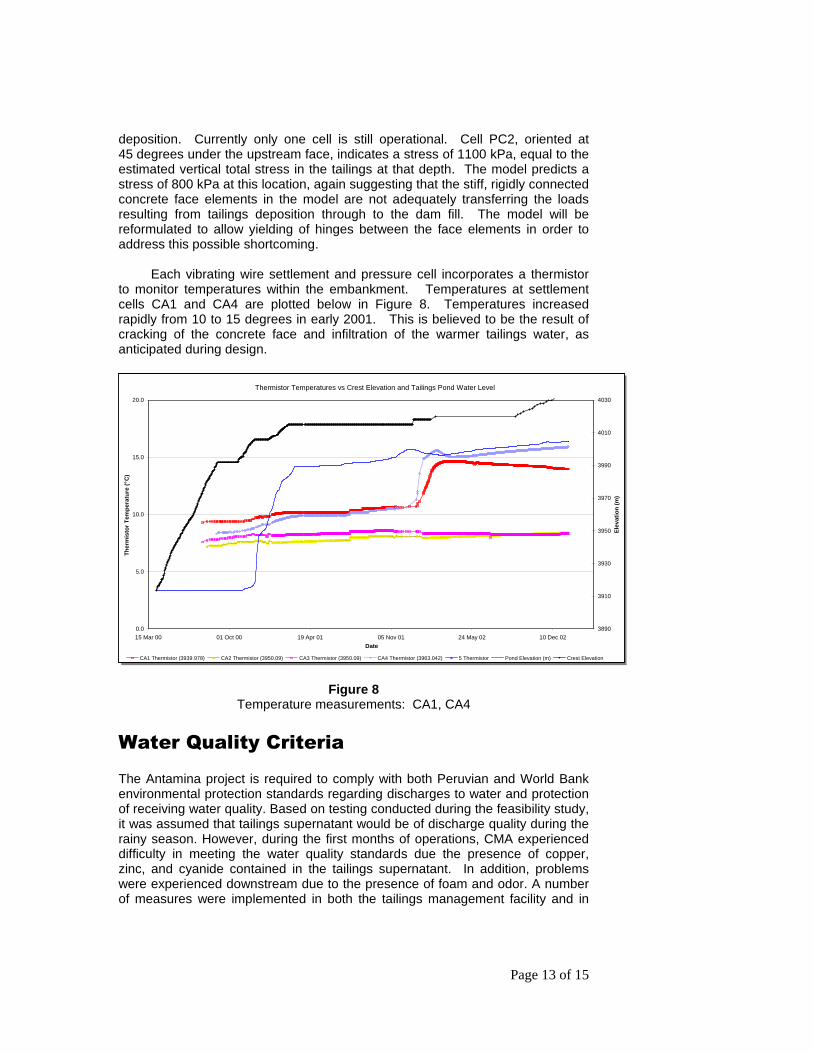
Each vibrating wire settlement and pressure cell incorporates a thermistor to monitor temperatures within the embankment. Temperatures at settlement cells CA1 and CA4 are plotted below in Figure 8. Temperatures increased rapidly from 10 to 15 degrees in early 2001. This is believed to be the result of cracking of the concrete face and infiltration of the warmer tailings water, as anticipated during design.
Figure 8 Temperature measurements: CA1, CA4
Water Quality Criteria The Antamina project is required to comply with both Peruvian and World Bank environmental protection standards regarding discharges to water and protection of receiving water quality. Based on testing conducted during the feasibility study, it was assumed that tailings supernatant would be of discharge quality during the rainy season. However, during the first months of operations, CMA experienced difficulty in meeting the water quality standards due the presence of copper, zinc, and cyanide contained in the tailings supernatant. In addition, problems were experienced downstream due to the presence of foam and odor. A number of measures were implemented in both the tailings management facility and in
Thermistor Temperatures vs Crest Elevation and Tailings Pond Water Level
0.0
5.0
10.0
15.0
20.0
15 Mar 00 01 Oct 00 19 Apr 01 05 Nov 01 24 May 02 10 Dec 02
Date
The
rmis
tor
Tem
pera
ture
(° C
)
3890
3910
3930
3950
3970
3990
4010
4030
Ele
vatio
n (m
)
CA1 Thermistor (3939.978) CA2 Thermistor (3950.09) CA3 Thermistor (3950.09) CA4 Thermistor (3963.042) 5 Thermistor Pond Elevation (m) Crest Elevation
Page 14 of 15
the operation of the concentrator to achieve compliance and improve downstream water quality. These measures included:
• Expansion of the water diversion system to achieve maximum diversion of fresh water around the tailings impoundment, thereby “keeping clean water clean” and minimizing the need to discharge.
• Installation of a series of decant pumps allowing the discharge to be more precisely controlled than it was previously with the passive decant system, thereby allowing water to be discharged only when the conditions for compliance are present.
• Installation of aeration devices to volatilize excess floatation reagents thereby reducing downstream odour.
• Installation of a de-foaming system. • Installation of a sulfuric acid pH reduction system. • Installation of a number of hydrogen peroxide cyanide destruction
systems. • Revision and reduction of the use of milling reagents. Use of reagents
that minimized downstream effects. • Revision and improvement to the water monitoring program to include
visual observations for the presence of foam and odor. • Development of a comprehensive site wide water balance to allow better
water management and prediction. Compliance and Environmental Effects Monitoring downstream of the tailings effluent discharge point in the Rio Ayash show that due to the implementation of these measures, tailings effluent and receiving water is largely compliant with applicable Peruvian and World Bank standards, and that the aquatic environment has not been negatively impacted. CMA continues to fine-tune this system, to make it more efficient and cost effective.
Conclusions The tailings dam at Antamina has been constructed to a height of 160 m to date and has performed as expected. A comprehensive geotechnical monitoring program has allowed CMA to monitor physical performance of the tailings dam and ensure the safety of the dam structure. Although water quality problems were experienced in the initial stages of operations, the measures implemented have served to bring the facility into compliance and minimize downstream impacts. Tailings management facilities should be constructed with operational flexibility to allow for variability in tailings supernatant quality.
References ELDRIDGE, T. and GILMER,B., 2002. Large Scale Laboratory Filter Tests. Geotechnical News Vol. 20. No. 3. p41-43.

Page 15 of 15
AMAYA, F., CARTER, T.G., ELDRIDGE, T., and JEFFERIES, M.G., 2002. Curtain Grouting for the Antamina Dam, Peru: Part 1 – Design and Performance. Proceedings of the Third International Conference on Grouting and Ground Treatment, New Orleans, Vol 2, p917-928. AMAYA, F., J.P. GARCIA, JEFFERIES, M.G., and RITCHIE, D.G., 2002. Curtain Grouting for the Antamina Dam, Peru: Part 2 – Implementation and Field Mordifications. Proceedings of the Third International Conference on Grouting and Ground Treatment, New Orleans, Vol 2, p929-940. MARSAL, R.J., 1973. Mechanical Properties of Rockfill. Embankment Dam Engineering, Casagrande Volume. John Wiley and Sons, New York. P109-200.
Recommended