© 2016 Asian Economic and Social Society. All rights reserved ISSN (P): 2309-8295, ISSN (E): 2225-4226 Volume 6, Issue 3, 2016, pp. 50-62
50
ON THE RELATIONSHIP BETWEEN FOREIGN TRADE AND REGIONAL
DISPARITY IN CHINA IN THE POST-REFORM ERA
Qin Zhang and Yanqing Jiang
School of Economics and Finance, Shanghai International Studies University, Shanghai, P. R. China
Article History:
Received: 16-March-2016
Revised received: 22-May-
2016
Accepted: 19-June-2016
Online available: 18-July-
2016
Keywords:
Regional disparity,
foreign trade,
reform and opening up
Abstract
Since the reform and opening policy carried out in the 1980s,
and after China joined the WTO, foreign trade becomes an
important part of China’s national income. Some regions have
gained great benefits from foreign trade and developed in a
dramatic speed while many other regions have not caught up
with the high speed of development. The present work
investigates whether (and how) the development of foreign trade
in China is related to the ever-increasing economic disparity
across different regions. After discussing the evolutions of
regional economic disparity and regional foreign trade in China,
this paper, by using a linear regression method, attempts to
investigate the relationship between regional foreign trade
disparity and regional income disparity. Our regression results
show that there exists a positive relationship between the two.
1. INTRODUCTION1
China’s rapid economic growth since 1978 has relied heavily on the opening up and trade
liberalization that has led to a sizable scale of foreign trade in China. The average GDP growth rate
since 1978 is 9.83%, which makes China rank the second place among all the 206 countries and
districts over the world. Meanwhile, the disparity in different regions’ economy developed year by
year.
The disparity of regional economy continues to be enlarged. Among 31 provincial administrative
regions, Guangdong has the highest GDP amount of 6247.48 billion RMB in 2013, while the Tibet
Autonomous Region has the lowest GDP amount of 81.57 billion RMB.
Since the regional disparity showed up, much attention has been paid to the disparity in regional
economy. Nevertheless, foreign trade is rarely mentioned as a factor contributing to the regional
economic disparity.
In fact, the effect of foreign trade cannot be ignored when discussing what makes the disparity in
different regions in one country. The imbalance in different regions’ economic growths to some
Corresponding author's
Name: Yanqing Jiang
Email address: [email protected]
Journal of Asian Business Strategy
http://aessweb.com/journal-detail.php?id=5006 DOI: 10.18488/journal.1006/2016.6.3/1006.3.50.62

Journal of Asian Business Strategy, 6(3)2016: 50-62
51
extent matches the imbalance in foreign trade development in those regions. In the real world setting,
an explicit difference of foreign trade development level can be seen between the East and the
Midwest, and the economic disparity between the two regions is apparent.
When trying to find out why disparity in regional economy happens, many previous researchers have
attributed many factors such as law and policies, resource endowment, nation’s investment,
geography location and etc. However, foreign trade, which is an important part of China’s economy
boom since 1978, is seldom taken as a factor contributing to regional economy disparity. On the other
hand, previous studies on China’s foreign trade or international trade focus on indexes that show how
the whole nation’s foreign trade mode and scale, and only a few researchers connect the difference in
regions’ foreign trade to the disparity in regions’ economy.
In addition, most of the previous studies are done no later than 2005. Actually in the recent ten years,
the mode and scale of foreign trade and the situation of economic disparity between regions didn’t
remain the same as 2005. The paper will contain the latest data from 2005 till now which haven’t
been used in researching the relation between foreign trade and regional disparity. Then, based on the
latest data and latest conclusion, the paper will show advice with reality on solution to regional
economy disparity.
The paper takes a look at the present situation of the difference in China’s regional foreign trade
development and its influence on the disparity of regional economic growth.
In general, the paper is conducted through theoretical and data analysis. The data used are mainly
from National Bureau of Statistics of China and some other governmental websites.
2. LITERATURE REVIEW
Various scholars by analyzing proposed many important theories of regional disparity development
and changes. And in the field of regional disparity research, China has always been a hot example for
empirical studies.
2.1. Theories of regional disparity development Regional economic disparity is always an issue that draws scholars’ great attention. Various theories
about regional economic disparity are raised year by year. For example, the inverted U-shaped Curve
theory or the Kuznets Curve Hypothesis mainly states that the relationship between income
inequality and the level of economic development tends to fit an inverted U-shaped curve. The
inequality increases during the initial start point toward modern economy, then decreases when the
country moving into more advanced phases.
After Kuznets, more scholars use evidence from developing countries and developed countries to
support and extend the inverted U-shaped curve pattern. Williamson (1965), among others,
contributes a lot to the pattern. By analyzing data of regional disparities of 24 countries in the 1950s,
Williamson (1965) found that there was an inverted U-shaped relationship between regional
economic disparity and development phases of the country. Though some theoretical and empirical
researches support the inverted U-shaped distribution of regional disparities over the country’s
economic development, their research, as Williamson himself admits, failed to find the reason for the
existence of the inverted U-shaped curve.
Myrdal proposed that the regional economy disparity will always continue to be enlarged during the
development of the country, because the developed areas can circulate and accumulate what it
already had through a feedback mechanism. This mechanism allows developed areas to strengthen its
competitive position and to substantially develop within themselves. Also, the circulation and
accumulated effect will result in factors from backward areas flowing to developed regions.
Therefore, the regional economy disparity will be larger and larger.

Journal of Asian Business Strategy, 6(3)2016: 50-62
52
The conceptual framework of the polarization process is also an important theory in research history.
The framework of the polarization process proposes that the regional inequality is an unavoidable and
consequent part of economic growth itself, thus the imbalance between regions are inevitable. At the
initial phase of development, there must be some regions that are economy-advanced centers, so-
called “growth poles”, in the same country, during the development of economy in this country.
Positions, geography and many other reasons may account for the existence of growth poles. The
existence and development of these growth poles definitely have direct impact (favorable or adverse)
on those relatively backward regions. Then, at a certain phase, there would be an apparent slow-down
tendency of the expansion of growth poles. Gradually, the expansion will be more and more
hampered and meanwhile the relatively backward regions will be at a relatively higher developing
speed. At the end, the disparity will vanish. The emergence and the rapid growth of growth centers is
the process of “polarization,” while the catching up of the backward areas is the “trickling down”
effect.
The “new economic geography” deals with a new phenomenon called “agglomeration”: large firms
agglomerate in certain areas and resources flow and accumulate in these areas, because of the
increasing returns to scale and transportation costs. The emergency of the new economic geography
relies on traditional regional science as well as modern trade theory. Researchers use an integrated
approach combining traditional and modern insights to deal with interregional and international trade
and to find out the factors that influence the geographical distribution of economic activity.
2.2. Empirical studies of regional disparity in China Since 1990, many scholars have done empirical studies of regional disparity in China. There are two
categories of researches: one is from static point, using disparity index to analyze the changes of
regional economy disparity; the other is from dynamic point, using growth theory to test the
convergence hypothesis of the regional economy.
From the perspective from static point, the following studies are worth mentioning in the whole
research history. Some studies used national income data from 1952 to 1985 and Williamson’s
coefficient of variation measurement to analyze the inter-provincial disparity in income and the
amount of income spent. Other studies calculated the coefficient of variation of all provinces and of
three typical regions then found that the economic disparity between three typical regions were
shrinking smoothly after the reform and opening policy. Still other studies used the Theil’s index to
calculate the inter-provincial disparities of per capita GDP across the Chinese regions. Additionally,
some studies [such as Li (1991) and Zhang (2004)] tried to analyze the regional economy disparity in
China through the “new economic geography” theory.2
3. DESCRIPTION OF REGIONAL ECONOMIC DISPARITY IN CHINA
The ranking chart of all provincial administrative regions’ 2013 GDP in China shows that the
difference between the first one and the last one is about 6165.91 billion RMB. The economic gap
between provinces is serious.
3.1. Definition of regional economic disparity In the following part definition of economic disparity and of regional economic disparity will be
introduced.
Economic inequality refers to how economic metrics are distributed among individuals in a group,
among groups in a population, or among countries. Economists generally think of three metrics of
economic disparity: wealth (wealth inequality), income (income inequality), and consumption. The
2 For more discussions, see, for example, Chen. (2005), Flecher (1968), He. (2007), Hu (1998), Krugman and
Elizondo. (1992), Krugman and Venables. (1995), Liu (2005), Pang (2003), Wang (2010), Williamson (1965,
1995), Yuan (2007), and National Bureau of Statistics (1999).

Journal of Asian Business Strategy, 6(3)2016: 50-62
53
issue of economic inequality can implicate notions of equity, equality of outcome, and equality of
opportunity.
Regional economic disparity refers to the aggregation of differences between regions in gross
products3, economy growth rate, economic structure
4 and other factors that influence the economy
development. In a word, regional economic disparity is the difference of integrated strength of
economy development between regions. Generally speaking, regional economic disparity can be
divided into three categories: absolute disparity, relative disparity, and integrated disparity. Absolute
disparity refers to the absolute distance from a variable to the reference value; relative disparity refers
to the relative distance from a variable to the reference value.
3.2. Defining the measurement The measurement of regional economic disparity is complicated and many factors such as economic
indicators and time period selected will greatly influence the final conclusion. Thus, it is necessary to
define the measurement scale and research scope.
3.2.1. Economic indicators
In previous researches, per capita GDP or per labor GDP, GNP, average income and average
consumption have been the main indicators when discussing the regional economic disparity. The
core topic is the relationship between regional economic disparity and regional differences in foreign
trade development, thus GDP is selected for study.
3.2.2. Time period
The data of provincial GDP and provincial export amount are incomplete in the early years, thus data
from 1987-2013 are used in the present paper.
3.2.3. Regional classification
Concerning the difference in political system, Hong Kong, Macau and Taiwan is excluded in the
present paper. Also, in order to keep data complete and meaningful, the research excludes
Chongqing, Tianjin, Hainan and Tibet Autonomous Region because of data missing. The paper also
compares data of coast and data of interior regions. The coastal provinces are: Hebei, Liaoning,
Shanghai, Jiangsu, Zhejiang, Fujian, Shandong, Guangdong and Guangxi Zhuang autonomous
region. The interior provinces are: Beijing, Shanxi, the Inner Mongolia autonomous region, Jilin,
Heilongjiang, Anhui, Jiangxi, Henan, Hubei, Hunan, Yunnan, Gansu, Qinghai, Shaanxi, Ningxia Hui
autonomous region, Xinjiang Uygur autonomous region.
3.2.4. Measurement
Various measurements such as coefficient of dispersion, standard variation, range, Theil’s index5 and
Gini coefficient6 have been used in previous literature. In the present paper, coefficient of variation is
used to measure the regional economic disparity in China.
3.3. Regional economic disparity 1978-2013 The following part discusses the regional economic disparity from 1978 to 2013 from different
perspectives.
3.3.1. Regional GDP scale disparity The regional GDP scale is a direct indicator of the economy development in different regions. The
Table below shows regional GDP in different years and the regional GDP growth rate in different
3 Gross products: the overall amount of GDP (Gross Domestic Products) and GNP (Gross National Products). 4 Economic structure: Generally speaking, it refers to the proportion of primary industry, secondary industry and
tertiary industry in a nation’s or a region’s economy. 5 Theil’s index: also known as Theil’s entropy measure; an indicator to reflect the disparity in income between
different regions. 6 Gini coefficient: an important indicator for disparity among a nation’s individuals.

Journal of Asian Business Strategy, 6(3)2016: 50-62
54
time period. The beginning time is 1978, the year the reform and opening policy was proposed; the
mid-year is 1987, because the data analysis in Section 4 focus on data from 1987 to 2013; the end
time is 2013, the latest data that can be found from the website of National Bureau of Statistics7.
As the Table 1 shows, in 1978, the province with the highest GDP was Shanghai (27.281 billion
RMB), the province with the lowest GDP was Ningxia Hui Autonomous Region (1.3 billion RMB),
and the disparity amount was 25.981 billion RMB. In 1987, the province with the highest GDP was
Jiangsu (92.233 billion RMB), the province with the lowest GDP was Ningxia Hui Autonomous
Region (3.963 billion RMB), and the difference was 88.27 billion RMB. Then in 2013, the province
ranked NO.1 in the GDP chart was Guangdong (6247.479 billion RMB), the lowest one was Qinghai
(212.206 billion RMB), and the disparity amount this time rose to 6035.273 billion RMB.
Also from the Table 1, it is clearly seen that the GDP scale disparity between the highest province
and lowest province developed from 25.981 billion RMB in 1978, to 88.27 billion RMB in 1987, and
eventually to 6035.273 billion RMB in 2013. From the result of calculation above, conclusion can be
drawn that the disparity is significantly rising up during the years since the reform and opening.
Table 1: The description of regional GDP and the growth rate from 1978 to 2013
Region
GDP 1978
(billion
RMB)
GDP 1987
(billion
RMB)
GDP 2013
(billion
RMB)
growth rate
(1978-1987)
growth rate
(1987-2013)
Beijing 10.884 32.682 1980.081 2.002 59.586
Hebei 18.306 52.192 2844.295 1.851 53.496
Shanxi 8.799 27.8 1266.525 2.159 44.558
Neimenggu 5.804 21.227 1691.65 2.657 78.693
Liaoning 22.92 71.91 2721.322 2.137 36.843
Jilin 8.198 29.749 1304.64 2.628 42.854
Heilongjiang 17.48 45.46 1445.491 1.600 30.796
Shanghai 27.281 54.546 2181.815 0.999 38.999
Jiangsu 24.924 92.233 5975.337 2.700 63.785
Zhejiang 12.372 60.699 3775.658 3.906 61.202
Anhui 11.396 44.235 1922.934 2.881 42.470
Fujian 6.637 27.924 2186.849 3.207 77.314
Jiangxi 8.7 26.29 1441.019 2.021 53.812
Shandong 22.545 89.229 5523.032 2.957 60.897
Henan 16.292 60.96 3219.13 2.741 51.807
Hubei 15.1 51.777 2479.183 2.428 46.881
Hunan 14.699 46.944 2462.167 2.193 51.449
Guangdong 18.585 84.669 6247.479 3.555 72.787
Guangxi 7.585 24.156 1444.99 2.184 58.819
Sichuan 18.481 53.086 2639.207 1.872 48.715
Guizhou 4.662 16.55 808.686 2.549 47.863
Yunnan 6.905 22.903 1183.231 2.316 50.662
Shaanxi 8.107 24.496 1620.545 2.021 65.155
Gansu 6.473 15.962 633.069 1.465 38.661
Qinghai 1.554 4.338 212.206 1.791 47.917
Ningxia 1.3 3.963 257.757 2.048 64.040
Xinjiang 3.907 14.85 844.384 2.800 55.860
3.3.2. The coast-interior regional disparity
Since the reform and opening policy made the coastal regions such as Guangdong province special
economic zone and promoted these regions’ economy development, it is necessary to analyze the
7 National Bureau of Statistics Website: http://data.stats.gov.cn/

Journal of Asian Business Strategy, 6(3)2016: 50-62
55
economy disparity between China’s coast and interior regions since 1978. The classification of
provinces based on coast and interior standard is stated in 3.2.
Figure 1: Coast-Interior regional GDP
The figure above shows the GDP of coastal regions and interior regions from 1978 to 2013. In the
very beginning, the 10 coastal regions were poor than interior regions. Then the situation changed:
the coastal regions’ GDP rose dramatically and caught up with and surpassed the interior regions.
After that, the disparity continued to increase and in recent years the disparity is significant.
In this section, tables and figures are given to show the evolution of China’s regional GDP disparity.
Generally speaking, the inter-provincial economic disparity is increasing. From another perspective,
the economic disparity between coastal regions and interior regions shows an interesting evolution: in
1978, the interior regions produced higher GDP than coastal regions; then quickly in 1980s the
coastal regions caught up with and surpassed the interior regions; After that, especially in 1990s and
2000s, the disparity continue to increase greatly every year.
4. DESCRIPTION OF FOREIGN TRADE IN CHINA
Since the reform and opening policy was carried out, the openness of China increases greatly. Coastal
regions such as Guangdong, Zhejiang have taken advantage of location and achieved significant
development of foreign trade, while some interior regions didn’t develop foreign trade so well. The
regional disparity of foreign trade is discussed in this section.
4.1. Definition of foreign trade Foreign trade, also known as International trade, is the exchange of capital, goods, and services
across international borders or territories. In most countries, such trade represents a significant share
of gross domestic product (GDP). While international trade has been present throughout much of
history (see Silk Road, Amber Road, Salt road), its economic, social, and political importance has
been on the rise in recent centuries. It is the presupposition of international trade that a sufficient
level of geopolitical peace and stability are prevailing in order to allow for the peaceful exchange of
trade and commerce to take place between nations.
4.2. Measurement defining
4.2.1. Indicators
Foreign trade scale is selected as the main indicator.
0
50000
100000
150000
200000
250000
300000
350000
1978 1980 1982 1984 1986 1988 1990 1992 1994 1996 1998 2000 2002 2004 2006 2008 2010 2012
coast interior

Journal of Asian Business Strategy, 6(3)2016: 50-62
56
4.2.2. Time period
The data are incomplete in the early years, thus data from 1987-2013 are used in the present paper.
4.2.3. Regional classification
Concerning the difference in political system, Hong Kong, Macau and Taiwan is not in the research
scope in the present paper. Also, in order to keep data complete and meaningful, the present research
excludes Chongqing, Tianjin, Hainan and Tibet Autonomous Region because of these regions’ data
missing in the China’s early years’ statistics reports. The present paper also compares data of coast
and data of interior regions. The coastal provinces are: Hebei, Liaoning, Shanghai, Jiangsu, Zhejiang,
Fujian, Shandong, Guangdong and Guangxi Zhuang autonomous region. The interior provinces are:
Beijing, Shanxi, the Inner Mongolia autonomous region, Jilin, Heilongjiang, Anhui, Jiangxi, Henan,
Hubei, Hunan, Yunnan, Gansu, Qinghai, Shaanxi, Ningxia Hui autonomous region, Xinjiang Uygur
autonomous region.
4.2.4. Measurement
In the present paper, foreign trade dependence, coefficient of variation is used to measure the regional
foreign trade disparity in China.
4.3. Regional disparity of foreign trade 1978-2013 The following part discusses the regional disparity of foreign trade development from 1978 to 2013
from different perspectives.
4.3.1. Foreign trade dependence
Foreign trade degree of dependence is an important indicator of openness and the degree to which a
region’s economy relies on foreign trade. Foreign trade degree of dependence (FTD) refers to the
ratio of foreign trade scale and GDP in a nation or a region in a certain time period.
in which EX refers to export scale and IM refers to import scale.
Foreign trade degree of dependence can be affected by the following factors. First of all, the
economic scale, i.e. GDP of the country or region. Generally speaking, in an open economy, a small
country’s FTD is higher than a big country’s because a small country has limited resources and
markets and it has to depend on export. Secondly, the structure of national income is another
important factor that will directly affect a region’s foreign trade dependence. A country in the
primary stage of economy development has lower foreign trade degree of dependence because
agriculture being the main part in economic structure and few manufactured goods makes the country
poor in competitive power of export. Other factors such as economic development strategy and
exchange rate also affect the FTD.
Table 2: The foreign trade dependence degree in different years
Region FTD 1978 FTD 1987 FTD 2013
Beijing 0.726 0.817 0.664
Hebei 0.016 0.031 0.317
Shanxi 0.001 0.015 0.135
Nei moggol 0.003 0.014 0.085
Liaoning 0.069 0.059 0.446
Jilin 0.005 0.021 0.193
Heilongjiang 0.003 0.021 0.190
Shanghai 0.111 0.110 1.990
Jiangsu 0.017 0.031 0.993
Zhejiang 0.006 0.025 0.968
Anhui 0.001 0.014 0.202
Fujian 0.031 0.066 0.706

Journal of Asian Business Strategy, 6(3)2016: 50-62
57
Jiangxi 0.008 0.018 0.234
Shandong 0.039 0.040 0.570
Henan 0.007 0.012 0.195
Hubei 0.011 0.022 0.144
Hunan 0.011 0.016 0.099
Guangdong 0.001 0.002 2.051
Guangxi 0.036 0.033 0.268
Sichuan 0.002 0.013 0.209
Guizhou 0.004 0.008 0.059
Yunnan 0.015 0.015 0.134
Shaanxi 0.000 0.014 0.125
Gansu 0.005 0.010 0.108
Qinghai 0.007 0.012 0.040
Ningxia 0.023 0.022 0.101
Xinjiang 0.006 0.021 0.445
From Table 2 we can see the regional disparity of FTD changes from 11% in 1978 to 81.4% in 1987,
then to 201% in 2013. The disparity is increasing greatly. At the beginning, big cities such as Beijing
and Shanghai have greater openness and depend more than other cities on export and import. But the
overall openness is not so high, the disparity is not so significant. After the reform and opening
policy, coastal regions such as Guangdong achieved great openness and developed quickly. These
regions rely much on foreign trade to develop regional economy, therefore, China’s regional foreign
trade disparity became larger and larger.
4.3.2. The Coast-interior regional disparity
Special Economic zones such as Shenzhen city in Guangdong province have achieved great
economic success because of the development of foreign trade. Interior regions, however, didn’t
develop foreign trade so well. Therefore, the coast-interior regional disparity of foreign trade
deserves attention. The classification of the provinces based on the coast and interior standard is
shown in 4.2.
Figure 2: Coast-interior foreign trade disparity
0%
10%
20%
30%
40%
50%
60%
70%
80%
90%
100%
1978 1980 1982 1984 1986 1988 1990 1992 1994 1996 1998 2000 2002 2004 2006 2008 2010 2012
Coast Interior

Journal of Asian Business Strategy, 6(3)2016: 50-62
58
Figure 2 shows each year the coast and interior each contributes to the nation’s foreign trade. The
Interior occupies more and more in China’s foreign trade year by year during the beginning year
(1978-1982) and reached the highest level at around 31% in 1983. Then the coastal provinces starts to
develop foreign trade and greatly increase its occupation in China’s foreign trade scale. From 2006 to
2008, there is a small drop of coastal regions’ occupation, which may explain by the global financial
crisis that ruined coastal region’s export. In the year of 2009, recovered from the crisis, the coastal
provinces occupy extremely high proportion of that year’s foreign trade.
In this section, tables and charts are shown to describe the evolution of regional foreign trade
disparity. From the perspective of foreign trade degree of dependence, the provinces that developed
foreign trade well rely heavily on foreign trade, while other provinces show less dependence on
foreign trade; the openness disparity among different cities became larger and larger during years.
From the perspective of coast-interior regional disparity, similar with the regional GDP disparity
between coast and interior, the coast provinces at first lagged behind, but then quickly caught up with
and surpassed the interior provinces. Especially in recent years, the coast-interior disparity in foreign
trade stays in very high level.
5. REGRESSION: RELATION BETWEEN FOREIGN TRADE AND REGIONAL
ECONOMIC DISPARITY
In this section, a liner regression model will be adopted to prove the correlation between foreign trade
disparity and economic disparity. The observed time period is 1987-2013, and the variable selected is
coefficient of variation.
5.1. Model specification
The coefficient of variation (CV) is used to describe the degree of dispersion of regional GDP and
regional foreign trade amount, which indicates the regional economic disparity and regional foreign
trade development disparity. The model and liner regression is used to simply find out whether there
is a relationship between regional foreign trade amount and regional economic disparity. Using
general assumptions, an equation describing the regional economic disparity (CV of regional GDP)
as a function of the factor regional foreign trade amount (CV of foreign trade amount) can be derived.
The function can be represented as:
,
Where F is the coefficient of variation of regional GDP (which represents the economic disparity
among provinces), is the coefficient of variation of regional foreign trade (which represents the
foreign trade development disparity among provinces).
There are undoubtedly other factors that will affect the coefficient of variation of regional GDP
besides the regional foreign trade amount disparity among provinces. Since the present paper is to
discuss whether there is a relationship between regional economic disparity and regional foreign trade
development disparity, the impact of other factors are neglected and assumed to be random and
independent.
Thus, the model appears in the following form:
5.2. Variables: coefficient of variation The coefficient of variation (CV) is a standardized measure of dispersion of a probability
distribution or frequency distribution. It is defined as the ratio of the standard deviation to
the mean . It is also known as unitized risk or the variation coefficient. The absolute value of the
CV is sometimes known as relative standard deviation (RSD), which is expressed as a percentage.
Journal of Asian Business Strategy, 6(3)2016: 50-62
59
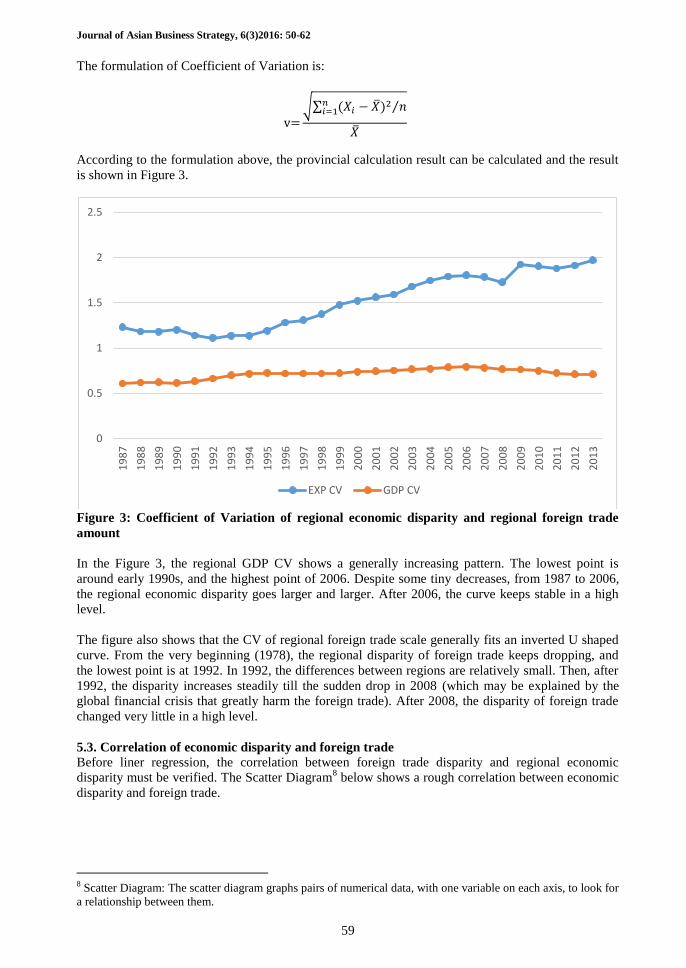
The formulation of Coefficient of Variation is:
√∑
⁄
According to the formulation above, the provincial calculation result can be calculated and the result
is shown in Figure 3.
Figure 3: Coefficient of Variation of regional economic disparity and regional foreign trade
amount
In the Figure 3, the regional GDP CV shows a generally increasing pattern. The lowest point is
around early 1990s, and the highest point of 2006. Despite some tiny decreases, from 1987 to 2006,
the regional economic disparity goes larger and larger. After 2006, the curve keeps stable in a high
level.
The figure also shows that the CV of regional foreign trade scale generally fits an inverted U shaped
curve. From the very beginning (1978), the regional disparity of foreign trade keeps dropping, and
the lowest point is at 1992. In 1992, the differences between regions are relatively small. Then, after
1992, the disparity increases steadily till the sudden drop in 2008 (which may be explained by the
global financial crisis that greatly harm the foreign trade). After 2008, the disparity of foreign trade
changed very little in a high level.
5.3. Correlation of economic disparity and foreign trade Before liner regression, the correlation between foreign trade disparity and regional economic
disparity must be verified. The Scatter Diagram8 below shows a rough correlation between economic
disparity and foreign trade.
8 Scatter Diagram: The scatter diagram graphs pairs of numerical data, with one variable on each axis, to look for
a relationship between them.
0
0.5
1
1.5
2
2.5
19
87
19
88
19
89
19
90
19
91
19
92
19
93
19
94
19
95
19
96
19
97
19
98
19
99
20
00
20
01
20
02
20
03
20
04
20
05
20
06
20
07
20
08
20
09
20
10
20
11
20
12
20
13
EXP CV GDP CV

Journal of Asian Business Strategy, 6(3)2016: 50-62
60
Figure 4: Scatter diagram of the and
In the diagram a predicted line9 is drawn to show a liner relationship between regional economic
disparity and foreign trade disparity. In order to investigate more accurately, calculation of coefficient
of correlation is needed.
The scatter diagram can reflect the relationship between two variables and the direct of the
relationship, but it cannot accurately show the degree of correlation of the two variables. Thus the
coefficient of correlation is designed. The coefficient of correlation is an indicator of the degree of
the correlation between two variables.
The covariance indicates the expectation of the overall error of two variables. The covariance can be
calculated by the following equation:
[ [ ] [ ] ]
The calculation of coefficient of correlation can be achieved by the following equation:
∑
√∑ ∑
Table 3: Covariation of regional foreign trade CV and regional GDP CV
FT CV GDP CV
FT CV 0.089
GDP CV 0.011 0.003
Table 4: Coefficient of correlation of regional foreign trade CV and regional GDP CV
FT CV GDP CV
FT CV 1
GDP CV 0.700 1
The result of calculation shows regional foreign trade CV has significant positive correlation, i.e. a
liner relationship between regional foreign trade disparity and regional foreign trade difference can be
expected.
9 Predicted Line: a line that best fits the trend of the points in the scatter diagram.
0
0.1
0.2
0.3
0.4
0.5
0.6
0.7
0.8
0.9
0 0.5 1 1.5 2 2.5

Journal of Asian Business Strategy, 6(3)2016: 50-62
61
5.4. Estimation results and analysis
In this part, a liner regression is applied, based on the model equation described in 5.1, , and using the data calculated in 5.2, the coefficient of variation of regional GDP ( ) and
the coefficient of variation of regional foreign trade amount ( ). And the regression aims at
further proving the correlation between regional economic disparity and regional foreign trade
development disparity, which is discussed in 5.3.
Table 5: Estimation results of the liner regression
Regression Statistics
Multiple R 0.700
R Square 0.490
Adjusted R Square 0.469
Standard Error 0.040
Observation 27
ANOVA
df SS MS F Significance F
Regression 1 0.039 0.039 24.045 4.783E-05
Residual 25 0.040 0.001
Total 26 0.080
Coefficients Standard Error t Stat P-value Lower 95% Upper 95%
Intercept 0.519 0.041 12.742 0.000 0.435 0.603
Square Feet 0.127 0.026 4.904 0.000 0.073 0.180
According to Table 5, therefore, the result of the regression is
903,
Through residual analysis, the independence of errors, normality and equal variance has been proved.
The regression also passes the F test at the 0.01 degree. Thus, the liner relationship is proved.
Through liner regression, this section proves a general positive liner relationship between the regional
foreign trade disparity and regional economic development disparity. When China’s provincial
foreign trade disparity increases 1 unit, the provincial economic disparity increases 0.1278 units.
6. CONCLUSION
The present paper analyzes an issue and reaches a brief conclusion in each of the previous sections.
This section will provide a summary of all the above research findings and point out the limitations
of the present research as well as implications for further research.
From Section 1 to Section 5, the present paper introduces the definition and situation of regional
economic disparity and foreign trade disparity, presents the previous literature on this topic, uses
different indicators to analyze the evolution of regional economic disparity and foreign trade disparity
in China, and applies a liner regression model to prove the correlation between regional economic
disparity and foreign trade disparity.
The current situation of China’s regional economic disparity is severe and there is no apparent trend
that the disparity is going to be narrower in the near future. The regional foreign trade disparity
observed by coefficient of variation is even more severe than regional economic disparity. When
observing GDP data and foreign trade data from the perspective of coast-interior division, both
foreign trade disparity and economic disparity shows a change: at first the coastal regions were
backward but then quickly they caught up with and surpassed interior regions.

Journal of Asian Business Strategy, 6(3)2016: 50-62
62
Using coefficient of variation to indicate the disparity, the current research finds that there is a strong
correlation between regional foreign trade disparity and regional economic disparity. Furthermore, a
liner regression shows that the relationship between the two variables can be described as CVFT =
0.1278CVGDP + 0.5225, which means that when China’s provincial foreign trade disparity increases 1
unit, the provincial economic disparity increases 0.1278 unit.
The present paper has limitation in the scope and data support. First of all, this research only applies
some but not many economic indicators such as Theil’s index (which was removed because the
results points to the same conclusion as coefficient variation does) and Gini index (which was not
taken into consideration because lack of data). More indicators may enrich the paper. Also, due to the
data missing in the early years and the changes in nation’s statistics measurement method, though
may be credible enough to analyze the situation in the past years, the data may not be able to support
future prediction.
The regional economic disparity and the development of foreign trade in China will definitely
continue to be a heated topic that always draws the public’s attention. Though it cannot be a
prediction of the future situation, the present paper can still be a reference, containing empirical
analysis from the reform and opening policy till the latest year (2013), for the future researchers.
Given more detailed data and more advanced measurement, a more accurate result can be expected.
Funding: This study received no specific financial support.
Competing Interests: The authors declare that they have no conflict of interests.
Contributors/Acknowledgement: All authors participated equally in designing and estimation of current
research.
Views and opinions expressed in this study are the views and opinions of the authors, Journal of Asian
Business Strategy shall not be responsible or answerable for any loss, damage or liability etc. caused in
relation to/arising out of the use of the content.
Reference
Chen, K. (2005). On the effect of foreign trade to regional economic disparity—an empirical
research based on chinese data. Hunan University.
Flecher, M. D. (1968). Trade unions in communist China. University of California, Berkely.
He, L. (2007). Foreign trade and the economic growth disparity of chinese regions: Mechanism
analysis and empiricalstudy. College of Economics of Zhejiang University.
Hu, D. (1998). Trade, production agglomeration, and regional disparity: Theoretical models and a
case study of China. University of Pennsylvania.
Krugman, P., & Elizondo, R. L. (1992). Trade policy and the third world metropolis. MIT.
Krugman, P., & Venables, A. (1995). Globalization and the inequality of Nations. NBER Working
Paper No. 5098.
Li, S. (1991). Analyzing local protectionism. Economic Theory and Economic Management, 4, 67-
69.
Liu, L. (2005). Foreign trade, income distribution and regional disparity— the commercial reason for
chinese regional economici dispairty. Nankai Economic Studies, 58-62.
National Bureau of Statistics, (1999). Comprehensive statistical data and materials on 50 years of
new China. Beijing: China Statistics Press.
Pang, X. (2003).Two essays on foreign trade in China. The University of Chicago.
Wang, Y. (2010). The relevant research on the regional differences of foreign trade and china’s
regional economic growth. Zhejiang Gongshang Univeristy.
Williamson, J. G. (1965). Regional inequality and the process of national development: A description
of the patterns. Economic Development and Cultural Change, 13(4), 3-84.
Williamson, J. G. (1995). Globalization, convergence and history. NBER working paper, 52-59.
Yuan, D. (2007). Research on foreign trade’s influence on chinese income disparity. Huazhong
Technology University.
Zhang, K. (2004). Issues on China’s regional economic movement. Economic Research, 6, 52-57.
Recommended


![Regional disparity in financial inclusion [compatibility mode]](https://img.dokumen.tips/doc/110x75/5494e75cac7959182e8b4cac/regional-disparity-in-financial-inclusion-compatibility-mode.jpg)