OLAP with Pivot TablesSupplemental Resources on Class
Website

Concept Map
OLAP
BI: Visualization
Charts
Implementation
Pivot Table
Pivot Chart

Objectives
▪Define OLAP & Visualization
▪Demonstrate Excel’s Pivot Table and Pivot Chart features.

BI – Data Visualization
On-Line Analytical Processing
▪Drill-Down
▪Consolidation
▪Slicing and Dicing

Drill Down
Slice and Dice

▪Quickly summarize all or part of data
Pivot Table

Pivot Table
http://www.lacoste.pamplin.vt.edu/web1504/resources/video/ss.html
MAC: Use the UPPER Data Menu
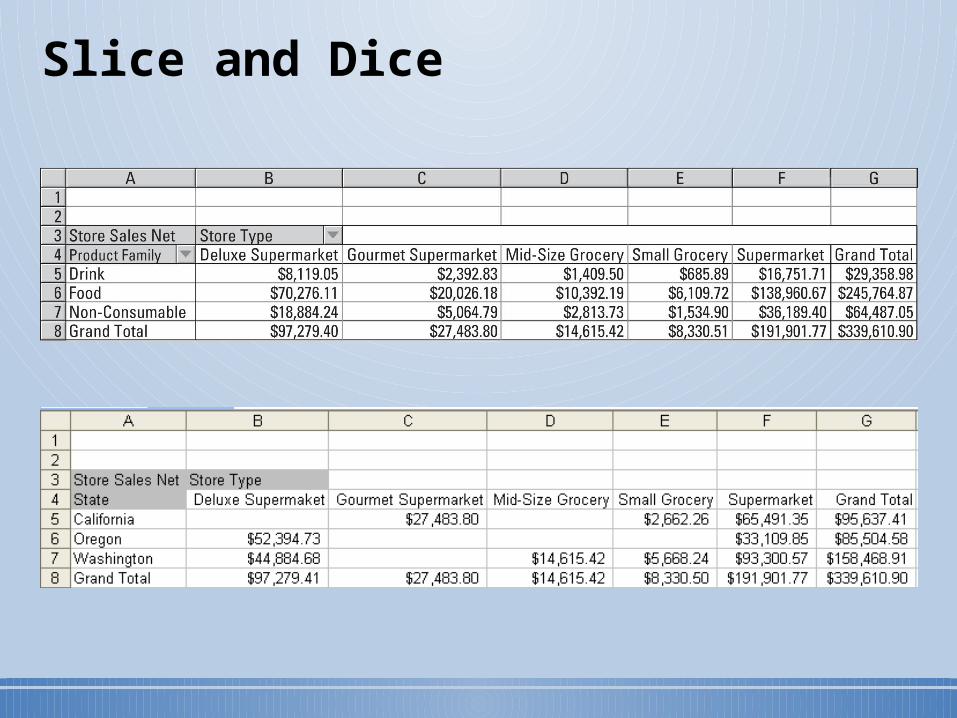
Full Customer List

Group Customers by Type

Group Customers by Type & Standing

Sort: by Grand Total MAC: Limited to
sorting with Data Menu
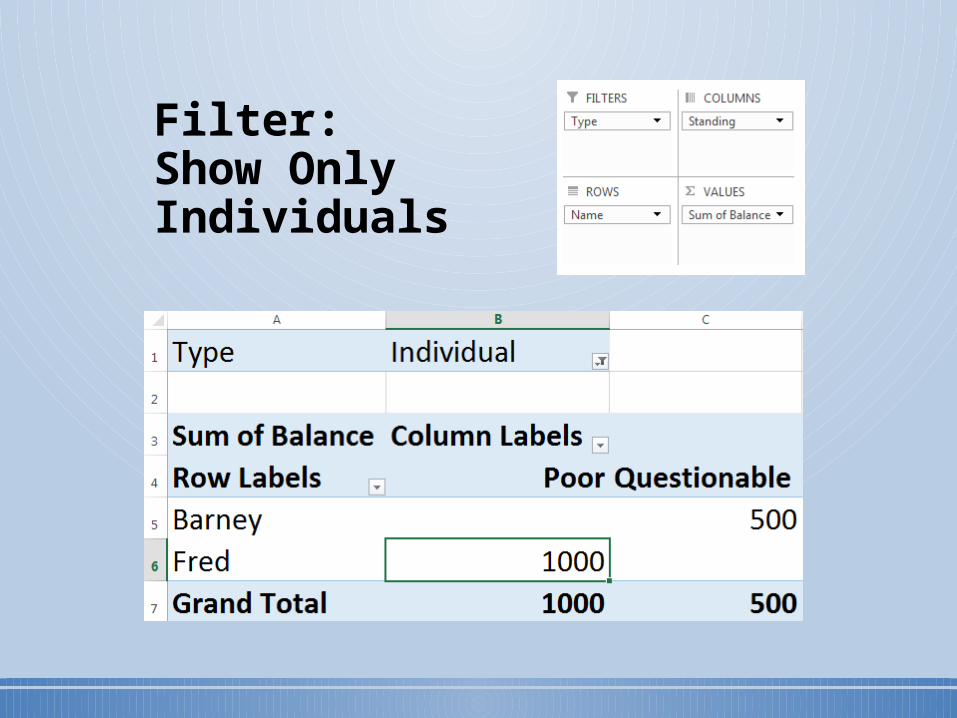
Filter: Show Only Individuals

Pivot Chart
http://www.lacoste.pamplin.vt.edu/web1504/resources/video/ss.html
Barney
Fred
0 200 400 600 800 1000 1200
Questionable Poor
MAC: must make chart thru Chart menu
Recommended


![Categories of OLAP - ir.nuk.edu.tw08]CategoriesofOLAP.pdf1 Categories of OLAP Categories of OLAP tools MOLAP, ROLAP, HOLAP, DOLAP OLAP extension to SQL ROLLUP, CUBE, RANK() OVER, Windowing](https://img.dokumen.tips/doc/110x75/5e0b59f2ce10385c4841823b/categories-of-olap-irnukedutw-08-categories-of-olap-categories-of-olap-tools.jpg)