© Fraunhofer IWES
Matthias Puchta
ETIP-SNET Central Region Workshop, Aachen, 2017/09/18
Offshore Pumped Hydro Storage – Project STENSEA
Source Picture: Hochtief
2
2
2
Grant Number: 0325584B
© Fraunhofer IWES
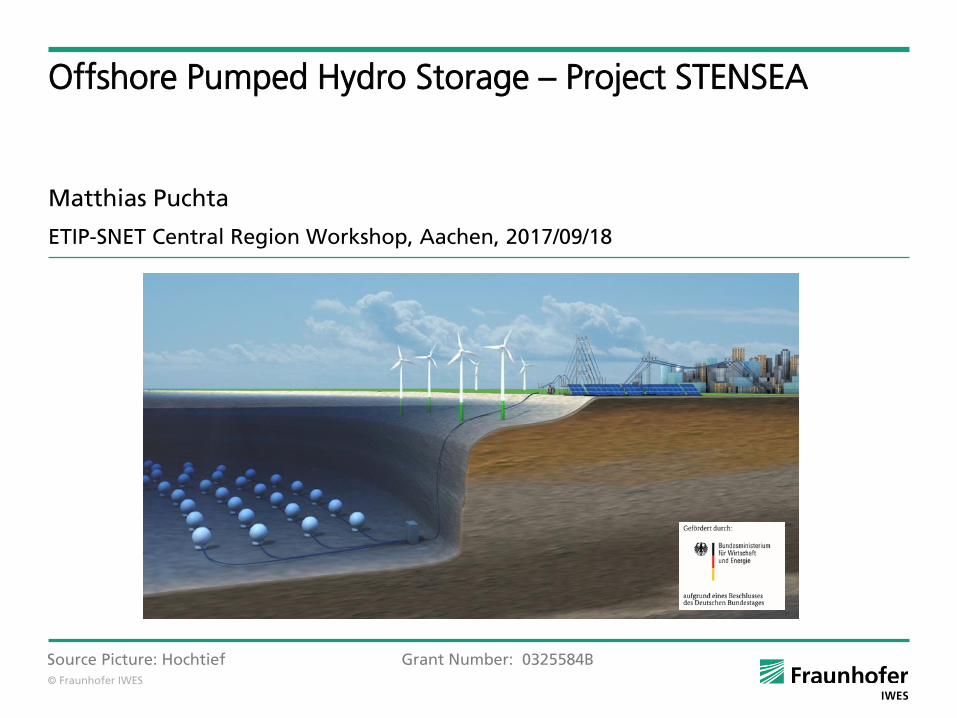
Capacities and discharge times of different storage technologies
© Fraunhofer IWES
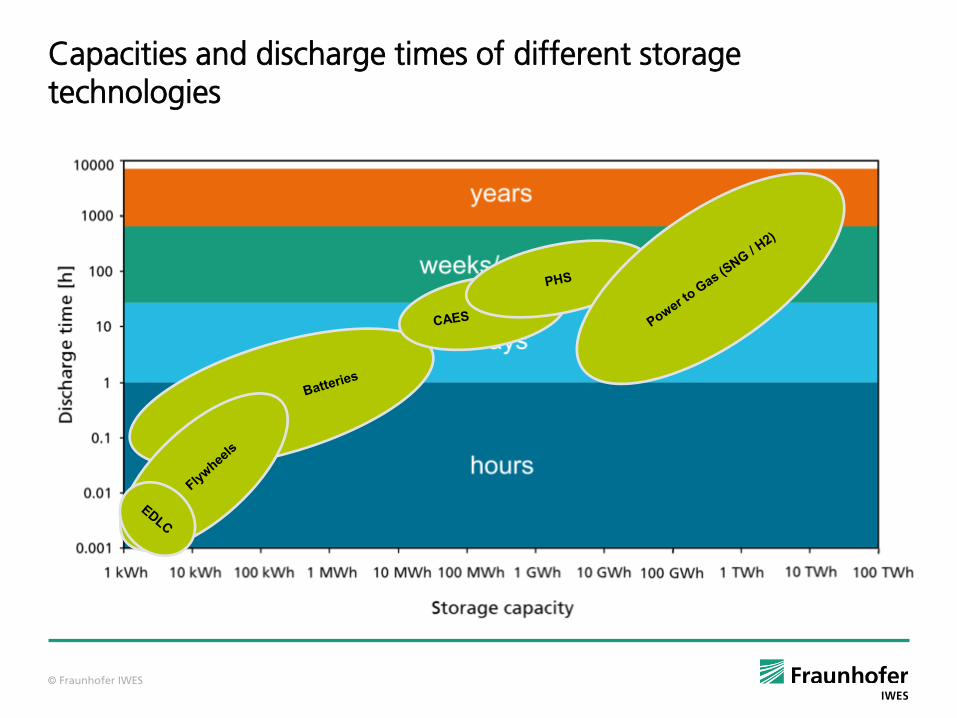
Pumped Hydro Storage (PHS)
Operating principle:
• potential energy
Application:
• Short to medium term storage (h-d)
• Peak load, Grid Services
Properties:
• Low energy costs
• Geographical dependency
• High capacity and efficiency ( up to 88%)
• High construction costs and long construction time
Status & Trend:
• R&D: Use of “natural” height differences PSW Goldisthal, 1GW, 8h, 302m
Around 340 Projects
Source picture bottom right: bmwi-energiewende.de; Source picture top right: http://www.energystorageexchange.org/ and Google Maps
© Fraunhofer IWES
0
100.000
200.000
300.000
400.000
500.000
600.000
700.000
800.000
2005 2010 2015 2020 2025 2030 2035 2040 2045 2050 2055
Inst
alled
Po
wer
in M
W
IRENA
IEA
Batterien
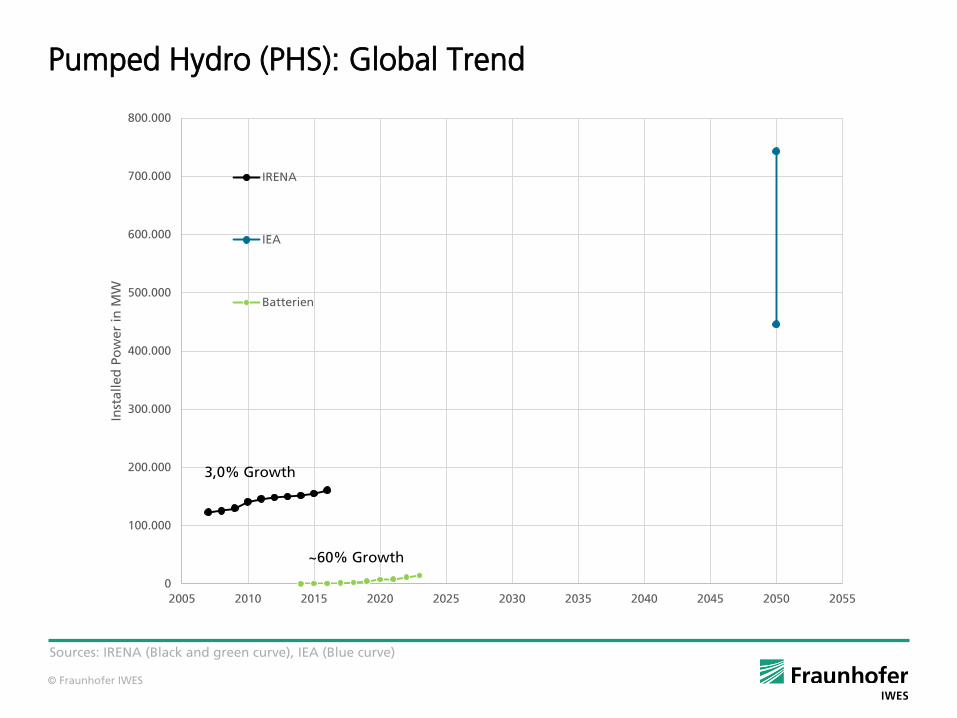
Pumped Hydro (PHS): Global Trend
3,0% Growth
~60% Growth
Sources: IRENA (Black and green curve), IEA (Blue curve)
© Fraunhofer IWES
0
100.000
200.000
300.000
400.000
500.000
600.000
700.000
800.000
2005 2010 2015 2020 2025 2030 2035 2040 2045 2050 2055
Inst
alled
Po
wer
in M
W
IRENA
Entwicklung
IEA
Batterien
Entwicklung
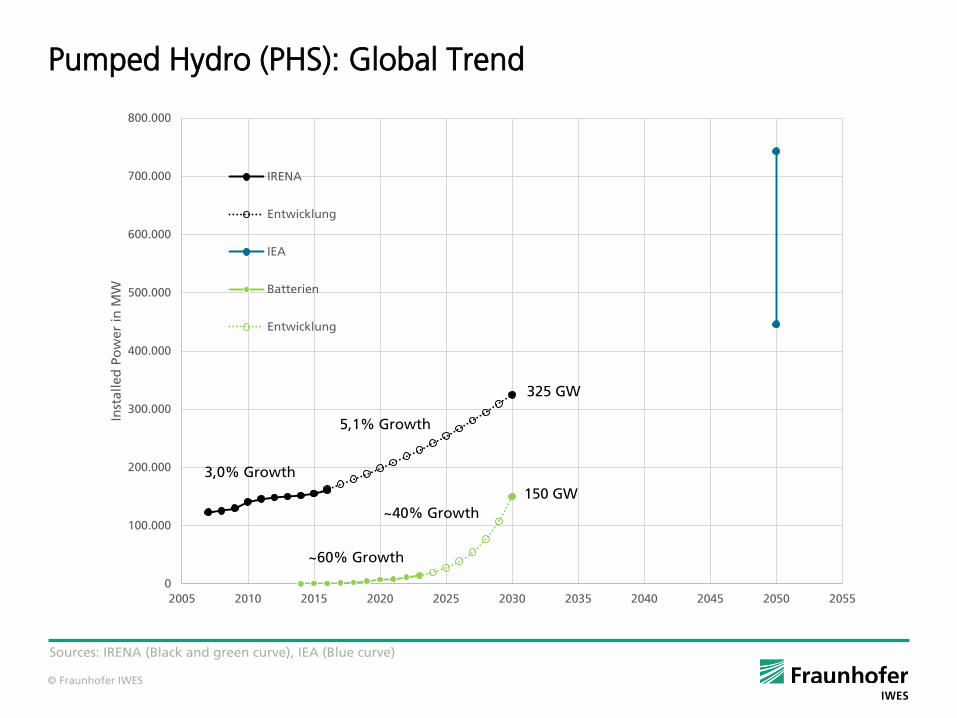
Pumped Hydro (PHS): Global Trend
5,1% Growth
3,0% Growth
~60% Growth
~40% Growth
325 GW
150 GW
Sources: IRENA (Black and green curve), IEA (Blue curve)
© Fraunhofer IWES
0
100.000
200.000
300.000
400.000
500.000
600.000
700.000
800.000
2005 2010 2015 2020 2025 2030 2035 2040 2045 2050 2055
Inst
alled
Po
wer
in M
W
IRENA
Entwicklung
IEA
Entwicklung Minimum
Entwicklung Maximum
Batterien
Entwicklung
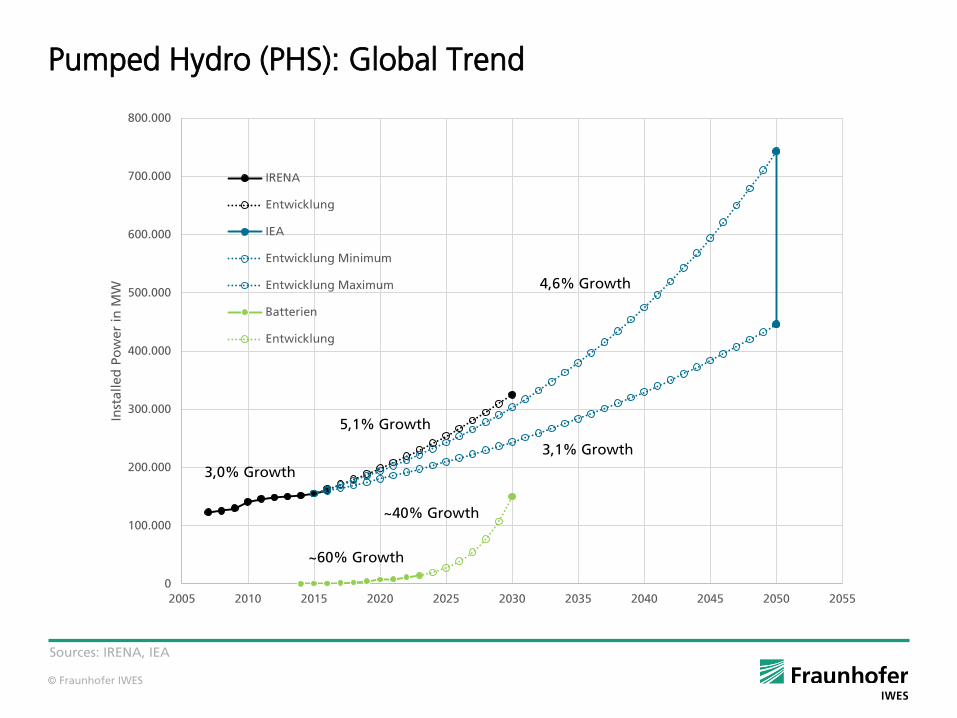
Pumped Hydro (PHS): Global Trend
3,1% Growth
5,1% Growth
4,6% Growth
3,0% Growth
~60% Growth
~40% Growth
Sources: IRENA, IEA
© Fraunhofer IWES
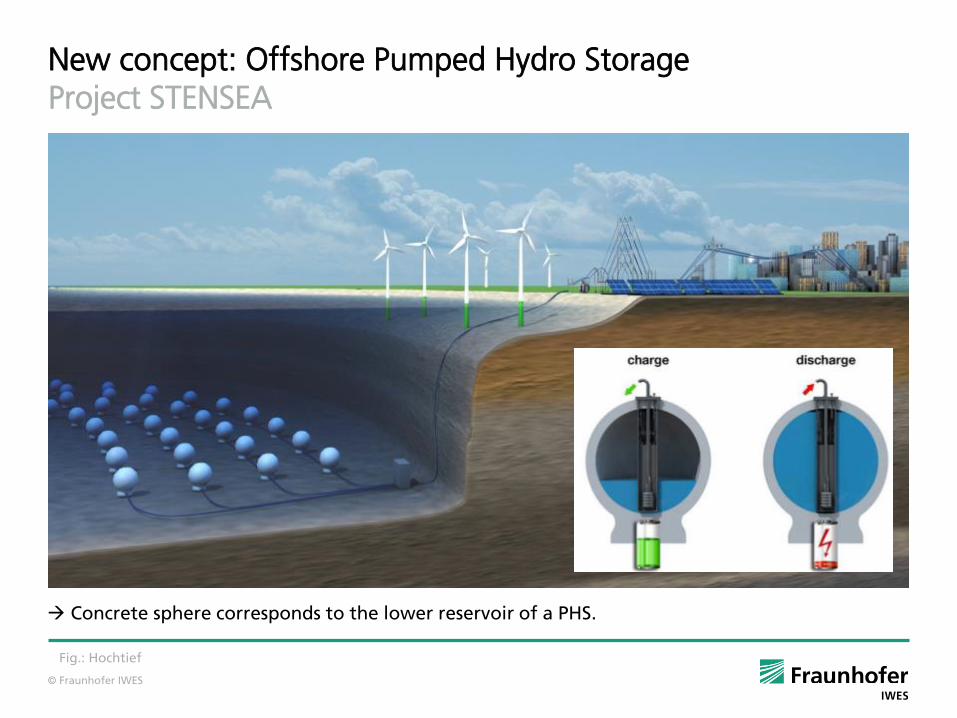
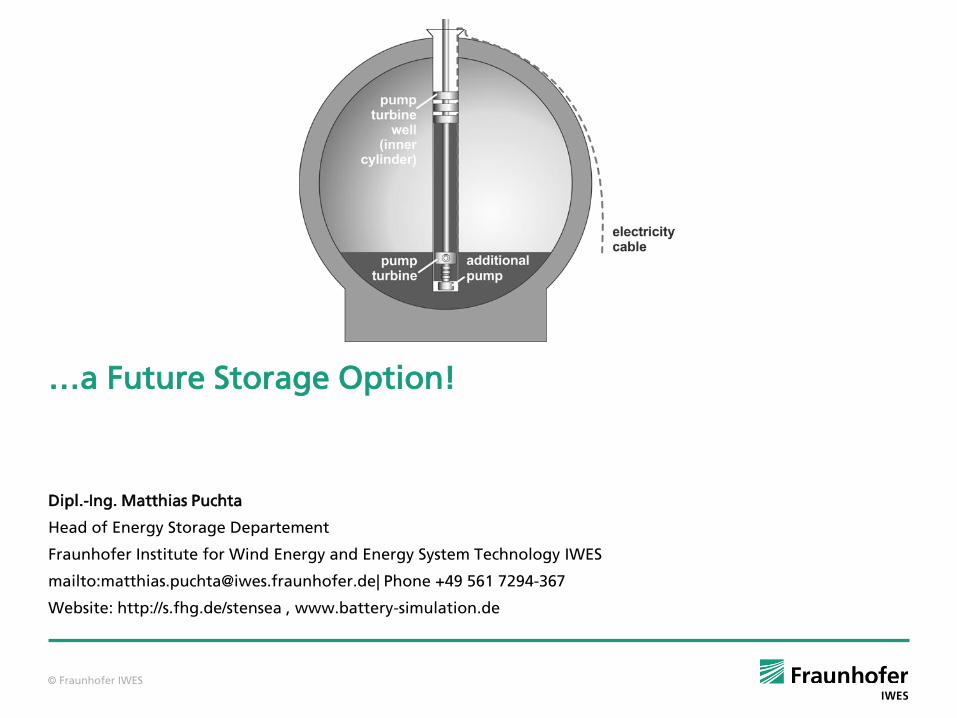
New concept: Offshore Pumped Hydro Storage Project STENSEA
Concrete sphere corresponds to the lower reservoir of a PHS.
Fig.: Hochtief
© Fraunhofer IWES
Phase 1
Feasibility
Phase 2
Model
Phase 3
Pilot
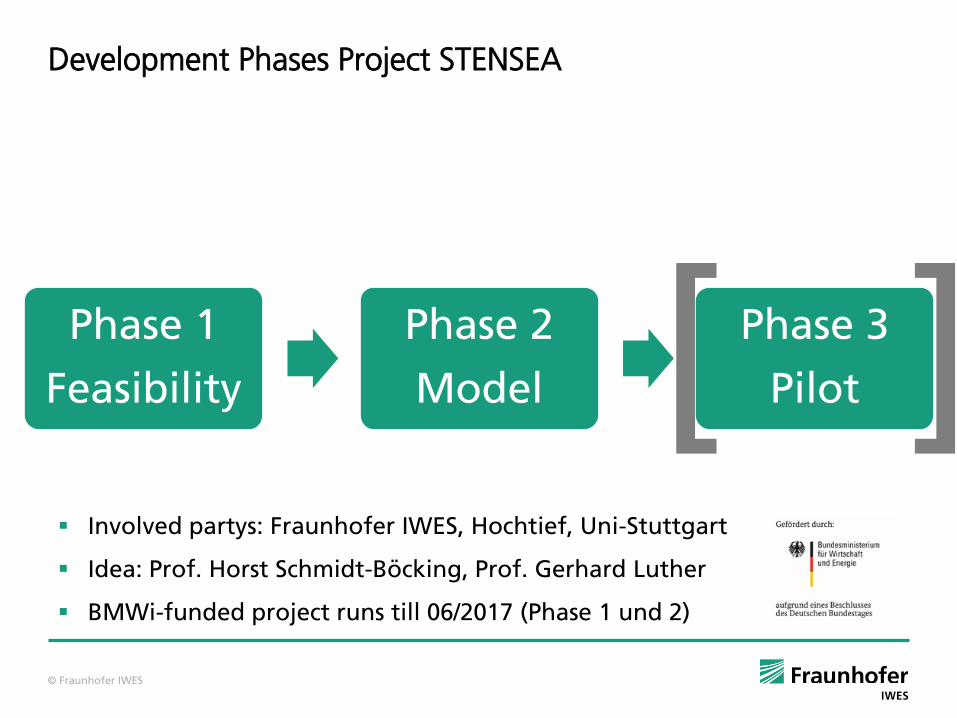
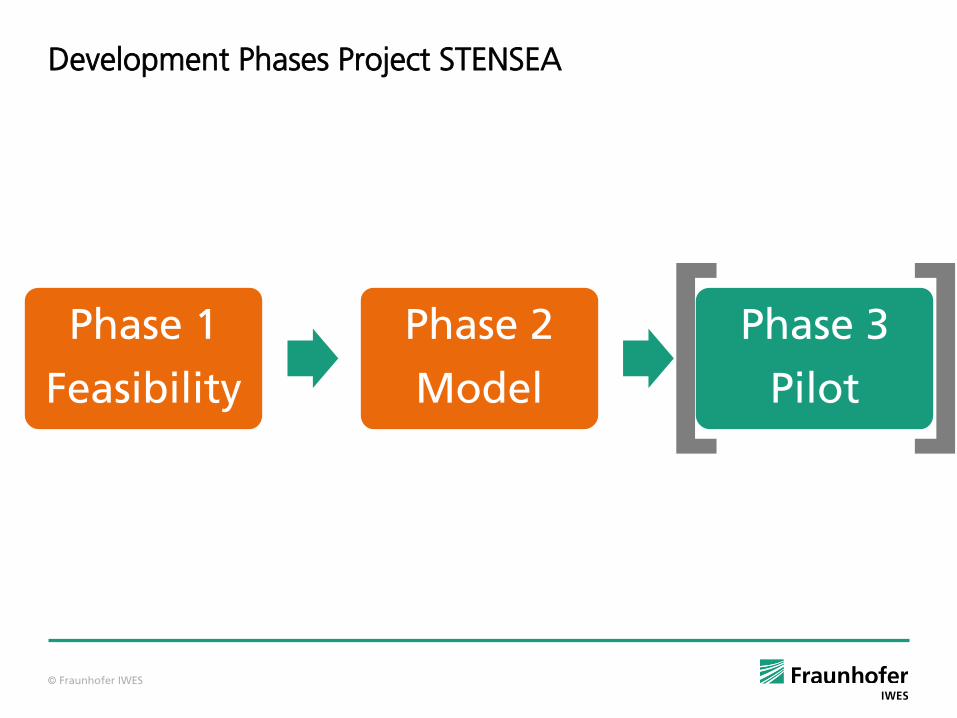
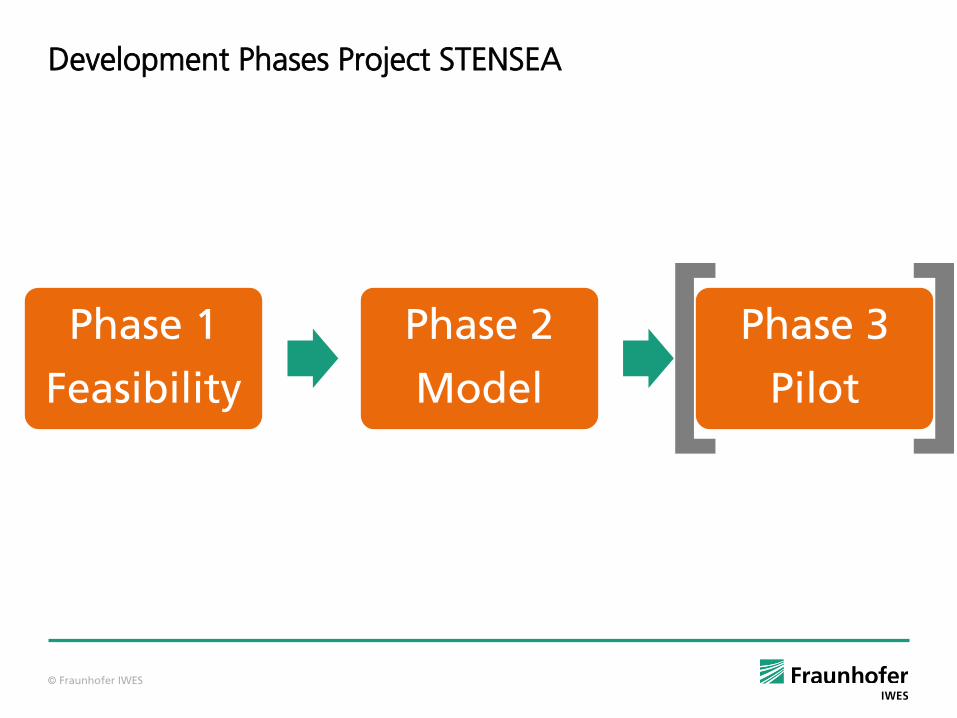
Development Phases Project STENSEA
[ ] Involved partys: Fraunhofer IWES, Hochtief, Uni-Stuttgart
Idea: Prof. Horst Schmidt-Böcking, Prof. Gerhard Luther
BMWi-funded project runs till 06/2017 (Phase 1 und 2)
© Fraunhofer IWES
Phase 1
Feasibility
Phase 2
Model
Phase 3
Pilot [ ]
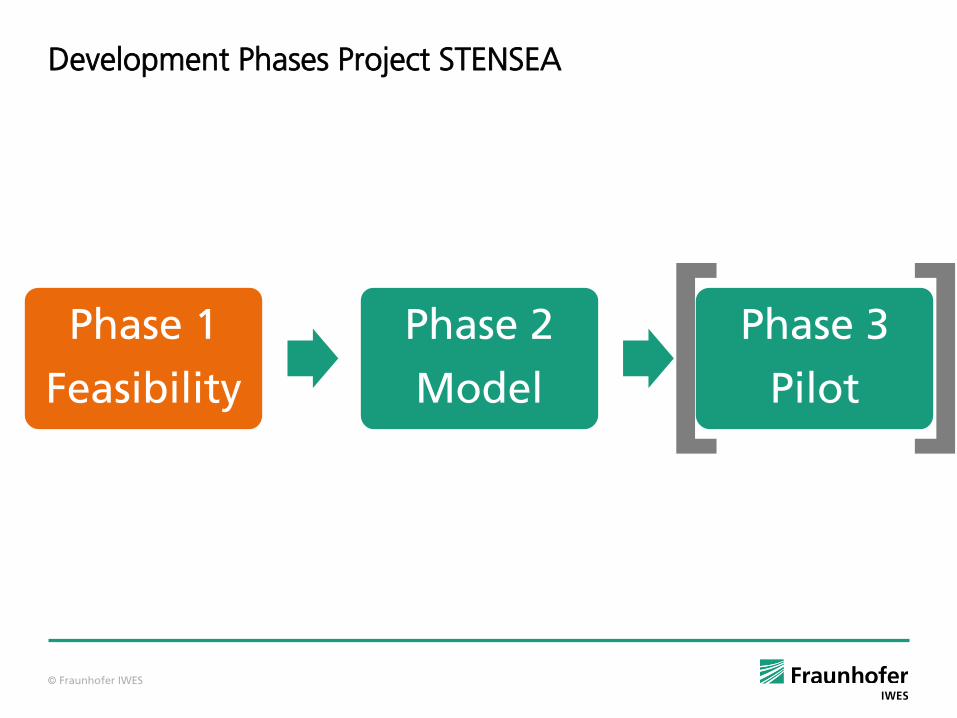
Development Phases Project STENSEA

© Fraunhofer IWES
Technical Data STENSEA Concept
Material: Concrete
Turbine: 5 MW
Discharge time: 4 h
Capacity: 20 MWh
Efficiency: 75-85 %
Diameter: 30 m
Wall thickness: 2,70 m
Storage volume: 12.000 m³
Pressure: 70 bar/700m
Weight: > buoyancy!
Source: Pictures on top and bottom left Hochtief
© Fraunhofer IWES
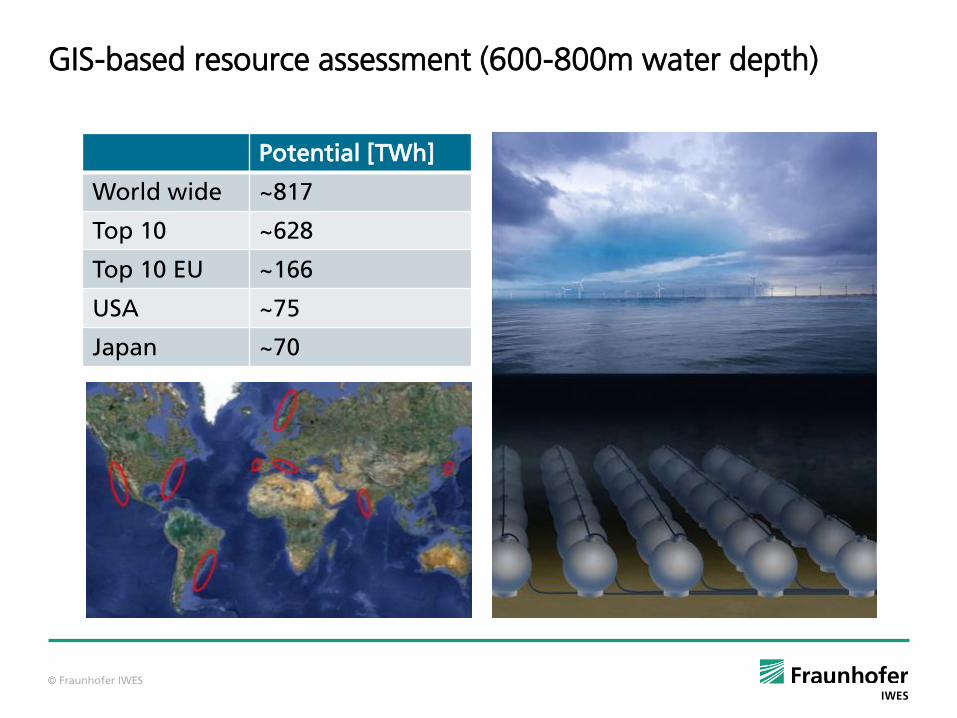
GIS-based resource assessment (600-800m water depth)
Potential [TWh]
World wide ~817
Top 10 ~628
Top 10 EU ~166
USA ~75
Japan ~70
© Fraunhofer IWES
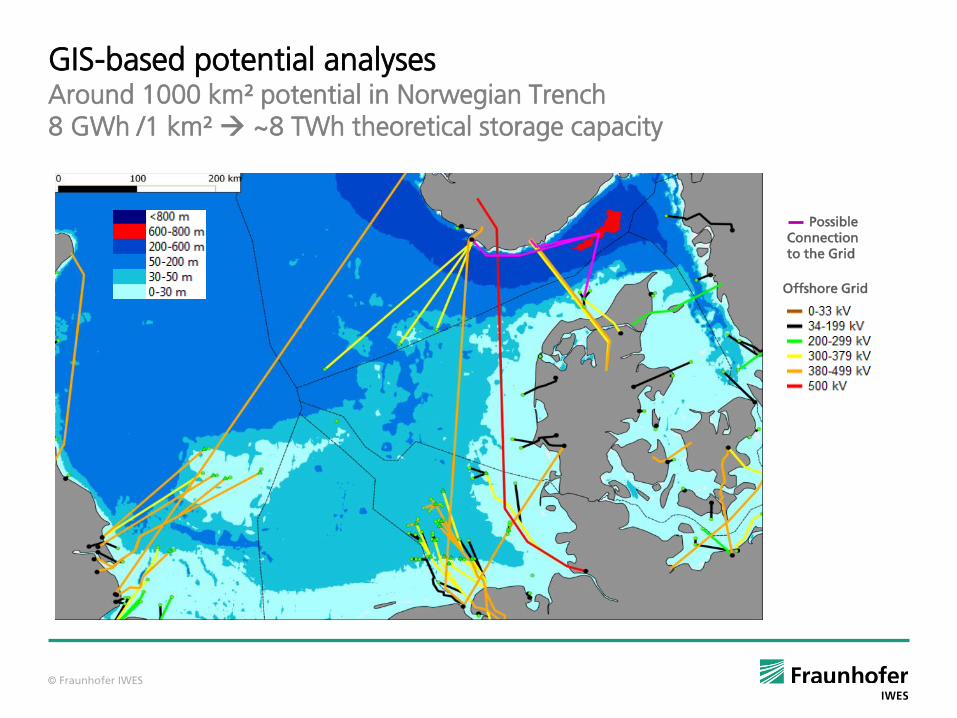
GIS-based potential analyses Around 1000 km² potential in Norwegian Trench 8 GWh /1 km² ~8 TWh theoretical storage capacity
Offshore Grid
Possible Connection to the Grid
© Fraunhofer IWES
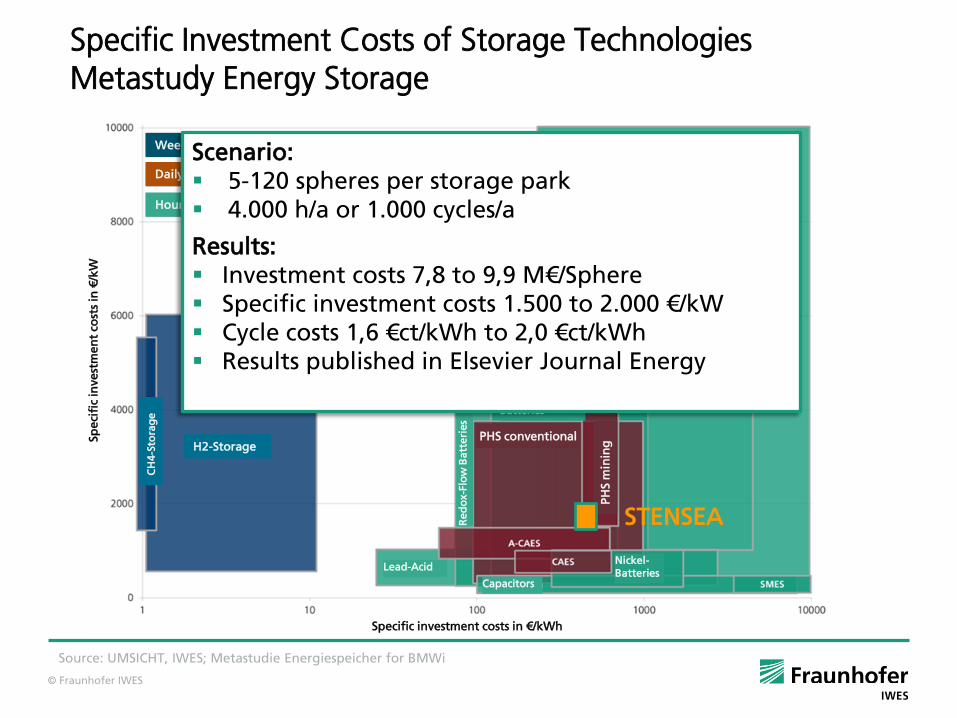
Specific Investment Costs of Storage Technologies Metastudy Energy Storage
Source: UMSICHT, IWES; Metastudie Energiespeicher for BMWi
STENSEA
Sp
eci
fic
inve
stm
en
t co
sts
in €
/kW
Specific investment costs in €/kWh
Lead-Acid
Capacitors
Nickel-Batteries
Lithium-Ion
PH
S m
inin
g PHS conventional
High-Temp. Batteries
Re
do
x-F
low
Ba
tte
ries
H2-Storage
CH
4-S
tora
ge
Flywheels
Daily compensation
Weekly/ annual compensation
Hourly compensation
Scenario: 5-120 spheres per storage park 4.000 h/a or 1.000 cycles/a
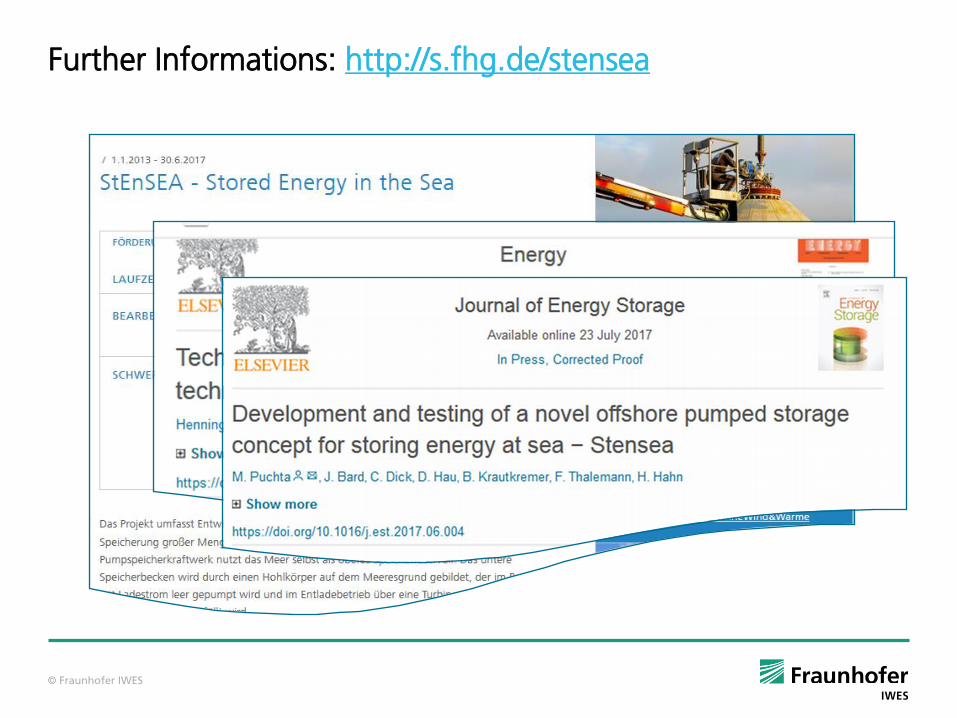
Results: Investment costs 7,8 to 9,9 M€/Sphere Specific investment costs 1.500 to 2.000 €/kW Cycle costs 1,6 €ct/kWh to 2,0 €ct/kWh Results published in Elsevier Journal Energy
© Fraunhofer IWES
Phase 1
Feasibility
Phase 2
Model
Phase 3
Pilot [ ]
Development Phases Project STENSEA
© Fraunhofer IWES
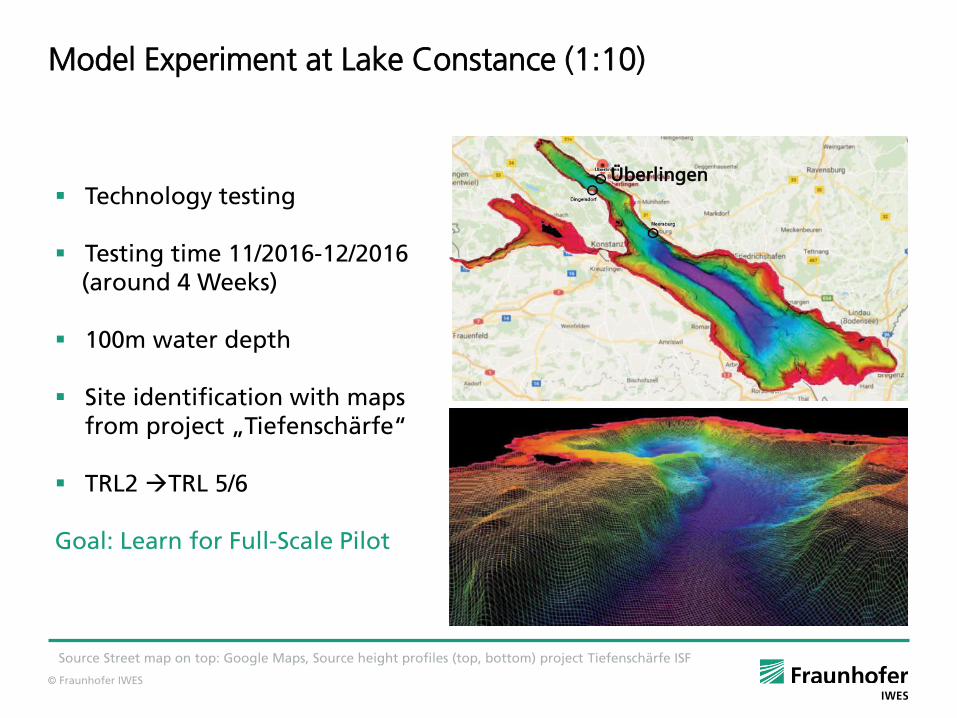
Model Experiment at Lake Constance (1:10)
Technology testing
Testing time 11/2016-12/2016 (around 4 Weeks)
100m water depth Site identification with maps
from project „Tiefenschärfe“
TRL2 TRL 5/6
Goal: Learn for Full-Scale Pilot
Überlingen
Source Street map on top: Google Maps, Source height profiles (top, bottom) project Tiefenschärfe ISF
© Fraunhofer IWES
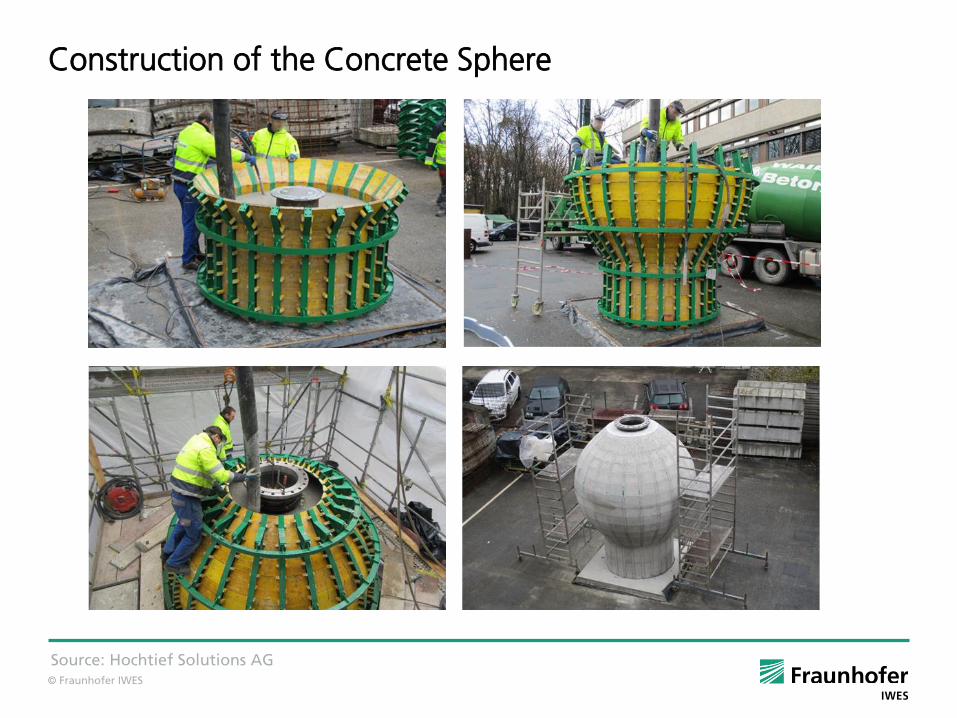
Construction of the Concrete Sphere
Source: Hochtief Solutions AG
© Fraunhofer IWES
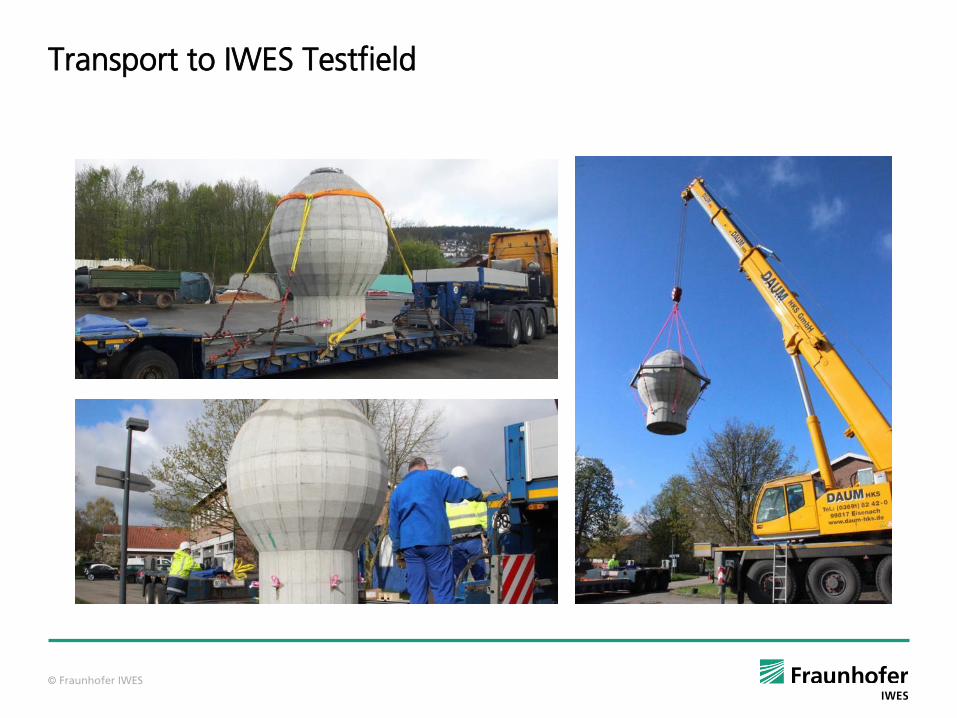
Transport to IWES Testfield
© Fraunhofer IWES
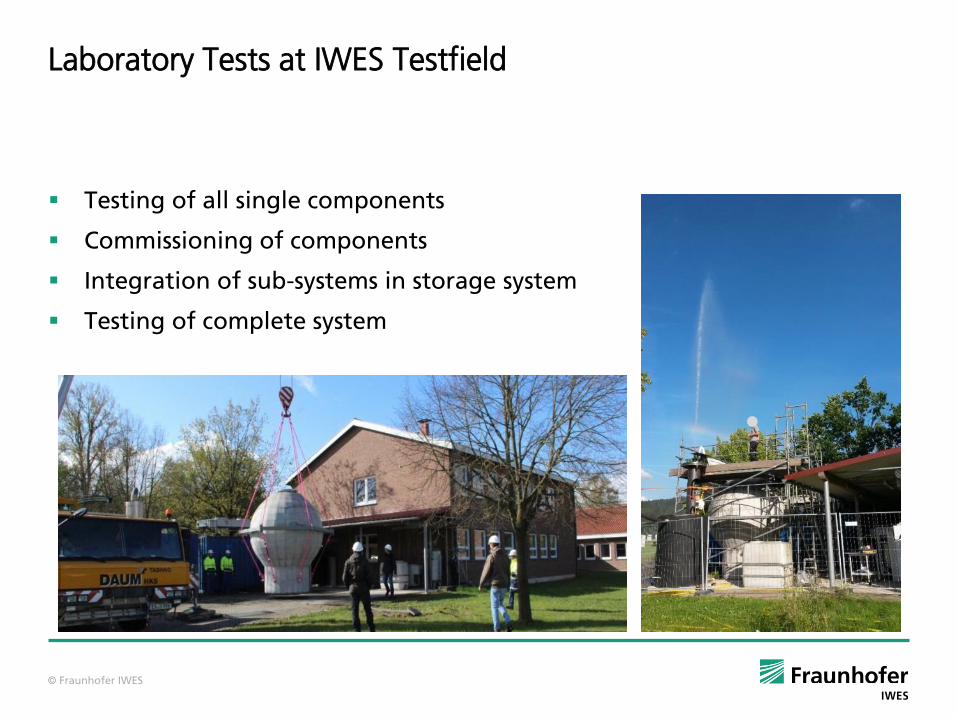
Laboratory Tests at IWES Testfield
Testing of all single components
Commissioning of components
Integration of sub-systems in storage system
Testing of complete system
© Fraunhofer IWES
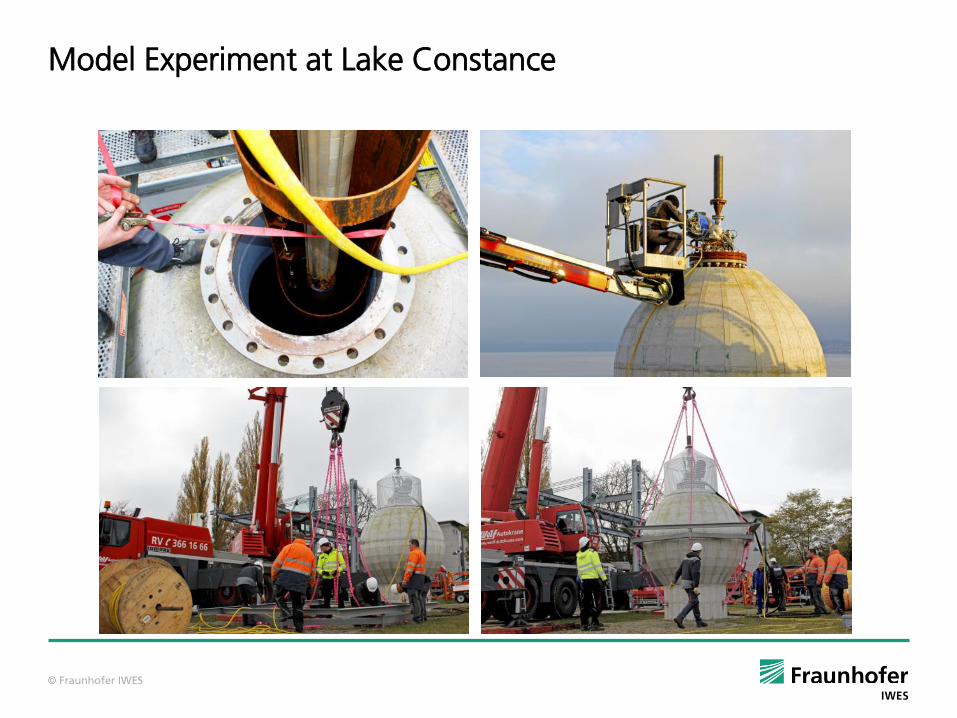
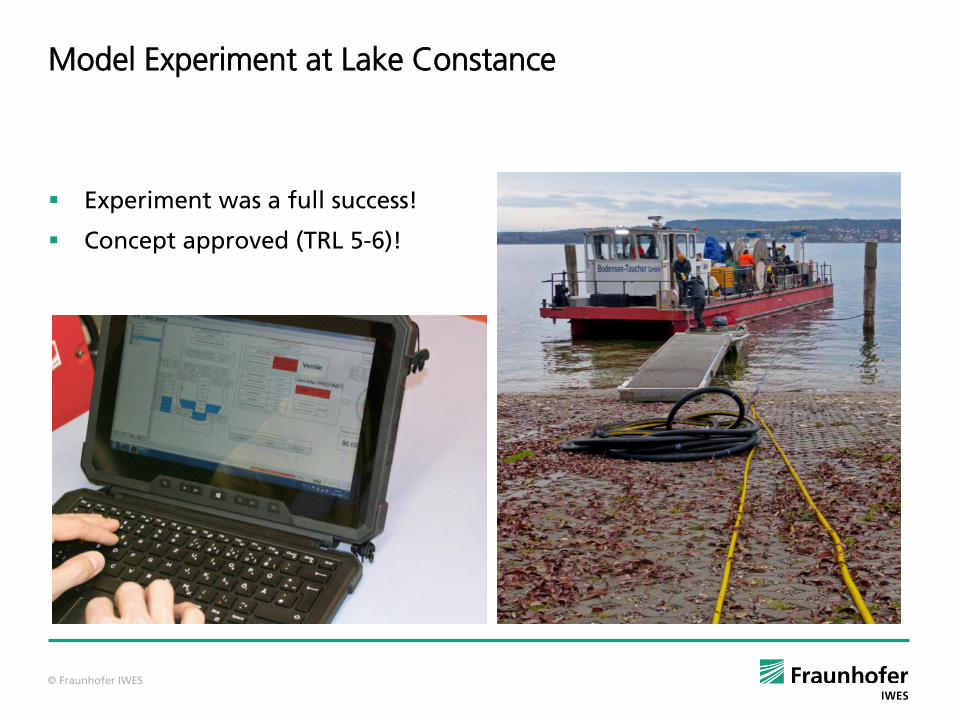
Model Experiment at Lake Constance
© Fraunhofer IWES
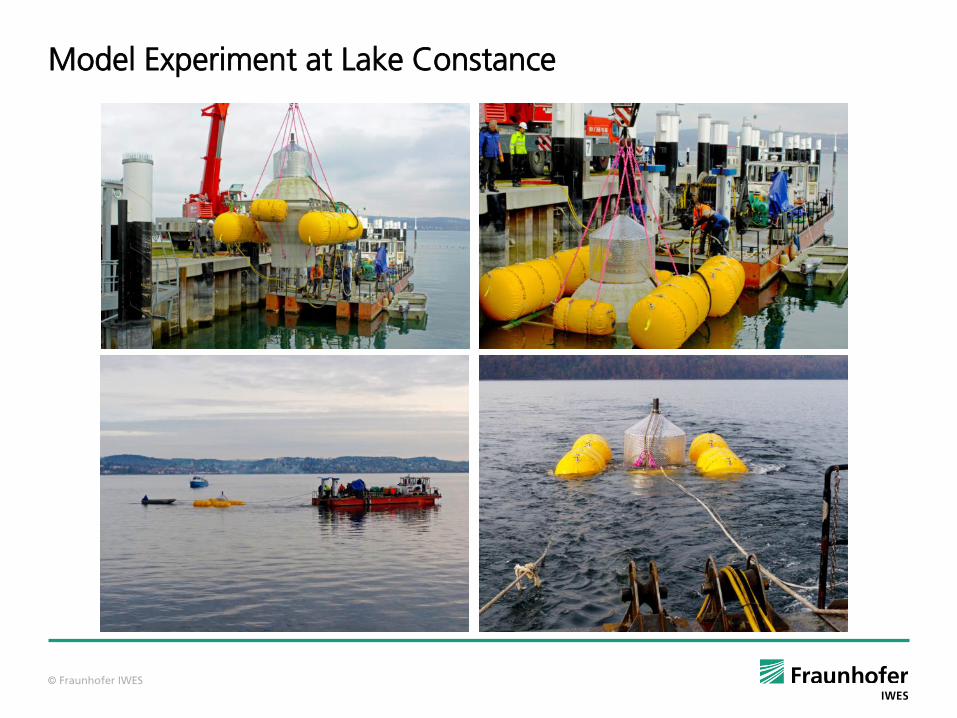
Model Experiment at Lake Constance
© Fraunhofer IWES
Experiment was a full success!
Concept approved (TRL 5-6)!
Model Experiment at Lake Constance
© Fraunhofer IWES
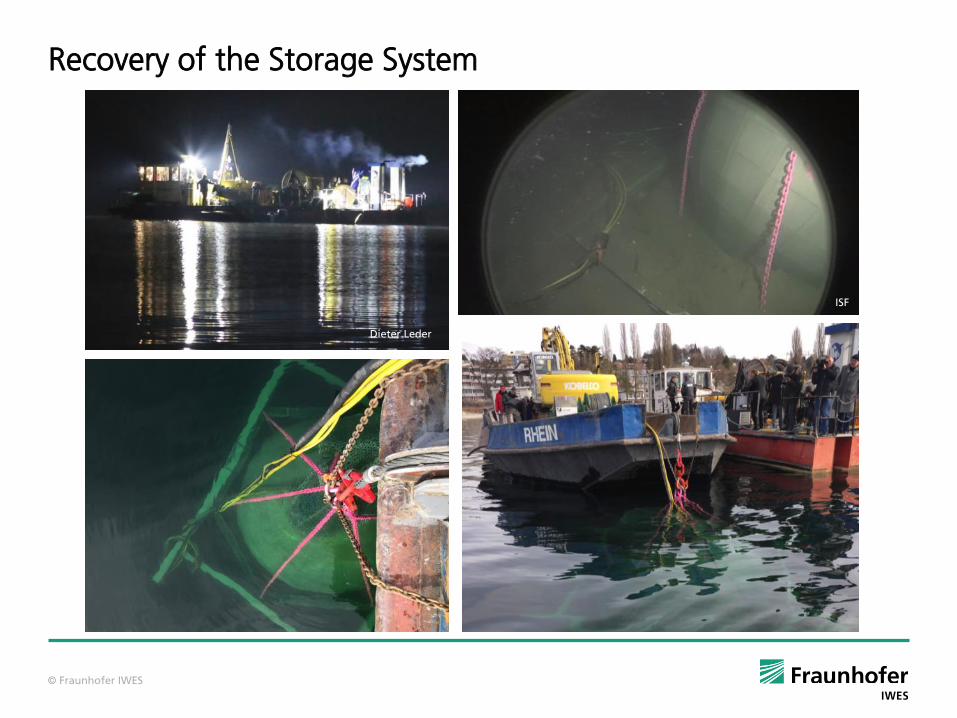
Recovery of the Storage System
Dieter Leder
ISF
© Fraunhofer IWES
Phase 1
Feasibility
Phase 2
Model
Phase 3
Pilot [ ]
Development Phases Project STENSEA
© Fraunhofer IWES
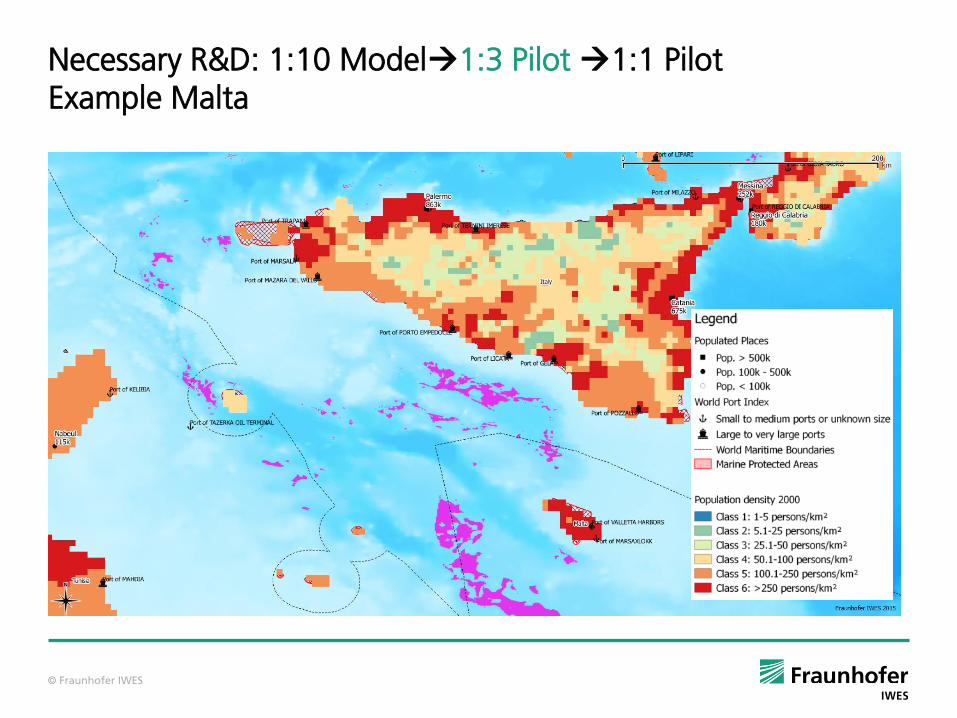
Necessary R&D: 1:10 Model1:3 Pilot 1:1 Pilot Example Malta
© Fraunhofer IWES
…a Future Storage Option!
Dipl.-Ing. Matthias Puchta
Head of Energy Storage Departement
Fraunhofer Institute for Wind Energy and Energy System Technology IWES
mailto:[email protected]| Phone +49 561 7294-367
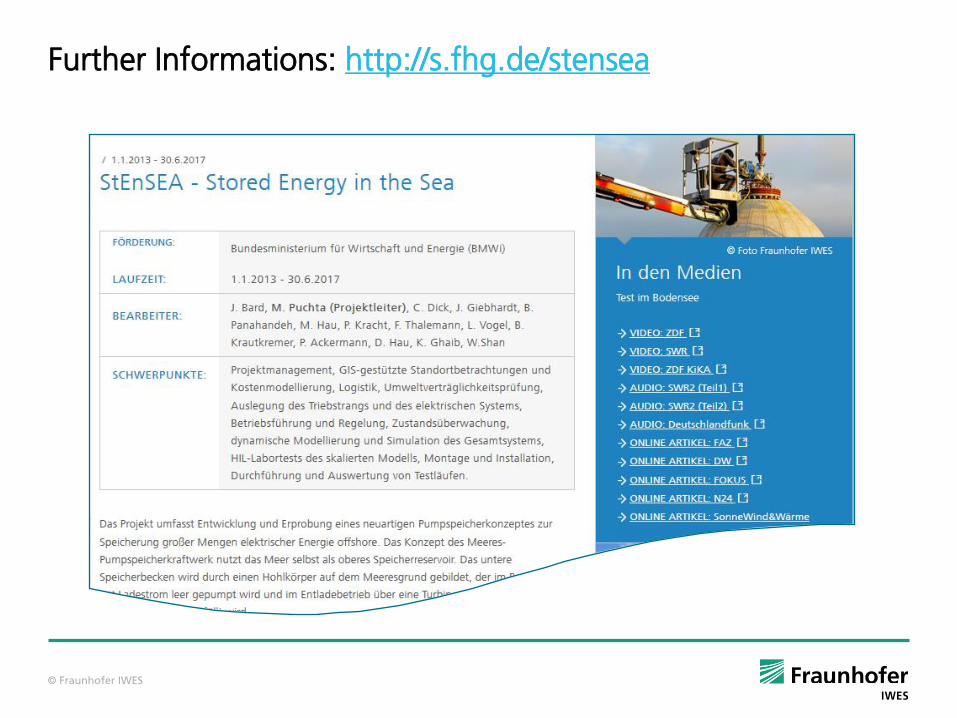
Website: http://s.fhg.de/stensea , www.battery-simulation.de
© Fraunhofer IWES
Further Informations: http://s.fhg.de/stensea
© Fraunhofer IWES
Further Informations: http://s.fhg.de/stensea
Recommended