A University of Sussex DPhil thesis
Available online via Sussex Research Online:
http://sro.sussex.ac.uk/
This thesis is protected by copyright which belongs to the author.
This thesis cannot be reproduced or quoted extensively from without first obtaining permission in writing from the Author
The content must not be changed in any way or sold commercially in any format or medium without the formal permission of the Author
When referring to this work, full bibliographic details including the author, title, awarding institution and date of the thesis must be given
Please visit Sussex Research Online for more information and further details

BiophysicalCharacterisationofLcrH,
aClassIIChaperoneoftheTypeIII
SecretionSystem
SunnyKumarSingh
AthesissubmittedforthedegreeofDoctorof
Philosophy(Chemistry)attheUniversityofSussex
September2015

2
Declaration
Iherebydeclarethatthisthesishasnotbeenandwillnotbe,submittedinwholeorin
parttoanotherUniversityfortheawardofanyotherdegree.
Signed:
SunnyKumarSingh,18thSeptember2015

3
InmemoryofmyGrandfather,GrandmotherandFather

4
‘’Itdoesnotmatterhowslowlyyougoaslongasyoudonotstop.’’
- Confucius

5
Acknowledgements
FirstandforemostIthankmysupervisorProfLouiseSerpell.Icouldnothavecomethis
farwithout your support and kindness. I amgrateful to theUniversity of Sussex for
fundingthisproject.IdonotthinkIcanthankDrEwanMainenough.Notbecauseof
the standard polite gratitude that needs to be given to PhD supervisors in
acknowledgementsbutbecauseItrulyamindebtedtoyou.Youprovidedmewiththe
opportunitytowork,helpedmegetthroughthetoughtimesofrecurringillnessesand
hadthepatienceoflettingmestickaroundforwhatnowseemslikecenturies.Ialso
acknowledge my co-supervisor Dr Darren Thompson for his support, laboratory
equipmentandamusinganecdotes.
I thank Prof Andrew Smith and his group in former lab 13, Chemistry, University of
Sussex especially Dr Wendy Doyle for her advice on molecular biology which was
instrumentalinkick-startingmyproject.Additionally,IthankDrYaldaJavadi,DrMaria
Karatsa-DodgsonandDr SarahPannell foreducationon instrumentation, techniques
andinspiration.
Ihavecherishedthe timespentboth inside the labandoutwithmydear friendsDr
Jonathan(JJ)PhillipsandDr.CharlotteMillershipbothinSussexandinLondon.Iwill
neverforgetourculinarygatherings.
AnenormousthankstoDrRuth-SarahRoseforhersupportduringmytimeatQMUL.
She trained me for using various instruments and provided invaluable help in the
compositionofmythesis.WithoutherguidanceIwouldnothaveaccomplishedthis.I
am grateful to Kelly Clark largely for her hospitality but also for the initiation into
Britishculture.
I thank themembers past and present of office 4.36 inG.E. Fogg building atQMUL
especiallyDrEricaBelgio,AnnaYates,DrHelenMarks,DrTatianaNovoselovaandDr
Christopher Duffy. There are many others, too numerous to mention but your
contributionandsupportisnolesssignificant.Also,themembersofG35intheJoseph
PriestlyBuildingatQMUL, inparticularDrNadineYounanforherexpertiseregarding
CD.

6
IamdeeplyindebtedtomyfriendsInderjeet,Souvik,Anirban,Srijit,MaheshandTina.
You made me feel at home away from home. Your companionship gave me the
courage to fight against all odds and crawl out of deep despair. I would not have
survivedwithoutyouall.
Withoutmy lateGrandfather, this journeywouldnothavebeenpossible. Itwashis
encouragement and sacrifice that allowed me to come to the UK and pursue my
passion.Iamoverwhelmedbytheselflesslovefrommymotherwhohastakencareof
mesingle-handedly in theabsenceofmy father. Ihavenowords to thankmy little
brotherwhohastakencareofmyfamilyinMumbaiinmyabsenceandhashelpedme
payallofmydebts.Thelovefrommycousinsandextendedfamilyhascontinuedto
feedmyenthusiasmformycareerinscience.Noonehaseverpursuedscienceinmy
familysoIthankyouforyoursupport,evenifitdoesmakeitsomuchharderformeto
explainwhatI’vedone.IhopeIhavemadeyouproud.

7
Summary
Thetypethree-secretionsystem(T3SS) isa largeandcomplexproteinnano-machine
thatmanygram-negativepathogensemploytoinfecthostcells.Akeystructureofthis
machine is aproteinaceouspore that inserts into the targetmembraneand formsa
channelforbacterialtoxinstoflowfrombacteriaintothehostcell.Theporeismainly
formed from two large membrane proteins called “translocators”. Importantly,
effective secretion and thus pore formation of the translocators depends on their
bindingtoandbeingtransportedbysmallspecializedchaperonesaftersynthesisinthe
bacterialcytosol.Recentcrystalstructureshaveshownthesechaperonesareformed
from modular tetratricopeptide repeats (TPRs). However, each crystal structure
produceddifferenthomodimericstructures,suggestingflexibilityintheirtopologythat
maybeofimportancetofunction.
Given the crucial role of the translocator chaperones, we investigated the
conformational stability of the chaperone LcrH (Yersinia pestis). Mutational analysis
coupled with analytical ultra-centrifugation and equilibrium chemical denaturations
showedthatLcrHisaweakandthermodynamicallyunstabledimer(KD≈15μM,∆𝑮H2O
=7.4kcalmol-1).ThemodularTPRstructureofthedimerallowsittoreadilyunfoldina
non-cooperativemanner to a one-third unfolded dimeric intermediate (∆𝑮H2O = 1.7
kcalmol-1), before cooperativelyunfolding toamonomericdenatured state (∆𝑮H2O =
5.7kcalmol-1).Thusunderphysiologicalconditionsthechaperone isabletopopulate
C-terminallyunravelledpartiallyfoldedstates,whilstbeingheldtogetherbyitsdimeric
interface.Suchabilitysuggestsa“fly-casting”mechanismasaroutetobindingtheirfar
largertranslocatorcargo.

8
Abbreviations
ABC ATPbindingcassette
Amp Ampicillin
AmpR Ampicillinresistance
A.tumefaciens Agrobacteriumtumefaciens
AUC Analyticalultracentrifugation
bp basepair
CBD Chaperonebindingdomain
CD Circulardichroism
cm Centimetre
DLS Dynamiclightscattering
dNTP Deoxyribonucleotidetriphosphate
DTT D-L-Dithiothreitol
E.coli Escherichiacoli
EDTA Ethylenediaminetetraacetate
fl-LcrH FulllengthLcrH
FPLC Fastpurificationliquidchromatography
g Grams
Gdm Guanidinium
GPS Generalsecretorypathway
GST GlutathioneS-transferase
Hcp Haemolysincoregulatedprotein

9
IM Innermembrane
IPTG Isopropyl-β-D-thiogalactopyranoside
ITC Isothermaltitrationcalorimetry
kb kilobase
LB Luria-Bertanibroth
lb/in2 poundspersquareinch
LcrH LowcalciumresponseproteinH
L65Etr-LcrH TruncatedLcrHcarryingtheL65Emutation
LPS Lipopolysaccharide
mdeg Millidegree
MFP Membranefusionprotein
MS Innermembranering(T3SS)
OM Outermembrane
OMP Outermembraneporeformingprotein
P.aeruginosa Pseudomonasaeruginosa
PAGE Polyacrylamidegelelectrophoresis
PBS Phosphatebufferedsaline
PCR Polymerasechainreaction
PDB Proteindatabank
PP Periplasm
SDS Sodiumdodecylsulphate
SEC Sizeexclusionchromatography

10
SRP Signalrecognitionparticle
T1SS TypeISecretionSystem
T2SS TypeIISecretionSystem
T3SS TypeIIISecretionSystem
T4SS TypeIVSecretionSystem
T5SS TypeVSecretionSystem
T6SS TypeVISecretionSystem
Tat Twin-argininetranslocation
TEMED N,N,N’,N’-tetramethylethylenediamine
TPR Tetratricopeptiderepeat
Tris Trizmabase
tr-LcrH truncatedLcrH
Tm Meltingtemperature
UV-Vis Ultraviolet-visible
V.cholera Vibriocholera
Y.enterocolitica Yersiniaenterocolitica
Y.pestis Yersiniapestis

11
TableofContents
CHAPTER1 INTRODUCTION...............................................................................................16
1.1 SYMBIOSIS,PATHOGENESIS&COMMENSALISM.....................................................................16
1.2 GRAMPOSITIVEANDGRAMNEGATIVEBACTERIA...................................................................17
1.3 PROTEINSECRETIONBYBACTERIA........................................................................................18
1.3.1 SECRETIONTHROUGHTHEINNERMEMBRANE...........................................................................19
1.3.1.1 TheSecPathway..........................................................................................................19
1.3.1.2 SignalRecognitionParticle(SRP).................................................................................20
1.3.1.3 TheTatSystem.............................................................................................................20
1.3.2 GRAM-NEGATIVEBACTERIALSECRETIONSYSTEMS....................................................................20
1.3.2.1 TypeISecretionSystem(T1SS)....................................................................................21
1.3.2.2 TypeIISecretionSystem(T2SS)...................................................................................22
1.3.2.3 TypeIIISecretionSystem(T3SS)..................................................................................24
1.3.2.4 TypeIVSecretionSystem(T4SS)..................................................................................25
1.3.2.5 TypeVSecretionSystem(T5SS)...................................................................................26
1.3.2.6 TypeVISecretionSystem.............................................................................................28
1.3.3 TYPETHREESECRETIONSYSTEMINDETAIL..............................................................................31
1.3.3.1 TheroleofChaperonesintheT3SS.............................................................................40
1.3.3.2 ClassIChaperones.......................................................................................................40
1.3.3.3 ClassII&IIIChaperones...............................................................................................44
1.3.3.4 StructureandbiophysicalcharacterisationofClassIIChaperones.............................48
1.3.3.5 StructureandbiophysicalcharacterisationofClassIIIChaperones............................53
1.4 THESISAIMS...................................................................................................................56
CHAPTER2 MATERIALSANDMETHODS............................................................................57
2.1 MOLECULARBIOLOGYMETHODS........................................................................................57
2.1.1 FL-LCRHGENESYNTHESIS......................................................................................................57
2.1.1.1 RecursivePCR...............................................................................................................57
2.1.1.1.1 AgaroseGelElectrophoresis.....................................................................................58
2.1.1.2 PolymeraseChainReaction(PCR)................................................................................58
2.1.2 INSERTIONOFSYNTHESISEDLCRHGENEINTOACLONINGVECTOR................................................59
2.1.2.1 Cloningofl-LcrHgeneintoTOPOTAcloningvector....................................................59
2.1.2.1.1 Poly-AtailingwithTaqpolymerase..........................................................................59
2.1.2.1.2 LigationforTOPOTAcloning....................................................................................60

12
2.1.2.1.3 TransformationofLigatedfl-LcrHinchemicallycompetentcells.............................60
2.1.2.1.4 DNAextractionandpurification...............................................................................61
2.1.2.1.5 EstimationofDNAconcentration.............................................................................61
2.1.2.1.6 AnalyticalRestrictionDigestionwithEcoRI..............................................................62
2.1.2.1.7 DNAsequencing........................................................................................................62
2.1.3 INSERTIONOFSYNTHESISEDFL-LCRHGENEINTOANEXPRESSIONVECTOR......................................62
2.1.3.1 Restrictiondigestoffl-LcrHgene.................................................................................63
2.1.3.2 PurificationofDNAfromanAgaroseGel....................................................................64
2.1.3.3 Ligation........................................................................................................................64
2.1.3.4 TransformationusingElectro-competentcells............................................................64
2.1.3.5 ConfirmationofDNAClones........................................................................................65
2.1.4 SYNTHESIS&INSERTIONOFTRUNCATEDLCRH(TR-LCRH)GENEININTOPTRC-GSTVECTOR.............65
2.1.5 SYNTHESISOFLE65MUTANTOFTR-LCRH...............................................................................66
2.1.5.1 SiteDirectedMutagenesis...........................................................................................66
2.2 PROTEINPRODUCTIONANDPURIFICATION............................................................................67
2.2.1PROTEINPRODUCTION............................................................................................................67
2.2.1.1 CellLysisforProteinExtraction...................................................................................68
2.2.1.1.1 CellLysisbySonication.............................................................................................68
2.2.1.1.2 CellLysisbyHomogenisation....................................................................................68
2.2.1.2 PurificationbyAffinityChromatography.....................................................................68
2.2.1.3 BufferSolutions...........................................................................................................69
NAMEOFBUFFER.................................................................................................................69
HIS-TAGWASHBUFFER.........................................................................................................69
HIS-TAGELUTIONBUFFER.....................................................................................................69
GSTWASHBUFFER...............................................................................................................69
GSTELUTIONBUFFER...........................................................................................................69
2.2.1.4 Ni2+AffinitychromatographyandcleavageofHis-taggedproteins.............................69
2.2.1.5 GSTAffinitypurificationandcleavageofGST-taggedproteins...................................70
2.2.1.6 PurificationusingSizeExclusionChromatographybyAKTAFPLC...............................70
2.2.2 PROTEINPURITY..................................................................................................................70
2.2.2.1 MassSpectrometry......................................................................................................71

13
SAMPLEANDMATRIXPREPARATION...................................................................................71
2.2.2.2 SDS-PolyacrylamideGelElectrophoresis.....................................................................71
2.2.3 DETERMINATIONOFPROTEINCONCENTRATION........................................................................71
2.2.4 STORAGEOFPURIFIEDPROTEIN.............................................................................................72
2.3 BIOPHYSICALCHARACTERIZATIONOFLCRHPROTEINS..............................................................72
2.3.1 MULTIMERICSTATEOFLCRHPROTEINSUSINGANALYTICALSIZEEXCLUSIONCHROMATOGRAPHY(SEC)
72
2.3.2 ANALYTICALULTRACENTRIFUGATION(AUC)............................................................................73
2.3.3 DYNAMICLIGHTSCATTERING(DLS).......................................................................................75
2.4 SECONDARYANDTERTIARYSTRUCTURECHARACTERIZATION.....................................................76
2.4.1 CIRCULARDICHROISM(CD)SPECTROSCOPY.............................................................................76
2.4.2 FLUORESCENCESPECTROSCOPY..............................................................................................77
2.5 EQUILIBRIUMSTUDIESFORMEASURINGTHERMODYNAMICSTABILITY.........................................78
2.5.1 GENERALBACKGROUND.......................................................................................................78
2.5.2 EQUIPMENTANDGENERALPROCEDURES................................................................................79
2.5.3 PREPARATIONOFSAMPLESFOREQUILIBRIUMCHEMICALDENATURATION....................................79
2.5.3.1 SamplepreparationforLcrHproteinconcentrations1to12µM...............................80
2.5.3.2 SamplepreparationforLcrHproteinconcentrations25to80µM.............................80
CHAPTER3 GENECONSTRUCTION,PURIFICATIONSTRATEGYANDINITIALBIOPHYSICAL
CHARACTERISATIONOFLCRHPROTEINS..............................................................................81
3.1 INTRODUCTION...............................................................................................................81
3.2 EXPERIMENTALAPPROACHES..............................................................................................81
3.3 RESULTS........................................................................................................................82
3.3.1 FULLLENGTHLCRH(FL-LCRH)GENECONSTRUCTION.................................................................82
3.3.2 PRODUCTIONANDPURIFICATIONOFFULLLENGTHLCRH(FL-LCRH)..............................................83
3.3.3 TRUNCATEDLCRH(TR-LCRH)................................................................................................88
3.3.4 EXPRESSION&PURIFICATIONOFTRUNCATEDLCRH(TR-LCRH)...................................................91
....................................................................................................................................................91
3.3.5 CONSTRUCTIONOFL65ETR-LCRH.........................................................................................92
3.3.6 EXPRESSIONANDPURIFICATIONOFL65ETR-LCRH...................................................................93
3.3.7 INITIALCHARACTERIZATIONOFLCRHCONSTRUCTS....................................................................94
3.3.7.1 Definingbuffer&proteinconcentrationstomaintain“native”oligomericstatesof
LcrHconstructs...........................................................................................................................94

14
3.3.7.2 Far-UVcirculardichroismofnativeLcrHconstructs....................................................97
3.3.8 CONCLUSION......................................................................................................................98
CHAPTER4 OLIGOMERICSTATE,FLEXIBILITYANDTHERMODYNAMICSTABILITYOFLCRH
PROTEINCONSTRUCTS.........................................................................................................99
4.1 INTRODUCTION...............................................................................................................99
4.2 EXPERIMENTALAPPROACHES.............................................................................................99
4.3 RESULTS........................................................................................................................99
4.3.1 OLIGOMERICSTATESOFLCRHUSINGANALYTICALSIZEEXCLUSIONCHROMATOGRAPHY(SEC).........99
4.3.2 DETERMINATIONOFDIMERIZATIONDISSOCIATIONCONSTANT(KD)USINGANALYTICAL
ULTRACENTRIFUGATION(AUC).......................................................................................................102
4.3.2.1 Calculatingpercentageofdimeratagivenproteinconcentration...........................103
4.3.3 LOSSOFLCRH’SΑ-HELICALSTRUCTUREONN-TERMINALDELETION&CONCENTRATIONREDUCTION
……………………………………………………………………………………………………………………………………………..106
4.3.4 EQUILIBRIUMUNFOLDINGANDTHERMODYNAMICSTABILITYOFLCRH.......................................107
4.3.4.1 TheBestStructuralProbetoMonitorChemicalDenaturation..................................107
4.3.4.2 Determiningthemostsuitablechemicaldenaturant................................................111
4.3.4.3 MinimumEquilibrationTimeforEquilibriumChemicalDenaturation......................114
4.3.4.4 TheReversibilityofEquilibriumUnfolding................................................................115
4.3.5 EQUILIBRIUMCHEMICALDENATURATIONOFLCRH’SPROTEINCONSTRUCTS...............................116
4.3.5.1 BiphasicDenaturationsShowLcrHUnfoldsviaPartiallyFoldedDimericIntermediate
118
4.3.5.2 DeletionofN-terminusCausesNoChangeinEquilibriumUnfolding........................122
4.3.6 THERMODYNAMICSTABILITYOFLCRH...................................................................................122
4.3.6.1 Dataanalysis..............................................................................................................123
4.3.6.2 Proposedequilibriumunfoldingpathway:................................................................126
4.3.6.3 ThermodynamicStabilityofMonomericvsDimericLcrH..........................................127
4.3.7 CONCLUSION....................................................................................................................129
CHAPTER5 CONCLUSIONS...............................................................................................130
5.1 FUTUREWORK..............................................................................................................133
CHAPTER6 BIBLIOGRAPHY..............................................................................................134

15

16
Chapter1 IntroductionLifeonearthcanbecategorisedinnumerousways.Onemethodclassifiesthediverse
array of organisms on our planet through their biochemical characteristics. This
methoddividesorganismsintothreedistinctgroupscalleddomains:
(i) Eukarya (eukaryotes) – Eukarya consist of all macroscopic organisms
includinghumanbeingsaswellasmanymicroscopic,unicellularorganisms
such as yeast. The most important characteristic of eukaryotes is the
presenceofawell-definednucleuswithineachcell.
(ii) Bacteria – These are unicellular organisms lacking a nucleus, and are
referred to asprokaryotes.They constitute a large domain of prokaryotic
microorganisms. Bacteria were among the first life forms to appear on
Earth,andarepresentinmostofitshabitats.
(iii) Archaea – Carl Woese first discovered these organisms in 1977 and
classified them as prokaryotes as they were bacteria-like. However, they
are biochemically quite distinct from bacteria. These distinctions include:
archaeahavecellmembranecontainingether linkages,cellwalls that lack
peptidoglycan and have genes and enzymes that behave more like
eukaryotes.Thustheywerereclassifiedasadomainoftheirown[1-3].
Thisthesisisconcernedwiththebiochemicalmethodsemployedbycertainbacteriato
surviveinandaroundhighermulticellularorganisms(humans).
1.1 Symbiosis,Pathogenesis&CommensalismTherearethreedistincttypesofrelationshipbetweenbacteriaandhighermulticellular
organisms. They can live in symbiosis, as commensals or as pathogens. Symbiosis
occurswhentwoorganismsobtainamutuallybeneficialrelationshipwithoneanother
[4-6]. For example,many bacteria are vital for themaintenance of homeostasis in
higher organisms. The human gut hosts an estimated 500-1000 species of bacteria
[1,3,7,8]. Here, the human intestine provides nutrients to the resident bacteria,
whereasbacteriahelpinthedigestionoffood,absorptionofnutrients,productionof
vitamins such as biotin and vitamin K, regulation of the immune system, and
preventionofcolonizationofpathogenicmicroorganisms[4,6,9].
17
Incontrast,pathogenesisoccurswhenoneorganismgainsadvantagetothedetriment
of the other. Bacteria are another excellent example of this interaction,withmany
attacking higher organisms by damaging cell tissues in the search for nutrients. For
example,Yersinia pestis is the causative agent of bubonic plague andmanyShigella
speciescausedysentery[7,8,10].
In between the two extremes of symbiosis and pathogenesis lie commensals.
Commensalism is an association between two different species where one enjoys
benefitandtheotherisnotsignificantlyaffected[9,11].Commensalbacteriaarefound
onallanimalbodysurfacesaspartofnormalmicrobialflora.However,underspecific
conditionssuchcommensalscanturnpathogenicandexertpathologiceffectsonthe
hostorganism[10,12].Forexample,Staphylococcusaureusnormallycoloniseshuman
skinwithoutcausinganyharm.Howeveriftheepidermisoftheskinisbrokentheycan
cause skin infection and more serious complaints. Recently, there has been an
emergence of antibiotic resistant forms of S. aureus (MRSA: Methicillin resistant S.
aureus),makingitasignificanthealthrisk[11,13].
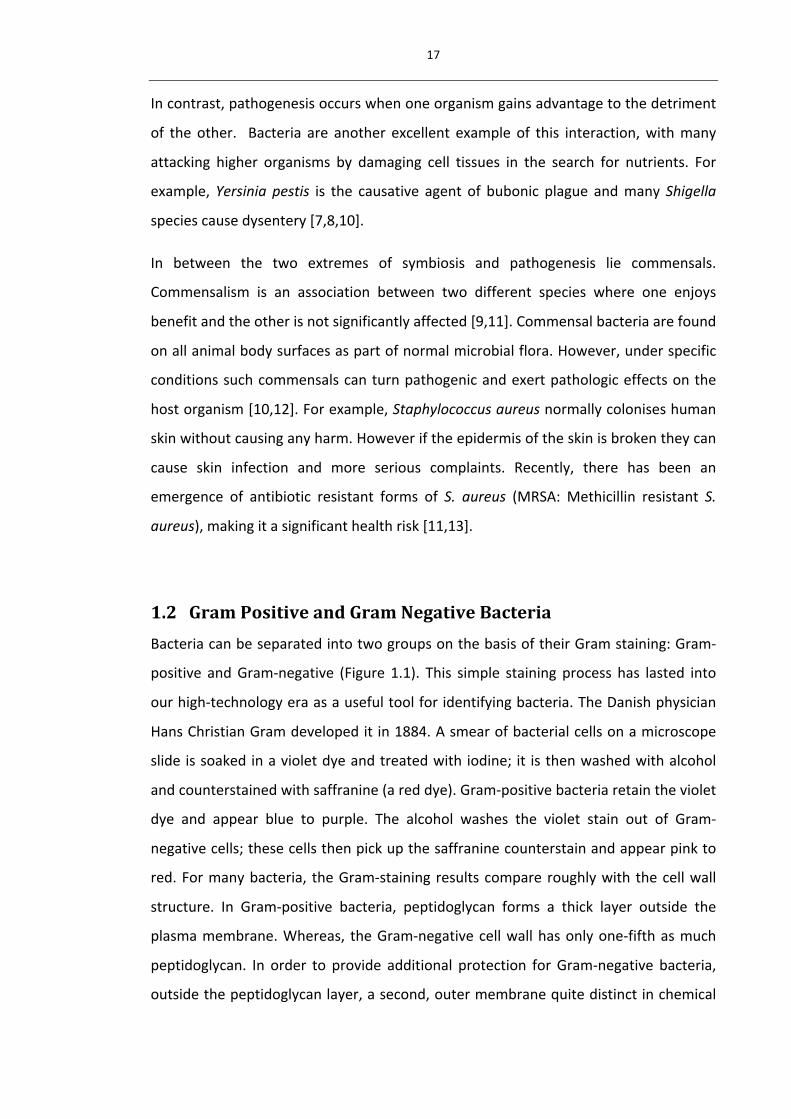
1.2 GramPositiveandGramNegativeBacteriaBacteriacanbeseparatedintotwogroupsonthebasisoftheirGramstaining:Gram-
positive andGram-negative (Figure 1.1). This simple staining process has lasted into
ourhigh-technologyeraasausefultoolforidentifyingbacteria.TheDanishphysician
HansChristianGramdevelopedit in1884.Asmearofbacterialcellsonamicroscope
slide issoakedinavioletdyeandtreatedwith iodine; it isthenwashedwithalcohol
andcounterstainedwithsaffranine(areddye).Gram-positivebacteriaretaintheviolet
dye and appear blue to purple. The alcohol washes the violet stain out of Gram-
negativecells;thesecellsthenpickupthesaffraninecounterstainandappearpinkto
red.Formanybacteria, theGram-staining resultscompareroughlywith thecellwall
structure. In Gram-positive bacteria, peptidoglycan forms a thick layer outside the
plasmamembrane.Whereas, theGram-negativecellwallhasonlyone-fifthasmuch
peptidoglycan. In order to provide additional protection forGram-negative bacteria,
outsidethepeptidoglycanlayer,asecond,outermembranequitedistinctinchemical

18
makeupfromtheplasmamembranesurroundsthecell.Betweentheinnerandouter
membranesofGram-negativebacteria is anadditionalperiplasmic space. This space
containsenzymes important indigesting specificmolecules, transportingothers, and
detectingchemicalgradientsintheenvironment[2,12].
Interestingly, common causes of infections are Gram-negative bacterial pathogens.
The prevalence and the rate of resistance among these pathogens to existing anti-
microbialagentsisontherise[12,13].Thepathogenicityofgram-negativebacteriais
often associated with the lipopolysaccharide (LPS) layer present in the outer
membrane. The chemical structure of the LPS layer is often unique to particular
bacterial strains (i.e. sub-species) and is responsible for many of the antigenic
propertiesofthesestrains[2,14].
Figure 1.1 Gram staining and the bacterial cell wall: when treated with Gram stain, the cell wallcomponentsofdifferentbacteria react inoneof twoways. (a)Grampositivebacteriahavea thickpeptidoglycan cell wall that retains the violet dye and appears blue or purple. (b) Gram negativebacteria have a thin peptidoglycan layer that does not retain the violet dye, but picks up thecounterstainandappearspink-red.Figurewastakenfrom[12,15].
1.3 ProteinsecretionbybacteriaThe cytoplasm of the bacterial cell is isolated from the external environment by a
phospholipid bilayer termed as the plasmamembrane. In order to interactwith the
environmentandfor itssustenance itbecomesessential for thebacteriumtoexport

19
elementsfromitscytosoltotheexternalmilieuandviceversa.Untilthe1960s,protein
secretionacrossthebacterialmembranewasthoughttobeararephenomenon.Itwas
believed that secretionoccurred in a protein specificmanner [14,16]. This viewwas
dismissedfollowingthediscoveryofnumeroussystemsdedicatedtothetransportof
proteins across the plasma membrane. Furthermore, in the case of Gram-negative
bacteria, proteins are transported through the periplasm and the outermembrane.
These secretory systems export proteins either to be attached outside the bacterial
cell surface, released into the external environment, or in some cases even directly
intothecytoplasmofothercells.
1.3.1 SecretionthroughtheinnermembraneThefirstchallengefacedbyabacterialcell isthetransportationofproteinmolecules
across the inner plasma membrane, irrespective of whether it a Gram-positive or
Gram-negativebacteria.Proteinmolecules travel across thisbarrierwith thehelpof
membrane embedded protein transport systems. These proteins then enter the
periplasm or they get inserted into the membrane. There is a remarkable array of
protein transport systems found in bacteria, of which three are present in most
bacterial species: The Sec (general secretory pathway or GSP), signal recognition
particle(SRP)andtwin-argininetranslocation(Tat)pathways[15,17].
1.3.1.1 TheSecPathway
The Sec pathway is formed by the interaction of a numerous proteins, which are
conservedbothinprokaryotesandeukaryotes(knownastheSec61complex,whereit
transports proteins across the endoplasmic reticulum [16,18]. In particular, the Sec
system is involved in the secretion of unfolded proteins across the cytoplasmic
membraneand the insertionofmembraneproteins into the cytoplasmicmembrane
[17,19].Toperformthetransport, threeproteinsSecY,SecE&SecG(SecYEG) forma
heterotrimericintegralmembranecomplex.SecAisthenrecruitedtothecomplex,by
bindingtoSecYonthebacterialcytoplasmicside.SecAhasATPaseactivityandactsas
a motor to drive secretion [18,20]. SecB binds the protein requiring transport and
delivers it toSecA.Oncebound toSecA,ATP isused to release thecargoofSecB to
SecAandtranslocatethecargothroughthemembrane[19,21-23].

20
1.3.1.2 SignalRecognitionParticle(SRP)
TheSRPisverysimilartotheSecpathway,inasmuchastheyusethesamecomplex
SecY,SecE,SecG(SecYEG).HoweveritdoesnotuseSecAandSecBtodrivesecretionor
recruit cargo. Instead the SRPmolecule is recruited to the ribosome to bind newly
formedproteinsthatneedtobemembraneboundbyribosome-nascentchain(RNC)
complex [20,24]. The SRP+RNC complex then targets the protein SRP receptor FtsY
whichinturndirectsittotheSecYEGmachinery[21-23,25].
1.3.1.3 TheTatSystem
TheSecpathwayistheuniversallyconservedpathwayinprokaryotes.However,there
also exists the Tat pathway. This system is found in some bacteria and has been
identified as essential inonly a feworganisms.Nevertheless, theTat systemplays a
significantroleinsomecellularprocessessuchasironandphosphateacquisitioninE.
coli and Salmonella spp. The Sec pathway is employed for the transportation of
unstructured proteins across the bacterial plasma membrane. In contrast, the Tat
pathwayisusedforthetransportationoffoldedproteins. Proteinsare identifiedfor
transportthroughtheTatsystemviaasignalpeptidecontainingatwinargininerepeat
motif[24,26].
The Tat system comprises of two innermembrane integrated subunits i.e. TatA and
TatC. In somebacterial systems, therearemultiple copiesof componentsof theTat
system.Forexample,Bacillussubtilishastwocopiesof tatCandthreecopiesoftatA
[25,27]whilstafeworganismssuchasE.coliemployanadditionalproteinTatB.
1.3.2 Gram-negativeBacterialSecretionSystemsSecretion across the outermembrane is a process specifically undertaken by Gram-
negativebacteria.InordertoachievethistaskGram-negativebacteriahaveevolveda
series of mechanisms which allow them to either export proteins as a two-step
process,exploitingoneofthemethodsmentionedabovetoexporttheproteinacross
theinnermembrane,orasaonestepprocess,wheretheproteinisexportedfromthe
cytosol to outside of the cell without any intermediate steps. The mechanisms
availabletoaccomplishthistaskarenamed,inasimplenumericalmanner.Thereare

21
atpresentsixmajorsystemsthatarewelldescribed:thetypeI-VIsecretionsystems.
Thefollowingsectionsbrieflydescribeeachofthosesystems.
1.3.2.1 TypeISecretionSystem(T1SS)
Type-I secretions systems (T1SS) allow for the movement of proteins from the
cytoplasmtooutsideofthecellinaone-stepmanner,utilisingasimplesystemofjust
threeproteins.ThesethreeproteinsareanATP-bindingcassette(ABC)transporter,a
membranefusionprotein(MFP)andanoutermembraneporeformingprotein(OMP)
[26-28] (see Figure 1.2). The ABC protein consists of a cytoplasmically located
nucleotidebindingdomain,andatransmembranedomainproducedfromsixα-helices
[27,29].ABCproteinscharacteristicallyfunctionashomodimersortrimersinproducing
a functional pore through which the secreted protein can pass through [27,28,30].
Additionally, ABC protein provides substrate specificity to the secretion machinery
[29,31]. The MFPs interact in a trimeric fashion with the ABC proteins in order to
createaperiplasmicchannelthroughwhichthesecretedproteincantraverse[30,32].
It has been suggested that the binding of substrates to the ABC protein leads to a
conformational change in theMFP, such that it interactswith theOMP to complete
the channel to the external environment [31,33].However, the exactmechanismof
thisinteractionremainsunclear[32,34].TheOMP,ascharacterisedbytheTolCprotein
fromE.coliexistsasatrimeranchoredintheoutermembranebyaβ-barrelstructure
[26,33]. It has been shown that the ABC and OM proteins can interact together
directly,althoughthisinteractioninvivorequiresthepresenceoftheMFP[34-37].
There are awide variety of proteins exported by T1SSmachinery, from enzymes to
toxins and adhesins [26]. Proteins secreted by T1SSs contain a C-terminal secretion
system,mostcommonly intheterminal15-30aminoacids[35-39], implyingthatthe
molecule must be secreted in a post-translational fashion. There is no specific
consensusforthissignalsequence,althoughitwouldseemthatthereisapreference
towardscertainaminoacids(LDAVTSIF)[26,40,41].

22
Figure1.2SchematicrepresentationoftheTypeISecretionSystem(T1SS).Thepositionoftheinnermembrane (IM),periplasm (PP),outermembrane (OM)and themajor componentsof theT1SSareshown:ABC–ATPBindingCasette(showninred),MFP–MembraneFusionProtein(showninblue),OMP–OuterMembraneProtein.ThestructureofOMPisthatofTolC(PDBentry1EK9).Theprocessdisplays the secreted substrate molecule (shown in yellow) binding to the ABC, which causes aconformational change in theMFP leading to its interactionwith theOMP. The secreted substratemoleculeisthensubsequentlytranslocatedtotheextracellularmilieu.
1.3.2.2 TypeIISecretionSystem(T2SS)Compared to the T1SSs, type II secretion systems (T2SSs) are considerably more
complexandarecommonlyemployedinGram-negativebacteriasuchasYersiniaspp
andKlebsiellaspp.InordertoexportproteinsthroughtheplasmamembranetheSec
orTatpathways isemployed. Once intheperiplasm,theprotein is traffickedacross
the outermembrane using the T2SS. T2SSs employ 12 to 16 proteins for enabling
secretionoffoldedproteinsthroughtheoutermembrane.Perhapssurprisinglythough
onlyacoupleoftheseareactuallylocatedintheoutermembrane[38,39,42,43].The
majority of the proteins are located in the plasmamembrane or in the periplasmic
space (see Figure 1.3). For the T2SS, the general secretory pathway (Gsp)
nomenclatureisused,followedbyacapitalletter.

23
The cytoplasmic protein GspE is a hexameric ATPase, providing energy to drive the
exportofproteins[38,40,41].GspEinteractswiththeinnermembraneplatform.This
is composed of 4 core proteins (GspC, F, L andM)which anchor the ATPase to the
pseudopilusapparatus[39,42-45].Thepseudopilusiscomposedof5proteinstermed
pseudopilins.Thepseudopilinsthemselvesareagroupofproteins(GspG-K)thatcome
togethertoformalargemultimericstructurecalledthepseudopilus.Thebaseofthe
pseudopilus is in the periplasm and interactswith the plasmamembrane. Based on
evidencefromseveralexperimentsithasbeenhypothesisedthatthepilusmaygrow
in order to push secreted molecules through the outer membrane complex, or
alternatively as a cork to close off the outermembrane channelwhen not required
[38,46].
The outer membrane complex of T2SS consists of two components, (i) the pore
formingproteinGspD,whichexistsasamultimerof12-14copiesformingaporeinthe
outer membrane, and (ii) a lipoprotein GspS known as the ‘’pilotin’’, stabilises the
GspDmultimer in the outer membrane [44,45,47-49]. The pore formed by GspD is
about 95 Å in diameter, a size large enough for proteins to pass through the T2SS
assemblyinafoldedstate[46,50,51].

24
Figure1.3SchematicrepresentationoftheType2SecretionSystem(T2SS).Thepositionoftheinnermembrane (IM),periplasm (PP),outermembrane (OM)and themajor componentsof theT2SSareshown.ThecytoplasmichexamericATPaseGspE (shown inblue)providesenergy forproteinexportandinteractswiththeinnermembraneplatformcomposedofGspF,GspL,GsMandGspC(showninred, lightblue,purpleanddarkblue respectively). The innermembraneplatformanchors theGspEhexamertothepseudopilin(showninyellow)comprisingofGspG-Kwhichlinkstotheporeformingmultimeric protein GspD (shown in light orange) in the outermembrane. GspS (shown in orange)stabilises theGspDmultimer in theOM. The protein (shown as orange, rounded rectangle) is firsttransported from bacterial cytoplasm to periplasm using the Sec pathway (shown in green) andtraffickedacrosstheOMusingtheT2SSassembly.
1.3.2.3 TypeIIISecretionSystem(T3SS)
The type III secretion system (T3SS) is found inGram-negativebacteria that interact
withbothplantsandanimalhosts,eitheraspathogensorsymbionts [47-49,52].The
primaryfunctionoftheT3SSmachinerytermedasthe‘’injectisome’’isthedeliveryof
effector proteins across the bacterial and host membranes into the cytosol of host
cells to hijack host cell functions, including immune and defence responses [50-52].
ThisthesisisbasedontheT3SSofpathogenicYersiniapestisandisdescribedindetail
insection1.3.3.

25
1.3.2.4 TypeIVSecretionSystem(T4SS)
Incomparisontoothersecretionsystems,theT4SS(Figure 1.4)isuniqueinitsability
to transport a wide range of substrates such as single peptide molecules, protein-
proteincomplexesandprotein-DNAcomplexes.Furthermore,theT4SSisemployedin
theinfectionofawiderangeofhostsrangingfromhighereukaryotessuchasanimal
andplantcells,toyeastandprokaryotes[52].ManybacteriahavehomologoustypeIV
secretion systems, including the pathogensAgrobacterium tumefaciens (VirB/D4),
Helicobacter pylori (CAG/ComB) and Pseudomonas aeruginosa(TraS/TraB)[52,53].
AlthoughT4SSshavegarneredattentionbecauseoftheirsignificanceinpathogenesis,
itisimportanttopointoutthatnotallpathogenicbacteriahaveaT4SS.
Thereare several subclassesofT4SS,however themajorityof thework todate,has
focused on Agrobacterium tumefaciens. The VirB system fromA. tumefaciensis
capable of exportingDNA-protein complex from its Ti plasmid into thehost [52,54].
Here,VirB4,VirB11andVirD4are cytoplasmicATPases that generate theenergy for
thesystem,drivingcomplexassemblyfollowedbysubstratetranslocation. VirB1isa
lytic transglycosylase responsible for making holes in the peptidoglycan layer thus
allowing the formation of the protein channel [53,55]. VirB6-10 form a scaffold
creating a translocation channel, connecting the plasma membrane to the outer
membrane. This assembly enables the transport of the substrate directly from the
cytoplasm to the extracellular milieu. The channel is a cylindrical structure with a
diameterandlengthof185Åtoallowfortheexportationoffoldedproteinmolecules
[54,56].

26
Figure1.4SchematicrepresentationoftheType4SecretionSystem(T4SS).Theinnermembrane(IM),periplasm (PP), outer membrane (OM) and the major components of the T4SS are shown. Thecytoplasmic proteins VirD4, VirB11 and VirB4 are ATPases providing energy for T4SS assembly andsubstrate translocation. VirB6-10 form a scaffold, spanning the bacterial cytoplasm to theextracellularmilieu,creatingatranslocationchannelforthesubstrate.VirB7andVirB9togetherformtheporeintheOMforsubstratetranslocation.VirB2assemblyformsthepilusconnectingtheIMtotheOM.VirB3andVirB5interactwiththepilus.VirB1makesholesinthepeptidoglycanlayerallowingT4SSproteinassembly. Substrate (shown inorange, rounded rectangle) is translocatedeitherusingthe Sec-pathway from cytoplasm to the PP and then the extracellular milieu or directly fromcytoplasmtotheexternalenvironmentusingtheT4SS.
1.3.2.5 TypeVSecretionSystem(T5SS)
The type five secretion system (T5SS) (Figure 1.5) is typically referred to as the
autotransportersystemandischaracterisedbytherequirementofSECmachineryand
aβ-barreldomain[14,55,57-59].Theprocessoftransportfromtheplasmamembrane
to the outer membrane can be divided into three sub classes, monomeric
autotransporter system (T5aSS), twopartner secretionpathway (T5bSS)and trimeric
autotransporters(T5cSS)[14,56-59]. TheT5SSservesasapathwayforsecretionofa

27
largenumberofproteinsexceedingthenumberofproteinssecretedbytheT2SS.Over
500 proteins are secreted through the T5aSS class alone. The majority of the T5SS
secreted proteins that have been characterised to date are responsible for the
virulenceofanimalsorhumanpathogenicbacteria[14,57-59].
TheT5SSproteinsareproducedwithanN-terminalsignalpeptide,whichexportsthem
into the periplasm using the Sec pathway. The bacterial proteins secreted via the
T5aSStypicallycompriseanN-terminalpassengerdomainfrom40-400kDainsizeand
aconservedC-terminaldomainwhichformsaβ-barrel[14,57-60].Theβ-barrelisable
to insert into theoutermembraneand isneeded for translocationof thepassenger
domain intotheextracellularmilieu. Insomecases,suchasadhesins,thepassenger
domain remains attached to the β-barrel and the protein remains attached in the
outermembrane.Inothercases,thepassengerdomainiscleavedfromtheβ-barrelto
formatoxinorhydrolyticenzyme.Recently,detailedstructuralstudieshavesuggested
that the barrel is not capable of transporting the passenger domain by itself. It has
been hypothesised that a helper protein, Omp85/YaeT enables the transportation
across the outer membrane [57,59]. Proteins secreted via the T5aSS include IgA
proteasefromNeisseriameningitidisandPertactinfromBordetellapertussis[14,60].
AsecondclassofproteinssecretedviatheT5SSiscalledT5bSSproteins.Incontrastto
T5aSS, the passenger and translocator functions in T5bSS are located on separate
polypeptide chains. T5bSS contains a pair of proteins in which one of the proteins
carries the β-barrel domain, and the other is the secreted protein (passenger
polypeptide). This process is called two partner secretion (TPS) [57,61]. The
mechanismof transport of the passenger polypeptide of the T5bSS is similar to the
passengerdomaintransportinT5aSS.T5bSS(TPS)secretedproteinsincludeadhesins
suchasHecA/HecBoftheplantpathogenDickeyadadantii(Erwiniachrysanthemii)and
cytolysinssuchasShlA/ShlBofSerratiamarcescens[14,62].
The third sub-class of T5SS proteins, called T5cSS are trimeric autotransporters, in
whichasingleβ-barrelisformedbycontributionsfromeachofthethreemonomeric
subunits. In contrast to the monomeric T5aSS, they are usually adhesins and don’t
exhibitenzymatic function.However, themethodof transportationof thepassenger

28
domain is identical to that in T5aSS. An example of T5cSS protein is YadA,
theYersiniaadhesinAofYersiniaenterocolitica[61,63-68].
Figure 1.5 Schematic representation of the Type 5 Secretion System (T5SS). Innermembrane (IM),periplasm (PP), outer membrane (OM) and the major components of the T5SS are shown. Thesecretionpathwayofthemonomericautotransportersystem(T5aSS) isdepictedatthebottomleft,thetwo-partnersystem(T5bSS)isdisplayedinthecentre,andthetrimericautotransporters(T5cSS)isshownontheright.Thefourfunctionaldomainsoftheproteinsareshown:thesignalsequence,thepassengerdomain,thelinkerregion,andtheβ-domain.TheautotransporterproteinsaresynthesisedandexportedthroughthecytoplasmacrosstheIMviatheSecmachinery.Once,throughtheIM,thesignalsequenceiscleavedandtheβ-domaininsertsintotheOMinaβ-barrelstructureformingaporeintheOM.ThepassengerdomaintheninsertsintotheporeandistranlocatedacrosstheOMtotheextracellularmilieu.
1.3.2.6 TypeVISecretionSystem
The type VI secretion system (T6SS) is the most recently identified Gram-negative
bacterial secretion system. The name T6SS was first coined in 2006, when it was
identifiedinVibriocholera[62,69-71].T6SSishighlyconservedandisfoundinnearly
25%ofallGram-negativebacteria suchasPseudomonas,Escherichia,Agrobacterium

29
and Helicobacter spp. [63-68,72]. It is a large complex composed of 13 core
componentsthatspanfromthecytoplasm,totheextracellularmilieuandthetarget
cell. Theseproteinscollectivelyassembleastructurereminiscentofanupside-down
bacteriophage-likestructureanchored to thebacterial cellenvelope [69-71,73].T6SS
machinery is capable of delivering effector proteins directly into the host cell
cytoplasminasingle-step,independentoftheSecandTatpathways[72,74].
TheT6SScorecomponentscanbegroupedintothebaseplatecomplex,sheath,tube
andspike.InbothV.cholereaandP.aeruginosa,thebaseplatecomplexcomprisesof
TssE(typesixsubunitE),TssF,TssG,TssJ,TssK,TssL,TssMandTssA.TssEFGarelocated
inthecytosolicsideofthebacterialinnermembraneandincloseproximitytothetube
complex[73,75-77].TssLisanchoredintheinnerbacterialmembrane,TssMisbound
to the inner membrane and extends outwards interacting with TssJ, an outer
membranelipoprotein[74,78].TherolesofTssF,TssGandTssAareunclearalthough
theyareuniversallyconserved[73,75-77].Theformationofthebaseplateassemblyis
followedby thehaemolysincoregulatedprotein (Hcp) tube formation.TheHcp tube
undergoes polymerisation and emerges from the base plate complex spanning the
bacterial cytosol to the extracellular milieu [78,79]. Then the VipA/VipB sheath
polymerises around the growing Hcp tube. TssK is an essential cytoplasmic protein,
whichinteractswithmembraneboundTssJ-TssL-TssMcomplexaswellasthetubeand
sheathcomponentsoftheT6SS[73].Analogoustophage,aconformationalchangein
thesheathstructurecausescontraction.ThispropelstheHcptubeoutofthecelland
across the target cell membrane. This contraction event enables the delivery of
effectors loaded onto the VgrG (valine-glycine repeat G)/PAAR (proline-alanine-
alanine-argininemotifcontainingproteins)spikecomplexorthedistalendoftheHcp
tube[79,80].ThecontractionprocessdisassemblestheunsheathedHcptube;partsof
the tube that are not expelled from the cell are recycled within the cytosol. The
contractedsheath isremodelledbytheATPaseactivityofClpV,restoringthepoolof
available sheath subunits. Sheath components VipA/VipB interact with ClpV that is
associated with the baseplate components in the bacterial cytosol. The naked
baseplate complex is then either recycled or disassembled, depending on the

30
requirement and activation state of the T6SS [7,73]. The T6SS assembly is shown in
Figure 1.6.
Figure1.6SchematicrepresentationoftheType6SecretionSystem(T6SS).Theinnermembrane(IM),periplasm (PP), outer membrane (OM) and the major components of the T6SS are shown. Thecomponents of the base plate complex: TssEFG are located on the cytosolic side of the IM, TssL isanchored in the IM, TssM is bound to the IMandextends to theOMand interactswith TssJ, TssKinteracts with membrane bound TssJLM complex, and sheath and tube components. The tube isformed ofHcp polymer, emerging from the base plate spanning the cytoplasm to the extracellularmilieu. The sheath is composed of VipA/VipB which polymerises around the growing Hcp tube.ConformationchangeinsheathcomponentscausescontractionofHcptubecausingthepropulsionofthespikecomplexofVgrG/PAAR locatedat the tipof theHcptubealongwith the loadedeffectorsintothetargetcellintheextracellularmilieu.ATPaseClpVremodelsthesheath,recyclesthetubeanddrivesthetranslocationofeffectorsandVgrG/PAARspikecomplexthroughtheT6SSmachinery.

31
1.3.3 TypeThreeSecretionSysteminDetailPathogenic Yersinia species cause human diseases ranging from relatively mild
intestinal disease for Yersinia enterocolitca [80-84] to bubonic plague for Yersinia
pestis [7,85]. Despite the differences in disease, virulence of the Yersinia species is
caused by a conserved type three secretion system (T3SS), which is now a well-
establishedmodel system for this formof protein secretion. Although the T3SSwas
first discovered in Yersinia pestis, it is a conserved virulence factor amongst other
humanpathogens suchasenteropathogenicEscherichiacoli (EPEC),Salmonella spp.,
Pseudomonas aeruginosa, Shigella flexneri, and Chlamydia spp. [81-84,86]. These
pathogenic bacteria collectively cause numerous fatalities and significant healthcare
costsannually[85,87-90].
T3SS uses amolecular syringe for the delivery of cytotoxic effectors into eukaryotic
host cells. Theseeffectors influenceandmanipulatediverse cellularpathways in the
eukaryotichostforthesurvivalandproliferationofthepathogenbyeitherrepressing
the inflammatory response or altering phagocytosis [83,86,90]. Interfering with the
deliveryofeffectorscouldhavesubstantialconsequencesondiseasepathology.Since
thisvirulencemechanism isconserved innumerouspathogenicbacteria, itmakesan
attractivetargetfornoveltherapeutics.
InYersiniaspp.,thegenesofT3SSare locatedona70kbvirulenceplasmid,andthe
expressionofgenesinvitroisdependentontemperatureandcalciumconcentration,a
phenomenon called the low calcium response (LCR) [87-92]. T3SS genes are not
expressed at ambient temperature. However, upon increasing the temperature of
Yersinia cultures from 26°C to 37°C in the presence ofmillimolar concentrations of
calcium, conditions representing themammalian host, T3SS genes are expressed at
low levels and the molecular machinery known as the ‘’injectisome’’ is assembled
[90,92-94].
The ‘’injectisome’’ comprises several components that canbebrokendown into the
variousunits: (i) thebasalbodywhich is composedof the innermembranering, the
scaffoldproteins,theoutermembranering,theexportapparatus,theATPasecomplex
and the C ring; (ii) the needle which is an extension from the basal body into the

32
extracellularmilieuand(iii)theporecomplexalsoknownasthe‘’translocon’’whichis
formedinthemembraneofthetarget(Figure1.7).
Figure1.7SchematicrepresentationoftheType3SecretionSystem(T3SS).Theinnermembrane(IM),periplasm (PP), outermembrane (OM), the host cellmembrane and themajor components of theT3SSareshown:basalbody,needleandporecomplex.ThebasalbodycomprisesofYscC,YscD,YscJwhichformaplatformfortheassemblyofYscQ,YscRSTUVandthecomplexYscNLKofwhichYscNisthe ATPase powering the secretion of substrates. The needle comprises of YscI which forms a rodthrough which YscF is secreted and forms the needle. The pore complex is formed by thepolymerisation of LcrV at the distal end of YscF forming a pentameric tip and complexes withtranslocators YopB and YopD which then insert into host cell membrane creating a pore or‘’translocon’’.TheclassIIchaperoneLcrH(showninyellow)isdepictedasbindingtoYopBandYopDbeforebeingchanneledacross theT3SSassembly.ThecargoofYopB/D is thenreleasedwhichgetsinsertedintothehostcellmembraneformingapore.

33
THEBASALBODY
AssemblyoftheT3SSisdrivenbytheformationofthebasalbodywhichisinitiatedby
the oligomerisation of YscC on the periplasmic side of the outer membrane and is
termedtheoutermembranering(OM)[91,92,95,96]Next,aringofYscDisassembled
intheinnermembraneandisthoughttoconnecttheinnerandoutermembranerings
[92-94,97]. YscD then binds to YscJ, which oligomerises to complete the inner
membrane (MS) ring [92,93,95,96,98-104].Theassemblyof these structures formsa
basic channel through the bacterial envelope, which serves as a platform for the
assemblyoftheremaininginjectisomecomponents.
OnthecytosolicfaceofthebasalbodyistheC-ring.ThisiscomposedofYscQ,which
colocalises with YscC in the outer membrane stabilising the whole assembly.
Additionally,acomplexcomposedofYscN,YscLandYscKisformedandinteractswith
theC-ring.YscNistheATPasethatpowersthesecretionofsubstratesbytheT3SS,YscL
is a negative regulator of ATPase activity, while the function of YscK is unknown
[97,105].
The next to follow is the assembly of the export apparatus composed of integral
membrane proteins YscRSTUV [93,98-104,106-110] within the inner membrane,
independently of the scaffold proteins. The pathways for assembly converge at this
point with the recruitment of the export apparatus to YscJ in the MS ring of the
scaffold [105,111,112]. The formation of the fully functional basal body is achieved
with the amalgamation of the scaffold, ATPase complex and export apparatus. The
basalbodyisnowcapableofexportingsecretionsubstrates.
THENEEDLEANDTHE‘’EARLYSTAGE’’
Oncompletionofthebasalbody,YscIintegratesintotheinnermembraneandforms
the rod that allows substrate transport across the inner membrane. This stage is
referred to as the ‘’early’’ stage because only ‘’early’’ substrates are translocated.
Theseincludethefirstproteinstobesecreted:YscIFPXOandYopR[106-110,113-116].
The needle protein YscF is secreted through the YscI rod into the periplasmic space

34
allowingsubstratetransportacrosstheinnermembrane[111,112,117,118].YscFthen
undergoes polymerisation to form the needle, which extends ~41 nm from the
bacteriumY.pestisor~58nmfromY.enterocolitica.Theneedlehasanouterdiameter
of~6-7nmandaninnerdiameterof~2-3nm[97,113-116].
YscPXOandYopRarenot shown in thediagrambuthavea regulatory role. Indeed,
YscP is required to control the needle length while YopR is important in the early
stagesofneedleassembly,thoughitsexactroleisnotclear[117,118].Likewise,YscX
andYscOareessentialforthesecretionofearlysubstratesbutarenotsecretedfrom
thebacteriumuntilneedleassembly iscomplete [97,119]. YscY is thoughttobethe
chaperone for YscX secretion [2,106] and YscY has also been shown to bind to
SycD/LcrH,which is the chaperone for facilitating secretionof themiddle substrates
YopBandYopD.TheroleofthechaperonessuchasLcrHiscoveredmoreextensively
below.
THEMIDDLESTAGEANDTRANSLOCONASSEMBLY
Thesecretionof translocatorsLcrV,YopBandD into theextracellularmilieu initiates
themiddlestage.LcrVpolymerisesatthedistalendofYscFformingapentamerictip
ontheneedlecomplex[119,120].YopBandYopDcomplexwithLcrVattheneedletip
andareinsertedintothehostcellmembranecreatingapore. This largeassemblyis
termedtheporecomplexor‘’translocon’’. Thisisthekeystepinthecreationofthe
T3SS as organisms inwhich the translocon formation is impeded are rendered non-
lethalinvivo[120,121].
Oncethetranslocon is formed,Yopsaredeliveredthroughthecomplexandthe late
stage, involving the delivery of effector proteins such as YopN and TyeA begins
[121,122]. Here, immune supressing proteins andmolecules targetingmacrophages
arereleasedandtheprocessofinfectionbegins[122,123]

35
Table 1.1 Secretion Systems of Gram-negative bacteria describing their subunitcomposition,functionalcharacteristicsandcitations.
Secretion
SystemCompositionofsubunits FunctionalCharacteristics Citations
T1SS ATP Binding Cassette (ABC)
transporters also known as Inner
Membrane Component (IMC)
located inthe innermembrane.e.g.
AcrBinE.coli
ABC is an ATPase. It supplies
energyfortransportofvarietyof
substrates such as ions and
macromolecules.
AcrB -
[123,124],
PDB:4CDI
Membrane Fusion Protein (MFP)
locatedintheperiplasm.e.g.AcrAin
E.coli.
MFP interacts with the OMP to
complete the channel to the
external milieu for export of
variouscompounds.
AcrA -
[124,125],
PDB:2F1M
Outer Membrane Pore forming
protein (OMP) is anchored in the
outer membrane by a β-barrel
structure.e.g.TolCinE.coli
OMP forms an exit duct for
diverse molecules like protein
toxinsandantibacterialdrugs.
TolC -
[125,126],
PDB:2XMN

36
Secretion
SystemComposition Function Citations
T2SS Inner Membrane (IM)
platformcomprising four core
proteins: GspC, GspF, GspL
and GspM tightly associated
with cytoplasmic hexameric
ATPaseGspE.
GspE is an ATPase, provides
energytodriveexportofproteins
and interacts with IM platform.
GspC,F,LandManchorGspEto
thepseudopilusapparatus.
GspE - [126,127],
PDB:4KSR.
GspC - [127,128],
PDB:3OSS.
GspF - [128-130],
PDB: 3C1Q. GspL -
[129-131], PDB:
2W7V,2BH1.GspM
- [131,132], PDB:
1UV7.
Periplasmic pseudopilus, a
large multimeric structure
composed of the major
pseudopilin subunitGspG and
minor pseudopilin subunits
GspI,GspJ,GspKandGspH.
Thebaseofpseudopilus is in the
periplasm and interacts with the
plasma membrane. Pilus may
grow in order to push secreted
molecules through the OM
complexorblocktheOMchannel
whennotrequired.
GspG - [132,133],
PDB:3G20.
GspH - [133,134],
PDB:4DQ9.
Gsp I/J/K -
[134,135], PDB:
3CI0.
Outer Membrane (OM)
complex consists of a
dodecameric secretin GspD
and a lipoprotein GspS
(pilotin).
GspD forms a large pore in the
OM for passage of folded
proteins and GspS stabilizes the
GspDmultimerintheOM.
GspD - [135,136],
PDB:3EZJ.
GspS - [136,137],
PDB:3SOL.

37
Secretion
SystemComposition Function Citations
T3SS Basalbody
Scaffoldproteins:YscC,
YscD,YscJ
Export apparatus
proteins: YscR, YscS,
YscT,YscU,YscV.
Cytoplasmic
components: YscQ (C-
ring) and YscN, YscL,
YscK(ATPasecomplex).
YscCformsaringintheOM,actingasscaffold.
YscD & YscJ form a ring in the IM creating a
scaffold.
YscRSTpromotepolymerizationofYscV.YscUis
essential for substrate specificity. YscN is the
ATPaseforsubstratesecretionbyT3SS.YscNis
anegativeregulatorofATPaseactivity.
YscD -
[137,138],
PDB:4D9V
YscU -
[138,139],
PD:2V5G
Theneedle
YscI, YscF, YscP, YscX,
YscOandYopR
YscI forms the rod,
followed by secretion
ofYscFwhichformsthe
needle
YscI forms the rod to allow substrate passage
across the IM. YscF undergoes polymerization
to form the needle for translocation of
substrates. YscP regulates the length of the
needle. YscX and YscO are required for early
substratesecretion.
YscF -
[139,140],
PDB:2P58
YscO - PDB:
4MH6
YopR -
[140,141],
PDB:1Z21
Porecomplex
LcrV (needle tip
complex)
YopB/YopD (translocon
pore)
LcrVassistsYopB/YopDforinsertioninthehost
cellmembrane. YopB/YopD create a pore into
the host cell membrane and form the
transloconfordeliveryofvirulentproteins.
LcrV -
[141,142],
PDB:1R6F
YopD -
[53,142],
PDB:4AM9

38
Secretion
SystemComposition Function Citations
T4SS Inner Membrane (IM)
complex is composed of
three hexameric ATPases
(VirD4, VirB4 and VirB11)
located at the cytoplasmic
sideoftheIM,togetherwith
VirB3,VirB6andVirB8.
VirD4, VirB4 and VirB11
ATPAses provide energy for
substrate transport and T4SS
biogenesis.VirB11assistsVirB4
in pilus biogenesis and
polymerization. VirB8 helps in
theassemblyofthepili.
VirB4 - [53,143], PDB:
4AG5.
VirB11 - [143,144],
PDB: 2GZA. VirB8 -
[144,145],PDB:4AKZ.
Outer membrane (OM)
complex comprises of VirB7,
VirB9andVirB10withVirB10
extendingfromtheIMtothe
OM.
VirB7andVirB9togetherfroma
pore in the OM for substrate
translocation.VirB10formspart
of a scaffold around the
translocation channel for
substrate.
VirB7/VirB9/VirB10 -
[145,146],PDB:3JQO.
VirB9/VirB10 -
[74,146],PDB:3ZBJ
Conjugative pilus is
composed of VirB2 and
VirB5.
VirB2andVirB5formthemajor
andminor subunit of the pilus
respectively,connecting the IM
totheOM.

39
Secretion
SystemComposition Function Citations
T6SS Baseplate complex comprising
TssE (type six subunit E), TssF,
TssG,TssJ,TssK,TssL,TssM,TssA
andClpV(ATPase).TssEFG,TssK,
TssL, ClpV are located on the
cytosolic side of bacterial IM,
TssM is bound to the IM and
extends onto the OM where it
connectstoTssJ.
TssM is bound to the IM and extends
outwards interacting with TssJ. TssK
interactswithmembraneboundTssJLM
complex, the tube and sheath
components. ClpV is an ATPase,
provides energy for
assembly/disassembly of the sheath
andbaseplatecomponents.
TssJ/TssM -
[74,147],
PDB:3RX9
TssL -
[147,148],
PDB:3U66
ClpV -
[148,149],
PDB:3ZRJ
Sheath component: VipA/VipB
(TssB/TssC)
InteractswithClpV inbacterial cytosol,
causes contraction of the growing Hcp
tube and propels the spike complex
loadedwitheffectors.
VipA/VipB -
[79,149],
PDB:3J9G.
Tube component is haemolysin
coregulated protein (Hcp)
hexamer (Hcp1), connecting the
IMwiththeOM.
Virulence factor, transporter of
effectorsandchaperone.
Hcp1 -
[79,150],
PDB:4W64.
SpikecomplexismadeofPAAR-
VgrGproteincomplexandinthe
OM.
Transportation of effectors into the
extracellularmilieu,killingoftargetcell.
PAAR-VgrG
- [150,151],
PDB:4JIV

40
1.3.3.1 TheroleofChaperonesintheT3SS
For efficient export of both hydrophobic translocators and effector proteins specific
chaperonesarerequired.Theyactas ‘’bodyguards’’preventingtheirsubstrates from
generatingprematureornon-specificinteractionswithotherproteinsinthebacterial
cytosol prior to export. Moreover, they can maintain their substrates in a partially
folded state in order to enable their passage through the narrow channel of the
injectisomeandmayalsoplayaroleinsecretionprocess[151-154].Interestingly,the
T3SSchaperones lacktheability tobindandhydrolyseATPunlikeclassicchaperones
likeDnaKorGroEL.T3SSchaperonesaredividedintothreesub-groupsbasedontheir
binding partners and theirmodes of interaction: class I chaperones interactingwith
effector proteins, class II chaperones interacting with the translocators and class III
chaperonesinteractingwithT3SSneedlecomponents[152-155].
1.3.3.2 ClassIChaperones
Class I chaperones are relatively small (~10-15 kDa), acidic (pI 4-5) and generally
displayahomodimericstructurewithaconservedα-βfold(Figure1.8).Theyinteract
withtheircognateeffectorproteinthroughachaperone-bindingdomain(CBD),which
islocatedwithinthefirst100aminoacidsoftheeffectorprotein.Thisisdownstream
from the short amino terminal export signal. They are classified into two categories
based on their interaction with their effectors: class IA chaperone bind a single
effector,whereasclassIBchaperonesbindmultipleeffectors.
Class1Achaperones: Themajorityof the structures solved todate fall intoclass IA.
Theexamples for class IA chaperones are SycE [155,156], SycH [156,157], SycN-YscB
(see Figure 1.8a) [157-159], SycT (see Figure 1.8b) [158-160] from Yersinia spp. and
CesT[160,161]fromenteropathogenicE.coli(EPEC).

41
Figure 1.8 Ribbon representation of the crystal structure of class IA chaperones of the T3SS: (a)heterodimerSycN-YscBfromYersiniapestis(red/magenta,PDBcode1XKP),(b)homodimerSycT(themonomericunitsarecolouredmagentaandredrespectively,PDBcode2BHO).FigurewaspreparedusingPyMOL.
The class I chaperones show low sequence similarity, but possess a conserved 3D
structure and a commonmode of binding. Each of these dimeric chaperones use a
similar fold, where the monomer comprises of three α-helices and a five-stranded
antiparallel β sheet arranged in the order of α-β-β-β-α-β-β-α,where the helices are
positionedononefaceoftheβsheet.Thecentralαhelixandtheloopandβstrand,
whichimmediatelyfollows,areresponsiblefordimerization.Thiscoversahydrophobic
surfaceareaofgenerallyaround2500Å2[156,161-163].TheCBDofeffectorproteins
wrap around chaperone homodimers in an extended, horseshoe like conformation
withsomeα-helicalsecondarystructureorganisation[156,160,162-164].Thepresence
ofhydrophobicsurfacesonthechaperonehomodimersareresponsibleforthebinding
ofthecognateeffectorprotein[156,160,162,164].Agoodexampleofthisinteraction
isSycHanditseffectorYscM2.HerethestableYscM2(33-50)fragmentwrapsaroundthe
homodimeric SycH in an extended fashion. YscM2(33-50) interacts with SycH via a
structured α helix and β strand that dock with the β sheet and helix of the SycH
[156,157](seeFigure1.9).
(a) (b)

42
Figure 1.9Ribbon representationof the crystal structureofYersiniapestisT3SSClass IA chaperoneSycHincomplexwithastablefragmentofitscognateeffectorproteinYscM2(33-50)(PDBcode1TTW).Themonomeric units of SycH are shown in red andmagenta respectively. The effector YscM2(33-50)fragmentisshowningreen.FigurewaspreparedusingPyMOL.
Interestinglytherearedeviationsfromthehomdimericstructuredescribedabove.For
example,thecrystalstructureofclassIAchaperoneSycN-YscBisuniqueamongstthe
class I chaperones because it is a heterodimer [157,161] (see Figure 1.11a). Here,
althoughthetopologyofeachmonomerisconserved,theheterodimericnatureofthe
assembly leads to an asymmetry that does not exist in homodimeric class IA
chaperones. Even though theα2helixofYscB liesparallel to thedimer interface, as
observed in thehomodimers, thecorrespondinghelix inSycN is tiltedand inducesa
shiftofβ4andβ5ofYscB.Thisasymmetryinthedimerinterfacehasadirectinfluence
onthespecificbindingofYscBtoitseffector,YopN[152,161](seeFigure1.10).YopN
containsanN-terminalsecretionsignalfollowedbyachaperone-bindingdomain(CBD)
where its two chaperones, SycNand YscB, bind. The YopNCBDwraps around SycN-
YscBchaperonekeepingYopNpartiallyunfoldedandsecretioncompetent[152,165].

43
Figure 1.10Ribbon representationof the crystal structure ofYersinia pestisT3SSmacromeolecularassemblyofeffectorYopNincomplexwithitsheterodimericclassIAchaperoneSycN-YscB(PDBcode1XKP).SycN,YscBandYopNareshowninred,magentaandgreenrespectively.FigurewaspreparedusingPyMOL.
Class1BChaperones:Asstatedpreviously,classIBchaperonescontrasttotheClass1A
bybindingtomultiplediverseeffectors.Forexample,Spa15fromShigellaflexneriand
InvB from Salmonella enterica (see Figure 1.11a and Figure 1.11b, respectively).
Interestingly, in spite of possessing the ability to bind to various effectors, the
monomersofeachchaperonesharethesameoverallfoldastheclassIAchaperones.
However,themaindifferencelieswiththeorientationofthedimers.Inparticular,the
α2 helices that form the dimeric interface have a different orientation, leading to a
dimer inwhich the subunits are rotated about 30° with respect to each other. The
residuesthatcausethisdifferingshapeandorientationoftheα2helixareconserved
amongotherputative class IB chaperonesand thusdistinguish class IB fromclass IA
chaperones. The change in dimeric shape also changes the orientation of the
hydrophobic pockets that bind the effectors. The effectors still wrap around
chaperone homodimers in the extended, horseshoe-like conformation, but the
rotationoftheassemblycausesalongerwrappinglinker.Moreover,theresiduesthat
form the hydrophobic binding regions aremore highly conserved, enabling differing
effectorstobind.Thissuggeststhatthechaperonesofthe1Bclassaremoregeneral
chaperonesthanthemorespecificclass1A[142,165-169].

44
Figure1.11RibbonrepresentationofthecrystalstructureofclassIBchaperonesoftheT3SS:(a)Spa15from Shigella flexneri (monomers coloured red andmagenta respectively, PDB code 1RY9) and (b)InvBfromSalmonellaenterica(monomersshowninredandmagentarespectively,PDBcode2FM8).FigurewaspreparedusingPyMOL.
1.3.3.3 ClassII&IIIChaperones
Both class II & class III chaperones are small, acidic and slightly larger than class I
chaperones(~15-20kDa).Bothbindtopartsofthesecretionapparatusthatisformed
outside the bacteria. The class II chaperones bind to and stabilise the translocon
formingtranslocatorproteins(forexample,YopBandYopDinYersiniaspp.,PopBand
PopD in Pseudomonas aeruginosa and IpaB and IpaC in Shigella spp., respectively).
Similarly,theclassIIIT3Schaperonesbindtotheneedlecomponentpreventingtheir
prematureassociationoraggregationwithinthebacterialcytoplasm(forexampleYscF
in Yersinia spp. and PscF in Pseudomonas aeruginosa). Importantly, the translocon
poreandneedlecomplexescanonlyformiftheirrespectivechaperonesarepresentin
thebacterialcytosol [142,166-171]. If thechaperonesareknockedout,noneedleor
poreformationoccurs,thusrenderingthebacterianon-infective.
Interestingly, class II and class III chaperones, although binding to molecules that
performcompletelydifferentfunctions,haveremarkablysimilarstructures.Theseare
formedfrommultiplecopiesofamotifcalledthetetratricopetiderepeat(TPR).TPRs
areshort34aminoacidmotifsthatadoptaαhelix-turn-αhelixconformationandstack
onto each other to form elongated structures [170-172]. The X-ray structure of a
domaincontainingthreeTPRsfromproteinphosphatase5discoveredthehelix-turn-
helixarrangement,withadjacentTPRmotifspackinginaparallelfashion,resultingina
(a) (b)

45
spiralof repeatinganti-parallelalpha-helices.ThetwohelicesaredenotedasAHelix
andBHelix(Figure1.12).Thepackinganglebetweenthetwohelicesis~24°withina
singleTPRandproducesaright-handedsuperhelicalshape.Twoproteinsurfacesare
generated:mainlyresiduesonhelicesAcontributetothe innerconcavesurface,and
theothersurfacepresentsresiduesfrombothhelicesAandB.Therecanbebetween3
and16direct repeats inagivenproteindomain [170,172]. IndividualTPRmotifsare
not stableandmustbearrayed in tandem to fold correctly. TPRcontainingproteins
arewidespreadinprokaryoticandeukaryoticorganismsandareinvolvedinavariety
of biological processes, such as cell cycle regulation, transcriptional control,
mitochondrial and peroxisomal protein transport, neurogenesis and protein folding
[142,166-170].
Figure1.12ConsensussequenceofTPR.TheconsensusTPRmotif(yellow)andsolvatinghelix(green)sequence are displayed with the corresponding sequence underneath, ‘n’ denotes the number ofconsensus TPRs. The highly conserved residues are highlighted in yellow (>50% conservation of anidentical residue) and pink (50% of similar residue type). The consensus sequencewas taken fromSMART(aSimpleModularArchitectureResearchTool)databasewithaccessionno.SM00028.
Excitingly, crystal structures for both Class II and Class III chaperoneswere recently
solvedasfollows:
ALTLNNIGTIYYAREDYDQALNYYEQALSLSRAVAEAKQNLGNAKQKQGAHelix BHelix SolvatingHelix
1 13 17
n
30 34

46
1. Class II Chaperones: SycD from Yersinia enterocolitica, IpgC from Shigella
flexneri and PcrH from Pseudomonas aeruginosa [139,142,166-169,173] (
Figure1.13).
Figure1.13RibbonrepresentationofcrystalstructuresofhomodimericT3SSclassIIchaperones:(a)SycD(21-163) from Yersinia enterocolitica (PDB code 2VGX), (b) IpgC from Shigella flexneri (PDB code3GYZ)and(c)PcrH(21-160)fromPseudomonasaeruginosa(PDBcode2XCC).Themonomersareshowninredandmagentarespectivelyineachoftheabovestructures.FigurewaspreparedusingPyMOL.

47
2. Class III Chaperones: YscG from Yersinia enterocolitica and PscG from
Pseudomonasaeruginosa[139,167,168,173](Figure1.14).
Figure 1.14 Ribbon representation of the crystal structure of T3SS class III chaperones: (a) YscG(colouredgreen) in complexwithYscE (colouredblue) fromYersiniaenterocolitica (PDBcode2P58)and (b) PscG (coloured green) in complexwithPscE (colouredblue) fromPseudomonasaeruginosa(PDBcode2UWJ).FigurewaspreparedusingPyMOL.
Thestructures reveal thateachclassof chaperonepossessaTPRdomainof3.5TPR
motifs.Theseformabasket-likemoleculethathasconcaveandconvexsides.Ineach
case their secretion apparatus cargo is bound to the concave face of themolecule.
However, themode of bindingwithin this concave face and oligomeric structure of
each chaperone is very different for both classes. Class II chaperones form
homodimers that bind to extended peptides of the translocator proteins. Whereas
Class III chaperones formheterodimerswith a furtherprotein andbinda structured
helical segmentof their needle cargo. Thismight bedue to the class II chaperones
being required to bind two types of cargo protein and the class III chaperones only
beingrequiredtobindonecargoprotein.Todissectthestructuresinmoredetaileach
classisdiscussedseparatelyindetailbelow.
48
1.3.3.4 StructureandbiophysicalcharacterisationofClassIIChaperones
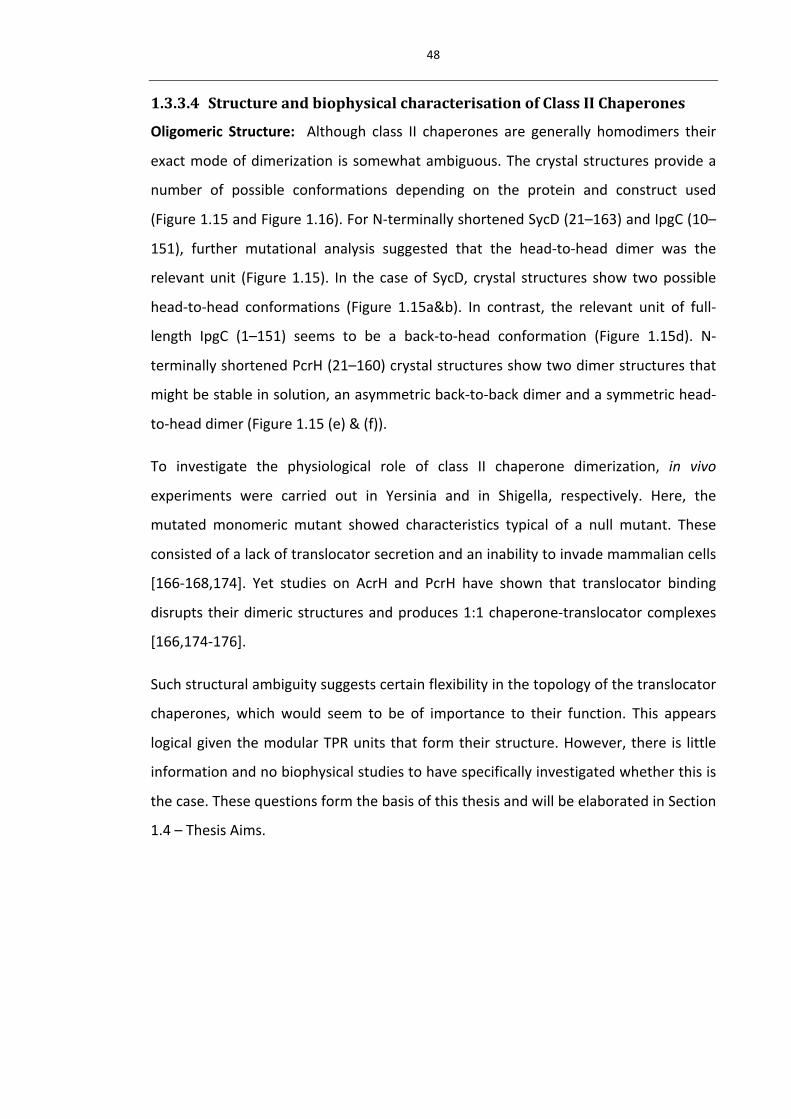
Oligomeric Structure: Although class II chaperones are generally homodimers their
exactmodeofdimerization issomewhatambiguous.Thecrystalstructuresprovidea
number of possible conformations depending on the protein and construct used
(Figure1.15andFigure1.16).ForN-terminallyshortenedSycD(21–163)andIpgC(10–
151), further mutational analysis suggested that the head-to-head dimer was the
relevantunit (Figure1.15). In the caseof SycD, crystal structures show twopossible
head-to-head conformations (Figure 1.15a&b). In contrast, the relevant unit of full-
length IpgC (1–151) seems to be a back-to-head conformation (Figure 1.15d). N-
terminallyshortenedPcrH(21–160)crystalstructuresshowtwodimerstructuresthat
mightbestableinsolution,anasymmetricback-to-backdimerandasymmetrichead-
to-headdimer(Figure1.15(e)&(f)).
To investigate the physiological role of class II chaperone dimerization, in vivo
experiments were carried out in Yersinia and in Shigella, respectively. Here, the
mutated monomeric mutant showed characteristics typical of a null mutant. These
consistedofalackoftranslocatorsecretionandaninabilitytoinvademammaliancells
[166-168,174]. Yet studies on AcrH and PcrH have shown that translocator binding
disruptstheirdimericstructuresandproduces1:1chaperone-translocatorcomplexes
[166,174-176].
Suchstructuralambiguitysuggestscertainflexibilityinthetopologyofthetranslocator
chaperones, whichwould seem to be of importance to their function. This appears
logicalgiventhemodularTPRunitsthat formtheirstructure.However, there is little
informationandnobiophysicalstudiestohavespecificallyinvestigatedwhetherthisis
thecase.ThesequestionsformthebasisofthisthesisandwillbeelaboratedinSection
1.4–ThesisAims.

49
Figure1.15Ribbonrepresentationof thecrystalstructuresofclass II chaperones: (a)& (b)head-to-headconfirmationsofdimericobtainedwithoutYopDpeptideSycD21-163.ChainsAandBofSycD21-163
are coloured blue and red, respectively. Structures (a) and (b)were produced from 2VGX.pdb and2VGY.pdb,respectively.Leucine65isrepresentedbygreenspheresandwasmutatedtoglutamicacidtoobtainmonomericprotein.LcrHdiffersfromSycDinonlytwopositions(N136DandP138T).Theseaminoacidsareshownasspace fill spheres ineachof themonomericunits. (c)& (d)Twodifferingconformationsofdimeric IpgC10-151 (c)anddimeric IpgC1-151 (d).ChainsAandBof IpgCarecolouredcyan and orange, respectively. Structures (c) and (d)were produced from 3GZ1.pdb and 3KS2.pdb,respectively. (e)& (f)TwodifferingconformationsofdimericPcrH21-160.ChainsAandBofPcrH21-160arecoloureddarkandgreenrespectively.Structures(e)and(f)werebothproducedfrom2XCC.pdb.Figures(a)to(f)werepreparedusingPyMOL.

50
Cargo Binding: Although biochemical studies have implicated more than one
interaction between chaperone and translocators, structures of IpgCwith IpaB (51–
72),PcrH(21–160)withPopD(47–56),andSycD(21-163)withYopD(56–65)showa
commonmaininteractionwhereanextendedpeptidefromeachtranslocatorbindsto
thesameconcavefaceofitscognateTPRdomain(1:1ratio)[142,166,175,176](Figure
1.16).Thus,thestructuressuggestthatthechaperonecanonlybindonetranslocator
atanygiventime.

51
Figu
re1.16CrystalstructuresofclassIIcha
perone
sbo
undtoth
eirc
ogna
tetran
slocatorproteinpep
tides.(a)Ribbo
nrepresen
tatio
nofth
easym
metric
dim
erIp
gC1-151with
bou
ndpep
tidesofIpaB
51-72(majortranslocatorprotein)in
back-to-hea
dconfirm
ation(PDBcode
3GZ1).
ChainA
andchainBofIpg
C 1-151arecolou
redcyan
and
orang
e,respe
ctively.The
bou
ndpep
tidesofIpaB
arecolou
redda
rkgreen
.Re
sidu
esin
cha
inAofIpgC
tha
tinteractw
ithIpa
Bareshow
nasstic
ksand
colou
redpu
rple.Th
esearelocatedinTPR
1-3.(b)Ribbo
nrepresen
tatio
nofPcrH 2
1-160with
the
bou
ndpep
tideofPop
D47-56(m
inortranslocatorprotein)(PD
Bcode
2XC
B).C
hainAand
cha
inBof
PcrHarecolou
redda
rkgreyan
dgreen,re
spectiv
ely.The
bou
ndpep
tidesofP
opDarecolou
redda
rkgreen
.Residue
sinPcrHth
atin
teract
with
PcrHaresho
wnasstic
ksand
colou
redpu
rple.Th
esearelocatedinTPR
1-3.Figuresw
ereprep
ared
using
PyM
OL.(c)Ribbo
nrepresen
tatio
nofthe
dim
erSycD21-163w
ithbou
ndpep
tidesofYo
pD56-65(minortranslocatorprotein)in
back-to-hea
dconfirm
ation(PDB
code
4AM
9).C
hainAand
cha
inBofS
ycD21
-163arecolou
redblue
and
redrespectiv
ely.The
bou
ndpep
tidesofY
opDarecolored
darkgree
n.
Residu
esin
cha
inAofS
ycDtha
tinteractw
ithYop
Daresho
wnasstic
ksand
colou
redpu
rple.T
hesearelo
catedinTPR
1-3.Leu
cine
65is
represen
tedby
green
sph
eresand
wasm
utated
toglutam
icacidtoobtainmon
omericprotein.SycD
differsfrom
LcrHinon
lytwo
positio
ns(N
136D
and
P13
8Tre
spectiv
ely).Figureswereprep
ared
using
PyM
OL.

52
Agoodexampletoillustratethechaperone-translocatorbindingisthecrystalstructure
ofSycDincomplexwithapeptideoftheN-terminalregionoftheminortranslocator
protein YopD (Figure 1.16 c). TheN-terminal YopDhexapeptide 58PELIKP63 has three
hydrophobicresidues(58PELIKP63)thatdockintothreespecificconservedhydrophobic
cleftsfoundalongtheconcavefaceofthechaperone.Thecleftsarelinedbyaromatic
and aliphatic residuesmainly from the A helices of the first and second TPRmotifs
[142,167].ThesametypeofinteractionandconservedresidueswerefoundinShigella
and Pseudomonas where the major translocator IpaB (58PELKAP63) and the minor
translocatorPopD(49VELNAP54)bindtoIpgCandPcrH,respectively[167].Thebinding
mode is shown in Figure 1.16 and the sequence conservation of the chaperones is
shown in Figure 1.17. Interestingly, Lunelli et al. performed Isothermal Titration
Calorimetry(ITC)experimentstoobtainaKdfortheinteractionofPELKAPpeptidewith
IpgCandvarious constructsof IpgC inwhich thepeptide-binding sitewasdisrupted.
PELKAPboundtoIpgCwithaKdof625±11µM,whereastheIpaB51-72peptide,usedin
theco-crystallizationboundtoIpgCwithaKdof72±8µM.ThemutatedIpgCshowed
nobindingtothepeptide,wasunabletocomplementthedeletionofipgCinepithelial
cell invasion and failed to allow secretion of translocator IpaB. Additionally, they
assayed the KD of peptides encoding the putative chaperone-bindingmotif of YopB
(VQLPAP)andYopD(PELIKP)toSycD.Thesestillshowedaninteraction,butwithavery
weakKdof455±19µMand1,370±38µMrespectively[167,173].Thusalthoughthe
peptide binding interfaces shown in the crystal structures are important, the ITC
resultssuggestafurtherinteractionsiteonthechaperoneisprobable.

53
Figure 1.17 Structure based sequence alignment of T3SS Class II chaperones. IpgC from Shigellaflexneri, PcrH fromPseudomonas aeruginosa, SycD fromYersinia enterocolitica, fl-LcrH and tr-LcrHfromYersiniapestis(residuesareshowninred).ResiduesformingtheTPRhelicesarehighlightedinyellow. C-terminal solvating helix forming residues are highlighted in green. Residues involved inhydrophobicandvanderWaal’sinteractionwiththeclassIIchaperone’scorrespondingtranslocatorextendedpeptidesarehighlightedinred.Aminoacidsinvolvedinsaltbridgeformationbyinteractionwith side chain residues of corresponding translocator peptides are highlighted in light blue. ThedifferencebetweenSycDandLcrH(fl-LcrHandtr-LcrH)isinonlytwopositions:N136DcoloureddarkblueandP138Tcolouredpurple.
1.3.3.5 StructureandbiophysicalcharacterisationofClassIIIChaperonesAsstatedearlier,althoughtheclassIIIchaperonespossessaTPRdomainliketheclass
IIchaperones,theydon’tformhomodimersanddon’tbindtheircargoasanextended
peptide. Insteadthey interactwithanadditionalproteinto formaheterodimerand
interactwiththeircargothroughastructuredαhelix-turn-looparrangement.
Oligomeric State: In both reported structures, the class III TPR chaperone domain
bindsasmall2α-helicalproteinatitsN-terminus.InPseudomonastheTPRchaperone
PscGbindsPscEand in Yersinia theTPR chaperoneYscGbindsYscE (Figure1.19). In
both structures the interaction between these proteins is very similar, unlike the
numerous different homodimers of the Class II chaperones. The two helices of

54
PscE/YscEinteractthroughhydrophobicinteractionswiththefirsttwoN-terminalTPR
containinghelicesofPscG/YscG.ProteinsequencealignmentofYscG,PscGandother
relatedproteinsshowedthatthesehydrophobicresiduesareconserved(Figure1.18).
In the case of YscE/G, the total buried surface area of the interaction is 1548 Å2.
Moreover,thepositioningofPscE/YscEinthecomplexmeansthatitmakesverylittle
direct contact with the chaperones cargo, PscF/YscF (Figure 1.19). The total buried
surface area between YscF and YscE in the complex ismerely 276Å2. Thus itwould
seemthattheroleofPscE/YscE ismost likelytobethatofstabilisingPscG/YscG ina
formthatcanreadilyacceptitscargo.ThefactthatYscEnullmutantstrainsofYersinia
donotaccumulateYscGand thatPscEnullmutant strainsofPseudomonas arenon-
cytotoxicsupportthishypothesis[139,173,177].
Figure1.18StructurebasedsequencealignmentofT3SSclass IIIchaperonessharinghomologyfromdiversepathogens.PscG fromPseudomonasaeruginosa (nosocomial infections),YscG fromYersiniapestis (bubonic plague), YscG from Vibrio parahaemolyticus (gastrointestinal illness), LscG fromPhotorhabdus luminescens (insect pathogen), and YscG from Aeromonas hydrophila (respiratoryillness inhumans, reptiles,andbirds).Residues showing100%conservationarehighlighted in red.PscG homologs share high conservation within residues that interact with PscE (purple) and PscF(orange).

55
Cargo Binding: The main binding site of the heterodimer is located on the hydrophobic
concavegrooveoftheTPRdomainsofPscG/YscG.PscG/YscGactsasascaffoldtoorganise
theassemblyofPscE/YscEandPscF/YscFintotheheterotrimericcomplex.Inbothcases,the
concavesurfaceofPscG/YscGformedbyTPRcontainingα-helices(H1,H3andH5)andaC-
terminal α-helix (H7), display a highly hydrophobic platform,which grasps the C-terminal
helixofPscF/YscF.[139,173,177-180].InYscEFGcomplex,theC-terminalresiduesofYscF50-
87 adopt aα-helical hairpin conformationwithin the TPR groove. The total buried surface
areabetweenYscFandYscGinthecomplexis2724Å2.Thus,thecomplexthatYscGmakes
withYscFisfarmoreextensivethanthosemadebytheclassIIchaperoneswiththeircargo.
In synergywith the structure of YscEFG, the interaction of PscFmirrors that of YscF, but
differsattheN-terminus.Hereinsteadofthehairpin-helixconformation,thePscFshowsan
extended peptide. One explanation for the difference is the PscF construct used was
truncated whereas the YscF was full length. Interestingly, further experimentation
concluded that the N-terminal section of YscF (1-49) could not be resolved
crystallographicallyasitwasunstructured.
Figure1.19CrystalstructuresoftheheterotrimericcomplexcomprisingtheclassIIIchaperones:(a)YscEFGcomplexcomprisingtheheterodimerchaperoneofYscE/YscG(colouredblue/red)andneedleproteinYscF50-87 (coloured green). (b) PscEFG complex showing the heterodimer chaperone of PscE/PscG (colouredblue/red)andneedleproteinPscF54-84(colouredgreen).FigureswerepreparedusingPyMOL.

56
1.4 ThesisAimsGiventhecrucial roleof theclass II translocatorchaperones,thisstudyaims toinvestigate
their conformational stability and the thermodynamic importance of the homodimeric
interface. To accomplish these aims theclass II chaperone LcrH fromYersinia pestiswas
chosenasamodel system. LcrH is identical toSycD fromY.enterocolitica, except for two
minoraminoacidsubstitutions,(Figure1.15andFigure1.17).
Initially wewill investigatethe oligomeric states of different constructs of LcrH and their
secondary structure characteristics. Thesewillbe achieved by: (i) constructing the LcrH
genes-fulllengthLcrH(fl-LcrH),truncatedLcrH(tr-LcrH)andmonomericL65ELcrH(tr-LcrH
L65E),(ii)carryingoutmolecularcloningofconstructedLcrHgenesintosuitableexpression
vectorsforproteinexpressionfollowedbypurificationstrategiesand(iii) initialbiophysical
characterisationof LcrHproteinconstructs.Theoligomeric statesof theseproteinswillbe
studied by analytical size exclusion chromatography (SEC) and their secondary structure
characterisedthroughfar-UVcirculardichroism(CD).
Furthermore wewill examine the monomer-dimer equilibrium and oligomeric state of
various LcrH protein constructswhich willbe undertaken by the use of analytical ultra-
centrifugation (AUC), analytical size exclusion chromatography (SEC) and dynamic light
scattering(DLS).InadditionIintendtoexplorethethermodynamicstabilityandflexibilityof
LcrH proteins through equilibrium chemical denaturations (monitored by far-UV CD and
fluorescencespectroscopy).

57
Chapter2 MaterialsandMethods
2.1 MolecularBiologyMethodsInthisstudy,threedifferentconstructsofLcrH–fulllengthLcrH(fl-LcrH,168aminoacids),
truncatedLcrH(tr-LcrH,aminoacids21-163,143residues)andmutantL65ELcrH(sequence
identical to tr-LcrH, except at amino acid position 65 where leucine was mutated to
glutamate)wasproduced.Thetechniquesusedfortheirgeneconstructionandcloningare
describedasfollows.
2.1.1 fl-LcrHgenesynthesisThefl-LcrHgenewassynthesizedusingthestepsoutlinedbelow:
2.1.1.1 RecursivePCR
The full lengthLcrH (fl-LcrH) genewas initially synthesizedusinga recursivePCRmethod.
This requiredthedesignofeightcodingandnon-codingoverlappingoligonucleotides that
spannedtheentiresequenceoftheLcrHgene(Figure2.1).Theoverlappingregions inthe
oligonucleotideswere20basepairsinlengthandengineeredtogivemeltingtemperatures
(Tm) in the range 54 – 64 °C. Computer based sequence analysis using ClustalWmultiple
sequencealignmentoftheentiregenesequencewiththesequenceoftheoverlapregions
was performed. The sequence alignment showed them to be unique and unlikely to give
non-specificpriming.ThedesignedsequencesweresynthesisedbyVHBioLimited,UKand
suppliedinlyophilisedform.TheyweredissolvedinddH2Otogiveastockconcentrationof
50µM.
Figure2.1: Schematic showing the recursiveoligonucleotides required for synthesisof the LcrHgene.Thegeneisrepresentedasabluebox,thecodingoligonucleotidesrepresentedasblacklinesandthenon-codingoligonucleotides represented as red lines. Note that each oligonucleotide overlapped with each of itsneighboursby20bases.

58
ToperformtherecursivePCRtheoverlappingoligonucleotides(0.5µMfinalconcentration)
were added to 10 x reaction buffer (5 μL, Stratagene), dNTPs (0.2 mM of each final
concentration),steriledeioniseddistilledwaterandPfuTurboDNApolymerase(1μLof2.5
U μL-1 –Stratagene) to give a total reaction volume of 50 µL in a sterile PCR tube. The
recursive PCR was carried out starting with 95 °C of initial denaturation for 2 minutes,
followed by a cycle repeated 25 times: denaturation at 95 °C for 30 seconds, annealing
temperature of 52 °C for 30 seconds, elongation at 72 °C for 30 seconds, and finally 10
minutesofextensionat72°Cinathermalcycler.
2.1.1.1.1 AgaroseGelElectrophoresis
0.75gofMolecularBiologygradeagarose(Fisher,UK)wasaddedto50mlof1xTBEbuffer
(Tris-Borate-EDTAbuffer-90mMBoricacid,2mMEDTA,90mMTris-HCl,pH8.0)ina100
ml conical flask. The mixture in the conical flask was then heated in the laboratory’s
microwaveoventopreparea1.5%w/vagarosegel.Ethidiumbromidewasthenaddedto
themoltenagarose(finalconcentration0.5µgml-1).Thecompletemixwasaddedtothegel
mouldandlefttoset.DNAsampleswerepreparedbyadding1µLof6xgelloadingbuffer
(0.25%BromophenolBlue,0.25%XylenecyanolFF,15%Ficoll)to5µLofDNApreparation.
The gel loading buffer contains bromophenol blue dye, which helps increase the DNA
sample’sdensityallowingittofall intothewellofthegelandprovidesavisiblemarkerto
monitortheprogressofelectrophoresis.Oncethegelwasset,itwassubmergedin1xTBE
bufferandloadedwithDNAsamplesand100bpDNAladder(0.5µgof100bpDNAladder
dilutedinloadingbuffer–NEB)fordetectingthebandof500bpLcrHgene.The100bpDNA
ladder contains standard molecular size marker ranging from 100-1,517 bp. Agarose gel
electrophoresis was performed in an electrophoresis tank (BIORAD, UK) by applying a
currentof35mAandvoltageof70volts.DNA isnegativelychargedatpH8.0,hence the
application of an electric current caused migration of DNA towards the anode. DNA
fragmentsmigratethroughthematrixofagarosegelatratesthatareinverselyproportional
tothelog10ofthemolecularweightofDNA.
2.1.1.2 PolymeraseChainReaction(PCR)
InordertoextractafulllengthLcrHgene(fl-LcrH)withrestrictionsitesforfurthercloning,a
conventional PCR was performed using the recursive PCR product as template.
Oligonucleotides were designed to match the termini of fl-LcrH (coding and non-coding
59
strands)withmeltingtemperatures(Tm)of≈70°C.Thecodingoligonucleotideincorporated
a BamHI and the non-coding oligonucleotide incorporatedHindIII restriction site at their
ends.Thereverseoligonucleotidealsoincorporatedastopcodonafterthegenesequence,
but before the HindIII restriction site. The designed sequences were synthesized by
IntegratedDNATechnologies,Belgiumandsuppliedinlyophilisedform.Theyweredissolved
inddH20togiveastockconcentrationof50µM.
ToperformthePCRtheoligonucleotides(0.5µMfinalconcentrationofeach)wereaddedto
therecursivePCRproduct(2μL),10xreactionbuffer(5μL,Stratagene),dNTPs(0.2mMof
eachfinalconcentration),steriledeioniseddistilledwaterandPfuTurboDNApolymerase(1
μLof2.5UμL-1–Stratagene)togiveatotalreactionvolumeof50µLinasterilePCRtube.
ThePCRwascarriedoutstartingwith95°Cofinitialdenaturationfor2minutes,followedby
acyclerepeated25times:denaturationat95°Cfor30seconds,annealingtemperatureof
52°Cfor30seconds,elongationat72°Cfor30seconds,andfinally10minutesofextension
at72 °C ina thermalcycler.Asbefore,oncompletionof thePCR, theentirePCRproduct
was runona1.5%agarose gel to confirm the successof the reaction (Section2.1.1.1.1)
showedaclearbandofDNAat~500basepairs. ThecorrectsizedDNAwasexcisedfrom
thegelandpurified(Section2.1.3.2).
2.1.2 InsertionofsynthesisedLcrHgeneintoacloningvectorThe newly synthesized fl-LcrHgenewas first incorporated into a cloning vector using the
followingstrategy.
2.1.2.1 Cloningofl-LcrHgeneintoTOPOTAcloningvector
2.1.2.1.1 Poly-AtailingwithTaqpolymerase
1 unit of Taq polymerase was added to the PCR reaction from Section 2.1.1.2 and was
incubatedfor8-10minutes(nocycle)at72°Cinathermalcycler.This introducedapoly-A
tail (‘A’ overhangs) of the 3’ end of DNA which complements the ‘T’-overhangs already
present inthepCR®2.1-TOPO®vector(InvitrogenTM).Thisenablesthe incorporationofthe
PCRproductintothecloningvectorforwhichthemapisshowninFigure2.2.

60
Figure2.2pCR2.1-TOPOcloningvectorcontainsanumberoffeaturesforefficientsubcloning.ThevectorissuppliedasalinearizedvectorcontainingToverhangsfordirectligationofTaq-amplifiedPCRproducts.TheT7 promoter and M13 forward and reverse primer sites are present for in vitro RNA transcription andsequencing.EcoRIsitesflankthePCRproductinsertionsiteforeasyexcisionofinserts.Thepresenceoflacpromoterandoperatorallowsforeasyblue/whitecolonyscreeningonX-Gal-IPTGagarplates.Kanamycinandampicillinresistantsites inthevectorallowforthechoiceofselectioninE.coli. ThevectormapwasproducedusingSnapGeneViewer1.5.3.
2.1.2.1.2 LigationforTOPOTAcloning
Theligationreactionwasperformedusing3µLofthepoly-Aextendedfl-LcrHPCRproduct,
2µLofpCR®2.1-TOPO®vector,1µLofT4DNAligase(NEB,UK),1µLofT4DNAligase10x
reactionbuffer,3µLofsteriledeioniseddistilledwatertogivetotalreactionvolumeof10
µL.Thereactionmixturewasincubatedat14°Cfor4hours.
2.1.2.1.3 TransformationofLigatedfl-LcrHinchemicallycompetentcells
Thechemicallycompetentcellsusedforthetransformationofthefl-LcrHgeneclonedinthe
TOPOTAcloningvectorwasOneShot®TOP10E.colicells(InvitrogenTM).
OneShot®TOP10Genotype:
F-mcrAΔ(mrr-hsdRMS-mcrBC)Φ80lacZΔM15ΔlacX74recA1araD139Δ(araleu)7697galU
galKrpsL(StrR)endA1nupG
2µLoftheligationmixturewasaddedto50µLofOneShot®TOP10E.colicellsinasterile
microcentrifuge tube and allowed to incubate on ice for 30 minutes. The mixture was

61
incubatedat42°Cinawaterbathfor30secondsandplacedonicefor2minutes.250µLof
LBmediawasaddedtothetransformedcellsandincubatedonashaker(250RPM)at37°C
foronehour.Afterincubation,thecellswerecentrifugedat6,000RPMfor2minutes;the
supernatantwasdiscarded leavingapproximately100µLofLBmedia. Thecellpelletwas
resuspendedandplatedonLBagarplatecontaining25µg/mLofKanamycin,20µg/mlofX-
Galand0.2mg/mlofIPTGforblue/whitecolonyscreening.Theplatewaslefttoincubate
at37 °Covernightandchecked thenextmorning. Whitecolonies represented theE.coli
cellsthatcontainedthefl-LcrHgeneincorporatedintotheTOPOTAcloningvector.
2.1.2.1.4 DNAextractionandpurification
Representativewhitecolonieswerepickedusingsteriletoothpicks,andusedtoinoculate5
mlofsterileLBbrothcontaining50µg/mlofKanamycin.Thiswasincubatedat37°Cfor14-
16hoursonashaker(250RPM).Small-scaleisolationofplasmidDNAfromthesebacterial
colonies was then performed (known as minipreparation of plasmid DNA (plasmid
miniprep)).ThisprocessisbasedonthealkalinelysismethodforextractionofplasmidDNA
from a relatively small volume of bacteria and was performed using a QIAprep Spin
MiniprepKit(QIAGENLtd.).Theplasmidminiprepwascarriedoutusingthemanufacturer’s
instructions.
2.1.2.1.5 EstimationofDNAconcentration
Plasmid DNA samples obtained from the plasmid miniprep method were diluted using
ddH2O for measurement of DNA concentration. A Shimadzu UV-1601 UV-VIS Scanning
spectrophotometerwasbaselinedusingddH2Oasblanksample.100µLofthedilutedDNA
samplewasaddedtoaquartzcuvetteandaspectrumwasmeasuredfrom350to220nm.
Three differing dilutions for a givenDNA samplewere prepared and an average of three
measuredspectrawastakenforensuringaccurateDNAconcentrationmeasurement.DNA
absorbsat260nm,hencethiswavelengthwasusedtodeterminetheamountofDNA.The
followingEquation2.1wasusedtomeasuretheconcentrationofDNA:
Equation2.1
𝑫𝑵𝑨 𝒄𝒐𝒏𝒄𝒆𝒏𝒕𝒓𝒂𝒕𝒊𝒐𝒏 = 𝑨𝟐𝟔𝟎 𝒏𝒎 ×𝒅𝒊𝒍𝒖𝒕𝒊𝒐𝒏 𝒇𝒂𝒄𝒕𝒐𝒓×𝒄𝒐𝒏𝒗𝒆𝒓𝒔𝒊𝒐𝒏 𝒇𝒂𝒄𝒕𝒐𝒓
where, A260nm denotes the absorbance at 260 nm; conversion factor is 50 since an
absorbance at 260 nm of 1.0 corresponds to 50 ng ml-1 of double stranded DNA, the

62
resultantDNAconcentration ismeasured inngml-1.A260nm toA280nm ratioof1.6orabove
indicatedpure,contaminationfreeDNAsample.
2.1.2.1.6 AnalyticalRestrictionDigestionwithEcoRI
Thefl-LcrHgenewouldbe incorporatedbetweenEcoRIsites inthepCR®2.1-TOPO®vector
on successful ligation (the EcoRI sites flank the PCR product insertion site in the vector).
Hence, the purified plasmid miniprep DNA samples were digested with EcoRI restriction
enzymetoconfirmpositiveclones.Thedigestionwascarriedoutusing8µLofplasmidDNA,
0.5µLofEcoRIrestrictionenzyme(NEB,UK),0.5µLofsteriledeioniseddistilledwater,and1
µL of NEB buffer 2 to give a total reaction volume of 10 µL. The reaction mixture was
incubatedat37°Cfor3hours.Thedigestedbandswerevisualizedona1.5%agarosegel
(Section 2.1.1.1.1). Presumptive positive clones were sent for DNA sequencing (Section
2.1.2.1.7)andsequencedusingM13reverseprimer.
2.1.2.1.7 DNAsequencing
DNAsampleseachwithavolumeof15µLofminiprepDNAataconcentrationof100ngµL-1
were prepared in labelled microcentrifuge tube and sent with the correct sequencing
primer. DNA sequencing was carried out by Lark Technologies, Essex, UK (now Beckman
CoulterGenomicsLtd).TheresultantDNAchromatogramswereviewedandanalyzedusing
ChromasProsoftwareversion1.34(TechnelysiumPtyLtd.).
2.1.3 Insertionofsynthesisedfl-LcrHgeneintoanexpressionvectorTwo expression vectors were used for expressing fl-LcrH. These were pProEX-HTb
(Invitrogen)andpTrc-GST(designedvectorobtainedfromProf.A.R.Fershtandbasedonthe
pRSETA vector, Life Technologies). These are shown in Figure 2.3. The fl-LcrH genewas
insertedintothesevectorsbetweentherestrictionsitesBamHIandHindIII.

63
Figure2.3:pProEX-HTb(a)andpTrc-GST(b)vectors.Thevectorscontainanumberoffeaturesincluding,anampicillinresistancegene(showningreencolour)thatpermitstheselectionofcellscarryingtheexpressionvectorandmultiplecloningsite (MCS)shown inorange. TheTrcpromotersequencecontainspartof thetryptophanpromoter,partofthelactosepromoterandthelactoserepressorgene,thusallowinghighlevelofexpressionwheninducedwithisopropylβ-D-1-thiogalactopyranoside(IPTG).VectormapswereproducedusingSnapGeneviewerversion1.5.2.
2.1.3.1 Restrictiondigestoffl-LcrHgene
Fl-LcrH intheTOPOvectorandeachexpressionvectorweredigestedseparatelyusingthe
restriction enzymes BamHI and HindIII. Due to the star activity of BamH1 a sequential
restriction digestionwas carried out. 16 µL of gel purifiedDNA (PCR product or plasmid
vector DNA), 2 µL of NEB buffer 2 (NEB), 1 µL of HindIII restriction enzyme (NEB), and
incubatedfor3hoursat37°C.TheHindIIIwasthenheatdeactivationbyincubatingat65°C
for20minutesandsubsequentlyplacedonice.0.4µLofNaCl(5mMstocksolutionNEB),0.2
µLofBSA(1xfinalconcentrationfrom100Xstocksolution,NEB),1µLofBamHIrestriction
enzyme (NEB), 0.4 µL of sterile ddH2Owas added to the reactionmixture to give a total
volumeof20µLandincubatedfor3hoursat37°C.BamHIwasdeactivatedbyheatingthe
reactionmixtureat65°Cfor20minutes.ThedigestedDNAsampleswerevisualizedon1.5
% agarose gel (Section 2.1.1.1.1) and DNA bands of correct size were excised and gel
purifiedasbelow.
(b)(a)

64
2.1.3.2 PurificationofDNAfromanAgaroseGel
ThecorrectsizedDNAbandvisualizedonagarosegelwasexcisedandplacedinaPCRtube
(thePCRtubewaspuncturedwithaholeatthebottomandfilledwithglasswool),andwas
placedintoamicrocentrifugetube.Thelidofthemicrocentrifugetubewaspuncturedand
the PCR tube containing the excised gel was inserted to fit tightly at the top. This was
centrifugedfor10minutesat13,000RPMtoseparatetheDNAfromthegel. Thegelwas
held on the glass wool with the DNA in solution collected at the bottom of the
microcentrifugetube.ThisDNAwasthenpurifiedfromthissolutionviaDNAprecipitation
usingthePelletPaintCo-Precipitant(Novagen)asperthemanufacturer’sinstructions.The
DNAwasthenre-solubilisedin20µLofsterileddH2O.
2.1.3.3 LigationThegelpurifieddigested insertandvectorwere ligated inaratioof3:1 (insert:vector) in
termsof volume. The ligation reactionwasperformedbyadding6µLof thegelpurified
insert,2µLofthedigestedvectorDNA,0.5µLofsterileddH2O,1µLofT4DNAligase10x
reactionbuffer(NEB,UK),0.5µLofT4DNAligase(NEB,UK)togiveatotalreactionvolume
of 10 µL. The reaction mixture was incubated at 4 °C for 14-16 hours. The ligase was
deactivatedbyincubatingthereactionmixtureat65°Cfor20minutes
2.1.3.4 TransformationusingElectro-competentcells
The ligation mixture was transformed in electrocompetent XL1-Blue E. coli cells (Agilent
Technologies). The XL1-Blue strain of E. coli allows blue-white colour screening for
recombinant plasmids, is an excellent host strain for routine cloning applications using
plasmidorlambdavectorsandhelpsinpreparationofhighqualityplasmidDNA.
XL1-BlueGenotype:
recA1endA1gyrA96thi-1hsdR17supE44relA1lac[F´proABlacIqZ∆M15Tn10(Tetr)]
(Geneslistedsignifymutantalleles.GenesontheF´episome,however,arewildtypeunless
indicatedotherwise).
Inordertoperformtransformation,1µLoftheligationmixturewasaddedto30µLofXL1-
Blue cells (in 10 % glycerol), mixed well and added to 0.2 cm electroporation cuvette
(BIORAD).ThecuvettewasplacedintothechamberslideandelectroporatedusingtheBio-
RadMicropulserTM. A pre-programmed electroporation setting called EC2 (voltage of 2.5

65
kV)wasused,asthiswasthemanufacturer’srecommendedsetting.Avoltagedeliverytime
ofapproximately5millisecondsafterpulsingwasan indicatorofefficientelectroporation.
Once pulsed, 1 ml of LB broth was immediately added to the sample and the mixture
incubatedat37°Cfor1hr.Thecultureproducedfromthetransformationwasplatedout(≈
50 µL) onto LB-Agar plates containing ampicillin (100 µg ml-1 final concentration) and
incubated overnight at 37 °C. Single bacterial colonies were picked the following day,
inoculated in5mlLBbrothcontaining100µgml-1ampicillinand incubatedat37 °Cona
shaker(250RPM)for14-16hours.
2.1.3.5 ConfirmationofDNAClones
To determinewhether the ligation had been successful, the isolatedDNAwas restriction
digested(Section2.1.3.1,exceptthereactionvolumewas10µL)andrunona1.5%agarose
gel(Section2.1.1.1.1).ApositiveresultshowedaDNAbandthatcorrespondedtothesize
oftheLcrHgene(500bases).TheDNAthatproducedpositiverestrictiondigestswerethen
sentforDNAsequencing(Section2.1.2.1.7).
2.1.4 Synthesis& insertionof truncatedLcrH (tr-LcrH) gene in intopTrc-
GSTvector
Theshortenedversion,tr-LcrHwassynthesizedbyperformingaconventionalPCRusingfl-
LcrH in pProEXHTb vector as a template. Oligonucleotides were designed to match the
terminioftr-LcrH(codingandnon-codingstrands)withmeltingtemperatures(Tm)of67–74
°C. The coding oligonucleotide incorporated aBamHI and the non-coding oligonucleotide
incorporated HindIII restriction site at their ends. The reverse oligonucleotide also
incorporatedastopcodonafterthegenesequence,butbeforetheHindIII restrictionsite.
ThedesignedsequencesweresynthesizedbyIntegratedDNATechnologiesInc.andsupplied
in lyophilised form.Theyweredissolved inddH20togiveastockconcentrationof50µM.
ThePCRreactionwasperformedandsuccessconfirmedasdescribedinSection2.1.1.2.
Thecorrectlysizedtr-LcrHPCRproductwasthenincorporatedintothepTrc-GSTvectorbya
simple restriction digest of vector and gene, followed by DNA extraction, ligation and
transformation (Section 2.1.2.1.3). The success was confirmed with analytical restriction
digestandDNAsequencing(Section2.1.3.5).

66
2.1.5 SynthesisofLE65mutantoftr-LcrHIn order to create the monomeric L65E LcrH construct, site directed mutagenesis was
performedonthepTrc-GSTexpressionvectorcontainingthetr-LcrHgene.Apointmutation
was carried out in the tr-LcrH gene, where the 65th amino acid Leucine wasmutated to
Glutamicacid. Oligonucleotides for thecodingandnon-coding strand spanning thepoint
mutationsiteintr-LcrHweresynthesized(IntegratedDNATechnologies,Inc.)withTmof78
°C. Site directed mutagenesis PCR was performed using the QuikChange® Site-Directed
Mutagenesis Kit (Stratagene). The formula commonly used for estimating the Tm for the
oligonucleotides is shown in Equation 2.2 (QuikChange® Site-Directed Mutagenesis kit
instructionmanual)
Equation2.2
𝑇! = 81.5+ 0.41 % 𝐺𝐶 −675𝑁 −% 𝑚𝑖𝑠𝑚𝑎𝑡𝑐ℎ
For calculating Tm:N is the primer length in bases, values for%GC and%mismatch are
wholenumbers.
2.1.5.1 SiteDirectedMutagenesis
Site directedmutagenesiswas carried out using 1.25 µL each of oligonucleotides for the
coding andnon-coding strand (125ng each), 2µL of template (10ngof tr-LcrH-pTrc-GST
plasmidvector),5µLof10xreactionbuffer(Stratagene),1µLofdNTPs(10mMmix),38.5
µLofddH2Oand1μLofPfu turboDNApolymerase(2.5U/μL–Stratagene)togiveatotal
reactionvolumeof50µLinasterilePCRtube.
The mutagenesis PCR was performed starting with 95 °C of initial denaturation for 30
seconds, followed by a cycle repeated 18 times: denaturation at 95 °C for 30 seconds,
annealingtemperatureof55°Cfor30seconds,elongationat68°Cfor5minutes30seconds
(1minuteperkbofplasmidlength)andfinally5minutesofextensionat68°Cinathermal
cycler.1µLofDpnI restrictionenzyme(10U/µL)wasaddedto thereactionmixtureafter
thecompletionofPCR,thoroughlymixed,spundowninamicrocentrifugetubefor1minute
and incubated at 37 °C for 1 hour. This DNA was used to transform XL1-Blue
electrocompetentcells(Section2.1.3.4).Colonieswerepickedforgrowingbacterialcultures
overnight, followed by isolation and purification of plasmid DNA (Section 2.1.3.2). The

67
plasmid DNA samples were subjected to analytical restriction digestion with BamHI and
HindIII(Section2.1.3.1)exceptthatthereactionvolumewas10µL.Therestrictiondigestion
wasanalysedona1.5%agarosegel.DNAsamplesshowing thecorrectsizedbandswere
selected,sentforDNAsequencing(Section2.1.2.1.7)andsequencingwascarriedoutusing
pTrc-Hisreverseprimer.
2.2 ProteinProductionandPurificationLcrHproteins fl-LcrH, tr-LcrHandmonomericL65ELcrHwereproducedusingtheprotocol
describedbelow.
2.2.1ProteinProduction
BL21C41(DE3)ElectrocompetentstrainofE.colicellsweretransformed(Section2.1.2.1.3)
with expression plasmid vectors pTrc-GST and pProEX-HTb, both carrying the LcrH gene
respectively. BL21 C41(DE3) cells are E. coli strains that are effective in expressing toxic
proteins from all classes of organisms, including bacteria, yeast, plant, viruses, and
mammals.TheC41strainscontaingeneticmutationsphenotypicallyselectedforconferring
tolerance to toxicproteins.ThestrainC41 (DE3)wasderived fromBL21 (DE3).This strain
has amutation that reduces the level of T7 RNAP activity, thereby preventing cell death
associatedwithoverexpressionofmanyrecombinanttoxicproteins[178-181].
BL21C41(DE3)Genotype:F–ompThsdSB(rB–mB
–)galdcm(DE3)
Single colonies containing the LcrH genewere picked and grown in 10ml of LBmedium
containingfinalconcentrationof50µg/mlampicillinovernightat37°Conashaker.The10
mlovernightgrownbacterialculturewasusedtoinoculate1Lof2xYT+ampicillinina2L
flaskandwasgrownat37°Cwithconstantshakingat200RPMuntiltheabsorptionofthe
cellsat600nm(A600)reached0.6–1.0(≈3–4hours).Theabsorptionwasmonitoredusing
a UV-2401PC UV-Vis recording spectrophotometer. Isopropyl-thio-β-D-galactopyranoside
(IPTG) (Melford Laboratories Ltd., UK) was added to a final concentration of 0.1 mM to
induce protein expression. The temperature was lowered to 18 °C for improving the
stability and solubility of the protein undergoing expression and placed on the shaker
overnight (200 RPM). The cells were harvested after 16-18 hours post induction in a

68
BeckmanAvantiJ-30IcentrifugeandusingtheJLA9.1000rotorfor10minutesat4,000xg
at4°C.
2.2.1.1 CellLysisforProteinExtraction
2.2.1.1.1 CellLysisbySonication
Theharvestedbacterialcellpelletwasresuspendedin40mlofice-cold1xPBScontaining10
%glycerol.ThecellswerelysedbysonicationusingaSonicsVibracellUltrasonicProcessor
(Sonics&MaterialsInc.).Themixturewasretainedonice,whilst6cyclesof15secondson,
45secondsoff,withanoutputof30voltswereapplied,untilthecellmixturebecamenon-
viscousanddarkerincolour.Thecelldebriswasthenremovedbycentrifugationat33,000
xginBeckmanAvantiJ-30Icentrifuge,inaJA-30.50rotorfor1hourat4°C.
2.2.1.1.2 CellLysisbyHomogenisation
Thesuspensionofharvestedbacterialcellsinicecold1XPBSwith10%glycerol,5mMDTT
was filtered through a sieve and poured into the inlet of high pressure homogenizer
Emulsiflex-C3(AvestinInc.,Canada).Thecelllysiswascarriedoutunderpressureof20,000
lb/in2withnitrogengasaccordingtothemanufacturer’sinstructions.Thecellswerelysed
by two passages through the Emulsiflex-C3 until the lysate became non-viscous and
homogenous. Thecell lysatewas thencentrifugedat33,000x g for1hourat4 °Cusing
Beckman-CoulterJA-30.50rotor.
2.2.1.2 PurificationbyAffinityChromatography
Thesupernatantproteinextractedaftercelllysisandsubsequentcentrifugationwasfiltered
througha0.2µmsyringefilter(SartoriusStedimBiotechGmbH,Germany)andsubjectedto
affinitypurification. AffinitypurificationofLcrHproteinswascarriedoutbytwomethods
dependingontheexpressionplasmidusedforproteinproduction i.e.pProEXHTbplasmid
containing the fl-LcrH gene produced a hexahistidine tagged protein whereas pTrc-GST
plasmidproducedGSTtaggedproteins:
1)Ni2+affinitychromatography–pProEXHTbplasmidcontainingthefl-LcrHgeneproduced
ahexahistidine-taggedfl-LcrHprotein.His-taggedfl-LcrHproteinwaspurifiedbyusingNi2+
charged column packedwith Iminodiacetic acid agarose resin (Sigma, UK). The resinwas

69
chargedwithNi2+bypassing2columnvolumesof100mMNiSO4andtheunboundNiSO4
wasremovedwithacolumnvolumeof1xPBS.
2)GST-affinitychromatographywasusedtopurifyfl-LcrH,tr-LcrHandmonomericL65ELcrH
proteins produced from pTrc-GST vector containing the respective genes. GST-tagged
proteinswerepurifiedbyusingacolumnpackedwithglutathioneagaroseresincalledSuper
Glu–GlutathioneSuperflow(Generon,UK).
2.2.1.3 BufferSolutions
All buffer solutions were made with deionised distilled H2O (resistance of 18.2 Ω) and
vacuum filtered using 0.2 µmmembrane filter (Whatman) prior to usage. The names of
buffersandtheirrespectivecompositionsareshowninTable2.1.
Table2.1:Buffersolutionsandtheircompositions
Nameofbuffer Buffercomposition
His-tagWashbuffer
1xPBS(137mMNaCl,10mMphosphate,2.7mMKCl),pH7.4
His-tagElutionbuffer
50mMphosphate,150mMNaCl,
250mMImidazole,pH7.0
GSTWashbuffer 20mMphosphate,150mMNaCl,pH7.2,5mMDTT
GSTElutionbuffer
20mMphosphate,150mMNaCl,10mMreducedglutathione,pH
7.2,5mMDTT
2.2.1.4 Ni2+AffinitychromatographyandcleavageofHis-taggedproteins
ThefilteredsupernatantwasloadedontoaNi2+affinitycolumnpre-equilibratedwithhis-tag
washbuffer.AfterpassingthesupernatantproteinthroughtheNi2+affinitycolumn(column
volume=10ml),itwaswashedwith20columnvolumesofhis-tagwashbuffer.Theprotein
waselutedwithhis-tagelutionbuffer.Afterelution,thecolumnwaswashedwith2column
volumesof6MGdmHCltounfoldanyresidualproteinboundtothecolumn.Thecolumn

70
wasthenwashedwith5columnvolumesofddH2O,followedby2columnvolumesof20%
ethanolandstoredat4°C.Theelutedproteinwascleavedovernightat25°Cbyadditionof
TEVproteasetoremovethefusedN-terminalHis-tag.Theaffinitypurificationandcleavage
ofLcrHwasmonitoredbyvisualisationonSDS-PAGE(Section2.2.2.2).
2.2.1.5 GSTAffinitypurificationandcleavageofGST-taggedproteins
ThefilteredsupernatantwasloadedontotheGSTaffinitycolumn(columnvolume=10ml)
andwashedwith 20 column volumes ofGSTwash buffer. LcrH –GST fusion proteinwas
cleavedon the resinovernightat25 °Cbyadditionof thrombinprotease (GEHealthcare,
UK).ThecleavedLcrHwaselutedasaflowthroughintheGSTwashbuffer.TheboundGST-
tagwasremovedfromthecolumnbytheadditionofGSTelutionbuffer.Thecolumnwas
subsequentlywashedwithtwocolumnvolumesof6MGdmHCltounfoldandremoveany
residualproteinsboundtothecolumn.Thecolumnwasimmediatelywashedwith5column
volumesofddH2O,followedby2columnvolumesof20%ethanolandstoredat4°C.
2.2.1.6 PurificationusingSizeExclusionChromatographybyAKTAFPLC
The final step in the purification used size exclusion chromatography using AKTA FPLC
system(GEHealthcare)byloadingthecleavedLcrHproteinfractionsontoaHiLoadTM16/60
SuperdexTM200gelfiltrationcolumn(GEHealthcare,UK)withabedvolumeof120ml.The
columnwasequilibratedwith180mlof50mMphosphatebuffer,5mMDTT,pH7.0.The
cleaved LcrH protein fractions were concentrated using Amicon® Ultra Centrifugal Filter
units(Millipore)andfilteredthrough0.2µmsyringefilter(SartoriusStedimBiotechGmbH,
Germany). Theprotein samples (under10ml volume)were loadedonto the gel filtration
columnwith a 50ml superloop (GE Healthcare). 1 column volume of 50mM phosphate
buffer,5mMDTT,pH7.0wasappliedtothecolumnataflowrateof1ml/min.Fractions
werecollectedin2.5mlaliquots,in30mmtubes.
2.2.2 ProteinPurityMass spectrometry (Section 2.2.2.1) and SDS-PAGE (Section 2.2.2.2) of the proteins
confirmedboththesizeandcheckedthepurity,respectively.InallcasesthepurityofLcrH
proteinswasgreaterthan95%.Thenucleicacidcontaminationoftheproteinwaschecked
bythe280/260nmratio.Aratioof1.6oraboveindicatednocontamination.

71
2.2.2.1 MassSpectrometry
SampleandMatrixpreparation
AfreshsaturatedmatrixsolutionforMALDI-ToFwaspreparedinamicrocentrifugetubeby
dissolvingSinapinicacid(Formulaweight=224.21)in50%acetonitrile,0.1%TFAinddH2O.
The mixture was vortexed for 1 minute and centrifuged for 20 seconds to remove any
undissolvedmatrixfromthesolutionandthecleantopmatrixwasused.Proteinsamplesof
30 µM concentration were given ZipTip® (Millipore) treatment as per manufacturer’s
instructions. Sample and matrix solutions were mixed in the ratio of 1: 4 in a
microcentrifugetube.0.5µLofthemixturewasimmediatelyloadedontoaMALDIplateand
allowedtodryatroomtemperaturepriortoinsertionintothemassspectrometer.
Mass spectra were recorded on a Micromass TofSpec mass spectrometer (Micromass,
Manchester,UK),equippedwithnitrogenUVlaser(337nmwitha4nmpulsewidth).
2.2.2.2 SDS-PolyacrylamideGelElectrophoresis
All solutionsweremade as described in the laboratorymanual [181,182]. SDS-PAGEwas
carried out according to standard protocols using the Laemmli system [182,183]. LcrH
proteinsampleswereresuspendedinSDSloadingbuffer(50mMTris-HCl,pH6.8,100mM
DTT,2%SDS,0.1%bromophenolblue,10%glycerol),boiledfor10minutesandloadedon
an18%SDS-PAGEgelforanalysis.
2.2.3 DeterminationofProteinConcentrationProteinconcentrationwasdeterminedspectrophotometrically,usingtheUV-2401PC-UV-Vis
recordingspectrophotometer,accordingtoEquation2.3.
Equation2.3
𝐶 =𝐴!"# − 𝐴!"#
𝜀𝑙 𝑥 𝑑𝑖𝑙𝑢𝑡𝑖𝑜𝑛 𝑓𝑎𝑐𝑡𝑜𝑟
WhereC is theproteinconcentration inM.Ax is theabsorbanceatx wavelength.𝜀 is the
molarextinctioncoefficient,and𝑙isthecuvettepathlengthincm.

72
Themolarextinctioncoefficientat280nmwavelength,𝜺280 nm iscalculatedbyEquation2.4
[183,184]:
Equation2.4
𝜺!"# !" = (# Trp) (5500) + (# Tyr) (1490) + (# Cys) (125)
Where‘#Trp’referstothenumberoftryptophanresidues,‘#Tyr’referstothenumberof
tyrosineresiduesand‘#Cys’referstothenumberofcysteineresiduesintheprotein.The
molarextinctioncoefficient(𝜺!"# !") fortheLcrHproteinsareasfollows;forfl-LcrH,12,420
M-1cm-1,tr-LcrHandmutantL65ELcrH,10,805M-1cm-1.
2.2.4 StorageofPurifiedProteinTheLcrHproteinsweredialysedinto50mMTris,pH8.0,5mMDTTovernightat4°C.They
werethenconcentratedusingcentrifugalconcentrators(Millipore)to≈100-200µMand1
mlaliquotsinmicro-centrifugetubeswererapidlyfrozenusingliquidnitrogen.Thesamples
werethenstoredat-80°C.
2.3 BiophysicalCharacterizationofLcrHproteinsInallexperiments,50mMphosphate,pH7.0,5mMDTTbufferwasused.Themolarityof
the stock solutionsofureawasdeterminedusing a refractometer (modelNAR-1T,Atago,
Tokyo).
2.3.1 Multimeric state of LcrH proteins using Analytical Size Exclusion
Chromatography(SEC)
InordertodeterminethemultimericstateofLcrHproteins,analyticalSECwasperformed
onanAKTAFPLCsystem(GEHealthcare). Thiswasdoneby injecting100µLofproteinat
concentrationsfrom3µMto100µMin50mMPhosphatebuffer,pH7.0,5mMDTTontoa
SuperdexTM 75 10/30 column and SuperdexTM 200 10/30 column (GE Healthcare). The
columnwaspre-equilibratedwithLcrHbufferbeforeinjectionofproteinsamples.1column
volumeof50mMPhosphatebuffer,pH7.0,5mMDTT,wasappliedata flowrateof0.5
ml/min. For the SEC experiments involving urea denatured protein samples, the column

73
and protein sample was pre-equilibrated for 4 hours and run with the required
concentrationofurea.
2.3.2 AnalyticalUltracentrifugation(AUC)Two types of sedimentation experiment can be performed using an analytical
ultracentrifuge; sedimentation equilibrium and sedimentation velocity. Sedimentation
velocityexperimentsinvolvespinningmoleculesatahighspeedandlookingattherateat
whichthemoleculesmoveinresponsetothecentrifugalforcethatisgenerated.Fromthe
rateatwhich themoleculesmove,asedimentationcoefficientcanbedetermined (as the
centrifugal force is known). Information regarding the shape and sometimes
aggregation/oligomerisation state can be determined, although the latter parameter is
more easily determined by sedimentation equilibrium experiments. In contrast,
sedimentationequilibriumexperiments involvespinningmoleculesatmoderatespeedsso
that centrifugal force causes the protein to sediment gradually, creating a concentration
gradient across the cell, whilst diffusive forces act to oppose the sedimentation forces.
Eventually these two forces are in equilibrium and so no net movement of the
concentrationgradientisobserved.Thisgradientcanthenbemeasuredandfromknowing
howthisconcentrationgradientisaffectedbychangingrotorspeed,molecularmasses(and
henceoligomerizationstates)canbedetermined.Massescanbedeterminedaccuratelyas,
at equilibrium, the concentration distribution is only dependent on the mass of the
sedimentingspeciesandnotonitsshape(unlikeforsedimentationvelocityexperiments).If
aspeciesisself-associating,dissociationconstantscanoftenbeobtainediftheyareinthe
rangemeasurableby the instrument (usuallybetween1μM–0.5mM,dependingon the
absorbance of the molecule in question). All experiments performed on this system are
sedimentationequilibriumexperimentsasthisisthemethodusedwhenanaccurate,shape-
independentmolecularweightisrequired.
Aimee Boyle from School of Chemistry, University of Bristol performed sedimentation
equilibriumexperimentsontheanalyticalultracentrifuge.Theexperimentswereconducted
usingaBeckman-OptimaXL-I analytical centrifuge fittedwithanAn-60Ti rotor. Solutions
werepreparedat40µMproteinconcentrationin50mMPhosphatebuffer,pH7.0,5mM
DTT.Datawasrecordedat25°Cusingspeedsintherange17,000–30,000rpm.Datasets

74
were initially fittedtoasingle, idealspeciesmodelusingtheprogramUltrascan[184,185]
whichemployedtheEquation2.5.
Equation2.5
C 𝑥 = 𝑒𝑥𝑝 !" ! !! !! !! ⊽ ∗ ! !!!!!!
! ! !+ B
Where C(x) is the concentration of peptide as a function of radial position (M), A is the
measured absorbance of the sample, M is the molar mass of the species (Da), ω is the
angular velocity of the rotor (rad s-1), ν is the partial specific volume of the protein in
question (mlg-1),D is thesolventdensity (gml-1),x2 is the radialposition (cm2),xr2 is the
referenceradialposition(cm2),R is thegasconstant (Jmol-1K-1),T is thetemperature(K)
andBisabaselineoffsetwhichcompensatesforanynon-idealityinthedataacquisitionor
thecells.
Thepartial specific volumeof thepeptide (0.7341cm3g-1) and thedensityof the solvent
(1.0042 g cm-3) were calculated using Sednterp. A monomer-dimer equilibrium model
(Equation2.6)wasusedtodeterminetheKDofthespecies.Afitwasdeemedappropriateif
the residuals from the fitwere randomly scatteredandhadan absorbance close to zero.
Anytrendsintheresidualsindicatedadifferentmodelwasrequired.
The monomer-dimer equilibrium model was used for determining the dimerization
dissociation constant KD after performingequilibrium sedimentation is shown in Equation
2.6.
Equation2.6
𝐶! = 𝐶! 𝑅! exp [𝑀𝜑 𝑅! − 𝑅!! + (2
𝐾! ∗𝑀 )[𝐶! 𝑅! ]!exp [2𝑀𝜑 𝑟! − 𝑟!! ]
Where𝐶! isthetotalproteinconcentration,𝑅!isthereferenceradius(cm),𝑅istheradius
(cm) and 𝐶! 𝑅! is the monomer concentration at 𝑅!, 𝑀 is the molecular weight of
monomer,𝜑 =!! !! ⊽ ∗ !!!"
, ω is the angular velocity of the rotor (rad s-1),ν is the partial
specificvolumeoftheproteininquestion(mlg-1),Disthesolventdensity(gml-1),Risthe
gasconstant(Jmol-1K-1)andTistheabsolutetemperature(K).

75
Theproteinconcentration(𝐶!)versusradius(𝑟)plotswereanalysedtodetermine𝐾!ofthe
species according to the above theoretical Equation 2.6 formonomer-dimer equilibrium.
Least squares curve fitting was performed using the Ultrascan software. Errors were
obtainedbyMontoCarloanalysisandgivenwith5%confidencelimit.
2.3.3 DynamicLightScattering(DLS)Dynamic light scattering (DLS), also known as quasi-elastic light scattering (QELS) and
photoncorrelationspectroscopy(PCS), isanon-invasive,well-establishedtechnique inthe
fieldofproteincrystallography.DLSisusedtomeasurehydrodynamicsizes,polydispersities
and aggregation effects of protein samples in solution [185,186]. Apart fromproteins, its
applications include emulsions, micelles, polymers, nanoparticles or colloids. It measures
the size and size distribution of molecules in the submicron region, and with the latest
technologylowerthan1nm.InDLS,alaserbeamilluminatesthesampleandtheBrownian
motionofparticlesormoleculesinsuspensionscattersthelaserlightatdifferentintensities.
AnalysisoftheseintensityfluctuationsyieldthevelocityoftheBrownianmotionandhence
theparticlesizeusingtheStokes-Einsteinrelationship[186,187](Equation2.7).
Equation2.7
𝑅! =𝑘!𝑇6𝜋𝜂𝐷
Where,𝑅! isthehydrodynamicradius,𝑘!isBoltzmannconstant,𝑇istemperature,𝜂isthe
solvent viscosity and 𝐷 is the translational diffusion coefficient (obtained through the
velocityofBrownianmotionbyDLS).
DLS measurements were carried out using Zetasizer Nano S instrument (Malvern
Instruments Ltd). Protein samples were prepared at concentrations of 50 µM in 50 mM
phosphate buffer, pH 7.0, 5mM DTT. For experiments involving urea denatured protein
samples, the protein samplewas pre-equilibrated for 4 hours and runwith the required
concentrationofurea.All sampleswerespunat10,000rpmfor10minutesbefore taking
measurements. The results were analyzed by Zetasizer software version 6.12 (Malvern
InstrumentsLtd).

76
2.4 SecondaryandTertiaryStructureCharacterization
2.4.1 CircularDichroism(CD)SpectroscopyCircular Dichroism (CD) Spectroscopy is a spectroscopic technique where the CD of
moleculesismeasuredoverarangeofwavelengths.CDisthedifferenceintheabsorption
of left and right handed circularly polarised light in chiral (structurally asymmetrical)
molecules andoccurswhenamolecule containsoneormore chiral chromophores (light-
absorbinggroups).DependingontheCDinstrument,thedataarerecordedaseitherasthe
difference in absorbance of right- and left-handed circularly polarised light, △ 𝐴 (𝜆) =
𝐴! 𝜆 − 𝐴!(𝜆),orasellipticity,θobsindegreesormillidegrees.Datainbothformatscanbe
converted to molar values, that is, to the differential molar circular dichroic extinction
coefficient,△ε = εL – εR andtothemolarellipticity,[θ].△ε and[θ]arerelatedbyEquation
2.8.
Equation2.8 𝜽 = 𝟑𝟑𝟎𝟎 � 𝚫𝛆
Itshouldbenotedthattheconcentrationstandardsaredifferentfor 𝜃 andΔε.Δε isthe
differentialabsorbanceofa1mol/lsolution ina1cmcell ,whereas 𝜃 is therotation in
degreesofa1dmol/cm3solutionandapathlengthof1cm.
TheprincipleofCDinvolvesamonochromaticbeamoflightpassingthroughaPhotoElastic
Modulator (PEM) that converts the linear polarised light into alternating left and right
handedpolarisedlight.Thetwopolarisationsaredifferentlyabsorbedbythechiralsample,
and the detector called PhotoMultiplier Tube (PMT) [187-189], detects this difference in
absorptionandconveystheCDsignal.AlongwiththeCDsignal,theCDspectropolarimeter
alsorecordstheHighTension(HT)voltageofthedetector.ThisHTvoltageisameasureof
theamountofvoltagethedetectorisusingandisdependentontheamountoflightstriking
the detector (more light – lower HT voltage). Furthermore, HT voltage is roughly
proportionaltotheabsorbanceofthesample.IftheHTvoltagegoesabove~800Voltsthe
noisewillbecomedisproportionatetothesamplesignalandtheoutputwillbecompletely
unreliable(JascoJ-715SpectropolarimeterOperatingManual).
CDspectroscopyiswidelyusedtostudyarangeofchiralmolecules,butitsmostimportant
applicationisinthestudyoflargebiologicalmolecules.Largely,itisusedforanalysisofthe

77
secondary structure or conformation of proteins, as secondary structure is sensitive to
environment,temperatureorpH.CDcanbeusedtomonitorsecondarystructuralchanges
withenvironmental conditionsor interactionwithothermolecules. Structural, kineticand
thermodynamicinformationaboutproteinscanbederivedfromCDspectroscopy[188-190].
Far-UV(spectralregion190-250nm)CDwasusedtoprobethesecondarystructureofthe
LcrH protein at different protein concentrations and denaturant concentrations. Spectra
wereacquiredoneitheraJascoJ-715CDSpectropolarimeter(JASCO,UK)oraChirascanTM
CD Spectrometer (Applied Photophysics Ltd, UK). All far-UV CD spectra were acquired in
LcrH buffer, at 25 °C. The following pathlengthswere used: 10 or 5mm pathlengths for
proteinconcentrationsat3µM;1,2or5mmpathlengthsforproteinsconcentrationsat6,
12 and 25 µM and 1 mm path length for protein concentrations at 50 µM and 80 µM.
Spectra were recorded from 200 to 300 nm. To compare data, and thus correct for
pathlength and concentration, all ellipticitieswere converted tomolar ellipticity (degrees
cm2dmol-1),showninEquation2.9.
Equation2.9
Ѳ !"#$% =100 ×Ѳ!"# 𝑑 ×𝑚
Where, Ѳ 𝒎𝒐𝒍𝒂𝒓 is molar ellipticty in deg cm2 dmol-1, Ѳ𝒐𝒃𝒔 is the observed CD signal in
millideg,disthecuvettepathlengthincmandmismolarconcentrationofprotein.
2.4.2 FluorescenceSpectroscopyFluorescenceisaphenomenonwhereamolecularsystemabsorbs,thenemitslight.During
absorption, high energy (short wavelength) light excites the system, promoting electron
withinthemoleculetomovefromthegroundstate,totheexcitedstate[190,191].Emission
is observedwhen the excited electron returns from the excited state back to the ground
state. As some energy is always lost by non-radiative processes, such as vibrational
transitions,theenergyoftheemittedlight isalways lowerthanthatoftheabsorbedlight
[191,192].Theenergiesandrelativeintensitiesofthefluorescencesignalsgiveanindication
about the structure and environment of the fluorophores (substances that exhibit
fluorescence).

78
Fluorescence spectrophotometer also called Spectrofluorimeteror Fluorimeter is adevice
formeasurementof fluorescenceofproteins thatcontain intrinsic fluorophores (naturally
occurring fluorophores) such as tryptophan, tyrosine and phenylalanines. A typical
fluorescencespectrophotometercontainsasampleholder,incidentphotonsource(axenon
lamp), monochromators for selecting particular incident wavelengths, focussing optics,
photon-collectingdetectorandacontrolsoftwareunit.Thedetectorisusuallysetat90°to
the light source. A fluorescence emission spectrum is recorded when the excitation
wavelengthisheldconstantandtheemissionbeamisscannedasafunctionofwavelength.
A fluorescence spectrophotometer detects the changes in fluorescence intensity, which
enablesthestudyofthetertiarystructuralchangesofproteinsorbindingoftwomolecules.
Forexample,thewavelengthoftryptophanfluorescencecanbeusedtodeterminewhether
atryptophanis inanaqueousenvironment(longerwavelength)orburieddeepwithinthe
protein(shorterwavelength)[192,193].
All measurements were performed in a thermostatted cuvetter holder at 25 °C using a
Varian Cary Eclipse Fluorescence Spectrophotometer (Agilent Technologies). Tyrosine
fluorescence was employed due the lack of Tryptophan residues in LcrH. The excitation
wavelength was 274 nm and band passes for excitation and emission was 5 nm. The
fluorescentemissionoftheLcrHproteinwasmeasuredfrom294to400nm.Theλmaxof303
nm(emissionwavelengthfortyrosine)wasusedinanalysisunlessotherwisestated.
2.5 EquilibriumStudiesformeasuringThermodynamicStability
2.5.1 GeneralBackgroundThe thermodynamic stability of proteins can be investigated by performing unfolding
studies under equilibrium conditions. These experiments involve unfolding theprotein by
varying one parameter (concentration of chemical denaturant, temperature, pH and
pressure) and utilising a probe (fluorescence and circular dichroism) to measure the
equilibriumproduced.Inthisstudy,chemicaldenaturationswereperformedusingureaand
circulardichroism(Section2.4.1)wasusedtomonitorthechangesinsecondarystructure.
Fluorescence spectroscopy (Section 2.4.2) was used to measure the changes in tertiary
structure.ThefarUVspectrafrom200to300nmmonitoredthesecondarystructureofthe

79
protein. LcrH proteins are alpha helical containing three TPRs in each monomer, thus
depictedinanegativepeakat222nm.
2.5.2 EquipmentandGeneralProceduresAll experiments, unless otherwise stated,were carried out at 25 °C in 50mMPhosphate
buffer,pH7.0,5mMDTT.Allstocksolutionsofureaweremadeusingvolumetricflasks,and
theureasolutionswereflashfrozenandstoredat-20°Ctopreventdegradation.Allprotein
solutions were filtered 0.2µm syringe filter prior to addition to denaturant solutions.
GdmHClandureasolutionswerecheckedbyarefractometer(modelNAR-1T,Atago,Tokyo),
usingEquation2.10andEquation2.11respectively[168,193].
Equation2.10
𝑀𝑜𝑙𝑎𝑟𝑖𝑡𝑦 = 57.1 ∆𝑁 + 38.7 (∆𝑁)! − 91.6 (∆𝑁)!
Equation2.11
𝑀𝑜𝑙𝑎𝑟𝑖𝑡𝑦 = 117.7 ∆𝑁 + 29.7 (∆𝑁)! + 185.5 (∆𝑁)!
Where,∆𝑵isthedifferenceinrefractiveindexbetweenthedenaturantsolutionand50mM
Phosphatebuffer,pH7.0,5mMDTT.
2.5.3 PreparationofSamplesforEquilibriumChemicalDenaturationAstocksolutionofGdmHCl(≈8M)orurea(≈10M)wasdilutedwithddH2O(resistanceof
18.2 Ω) to obtain a large range of denaturant concentrations using a HamiltonMicrolab
dispenser (Hamilton Company). The protein and denaturant stock solutionswere filtered
through0.2µmsyringefilter.Cuvettesofdifferingpathlengthswereuseddependingonthe
protein concentration for the denaturation experiment. Smaller path length cuvette was
used to scanhigher protein concentration samples toprevent saturationof thedetector.
Thepreparationofsamplesfordifferentproteinconcentrationsandtheuseofcuvettesof
suitablepathlengthshavebeendescribedasfollows.

80
2.5.3.1 SamplepreparationforLcrHproteinconcentrations1to12µM
Experimentsinvolvingdenaturationofproteinsamplesfrom1to12µM,a9xstocksolution
ofprotein (9to108µM)andbuffer (450mMPhosphatebuffer,pH7.0,45mMDTT)was
prepared. 100 µL of this 9 x stock solution was added to 800 µL of denaturant sample
resulting in a 1 x concentration of proteins ranging from 1 to 12 µM. Cuvettes of path
lengths10mm(for1µMLcrH),5mm(for3µMand6µMLcrH)and2mm(for12µM)were
usedforperformingfar-UVCDscans.
2.5.3.2 SamplepreparationforLcrHproteinconcentrations25to80µM
A6xstocksolutionofprotein (150to480µM)andbuffer (300mMPhosphatebuffer,pH
7.0,30mMDTT)waspreparedforconductingexperimentsinvolvingproteinsamplesfrom
25 to80µM.50µLof this 6 x stock solutionwasadded to250µLofdenaturant sample
resulting ina1xconcentrationofproteinsranging from25to80µM.The finalconditions
were50mMPhosphatebufferpH7.0,5mMDTT.1mmpath lengthcuvettewasusedto
performfar-UVCDscansforLcrHproteinwithconcentrations25to80µM.
Theprotein/denaturantsolutionswerepre-equilibratedat25°Cforaminimumof4hours
prior toperformingexperimentson theCD. Scanswere taken ina thermostattedcuvette
holderat25°C ±0.2°Candbetween210nmand250nmatascanrateof1nms-1.The
largest difference in signal betweennative anddenatured LcrHwas observed at 222nm,
andthiswavelengthwasusedtomonitorunfolding.Foreasycomparisonofdifferingdata
sets,theCDsignalat222nm(λobs)wasconvertedtorelativespectroscopicsignal(λrel)using
Equation2.12.
Equation2.12
𝜆!"# =𝜆!"# − 𝜆!𝜆! − 𝜆!
WhereλobsistheobservedCDsignal,λNisthesignalofthenativestateandλDisthesignalof
thedenaturedstate.

81
Chapter3 Gene Construction, Purification Strategy and Initial
BiophysicalCharacterisationofLcrHproteins
3.1 IntroductionThis chapter describes the following: (i) gene construction of full length LcrH (fl-LcrH),
truncatedLcrH(tr-LcrH)andmonomericL65ELcrH,(ii)purificationstrategiesofthesethree
constructs and (iii) initial biophysical characterisation - oligomeric state, conditions under
which these oligomeric states were maintained (i.e. abrogation of any aggregation) and
secondarystructurecharacterisation.
3.2 ExperimentalapproachesGeneswereconstructedusingPCRandsitedirectedmutagenesis.Proteinpurificationwas
carried out using affinity and size exclusion chromatography. SDS-PAGE gels and Mass
Spectrometry followed protein purification. Once purified, analytical size exclusion
chromatographywasusedtodetermineoligomericstateandconditionsunderwhichthese
oligomericstatesweremaintained.Finally,proteinsecondarystructurewasanalysedusing
far-UVcirculardichroism(CD).

82
3.3 Results
3.3.1 FulllengthLcrH(fl-LcrH)geneconstructionThefl-LcrHgenesequencewasobtainedfromNCBIReferenceSequence:NC_009595.1
showing507bpregionfrom55032to55538.Thetranslatedproteinsequenceoffulllength
LcrH,comprisingof168aminoacids,isshowninFigure3.1.
1.......10 ........20 ........30 ........40 ........50 ........60 MQQETTDTQE YQLAMESFLK GGGTIAMLNE ISSDTLEQLY SLAFNQYQSG KYEDAHKVFQ ........70 ........80 ........90 .......100 .......110 .......120 ALCVLDHYDS RFFLGLGACR QAMGQYDLAI HSYSYGAIMD IKEPRFPFHA AECLLQKGEL .......130 .......140 .......150 .......160 .....168 AEAESGLFLA QELIADKTEF KELSTRVSSM LEAIKLKKEM EHECVDNP Figure3.1:FulllengthLcrH(fl-LcrH)(a)geneNCBIReferenceSequence:NC_009595.1showing507bpregionfrom a Yersinia pestis CA88-4125 plasmid pCD1 and (b) fl-LcrH protein sequence with accession no.AAA27642inFASTAformat.Sequencesarenumberedinredandaminoacidsareshowninblack.
Thefl-LcrHgenewasconstructedusingrecursivePCR(2.1.1.1)whereeightcodingandnon-
coding oligonucleotides spanning the entire length of the gene were used. Each
oligonucleotide overlapped with its neighbour by 20 bases (Figure 2.1). The resultant
recursivePCRproductwas runon1%agarosegel (2.1.1.1.1)and showeda rangeofDNA
sizesfrom~100–500bp(Figure3.2a).Thisisexpectedandiscausedbyrecombinationand
extension of oligonucleotides by different amounts. In order to obtain a full length LcrH
(a)
(b)

83
genefromtherecursivePCRmixture,aconventionalPCRwasperformedusingtherecursive
PCR product as the template and PCR primers encoding the 5’ and 3’ of the gene with
additionalrestrictionsites(BamHIandHindIIIatthe5’and3’end,respectively)(Figure3.3).
Figure3.2bshowedthatthePCRyieldedDNAbandsof~500bpwhichcorrespondstothe
correctsizeoffl-LcrHgene(504bp).ThePCRproductwasthengelpurified(section2.1.3.2)
andinsertedintopProEXHTb(section2.1.3)andpTrc-GST(section2.1.4)vectorforprotein
expression. DNA sequencing of the genes within the pProEX HTb and pTrc-GST vectors
confirmedcorrectgenesequencehadbeensynthesised.
Figure3.2(a)1%agarosegelofrecursivePCRoffl-LcrHgene.Lane1-recursivePCRproductoffl-LcrHgeneshowingarangeofDNAsizesrangingfrom~100to500bp,lane2-1KbDNAladder.(b)1.5%agarosegelshowingPCRproductoffl-LcrHgene.Lanes1&2containthePCRproductoffl-LcrHgeneshowingDNAbandsof~500bp.Lane3:100bpDNAladder.
Figure3.3SchematicshowingtheincorporatedrestrictionsitesofBamHIandHindIIIatthe5’and3’terminirespectivelyofthefulllengthLcrHgeneusingconventionalPCR.
3.3.2 ProductionandpurificationoffulllengthLcrH(fl-LcrH)ThepProEXHTbvector(section2.1.3)expressedthefl-LcrHasafusionproteinwithanN-
terminal hexahistidine tagged protein. Protein expression was carried out in the E. coli
(a) (b)

84
expression strain BL21 C41 (DE3). The conditions that gave the greatest soluble protein
werefoundtobegrowthat37°CuntilanOD600nmof0.6wasreachedandthen induction
with0.1mMIPTGat27°Cfor14-16hours.Thefl-LcrHproteinexpressionatdifferenttime
pointsisshowninFigure3.4.
Figure3.4:15%SDS-PAGEgelshowingtheproductionofhis-taggedfl-LcrHproteinatdifferenttimepoints.Lanes1,2,3and4arelysedbacterialcellpelletsafterinductionwith1mMIPTGattimet=0hrs,t=2hrs,t=4hrsandt=16hrsrespectively.Lane5–proteinladder.TheproteinproductionwasinducedwithIPTGat16°Candbacterialcellsweregrownovernightbeforeharvestingforproteins.
Native Purification: Fl-LcrH was extracted from the bacterial cells (Section 2.2.1.1) and
subjectedtoaffinitychromatographyusingNi2+column(Section2.2.1.4).Thehis-taggedfl-
LcrH proteinwas eluted (Figure 3.5a) and the his-tag cleaved using TEV protease (Figure
3.5b).Fl-LcrHhasamolecularweightof19KDaandontheSDS-PAGEgelinFigure3.5b,the
cleavedfl-LcrHisobservedasbandof≈20KDa.However,therewasasignificantproportion
offl-LcrHfoundtobepresentintheinsolublepelletaftersonication(inclusionbodies).
Denatured Purification: The insoluble pellet (I) was re-suspended in a denaturing lysis
buffer(1xPBS,pH7.0,6MGdmHCl,10%glycerol,5mMDTT),sonicatedonice,centrifuged
andtheresultantsupernatantwassubjectedtoaffinitychromatographyusingaNi2+column
pre-equilibratedwith5columnvolumesof lysisbuffer.TheNi2+columnwasthenwashed
withreducingconcentrationsofGdmHCltograduallyfoldtheboundproteinsonthecolumn
before finallywashingwith 1 x PBS, pH7.0, 10% glycerol to completely remove the any
trace of GdmHCl. The his-tagged fl-LcrHwas then eluted using the his-tag elution buffer
(section2.2.1.2)andthehis-tagfromtheproteinwascleavedbyTEVprotease(Figure3.5b).
85
Purification of fl-LcrH: Both natively purified and denatured purified cleaved fl-LcrH was
thensubjectedtosizeexclusionchromatographytoremoveresidualTEVproteaseandother
protein impurities(section2.2.1.6).Figure3.5(c)showsthesizeexclusionchromatography
(SEC)profileoffl-LcrHpurification.TheinsetinFigure3.5(c)showstheSDS-PAGEgelofthe
protein fractionseluted from the SECof fl-LcrH. In the SDS-PAGEgel, lane2 contains the
proteinfractionloadedontotheSEC,lanes3-5showhighermolecularweightimpuritiesand
lane6onwards fl-LcrHband~19 kDa canbeobserved. Lanes6&7 showed considerable
amountofhighermolecularweightproteinsco-elutingwithfl-LcrH.TheSDS-PAGEgellanes
8-11 contained relatively higher purity of fl-LcrH protein. Thus, it became clear that the
purified fl-LcrH samples obtained after the final SEC contained higher molecular weight
impurities.Therefore,toincreasepurityto95%anadditionalwashstepwasintroducedin
the nickel column step. Here, the columns were washed with 1x PBS containing low
concentrationofimidazole(5mM)beforeelutionwithhis-tagelutionbuffer.However,the
co-elution of higher molecular weight impurities could not be completely avoided. Both
purification strategies are summarised in Figure3.5andachievedmore than90%purity.
Proteinfractionscorrespondingtothelanes8-11intheinsetFigure3.5(c)werepooledand
concentratedasmorethan90%puritywasachieved.

86
Figure3.515%SDSPAGEgelshowing(a)elutionprofileofhis-taggedfl-LcrH.Lanes fromleft left toright,Lane1–supernatantcontainingsolubleprotein(s),lane2–supernatantfromre-solubilizedinclusionbodies(I),lane3–elutedfl-LcrHfromsolublesupernatant(s),lane4–elutedfl-LcrHfromre-solubilizedinclusionbodies(I),lane5–flowthrough(f/t)from(s),lane6–flowthrough(f/t)from(I),lane7–proteinladder.(b)Cleavage of his-tag from fl-LcrH (combined elutions from soluble supernatant and re-solubilised inclusionbodies) using TEVprotease, lane1-protein ladder, lane2 –uncleavedhis-tagged fl-LcrH, lanes3 and4 –cleavedfl-LcrH.(c)Sizeexclusionchromatographyprofileofcleavedfl-LcrH,thechromatogramshowingtheelutionoffl-LcrHandthe15%SDS-PAGEgel(inset)showingtheelutedproteinfractions.Lanesfromlefttoright, lane 1& 12–protein ladder, lane 2 – cleaved fl-LcrH sample loadedon the FPLC, lane 3-11: elutedprotein fraction from SEC. The protein fractions loaded onto the SDS-PAGE gel are shown as thecorrespondinglanenumbersontheSECchromatogram.
(a) (b)
(c)

87
Inordertoattainhigherlevelsofproteinpurity,thefl-LcrHgenewasinsertedinpTrc-GST
expression vector (section 2.1.3). The pTrc-GST vector produces the fl-LcrH as an N-
terminallyGSTtaggedfusionprotein(section2.2.1.5).Asbeforethevectorwastransformed
inBL21C41(DE3)expressionstrainofE.coliandgrowninanidenticalmannertothatused
forproducinghis-taggedfl-LcrHmentioned i.e.bacterialgrowthat37°Cuntil reachingan
O.D600 nm of 0.6. However, expressionwas inducedwith 0.1mM IPTGat 16 °C for 14-16
hours. The fl-LcrH protein was then extracted from bacterial cells (section 2.2.1.1) and
subjected to affinity purification by passing it through a column containing glutathione
agarose resin pre-equilibratedwithGSTwash buffer (section 2.2.1.3). Thrombin protease
wasaddedtotheresinboundwiththeGST-fl-LcrHfusionproteinforcleavageoncolumnin
ordertoseparatetheGSTtagfromfl-LcrHprotein.Thefl-LcrHelutedfromthecolumnasa
flow through while the GST tag remained bound to the glutathione agarose resin. The
proteinproductionandpurificationofGST-taggedfl-LcrHfollowedbythrombincleavageis
showninFigure3.6.
Figure 3.6 (a) 18 % SDS-PAGE showing the protein production and elution profile of GST-tagged fl-LcrHprotein.Lanesfromlefttoright:lane1-lysedcells,lane2–supernatantprotein,lanes3&4–GST-fusionfl-LcrHproteinboundtotheglutathioneagaroseresin,lanes5&6–cleavedGSTtagboundtotheglutathioneagaroseresin,lanes7&8–fl-LcrHprotein,lane9–proteinmarker.TheGSTtagwascleavedusingthrombinproteasetoachievefl-LcrHproteinof≈19kDa.(b)Chromatogramshowingsizeexclusionprofileoffl-LcrHusing S200 16/60 column. The fl-LcrH protein fractions from 60 – 110mlwere pooled and concentratedfurther.
(a)
(a) (b)

88
The fl-LcrH protein bands of ≈ 19 kDa can be clearly observed in the 18% SDS-PAGE gel
(Figure3.6a)aftercleavagewiththrombinprotease.Theaffinitypurifiedfl-LcrHproteinwas
further concentrated and subjected to size exclusion chromatography for removal of
thrombin (Figure 3.6b). The fl-LcrH protein obtained using the GST-tagged fl-LcrH fusion
method was easier to purify, provided a greater yield and was of higher purity in
comparisontohis-taggedfl-LcrH(>95%vs.<90%,respectively).
3.3.3 TruncatedLcrH(tr-LcrH)Afterthesuccessfulexpressionandpurificationoffl-LcrH,itprovedtoberelativelyunstable
and prone to aggregation on concentrating (discussed more fully later in this chapter).
Moreover, soonafterwehadpurified fl-LcrH the crystal structureof SycDwaspublished.
ThisisthesameproteinasLcrHbutfoundinYersinaenterocolitica.Thesequenceidentity
ofbothproteinsisextremelyhighwithonlytwovariantaminoacidpositions(position136
and138–Figure3.7a). Importantly, thepapershowedthat theconstructused toobtain
crystalswasashortenedversionofSycD(tr-SycD)thatwasmorestableand lessproneto
aggregation. This shortened construct spanned fromposition21 to 163. TheN-terminal
deletionremovedamostlyunstructuredregion,whereastheC-terminaldeletionremoveda
solventexposedcysteine. Itwasthereforedecidedthatweshouldalsoobtainatruncated
LcrH(tr-LcrH).
Sequence 1........10........20........30........40........50........60 SycD MQQETTDTQEYQLAMESFLKGGGTIAMLNEISSDTLEQLYSLAFNQYQSGKYEDAHKVFQ tr-SycD --------------------GGGTIAMLNEISSDTLEQLYSLAFNQYQSGKYEDAHKVFQ fl-LcrH MQQETTDTQEYQLAMESFLKGGGTIAMLNEISSDTLEQLYSLAFNQYQSGKYEDAHKVFQ tr-LcrH --------------------GGGTIAMLNEISSDTLEQLYSLAFNQYQSGKYEDAHKVFQ Sequence .........70........80........90........100.......110.......120 SycD ALCVLDHYDSRFFLGLGACRQAMGQYDLAIHSYSYGAIMDIKEPRFPFHAAECLLQKGEL tr-SycD ALCVLDHYDSRFFLGLGACRQAMGQYDLAIHSYSYGAIMDIKEPRFPFHAAECLLQKGEL fl-LcrH ALCVLDHYDSRFFLGLGACRQAMGQYDLAIHSYSYGAIMDIKEPRFPFHAAECLLQKGEL tr-LcrH ALCVLDHYDSRFFLGLGACRQAMGQYDLAIHSYSYGAIMDIKEPRFPFHAAECLLQKGEL
Sequence .........130.......140.......150.......160....... SycD AEAESGLFLAQELIANKPEFKELSTRVSSMLEAIKLKKEMEHECVDNP tr-SycD AEAESGLFLAQELIANKPEFKELSTRVSSMLEAIKLKKEMEHE----- fl-LcrH AEAESGLFLAQELIADKTEFKELSTRVSSMLEAIKLKKEMEHECVDNP tr-LcrH AEAESGLFLAQELIADKTEFKELSTRVSSMLEAIKLKKEMEHE-----
(a)

89
Figure 3.7: (a) Multiple sequence alignment of protein sequences of SycD and tr-SycD from Yersiniaenterocolitica(bothshowninblack)withfl-LcrHandtr-LcrH(bothshownindarkred)fromYersiniapestis.Asparagine‘N’inSycDandtr-SycDisasparticacid‘D’bothinfl-LcrHandtr-LcrHandishighlightedinyellow.Proline‘P’inSycDandtr-SycDisThreonine‘T’bothinfl-LcrHandtr-LcrHandishighlightedinturquoise.The65thLeucineresidueishighlightedingreenandwaschangedtoGlutamicacidtoobtainmonomerictr-SycDandL65E tr-LcrH.Aminoacidsequencenumbersareshown in red.This figurewasgeneratedbyClustalWmultiplealignmentsoftware.(b)Ribbonrepresentationofhead-to-headconformationofdimericSycD21-163
(tr-SycD) fromYersiniaenterocoliticawhich is99% identical totr-LcrHfromYersiniapestis. tr-LcrHdiffersfromSycDinonlytwopositions(N136DandP138T).AsparagineandProlineataminoacidpositions136and138areshowninyellowandbluespheresrespectively.The65thleucineresidueisshowningreenspheresand wasmutated to glutamic acid to obtain themonomeric L65E LcrH. Chains A and B of SycD21-163 arecolouredcyanandredrespectively.FigurewaspreparedusingPyMOL.
Thetr-LcrHgenewasconstructedbyPCRwiththefl-LcrHgeneastemplateandaforward
primerstartingattheDNAcodonsofthe21staminoacidandareverseprimerstartingfrom
DNA codons of the 163rd amino acid (Figure 3.8). Both primers possessed a BamHI and
HindIII restriction sites, respectively for insertion into the pTrc-GST expression vector
(Section2.1.4).
(b)

90
Figure3.8Schematicrepresentingtheconstructionoftr-LcrHthroughPCRusingfl-LcrHastemplate,forwardprimerspanningtheDNAencoding21staminoacidwithBamHIrestrictionsite,reverseprimerspanningtheDNA encoding the 163rd amino acid which also included a stop codon and HindIII restriction site. TheresultantPCRproductobtained isshownastheshortenedtr-LcrHspanningaminoacids fromposition21-163.
ThepTrc-GSTvectorinsertedwithtr-LcrHgenewastransformedintoXL-1BluestrainofE.
coli (section 2.1.3.4) followed by isolation of DNA from individual colonies. This was
followedbyrestrictiondigestionoftheisolatedDNAusingBamHIandHindIII(section2.1.4)
inordertoscreenthecoloniesthatyieldedDNAcontainingcorrectlysizedinsert.Thosewith
aDNAsizeof~430basepairs(Figure3.9)weresentforDNAsequencing.DNAsequencing
confirmedthattr-LcrHgenewassuccessfullycloned inpTrc-GSTvector (section2.1.2.1.7).

91
Figure 3.9 1.5 % agarose gel showing restriction digestion of tr-LcrH gene from pTrc-GST vector. Lane 1shows100bpDNAladder.Lanes2,3,4,7,9and10showDNAbandof~430bpcorrespondingtocorrectsizeoftr-LcrHgene.
3.3.4 Expression&PurificationofTruncatedLcrH(tr-LcrH)AsbeforethepTrc-GSTvectorcontainingthetr-LcrHgenewastransformedintoBL21C41
(DE3) expression strain ofE. coli to produceGST-tagged tr-LcrH protein. The protocol for
GST-taggedtr-LcrHproteinproductionwasidenticaltothatusedfortheproductionofGST-
taggedfl-LcrHproduction(Section2.1.4).TheproteinproductionandelutionprofileofGST-
taggedtr-LcrHisshowninFigure3.10(a).TheGST-tagwascleavedoffthetr-LcrHproteinby
usingthrombinproteasegivingabandof≈16kDashowninFigure3.10b.
Figure3.1018%SDS-PAGEgel showing (a)proteinproductionofGST-taggedtr-LcrH:Lane1– lysedcells,lane2–supernatantprotein, lane3–proteinmarker, lane4–flowthrough, lane5–wash, lanes6&7–GST-tagged tr-LcrH bound to glutathione agarose resin, lane 8 – proteinmarker. (b) Cleavage of GST tagfromtr-LcrHusingthrombinprotease.Lane1–GST-taggedtr-LcrHboundtotheglutathioneagaroseresin,lanes2-4–thrombinprotease inducedcleavageforseparationofGSTtagfromtr-LcrHontheglutathioneagaroseresin,lane5–proteinmarker.
(a) (b)

92
Thetr-LcrHproteinwasconcentratedandfurthersubjectedtopurificationbysizeexclusion
chromatography (Section 2.2.1.6), which ensured the removal of thrombin protease and
enabled to achieve more than 95 % purity. The protein samples eluted from the size
exclusionchromatographyweloadedonan18%SDS-PAGEgel(Section2.2.2.2)tocheckfor
thelevelofpurity,showninFigure3.11.Thetr-LcrHproteinsampleselutedfromthesize
exclusionchromatographycolumnshowedbandsof≈16kDamorethan95%purity.Thus,
tr-LcrHwassuccessfullyproducedandpurified.
Figure3.11: (a) Sizeexclusion chromatographyprofileof tr-LcrHusingS20016/60 column. (b)18%SDS-PAGEgel showing tr-LcrHprotein samplespurifiedby sizeexclusionchromatography. Lanes1 to8are tr-LcrHSECfractionsfrom70mluntil110mlwitheachfractionof5mlvolume.
3.3.5 ConstructionofL65Etr-LcrHThestudythatdescribedthecrystalstructureofSycD(andthusobviouslyLcrH)alsoshowed
thatasingleaminoacidmutationcouldrendertheSycDdimermonomeric[168,194].This
mutation was L65E (Figure 3.7). It was, therefore, important that we also obtained this
monomericversionofLcrH.ToobtainLE65tr-LcrHsitedirectedmutagenesiswasperformed
on the pTrc-GST expression plasmid containing the tr-LcrH gene (Section 2.1.5).
Confirmationof themutationwasobtained throughDNAsequencingbyBeckmanCoulter
GenomicsLtd.(Section2.1.2.1.7).
(a) (b)

93
3.3.6 ExpressionandPurificationofL65Etr-LcrHTheproteinwasproducedusing theprotocol identical to thatused for theproductionof
GST-tagged fl-LcrH (Section 3.3.2) and GST-tagged tr-LcrH (Section 3.3.3) proteins. The
proteinsampleswereloadedontoan18%SDS-PAGEforanalysisandFigure3.12showsthe
protein production, affinity purification and cleavage of the GST tag using thrombin
protease.
Figure 3.12: (a) Size exclusion chromatography elution profile of L65E tr-LcrH using Superdex 200 16/60column.Elutedproteinfractionsfrom70-115mlwerepooledandconcentratedfurther.(b)18%SDS-PAGEgelshowingtheGST-taggedL65Etr-LcrHproduction,itsaffinitypurificationprofileandcleavageofGSTtagusingthrombinprotease.Lane1–proteinladder,lane2–lysedcells,lane3–supernatantprotein,lane4–flowthrough, lanes5&6– resinsampleshowing theboundGST-taggedL65E tr-LcrH, lanes7&8– resinsample showing the thrombin cleavage of GST-tagged L65E tr-LcrH, lanes 9 &10 – eluted L65E tr-LcrHshowingaband≈16KDa,identicaltotr-LcrHprotein.
TheelutedL65Etr-LcrHaftercleavageofGST-tagshowedapureL65Etr-LcrHbandof≈16
kDa,identicaltotr-LcrH(Figure3.11(b)).L65Etr-LcrHwasthensubjectedtosizeexclusion
chromatographyfortheremovalofthrombinproteaseandachievemorethan95%purity.
Importantly, the sizeexclusionchromatography showed that the LE65mutantelutedata
larger volume than tr-LcrH (~95ml vs~80ml). This is consistentwith LE65 tr-LcrHbeing
monomericandtr-LcrHbeingdimeric.
(a) (b)

94
3.3.7 InitialcharacterizationofLcrHconstructs
3.3.7.1 Definingbuffer&proteinconcentrationstomaintain“native”oligomeric
statesofLcrHconstructs
During the purification of all LcrH constructs it was obvious that they were prone to
aggregation. This manifested itself mainly during concentration steps where: (i) protein
concentrationwaslostand(ii)UV-Visabsorbanceshowedhighsignalat320nm.Therefore
itwasimportanttodefinesuitablebufferandproteinconcentrationsconditionswerethey
wouldremainin“native”oligomericstates.
Buffer conditionswere chosen by: (i) calculating the isoelectric point (pI) of the proteins
usingtheExPASy–ProtParamtool[166-168,194]and(ii)choosingapHthatwas2pHunits
awayfromthepI.ThetheoreticalpIoftheproteinsisasfollows:4.70forfl-LcrH,4.95fortr-
LcrHand4.87forL65Etr-LcrH.Thus,50mMphosphatebufferatpH7.0waschosen(this,
fortuitously,alsoemulatedphysiologicalconditions).Phosphatebufferwasalsochosenasit
can specifically stabilise certain proteins. In addition 5 mM DTT was added to prevent
disulphidebondformation.
To determine what protein concentrations these buffer conditions enabled (i.e. no
aggregation was observed) the proteins were firstly concentrated until protein loss was
observedthroughgainofUVabsorbanceat320nmand lossat280nm.Thehighestnon-
aggregatingconcentrationsforfl-LcrH,tr-LcrHandLE65tr-LcrHwere300µM,500µMand
150µM,respectively.Toconfirmwhethertheseconditionswerestableover1week,each
protein was concentrated to the aforementioned value and subjected to analytical SEC
(Section 2.3.1). Theywere then stored at 4 °C for oneweek and then analytical SECwas
repeated.Figure3.13showstheanalyticalSECtracesforeachLcrHproteinbeforeandafter
1weekat4°C.

95
Figure 3.13 Analytical size exclusion chromatography profile of LcrH proteins using SuperdexTM 75 10/30columnbeforeandafter1week:(a)fl-LcrHat300µM,(b)tr-LcrHat500µMand(c)L65Etr-LcrHat150µM.TheelutionprofileinblackdenotesthefirstanalyticalSECrunfortherespectiveLcrHproteinsamplesattheaforementionedprotein concentrations.Theelutionprofile in reddenotes theanalytical SECof the sameproteinsamplesstored for1weekat4 °C.TPRstandards:CTPR3 (blue)andCTPRa6 (green).Eachproteinsampleattherespectiveconcentrationswasloadedusing100µlsampleloopin50mMPhosphate,pH7.0,5mM DTT at 25 °C. Figure was prepared using KALEIDAGRAPH 4.0.
Figure3.13(a)didnotshowanyevidenceofaggregationintheproteinsamples.Theelution
peakforbothsamplesi.e.beforeandafterstorageat4°Cwas≈9.8ml.However,atailing
peakat≈11-13mlwasobserved inbothsampleruns,whichcanbeattributedtoprotein
degradation.Figure3.13 (b) shows theanalyticalSECprofile for tr-LcrHat500µMbefore
and after storage at 4 °C. The elution profile for both sample runs was identical. The
(a)
(c)
(b)

96
difference in the absorbance peaks between the two samples could be attributed to the
variability in sample runs. The analytical SEC profile for L65E tr-LcrH at 150 µM was
indistinguishableforbothsampleruns.Theelutionvolumeforbothsamplerunswas≈10.8
ml. Additionally, the elution volumes of both tr-LcrH and fl-LcrH are close to that of the
dimericTPRstandardCTPRa6(10.55ml).Thus,confirmingthedimericoligomericstateoftr-
LcrHandfl-LcrH.Figure3.13(c)representstheanalyticalSECprofileofmonomericmutant
L65Etr-LcrH.BothelutionprofilesforL65Etr-LcrHarenearlyidentical.Theelutionprofiles
givesanindicationofaggregation(smallelutionpeaksbeforethevoidvolume(Vo)=8.5ml)
andsomedegradationproducts(tailingpeaks)inbothsampleruns.
On comparing the analytical SEC profile of LcrH proteins at their respective protein
concentrations it was observed that over the course of one week the proteins did not
undergo significant changes. This confirmed that the highest non-aggregating protein
concentrations determined for each of LcrH protein constructs and the buffer conditions
usedwerestableovertime.Ascanbeseenallproteinswerestableoverthistimecourseat
their respectiveconcentrationswith little lossofprotein.Thiswasconfirmedbyobtaining
the concentrationof eachprotein byUV-Vis absorbance at 280nmbefore and after one
weekat4°C.
Theelutionprofilesoftheproteinsamplesbeforeandafteroneweekstorageat4°Cwere
identical.Forfl-LcrH,tr-LcrHandL65Etr-LcrHthisequatedtopeakelutionvolumesof~9.6
ml, ~9.8 ml and ~10.8 ml respectively. The tailing peak in the fl-LcrH elution profile is
consistentwithslightdegradation(similarinbothruns).Theslightdifferenceinthesizeof
theelutionpeaks issimplyduetothevariabilityoftheUV-VisdetectoroftheAKTAFPLC.
TheproteinconcentrationwasconfirmedbyobtainingUV-Visabsorbanceat280nmofeach
protein before and after one week prior to each analytical SEC run. Interestingly, a
differenceinsizeoftheelutionpeaksofLcrHproteinswasobserved.ThepeaksizesforLcrH
proteinswere in the followingorder: fl-LcrH>tr-LcrH>L65E tr-LcrH. This is suggestiveof fl-
LcrHandtr-LcrHbeingdimericandL65Etr-LcrHmonomeric(discussedinChapter4).

97
3.3.7.2 Far-UVcirculardichroismofnativeLcrHconstructs
ToconfirmthattheconditionsusedaboveproducedcorrectlyfoldedLcrHconstructsfar-UV
CDspectrawereobtained(section2.4.1).Figure3.14showsthenativeandureadenatured
far-UVCDspectraof fl-LcrH,tr-LcrHandL65Etr-LcrHat3µM(spectrameasured in5mm
path length cuvette) and 50 µM (spectra measured in 1 mm path length cuvette)
respectively. The native spectra clearly show correctly alpha-helically folded protein, as
theypossessminimaat222nmand208nm.Interestinglythefl-LcrHhasapproximately10
% greater signal at 222 nm than both tr-LcrH and its LE65mutant (which are identical).
When8MureaisaddedtoLcrHproteinsthereisacompletelossofsecondarystructureas
shownbythedisappearanceoftheminimaat208&222nm.
Figure 3.14 Far-UV CD spectra comparing native fl-LcrH (black), tr-LcrH (blue). L65E tr-LcrH (green) anddenaturedL65Etr-LcrH in8Murea (red) forconcentrations: (a)3µM(spectrameasuredusing5mmpathlengthcuvette)and(b)50µM(spectrameasuredusing1mmpath lengthcuvette)ThedetectorontheCDspectrophotometerbecame saturatedwithHT voltageexceeding850 volts after 212nm for samples in 5mm cuvette and after 208 nm for samples in 1 mm path length cuvette. Figure was prepared usingKALEIDAGRAPH4.0.
IntheaboveFigure3.14, far-UVCDspectraforLcrHproteinsamplesat3μMand50μM,
were masked beyond wavelengths at 212 nm and 208 nm respectively because the HT
voltageof thedetectorof theCDspectropolarimeter increasedtoabove800volts.This is
becauseiftheHTvoltagegoesabove~800voltsthenoisebecomesdisproportionatetothe
sample signal and the output is completely unreliable (Section 2.4.1 and Jasco J-715
SpectropolarimeterOperatingManual).
(b)(a)

98
3.3.8 ConclusionThe three protein constructs of LcrH – fl-LcrH, tr-LcrH and L65E tr-LcrHwere successfully
producedandpurified.Wewereable todefine suitablebuffer andprotein concentration
conditions formaintenanceofnativeoligomeric statesof the respectiveproteins through
analyticalsizeexclusionchromatography.Far-UVCDspectroscopyenabledtoconfirmthat
theconditionsusedproducedcorrectlyfoldedproteins.Inthefollowingchapterweexplore
theoligomericstatesandthermodynamicstabilityofLcrHproteinconstructs.

99
Chapter4 Oligomeric State, Flexibility and Thermodynamic
StabilityofLcrHproteinconstructs
4.1 IntroductionInthischapterweexploretheoligomericstate,flexibilityandthermodynamicstability
ofeachofourconstructsofLcrH.Theseinvestigationsenablethedissectionoftherole
ofoligomericstateandstabilityonLcrH’sbiologicalfunction.
4.2 ExperimentalApproachesThemonomer-dimerequilibriumandtheoligomericstateofthedifferentconstructsof
LcrH was determined by analytical size exclusion chromatography, dynamic light
scattering and analytical ultracentrifugation We then examine the thermodynamic
stability and flexibility of our different LcrH constructs by performing equilibrium
unfolding through chemical denaturation. The unfolding was monitored by far-UV
circulardichroismandfluorescencespectroscopyasprobesforsecondaryandtertiary
structuresrespectively.
4.3 Results
4.3.1 Oligomeric States of LcrH using Analytical Size Exclusion
Chromatography(SEC)
ClassIIchaperonesofthetypethreesecretionsystem(TTSS)ingramnegativebacteria
Yersinia, ShigellaandPseudomonas species have been shown to be homodimeric in
solution[166-168,195].InChapter3weobtainedconditionswherefl-LcrH,tr-LcrHand
L65E tr-LcrH were ‘’stable’’ (i.e. maintained a ‘‘native’’ oligomeric state). These
experiments were carried out at high concentrations and gave elution profiles in
analyticalSECofdimericsizeforfl-LcrHandtr-LcrHbutmonomericforL65Etr-LcrH.To
qualitatively probe themonomer-dimer equilibrium of fl-LcrH and tr-LcrH, analytical

100
SEC was performed over a range of protein concentrations. LcrH is a non-globular
proteinwitheachmonomericunitcomprisingof3.5modulartetratricopeptiderepeats
(TPRs). Thus, two non-globular protein standards – CTPR3 (3.5 continuously arrayed
TPRmotifs)andCTPRa6(6.5continuouslyarrayedTPRmotifs)werechosenasprotein
standards for comparing the molecular sizes. The crystal structure of SycD (99%
identical to LcrH) shows that the dimeric form of the protein produces a ‘’head-to-
head’’dimer.Thus,dimericLcrHshouldhaveasimilarsizetothatofCTPRa6.Whereas
the monomeric LcrH (L65E tr-LcrH) should elute with size similar to that of CTPR3
(Figure4.1).
Figure4.1Ribbonrepresentationofthecrystalstructuresof(a)head-to-headconfirmationofdimericSycD21-163 [Protein Data Bank (PDB) entry: 2VGX], chains A and B are shown in cyan and redrespectively,(b)CTPR3(PDBentry:1NA0),(c)CTPRa6.ThefigurewaspreparedusingPYMOL.
Figure4.2(a)andFigure4.2(b)showtheanalyticalSECprofileforfl-LcrHandtr-LcrH
from3–100µMrespectively.Theseshowthatathigherconcentrations(100µM),fl-
LcrH and tr-LcrH eluted with volumes of 9.7 ml and 9.6 ml respectively, and were
consistentwithahomodimericstructure(incloseagreementwithanelutionpeakof
9.6 ml for the designed TPR protein CTPRa6 containing 6.5 stacked repeats).
(a)
(b)
(c)

101
Interestingly, when the protein concentrations were lowered to more physiological
concentrations i.e.from100µMto3µM,theelutionvolumesforfl-LcrHandtr-LcrH
wereobservedtoshifttothatofamonomericsizedprotein.Thelowestconcentration
of3µMfortr-LcrHelutedat10.7ml,whichwasidenticaltotheelutionvolumeof10.7
ml formonomeric L65E tr-LcrHand similar to elution volumeof 10.55ml forCTPR3
protein(containing3.5stackedrepeats).
Figure 4.2 Analytical size exclusion chromatography profile of fl-LcrH (a) and tr-LcrH (b) usingSuperdex 75 HR 10/30 column at protein concentrations of 100 µM (red), 50 µM (blue), 25 µM(brown),12µM(green),6µM(purple)and3µM(orange).Forcalibration, twoprotein standards–CTPRa6andCTPR3were also run. CTPRa6 is a designedTPRprotein that contains 6.5 continuouslyarrayedTPRmotifs.CTPR3isalsoadesignedTPRproteinthatcontains3.5continuouslyarrayedTPRmotifs.Boththeproteinstandardsarecolouredblack;withcTPRa6havingelutionvolumeof9.6mlandcTPR3showsanelutionvolumeof10.55ml.MonomericL65Etr-LcrHisshowningreyandhasanelution volumeof 10.7ml. In the respective inset figures, theelution volumesof LcrHproteins areplotted against their respective protein concentrations. Figure was prepared using KALEIDAGRAPH4.0.
(a)
(b)

102
ThechangeinelutionprofileshowsthatLcrHispresentinmonomer-dimerequilibrium
at physiological protein concentrations and therefore has a relatively weak
dimerisation interaction. It also suggests that its KD value should be in the low
micromolarrange.
4.3.2 DeterminationofDimerizationDissociationConstant(KD)using
AnalyticalUltracentrifugation(AUC)
Theprevioussectionsuggestedthatthedimerizationdissociationconstant(KD)should
beinthelowmicromolar(µM)concentrationrangefortr-LcrHandfl-LcrH.Inorderto
accurately determine the KD value, equilibrium sedimentation by analytical
ultracentrifugation for tr-LcrH was performed (section 2.3.2, Figure 4.3).
Figure 4.3 Equilibrium Analytical Ultracentrifugation (AUC) for tr-LcrH, the figure shows (a) therepresentative curve obtained from equilibrium sedimentation using analytical ultracentrifugationdenotedbyblackdotsandthelineofbestfit(red)toamonomer-dimerequilibriummodelusingtheprogramUltrascan,(b)fittedresidualsshownbyblackfilledcircles.
(a)
0
(b)
0

103
From Figure 4.3 (b), it can be observed that the residuals from the fit appear to be
scattered randomly and have an absorbance close to zero. This deemed the fit
appropriate.Noothertrendscanbeobservedintheresidualssodoesnotneedtobe
fittedtoanothermodelexceptthemonomer-dimerequilibriummodel(Equation2.6).
Multiple curves from the equilibrium sedimentation experiment were fitted and
calculations were carried out using the Equation 2.6. This gave a dimerization
dissociation constant 𝐾! of 15 ± 5 µM. The errors and confidence limits were
calculatedasmentionedinsection2.3.2.
4.3.2.1 Calculatingpercentageofdimeratagivenproteinconcentration
Afterdeterminingthedimerizationdissociationconstant𝐾!fortr-LcrH,thepercentage
oftheproteinpopulationthatisdimericcanbecalculatedasfollows:
The monomer-dimer chemical equilibrium at a given protein concentration can be
illustratedbytheEquation4.1below.
Equation4.1
𝑀 +𝑀 ⇌ 𝐷
Where D is the dimer and M is the monomer. Thus, the dimerization dissociation
constant𝐾!ofthisequilibriumis:
Equation4.2
𝐾! = 𝑀 [𝑀][𝐷] =
[𝑀]!
[𝐷]
Thetotalproteinconcentration (𝐶!)forthedimericsystemcanbewrittenas:
Equation4.3
[𝐶!] = M + 2[D]
RearrangingEquation4.3andsolvingforMgives
Equation4.4
𝑀 = 𝐶! − 2 𝐷

104
SubstitutingEquation4.4intothe𝐾!expression(Equation4.2)gives
Equation4.5
𝐾! = (𝐶! − 2𝐷)(𝐶! − 2𝐷)
𝐷
SolvingtheaboveEquation4.5intoquadraticformgives:
Equation4.6
𝐷 = 4𝐶! + 𝐾! ± (8𝐶! ∗ 𝐾! + 𝐾!
!)
8
Fractionofdimericspecies(𝐹!)atanygivenproteinconcentrationcanbedefinedby:
Equation4.7
𝐹! = 2[𝐷][𝐶!]
‘𝐹!′isthefractionoftotal‘D’(dimer),whichcanvaryfrom0to1and′𝐶!′isthetotal
proteinconcentration.
Thus,bysubstitutingEquation4.6inEquation4.7weobtain:
Equation4.8
𝐹! =4𝐶! + 𝐾! ± (8𝐶! ∗ 𝐾! + 𝐾!
!)
4[𝐶!]
A saturation-binding curve of 𝐹! (fraction of total dimer) vs 𝐶! (total protein
concentration)usingEquation4.8withthedimerizationdissociationconstant𝐾!value
of15µMwasplotted(Figure4.4).

105
Figure4.4Saturationbindingcurvefordimerizationoftr-LcrHshowingagraphofYvs𝑪𝑻,whereYisthefractionoftotalpossibledimerwhichvariesbetween0to1,𝑪𝑻isthetotalproteinconcentration(µM)andthedimerizationdissociationconstant𝑲𝑫=15±5µM.
ThecurveinFigure4.4ishyperbolicwithhalf-maximaldimerformationoccurringata
totalproteinconcentrationof𝐶! =𝐾!.Itcanalsobenotedthatevenatatotalprotein
concentration of 600 µM, which is 40-fold greater than𝐾!, only 90 % of the total
possible dimer (D) is formed (𝐹!= 0.90).When𝐶! = 90 µM, 75% of the protein is
dimeric (𝑌 = 0.75). The percentages of dimer at protein concentrationswewill use
laterareshowninTable4.1.Thetableshowsthatevenatlowerconcentrationsoftr-
LcrHthereissomedimerpresent.
Table4.1:Dimerpercentagesatresepectiveproteinconcentrationsoftr-LcrH
TotalProteinConcentration(µM)
PercentageofDimer(%)
1 113 236 3412 4625 5850 6880100
7476
The table shows percentages of dimer population of tr-LcrH at the given total protein concentrations (µM). Thedimer percentages have been rounded up to the nexthighestnumber.

106
4.3.3 Loss of LcrH’s α-Helical Structure on N-terminal Deletion and
ConcentrationReduction
As LcrH is a completely α-helical protein, far-UV CD provides an excellent probe for
monitoring its secondary structure in solution. In the previous chapterwe observed
that under our conditions all LcrH constructs exhibit strong α-helical signals with
indicativeminima at 208 and 222 nm. Thus, to probewhether any structure is lost
betweenfl-LcrHandtr-LcrHortransitionfromdimertomonomer,far-UVCDspectra
were recorded for protein concentrations of 3 – 100 µM. The CD ellipticity at each
concentration was converted to molar ellipticity (Equation 2.9) for ease of data
comparison and to correct for path length and protein concentration (Figure 4.5).
Figure4.5far-UVCDspectrashowingmolarellipticityfrom200to300nmfornativefl-LcrH(a)andtr-LcrH (b) at concentrations of 100 µM (red), 50 µM (blue), 25 µM (brown), 12 µM (green), 6µM(purple),and3µM(orange).FigurewaspreparedusingKALEIDAGRAPH4.0.
Interestingly,weobservedareductioninthesignal(molarellipticityat222nm)when
tr-LcrHwas comparedwith fl-LcrH andwhen the concentrationof eachproteinwas
decreased.Ineachcasethechangewassmallasfollows:at50µM,fl-LcrHandtr-LcrH
(a)
(b)

107
havemolar ellipticities at 222 nm of -3.1 × 10⁶ and -2.7 × 10⁶ degrees cm2 dmol-1,
respectively,andat3.1µM,fl-LcrHandtr-LcrHhavemolarellipticitiesof-2.8×10⁶and
-2.5 × 10⁶ degrees cm2 dmol-1, respectively. In both comparisons this equates to a
maximal change of ≈ 10%. The reduction of α-helical signal from fl-LcrH to tr-LcrH
suggestedthattheN-terminal20aminoaciddeletionofLcrHremovessomeα-helical
structure. The loss of α-helical signal with a decrease in protein concentration is
consistent with the weak monomer/dimer equilibrium i.e. the reduction in
concentrationofLcrHresultsinamonomericstate,whichislessα-helicallystructured
thanthedimer.
4.3.4 EquilibriumUnfoldingandThermodynamicStabilityofLcrHTodeterminetheflexibilityandthermodynamicstabilityoffl-LcrH,tr-LcrHandL65Etr-
LcrHequilibriumchemicaldenaturationexperimentswereperformed (section2.5.3).
However,toachieveanalysabledenaturationexperimentsthatwerereproducible,we
firstneededtodeterminethefollowing:
i. Thebeststructuralprobetomonitorthechemicaldenaturation
ii. Themostsuitablechemicaldenaturant
iii. Theminimumequilibration time thatproducedaproperequilibriumatevery
denaturantconcentration
iv. Thereversibilityofequilibriumunfolding
4.3.4.1 TheBestStructuralProbetoMonitorChemicalDenaturation
Ingeneral,twohighlyusedbiophysicalprobesforproteinstructuralchangearefar-UV
circulardichroism(far-UVCD)andfluorescence.Thisisbecauseboththesetechniques
requiresmallconcentrationsofproteinsample, lowsamplevolumesandexhibithigh
sensitivity.FarUVCDisanabsorbance-basedtechniquethatmonitorsthesecondary
structureofaproteinwhilefluorescencemonitorsthetertiarystructuralchanges.LcrH
should be amenable to both techniques, as firstly it has a high alpha-helical native
structure therebymaking it easy to gain information about the secondary structure
andfoldedstateofproteinsusingfarUVCD. Secondly, fl-LcrHandtr-LcrHcontain8
and 7 tyrosine residues respectively. Hence, tyrosine fluorescence can be used as a

108
tertiarystructureprobetomonitorchangesinLcrH’sproteinstructurewhensubjected
tounfolding.
ToobservethechangeinsignalofboththeseprobesonLcrH’sunfolding,eachprotein
constructwasincubatedwith8Murea.Figure4.6(a-c)showsthefar-UVCDspectraof
nativeanddenatured LcrHproteins (fl-LcrH, tr-LcrHand L65E tr-LcrH) at 3µM in50
mMPhosphate,pH7.0,5mMDTT.Thenativeand8MureadenaturedLcrHprotein
sampleswereincubatedat25°Cfor6hourspriortorecordingfar-UVCDspectra.The
nativeproteinsamplesshowedstrongα-helicalsignalwithminimaat222nmand208
nm (minimaat208nmnot shown in figure). This is consistentwith theirhighalpha
helicalnativesecondarystructure.Whenahighmolarityofchemicaldenaturant(8M
urea)was introduced these indicativeminimadisappeared, displaying that all native
structure was unfolded. Importantly, the change in signal between folded and
unfolded protein samples was suitably large.
Figure4.6Far-UVCDspectraat3µMproteinconcentrationof(a)fl-LcrH,(b)tr-LcrH,(c)L65Etr-LcrHshowingnative(blackfilledcircles)and8Mureadenatured(redfilledcircles).TheCDspectraofthesampleswas takenusing5mmpath lengthquartzcuvetteat25±0.2 °C.Thedatawasmasked forwavelengthsbelow212nmastheCDdetectorbecamesaturatedwithvoltageexceeding850HTvolts.(d)Tyrosinefluorescenceof3µMtr-LcrHshowingnative(black)and8Mureadenatured(blue).Theexcitationwavelengthwas274nm,thefluorescencespectrawasmeasuredfrom294nmto400nmin1 cm pathlength quartz cuvette at 25 ± 5 °C. Figure was prepared using KALEIDAGRAPH 4.0.
(a) (b)
(c) (d)

109
AftermonitoringthesecondarystructureofLcrHproteinsusingfar-UVCD,itwasthen
decided to use fluorescence spectroscopy to compare the native and denatured
tertiary structure of LcrH. Figure 4.6 (d) shows the comparison between the
fluorescence intensities of native and 8 M urea denatured 3 µM tr-LcrH protein
samples.Here,thesamplewasexcitedat274nmandemissionspectrumfrom294nm
to 400nmwas recorded. A peak due to tyrosine emission can be seen at 303nm,
whichdecreasesonadditionofurea. However, it isalsoobvious that thechange in
signalinfluorescenceonunfoldingwasnotasgreatachangeasthatobservedforthe
far-UV CD. Figure 4.6 showed that the largest difference in the far-UV CD signal
betweenthenativeanddenaturedLcrHsampleswasobservedat222nm,whichwas
then used to monitor equilibrium unfolding.
Figure 4.7: (a) Tyrosine fluorescence monitored at 303 nm (black filled circles) for urea inducedequilibrium unfolding of 3 µM tr-LcrH. The excitation wavelength was 274 nm and slit width forexcitationandemissionwas5nm.Fluorescenceemissionwasrecordedusing1cmpathlengthquartzcuvetteat25±5°C.(b)Equilibriumunfoldingprofileof3µMtr-LcrHmonitoredbyfar-UVCDat222nmwavelength.Measurementsweretakenusing0.5cmpathlengthquartzcuvetteat25±5°Cin50mMPhosphate,pH7.0and5mMDTT.Thesampleswereincubatedat25°Cfor6hourspriortofar-UVCDandfluorescencemeasurements.FigurewaspreparedusingKALEIDAGRAPH4.0.
Given that both probes showed a clear difference between native and denatured
protein, it was decided to obtain a full equilibrium chemical denaturation. Here
samplescontaining3µMtr-LcrHwerepreparedwithaseriesofureaconcentrations
from0to8Murea(section2.5.3.1).Thesampleswereincubatedfor6hoursat25°C
(a) (b)

110
before taking far-UV CD and fluorescencemeasurements. The equilibrium unfolding
profileof3µMtr-LcrHforeachprobe isshown inFigure4.7.Whenthetwoprofiles
are compared, a number of striking differences become obvious. The tyrosine
fluorescence monitored equilibrium unfolding showed that tr-LcrH possesses no
sigmoidal co-operative transition. In contrast, although far-UV CD monitored
equilibriumunfolding(Figure4.6(b))alsoshowedan initialgradualunfoldingprofile,
thereisadistinctsigmoidaltransitionbetweentheinitial(folded)andfinal(unfolded)
states. The fluorescencemonitored unfolding data did not bear any resemblance to
thesigmoidalunfoldingpatternobservedinfar-UVCDmonitoredunfoldingdata.One
explanationofthedifferingcurvescanbesuggestedbythepositioningofthetyrosine
residues in tr-LcrH (Figure 4.8). The surface analysis of the tr-LcrH protein structure
showedthat50%ofthetyrosineresidues,whicharelocatedintheN-terminusofthe
protein were found to be solvent exposed in the native state of the protein.
Consequently, as the protein undergoes unfolding, the remaining 50 % of tyrosine
residuestoobecomesolventexposed.However,resultantchangeinthefluorescence
intensity betweennative andunfolded LcrHprotein in comparison to the secondary
structuralchangeobservedfromfar-UVCDdata(Figure4.6)wasmuch lower.This is
because fluorescence is based on the environment of fluorophores i.e. tryptophans
andtyrosinesthataresolventexposedfluoresceatadifferentwavelengthcompared
tothoseinanon-solventexposedenvironment(thehydrophobiccoreoftheprotein).
In order to observe a difference in fluorescence between a native and unfolded
protein, theremust be an overall change in the interaction of the solvent exposed
tyrosines and tryptophans with the solution. Tryptophan has stronger fluorescence
andhigherquantumyield in comparison to tyrosine.But, LcrHdoesnot containany
tryptophan residues.Although, tyrosine is aweakeremitter than tryptophan, itmay
stillcontributesignificantlytoproteinfluorescenceifpresentingreatnumbers.tr-LcrH
and fl-LcrH contain only 7 and 8 tyrosine residues respectively,which is not a large
number. Furthermore, tyrosine is frequently quencheddue to loss of protonon the
aromatic hydroxyl group by undergoing ionization in the excited state or due to its
interaction with the peptide chain.

111
180°
(a) (b)
Figure4.8 (a)
Ribbonrepresentationofdimerictr-LcrH(LcrH21-163) (PDBentry:2VGX).ChainsAandBarecolouredgreenandbluerespectively.Thereare7tyrosineresiduesineachchain,whicharecolouredinredandshownassticks.(b)Solventaccessiblesurfacerepresentationofdimerictr-LcrH(green)withtyrosineresiduescolouredred.ThefigureswerepreparedusingPyMOL.
Thus,theequilibriumunfoldingmonitoredbytyrosinefluorescencewasnotfoundto
be suitable. Far-UV CD proved to be the best structural probe for monitoring the
equilibriumunfoldingofLcrH’sproteinconstructs.
4.3.4.2 Determiningthemostsuitablechemicaldenaturant
ItwaspreviouslyshownthatLcrHunderwentcompletelossofsecondarystructureon
denaturation with highmolar concentration (8M) of the chemical denaturant urea
(Figure4.6).When6MGuanidinehydrochloride(GdmHCl)wasusedtounfold3-µM
tr-LcrH,sameresultwasachieved(Figure4.9).

112
Figure4.9Far-UVCDspectraof3µMtr-LcrHshowingnative(blackfilledcircles),8Mureadenatured(blue)and6MGdmHCldenatured(green).TheCDmeasurementsweretakenusing5mmpathlengthquartz cuvette at 25 ± 0.2 °C in 50mMPhosphate, pH 7.0, 5mMDTT. Figurewas prepared usingKALEIDAGRAPH 4.0.
After observing the effect of GdmHCl, it was decided to perform an equilibrium
chemicaldenaturationexperimentusingGdmHClasachemicaldenaturantand3µM
tr-LcrHproteinastheproteinsample(Section2.5.3).Thesampleswere incubatedat
25 ± 0.2°C for 6 hours followed by far-UV CDmeasurements. The GdmHCl induced
equilibrium unfolding of tr-LcrH was compared to the urea induced equilibrium
unfolding (Figure4.10).GdmHCl is a stronger chemical denaturant thanurea. Figure
4.10 shows that tr-LcrH undergoes unfolding at lower concentration of GdmHCl
compared to that of urea. Importantly, the data comparison showed that there is a
lack of folded (native) baseline for GdmHCl induced unfolding compared to that of
urea. This lack of native baseline caused difficulties in fitting equilibrium unfolding
curvesto2-stateormulti-statedenaturationmodels.

113
Figure 4.10 Equilibrium denaturation of 3 µM tr-LcrH using urea (black filled circles) and GdmHCl(blackfilleddiamonds)monitoredbychangesinfar-UVCDat222nmplottedagainstthedenaturantconcentrations(M)ofureaandGdmHClrespectively.Thesampleswereequilibratedfor6hourspriortotakingfar-UVCDscans,in5mmpathlengthquartzcuvetteat25°C±0.2°C,in50mMPhosphatepH 7.0, 5 mM DTT. Figure was prepared using KALEIDAGRAPH 4.0.
Therefore, it was decided that urea was the most suitable chemical denaturant.
Henceforth,alltheequilibrium-unfoldingexperimentsofLcrHproteinconstructswere
carriedoutusingurea.

114
4.3.4.3 MinimumEquilibrationTimeforEquilibriumChemicalDenaturation
It is important to confirm that all protein samples at eachdenaturant concentration
reachequilibrium.Ifinsufficienttimeisallowedforequilibration,anincorrectstability
and/ornon-reproducibleexperimentsmayoccur[195-197].Inordertodeterminethe
minimum equilibration time for LcrH, 3 µM tr-LcrH was chosen as a test case. A
mixtureofproteinandurea inbufferwereprepared(Section2.5.3)andthesamples
wereincubatedfordifferinglengthsoftime(4,12and24hours).Thiswasfollowedby
takingfar-UVCDmeasurementsat222nminathermostattedcuvetteholderat25±
0.2°Cina5mmpathlengthquartzcuvette.Figure4.11showstheoverlaidresults.
Figure 4.11 Urea induced equilibrium denaturation of tr-LcrH monitored by changes in far-UV CDsignal (ellipticity in millidegrees) at 222 nm plotted against the concentration of urea (M). Thesuperimposed equilibrium unfolding profiles of 3 µM tr-LcrH corresponds to differing equilibrationtimes:4hours(filledcircles),12hours(opencircles)and24hours(closedsquares)respectively.Theinset figure shows the same unfolding profiles converted to relative spectroscopic signal (fractionunfolded)foreasycomparisonofdifferentdatasets.FigurewaspreparedusingKALEIDAGRAPH4.0.
Importantly, all three differing equilibration times were observed to be
superimposable.Itcouldthusbeinferredthat4hourswastheminimumtimerequired
for achieving chemical equilibrium. Therefore, all equilibrium-unfolding experiments

115
wereleftforaminimumequilibrationtimeof4hourspriortotakingmeasurementson
theCDspectrophotometer.
4.3.4.4 TheReversibilityofEquilibriumUnfolding
The final control required was to confirm that the chemical denaturations were
reversible. This is requirement, as otherwise thermodynamic parameters observed
from fitting the curves will not report on the unfolding process, but instead on
aggregation.For thisexperiment, tr-LcrHand fl-LcrHprotein samplesat27µMwere
unfolded with 8 M urea, equilibrated for 4 hours at 25 ± 0.2 °C respectively. The
unfoldedproteinsamplesofbothproteinconstructswerethenrefoldedbyaliquoting
into buffer with differing concentrations of urea. This gave a final protein
concentration of 3 µM in each differing urea concentration. The diluted/refolded
sampleswerere-equilibratedfor4hoursfollowedbyfar-UVCDmeasurementat222
nm. Figure 4.12 shows the far-UV CD monitored refolded equilibrium titrations
superimposed onto the unfolded equilibrium titrations at 3 µM concentration of tr-
LcrHandfl-LcrHrespectively.
Figure4.12Reversibilityofurea inducedequilibriumunfoldingof (a) tr-LcrHand(b) fl-LcrHat3µMproteinconcentrationshowingtheunfoldedtitrations(blackcloseddiamonds)andrefoldedtitrations(greenclosedcircles)respectively.Theunfoldingandrefoldingequilibriumtitrationsweremonitoredbychanges infar-UVCDat222nm, in5mmpathlengthquartzcuvetteat25°C±0.2°C, in50mMPhosphate, pH 7.0, 5 mM DTT. Figure was prepared using KALEIDAGRAPH 4.0.
Theunfoldedandsubsequentlyrefoldedsampledretainednearly100%oftheirnative
far-UVCD signal. This confirmed thaturea inducedequilibriumunfoldingof both tr-
LcrHandfl-LcrHiscompletelyreversibleunderthebufferconditionsused.
(a) (b)

116
4.3.5 EquilibriumChemicalDenaturationofLcrH’sProteinConstructsHaving determined conditions where reversible, aggregation-free chemical
denaturations of LcrH can be performed and monitored, we conducted such
denturationsatanumberofdifferentproteinconcentrations.Forfl-LcrH,thesewere3
and50µM(Figure4.13),fortr-LcrHtheserangedfrom1to80µM(Figure4.14)andfor
monomericL65Etr-LcrHthesewere1.5and3µM(Figure4.15).Reproducibilityofeach
denaturationwasconfirmedbyrepeatingeachexperimentatleastonce(showninthe
aforementioned figures). For both fl-LcrH and tr-LcrH the 50 and 80 µM chemical
denaturations were the highest protein concentration that could be prepared. This
wasduetothemethodologythatchemicaldenaturationsrequire,i.e.theproteinstock
solutionisdilutedtothesameamountintoaseriesofincreasingureaconcentrations.
Figure4.13Ureainducedequilibriumchemicaldenaturationoffl-LcrHatproteinconcentrationsof(a)3 µM shownby blue filled circles, far-UV CDmeasurementswere taken using a 5mmpath lengthcuvette and (b) 50 µM shown by open and filled blue triangles for reproducibility, far-UV CDmeasurements were taken using a 1 mm path length cuvette. Figure was prepared usingKALEIDAGRAPH 4.0.
(a) (b)

117
Figure4.14Ureainducedunfoldingoftr-LcrHmonitoredbychangeinfar-UVCDat222nmatproteinconcentrations: (a) 1 µM (1 cm path length), (b) 3 µM (5mm path length), (c) 6 µM (5mm pathlength),(d)12µM(2mmpathlength),(e)25µM(1mmpathlength),(f)50µM(1mmpathlength)and (g) 80 µM (1 mm path length). The inset figures are the denaturation profiles at respectiveconcentrationswiththeCDsignalchangedtorelativespectroscopicsignal(fractionunfolded)foreaseofcomparison.Eachexperimentwasrepeatedatleastoncetoconfirmreproducibilityandshownbyblackopenandfilledcircles.FigurewaspreparedusingKALEIDAGRAPH4.0.
(a) (b)
(c) (d)
(e) (f)
(g)

118
Figure4.15UreainducedequilibriumchemicaldenaturationofmonomericmutantL65Etr-LcrHatproteinconcentrationsof(a)1.5µMshownbyopenbluecirclesand(b)3µMshownbyclosedbluecircles.Far-UVCDmeasurementsweretakenusinga5mmpathlengthquartzcuvetteat25±0.2°C.FigurewaspreparedusingKALEIDAGRAPH4.0.
Foreaseofcomparison,eachdenaturationwasconvertedfromellipticityat222nmvs
urea to relative spectroscopy signal vs urea (Equation 2.9, Materials & Methods).
Figure4.16 shows fl-LcrHoverlaidwith tr-LcrHand theoverlaidplots tr-LcrH from1
µMto80µM,respectively.Fromthesegraphsthefollowingfeaturesandtrendswere
immediatelyapparent.
4.3.5.1 Biphasic Denaturations Show LcrH Unfolds via Partially Folded
DimericIntermediate
Theprofileofeachequilibriumdenaturationanditsproteinconcentrationdependence
delineates the mechanism by which oligomeric proteins unfold. Such concentration
dependence is a unique characteristic of oligomeric protein systems and is a direct
consequence of protein unfolding being coupled with oligomeric dissociation. Once
determined, the data can be fit to the correct dimer denaturationmodel and thus
obtainthermodynamicstabilityoftheprotein.Figure4.16showsthatforbothforms
of LcrH the denaturation profile of each protein concentration consists of two
transitionswhichbecomesclearerwiththeincreaseinproteinconcentrations.
(a) (b)
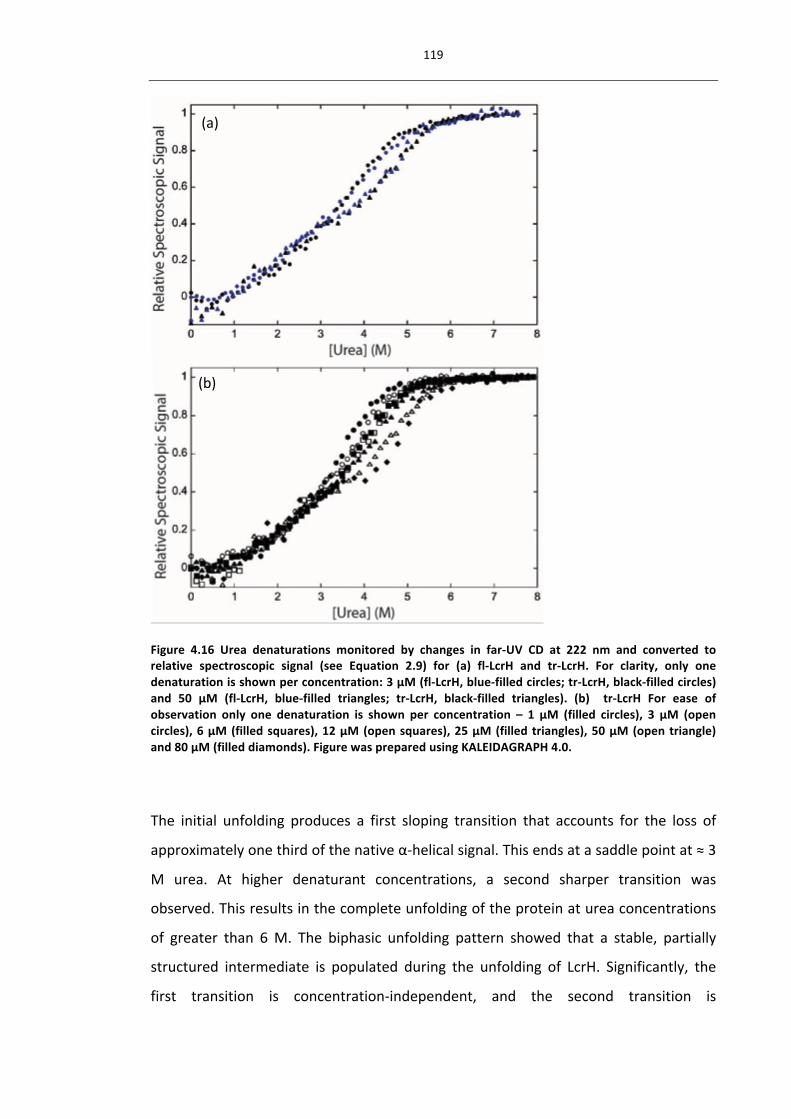
119
Figure 4.16 Urea denaturations monitored by changes in far-UV CD at 222 nm and converted torelative spectroscopic signal (see Equation 2.9) for (a) fl-LcrH and tr-LcrH. For clarity, only onedenaturationisshownperconcentration:3µM(fl-LcrH,blue-filledcircles;tr-LcrH,black-filledcircles)and 50 µM (fl-LcrH, blue-filled triangles; tr-LcrH, black-filled triangles). (b) tr-LcrH For ease ofobservation only one denaturation is shown per concentration – 1 µM (filled circles), 3 µM (opencircles),6µM(filledsquares),12µM(opensquares),25µM(filledtriangles),50µM(opentriangle)and80µM(filleddiamonds).FigurewaspreparedusingKALEIDAGRAPH4.0.
The initial unfolding produces a first sloping transition that accounts for the loss of
approximatelyonethirdofthenativeα-helicalsignal.Thisendsatasaddlepointat≈3
M urea. At higher denaturant concentrations, a second sharper transition was
observed.Thisresultsinthecompleteunfoldingoftheproteinatureaconcentrations
of greater than 6M. The biphasic unfolding pattern showed that a stable, partially
structured intermediate is populated during the unfolding of LcrH. Significantly, the
first transition is concentration-independent, and the second transition is
(a)
(b)

120
concentration-dependent (the midpoint ‘[D]50%’ shifts to higher urea concentration
withanincreaseinproteinconcentration).Theobservedpatternofunfolding(protein
concentration-independent first transition to a stable partially folded intermediate
followedbyaproteinconcentration-dependentsecondtransition)isconsistentwitha
schemewherenativedimer(N2)partiallyunfoldstoadimericintermediate(I2),which
thenunfoldstoadenaturedmonomer(2D),𝑁! ⇌ 𝐼!⇌ 2D(Figure4.17).Moreover,it
is important to note that the shallow nature of the first unfolding transition, native
dimertopartiallyunfoldedintermediate,showsalackofco-operativeunfolding.This
indicates the structure of LcrH is particularly flexible and can easily adopt partially
unfoldedconfirmations.
Figure4.17SchematicillustrationoftheproposedequilibriumunfoldingpathwayofLcrH.Ahead-to-headdimericstructureofSycD(PDBentry:2VGX)isshownnexttoatopologicalmapofthefoldforreference (helices are shown as circles with the individual protein chains coloured red and blue).During unfolding, the native state (N2) non-cooperatively frays through unfolding of C-terminalhelices.This leavesanN-terminaldimeric intermediate (I2).Wenote thatvariouspartiallyunfoldeddimeric intermediate conformations could be populated during the unfolding transition. These arepresentedby showing the twoextremepossibleexamples (onemonomerof thedimer fully foldedandtheothermostlyunfolding)andathirdthatisthemedian(bothsubunitspartiallyunfoldedtothesame extent). These possible intermediate structures are shown in the grey box. At higherconcentrationsofureathe intermediatedissociatesanddenatures toamonomericdenaturedstate(2D,whereDisthedenaturedstate).
Toconfirmthedimericintermediateunfoldingmechanism,analyticalSECanddynamic
lightscatteringoftr-LcrHat50µMwereperformedinureaconcentrationsof0–6M
urea. Both methods showed that there was an increase in the size of tr-LcrH on
increasing urea concentrations (Figure 4.18). In particular, the size of tr-LcrH was
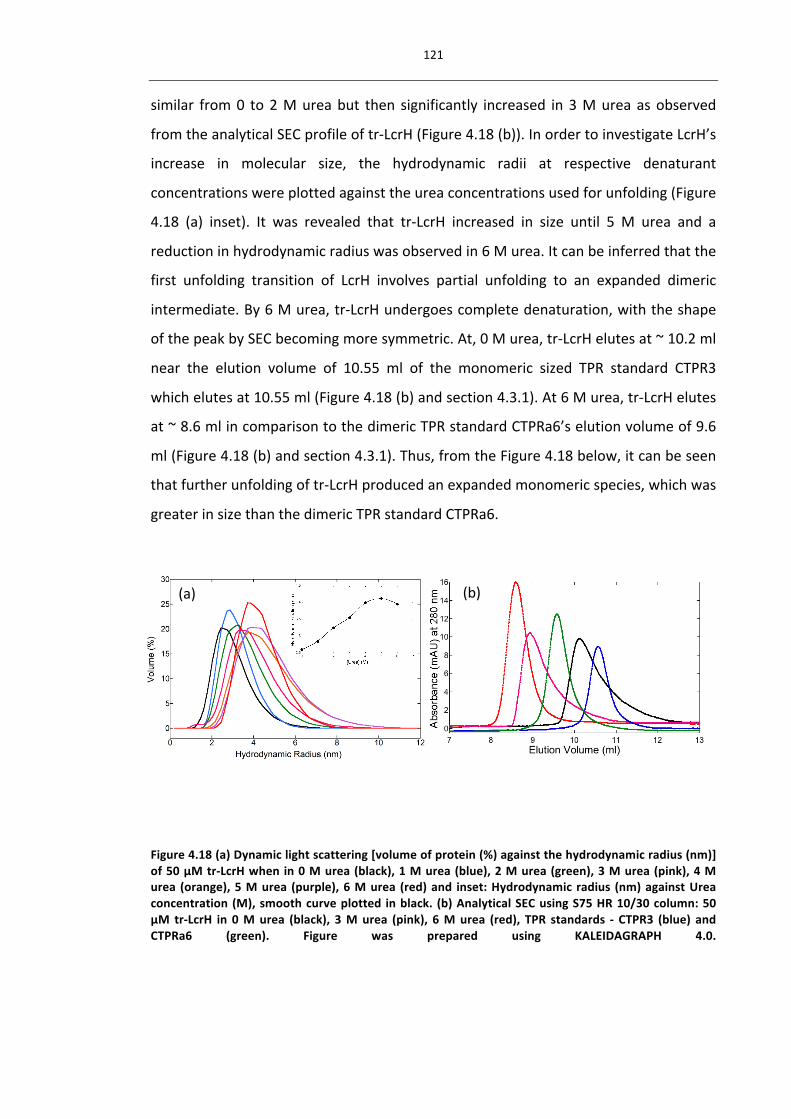
121
similar from0 to2Mureabut then significantly increased in3Mureaasobserved
fromtheanalyticalSECprofileoftr-LcrH(Figure4.18(b)).InordertoinvestigateLcrH’s
increase in molecular size, the hydrodynamic radii at respective denaturant
concentrationswereplottedagainsttheureaconcentrationsusedforunfolding(Figure
4.18 (a) inset). It was revealed that tr-LcrH increased in size until 5 M urea and a
reductioninhydrodynamicradiuswasobservedin6Murea.Itcanbeinferredthatthe
first unfolding transition of LcrH involves partial unfolding to an expanded dimeric
intermediate.By6Murea,tr-LcrHundergoescompletedenaturation,withtheshape
ofthepeakbySECbecomingmoresymmetric.At,0Murea,tr-LcrHelutesat~10.2ml
near the elution volume of 10.55 ml of the monomeric sized TPR standard CTPR3
whichelutesat10.55ml(Figure4.18(b)andsection4.3.1).At6Murea,tr-LcrHelutes
at~8.6mlincomparisontothedimericTPRstandardCTPRa6’selutionvolumeof9.6
ml(Figure4.18(b)andsection4.3.1).Thus,fromtheFigure4.18below,itcanbeseen
thatfurtherunfoldingoftr-LcrHproducedanexpandedmonomericspecies,whichwas
greaterinsizethanthedimericTPRstandardCTPRa6.
Figure4.18(a)Dynamiclightscattering[volumeofprotein(%)againstthehydrodynamicradius(nm)]of50µMtr-LcrHwhenin0Murea(black),1Murea(blue),2Murea(green),3Murea(pink),4Murea (orange),5Murea (purple),6Murea (red)and inset:Hydrodynamic radius (nm)againstUreaconcentration(M),smoothcurveplotted inblack. (b)AnalyticalSECusingS75HR10/30column:50µM tr-LcrH in 0Murea (black), 3Murea (pink), 6Murea (red), TPR standards - CTPR3 (blue) andCTPRa6 (green). Figure was prepared using KALEIDAGRAPH 4.0.
(a) (b)

122
4.3.5.2 DeletionofN-terminusCausesNoChangeinEquilibriumUnfolding
Whentheequilibriumdenaturationsof fl-LcrHandtr-LcrHarecomparedat3and50
µM, theirprofilesare indistinguishable (Figure4.16). It is thereforeclear that fl-LcrH
andtr-LcrHhaveidenticalthermodynamicequilibriumunfoldingandthusmustinfold
viathesamemechanismandhavethesamestability.Thisshowsthatalthough,theN-
terminus of LcrH may possess some α-helical content, it does not alter the
conformationalstabilityorthenatureofequilibriumunfoldingoftheprotein.
4.3.6 ThermodynamicstabilityofLcrHHaving delineated the precise mechanism of LcrH’s unfolding, the thermodynamic
stabilitiesof the intermediateandnativestateswereobtainedbyglobally fitting the
chemicaldenaturationsperformedat50and80µMfortr-LcrHand50µMforfl-LcrH
to a three-state unfolding model with a dimeric intermediate (Figure 4.19). The
derivationof the three-stateunfoldingmodelandEquationsused to fit thedataare
describedindetailinthefollowingdataanalysissection.Lowerproteinconcentration
denaturationswereexcluded,astheintermediatestatewasnotsufficientlypopulated
toenableexplicitfitting.
Figure4.19Ureadenaturationoftr-LcrHmonitoredbychanges infar-UVCDat222nmshowingtheglobalfitofthe50and80µMdatasetstoathree-statemodelwithadimericintermediate(Equation4.4).Forclarity,onlyonedenaturationisshownperconcentration:6µM(filledsquares),12µM(opensquares), 25 µM (filled triangles), 50 µM (open triangle) and 80 µM (filled diamonds). Figure wasproduced using GraphPad Prism 6.0.

123
4.3.6.1 Dataanalysis
InthisstudytheunfoldingofLcrHwasfittedtoathree-statemodel,whichinvolvesa
dimericintermediate(scheme1)
𝑁!𝐾!⇌𝐼!
𝐾!⇌2D Scheme1
whereN2isthenativedimer,I2istheintermediatedimerandDisthedenaturedstate.
Inthismodeltheequilibriumconstantsforthefirst(K1)andsecond(K2)transitionscan
be defined, respectively, as K1 = [I2]/[N2] and K2 = [D]2/[I2]. The total protein
concentration is Pt = 2[N2] + 2[I2] + [D], and the sum of the fractions of individual
species is equal to 1: fN + fI + fD = 1,where fI represents the fractionofmonomeric
subunitsinvolvedintheintermediatestate.Combiningtheserelationshipsgives:
Equation4.9𝐾! =!I!N
and
Equation4.10𝐾! =!!!!!
!
!I
Rearranging and substitution of the above Equations in terms of fD (fraction of
denaturedprotein)allowsfDtobeexpressedintermsofK1,K2andPt:
Equation4.11𝒇𝐃 =!𝑲𝟏𝑲𝟐! 𝑲𝟏𝑲𝟐 𝟐!𝟖 𝟏!𝑲𝟏 𝑲𝟏𝑲𝟐 𝑷𝒕
𝟒𝑷𝒕 𝟏!𝑲𝟏
Inthismodelthespectroscopicsignalobtainedbecomes:
Equation4.12𝝀𝒐𝒃𝒔 = 𝝀𝑵𝒇𝑵 + 𝝀𝑰𝒇𝑰 + 𝝀𝑫𝒇𝑫

124
Whereλobsisthespectroscopicsignal,λNisthesignalofthenativestate,λIisthesignal
oftheintermediatestateandλDisthesignalofthenativestate.SubstitutingEquation
4.9andEquation4.10intoEquation4.12givesthefinalfittingEquation:
Equation4.13𝝀𝒐𝒃𝒔 = 𝝀𝑵𝟐𝑷𝒕𝒇𝑫
𝟐
𝑲𝟏𝑲𝟐+ 𝝀𝑰
𝟐𝑷𝒕𝒇𝑫𝟐
𝑲𝟐+ 𝝀𝑫𝒇D
Globalfittingtothethree-statedimerdenaturationmodel
To fit the denaturant dependent data and obtain ΔG values of each step in the
unfolding,K1andK2canbedefinedaccordingtothelinearfreeenergymodel,which
states that the free energy of each unfolding process varies linearly with the
concentrationofdenaturant[196-198]:
Equation4.14𝚫𝑮𝒙 = −𝑹𝑻ln 𝑲𝒙 = 𝚫𝑮𝑯𝟐𝑶𝒙 −𝒎 denaturant
WhereΔGxisthefreeenergyoftheprocessxataspecificdenaturantconcentration,Kx
istheequilibriumconstantoftheprocessx (inthiscaseK1andK2),ΔGxH20 isthefree
energy of process x in the absence of denaturant and m is a constant that is
proportional to the solventexposuredifferencebetween the initial andendstateof
unfoldingprocessx.
Equation 4.11, with fD, K1 and K2 defined by Equation 4.9 and Equation 4.10
(respectively), was then used to globally fit the LcrH denaturations of differing
concentrationsusingthenon-linear, least-squaresfittingprogrammePrism.Thisgave
global thermodynamic parametersΔ𝐺!!!! ,Δ𝐺!!!
! (stabilities of the first and second
unfoldingtransitions, respectively)andm1,m2 (them-values for the firstandsecond
unfolding transitions, respectively). λN, λI and λD (the spectral signals of the native,
intermediateanddenaturedstates respectively)wereallowedtovary independently
with each dataset. λI was assumed not to vary with denaturant concentration to
minimizethenumberofparametersneeded.Further,toreduceanybaselineartifacts,
the baselines (λN and λD) were constrained to zero slope. The thermodynamic

125
parametersobtainedarepresentedinTable4.2andconfirmtheidenticalstabilitiesof
fl-LcrHandtr-LcrH.
Table4.2Thermodynamicparametersfortheglobalfittingoffl-LcrH&tr-LcrHat25°Cusingthethreestatedimermodelwithadimericintermediate
GlobalparametersProtein
𝚫𝑮𝐇𝟐𝐎𝐍𝟐⇌𝐈𝟐 𝒎𝐍𝟐⇌𝐈𝟐 𝚫𝑮𝐇𝟐𝐎
𝐈𝟐⇌𝟐𝐃 𝒎𝐈𝟐⇌𝟐𝐃a𝚫𝑮𝐇𝟐𝐎
𝐍𝟐⇌𝟐𝐃
(kcalmol-1) (kcalmol-1M-1) (kcalmol-1) (kcalmol-1M-1) (kcalmol-1)
fl-LcrH 1.7±0.5 1.0±0.3 5.6±1.8 1.7±0.4 7.3±1.9tr-LcrH 1.7±0.4 1.1±0.2 5.7±1.2 1.7±0.2 7.4±1.3IndividualparametersProtein
[TotalProtein]
bλN cλI dλDCuvette
pathlength (µM) (millideg.) (millideg.) (millideg.) (cm)fl-LcrH 50*1 -99±5 54±6 -5±2 0.05fl-LcrH 50*2 -95±5 54±6 -5±2 0.05tr-LcrH 50*1 -132±5 -73±6 -4±2 0.1tr-LcrH 50*2 -133±5 -70±6 -3±2 0.1tr-LcrH 80*1 -226±8 -126±9 -9±3 0.1tr-LcrH 80*2 -206±7 -122±8 -14±4 0.1Errors given are from the fit of all the data and are quoted at a 95 % confidence level (2standard errors). aΔ𝐺!!!
!!⇌!! =Δ𝐺!!!!!⇌!!
+ Δ𝐺!!!!!⇌!! , with the error calculated by propagating
thefittingerrors.bλN,cλIanddλDaretheCDspectroscopicsignalsfornative,intermediateanddenaturedLcrH,respectively,at222nm.
Theseshowthattheinitialunfoldingstep(N2⇌I2)hasaΔ𝐺!!!!!⇌!! ofonly1.7±0.4kcal
mol-1.Thus,themajorityofLcrH’sstabilityresides inthedimerizationstructure(I2⇌
2D)asitrequiresanextra5.7±1.2kcalmol-1tounfold.Thismeansthetotalstability
of the protein (Δ𝐺!!!!!⇌!! ) is 7.4 ± 1.3 kcal mol-1. Interestingly, LcrH’s stability
(Δ𝐺!!!!!⇌!! ) is lessthanmanyotherdimericproteinsthathavebeenshowntounfold
viadimericintermediate(Table4.3).Inparticular,thefirsttransition(N2⇌I2)ofLcrH
was significantly lower than, for example, eAATase, Ure2p, SecA, OPH and AAO
proteins. This confirms the non-cooperative and labile nature of LcrH’s initial
unfolding.

126
Table 4.3 Thermodynamic parameters characteristic of chemical induced unfolding ofdimericproteinsbyathree-statetransitionwithdimericintermediate
Protein Temp. 𝚫𝑮𝐇𝟐𝐎𝐍𝟐⇌𝐈𝟐 𝒎𝐍𝟐⇌𝐈𝟐 𝚫𝑮𝐇𝟐𝐎
𝐈𝟐⇌𝟐𝐃 𝒎𝐈𝟐⇌𝟐𝐃a𝚫𝑮𝐇𝟐𝐎
𝐍𝟐⇌𝟐𝐃
(°C) (kcalmol-1) (kcalmol-1M-1) (kcalmol-1) (kcalmol-1M-1) (kcalmol-1)tr-LcrH 25 1.7 1.1 5.7 1.7 7.4beAATase 25 12.0 4.8 24.4 3.4 36.4cSecA 20 8.4 4.1 14.1 1.5 22.5dOPH 25 4.3 1.0 36.1 4.3 40.4eAAO 10 3.5 1.7 13.6 1.2 17.1aΔ𝐺!!!
!!⇌!! =Δ𝐺!!!!!⇌!!
+ Δ𝐺!!!!!⇌!! . To give thebest comparisonwithourdataon LcrH theproteins
choseninthistablewereselectedastheexperimentalconditionsusedtoobtainthemweresimilartoours.i.e.ureaaschemicaldenaturant,CDorfluorescencegloballyfitted,temperaturebetween10–25⁰CandpHofbetween7-8.Thevaluesquotedaboveare fromthe followingstudies: beAATase -[198,199],cSecA-[199,200],dOPH-[200,201]andeAAO-[201-203].
An apparent 𝐾! (𝐾!!"" ) for the dissociation of the intermediate to denatured
monomer can also be calculated from the equilibrium data. As Δ𝐺!!!!!⇌!! (from the
seconds unfolding transition) is the free energy of unfolding and dissociation of the
intermediate LcrH to denatured monomeric LcrH, it is related to the 𝐾!!"" by
Δ𝐺!!!!!⇌!! =-RTln𝐾!
!"" .Thus,𝐾!!"" canbesimplyobtainedbyrearrangingthisEquation.
However,twocaveatsneedtobeconsideredbeforedelineatingitstruesignificance.
(i)𝐾!!"" corresponds to both unfolding and dissociation of the intermediate state of
LcrH. This is not exactly equivalent to the𝐾! value obtained from the SEC and AUC
data,whichcorrespondtothedissociationoffoldeddimericLcrHtofoldedmonomeric
LcrH.(ii)the𝐾!!"" obtainedindifferentsolutionconditions(highureaconcentration).
Giventhesecaveats,the𝐾!!"" calculatedwas65±65µMandisconsistentwiththe𝐾!
calculatedfromAUCdataandinferredfromSECdata.
4.3.6.2 Proposedequilibriumunfoldingpathway:
The ability of LcrH to easily fray into partially folded structures is facilitated by its
modular tetratricopeptide repeat (TPR) structure. Unlike globular proteins, TPR and
otherrepeatcontainingproteinsareformedfromthestackingofmodularsecondary
structuremotifs [202-206]. This causes their native structures to be dominated and

127
stabilizedbyinteractionsfromaminoacidresiduesthatarecloseinprimarysequence,
whereasglobularproteinshavemanystabilizinginteractionsfromaminoacidsthatare
distantinprimarysequence.Thisarrangementcanenablesectionsofrepeatproteins
tounravelwithoutunfoldingthecompletestructure.Wehavestudiedthefoldingofa
numberofdesignedTPRproteins and shown thatwhenpartial unfoldingoccurs the
proteinstendtounravelfromthelessstableouterrepeatsfirst[168,204-206].Asthe
N-termini of LcrH form the dimeric interface (which our results show is the most
thermodynamically stable part of the structure), the unraveling must occur mainly
from the C-terminus. A schematic diagram of the equilibrium-unfolding pathway
proposedbyourresultsisshowninFigure4.17.
4.3.6.3 ThermodynamicStabilityofMonomericvsDimericLcrH
TocompletethestabilitystudiesconductedonLcrH,thestabilityandflexibilityofthe
monomericmutantL65ELcrHwasinvestigated.Invivostudieshaveshownthatwhen
SycD is made monomeric through the L65E mutation, non-invasive bacteria are
produced[168,207].Thissuggeststhatthedimericinterfaceisimportantforfunction.
WhenweproducedL65E tr-LcrH,wealsoobtainedamonomer (at50µMthere isa
single SEC elution peal of 10.7 ml, which is similar to an elution peak of 10.55 ml
obtained for a monomeric designed TPR protein of similar dimensions (3.5 stacked
TPRs,Figure4.2).Furthermoreat25°C,L65Ehasthesameα-helicitybyCDtodimeric
tr-LcrH(Figure4.20a).However,chemicaldenaturationofL65Eshowsthatthemutant
was substantially destabilised compared to dimeric tr-LcrH with a single sharp
transition between native and denatured states and little native baseline (Figure
4.20b). This was confirmed, as fitting the data to a two-state model showed the
midpoint of the transition ([D]50%) is only 1.6 ± 0.1 M urea, the m-value of the
transitionis1.4±0.1kcalmol-1M-1andthusitsstability(Δ𝐺!!!!⇌! )is2.1±0.2kcalmol-1
(Δ𝐺!!!!⇌! =m.[D]50%).

128
128
Figure4.20(a)Far-UVCDspectracomparingnativefl-LcrH(black),tr-LcrH(blue),L65Etr-LcrH(green),anddenaturedL65Etr-LcrHin8Murea(red).Aproteinconcentrationof50µMina1-mmpathlengthquartzcuvettewasusedineachexperiment.Theinsetfigureshowsthesameexperimentsconductedataproteinconcentrationof3µMina5-mmpathlengthcuvette.Notethatfl-LcrHhas~10%greaterα-helicalsignaltotr-LcrHandL65Etr-LcrHat222nm.(b)UreadenaturationofL65Emutantoftr-LcrH(openblue circles, 1.5µM, and filledblue circles, 3 µM) and tr-LcrH at 3µM (black open and filledcircles for comparison) monitored by changes in far-UV CD at 222 nm and converted to relativespectroscopicsignal(seeEquation2.12).Thebestfit forL65Etoatwostatefoldingmodel isshown(black).FigurewaspreparedusingKALEIDAGRAPH4.0.
Thisstabilityissimilartotheinitialunfoldingofthedimertr-LcrH,butissubstantially
more cooperative and results in a complete loss of structure. Moreover, the low
stability of L65E indicates that the in vivo results may well be caused by the
destabilisationof LcrH to theextent that themonomersproducedareunfoldedand
thusnon-functional.
(a)
(b)

129
129
4.3.7 ConclusionThe results in this chapter show that LcrH is aweakdimer (KD ~ 15µM) that readily
unfoldsinanon-cooperativemannertoapartiallyunravelleddimericintermediate.In
contrast,themonomericmutantL65Etr-LcrHunfoldsmorecooperativelyonchemical
denaturation, resulting in a complete loss of structure. Thus, confirming the
significance of the dimerization interface of LcrH for thermodynamic stability.
Furthermore,thechaptershowsthatalthoughdeletionoftheNterminusdoesremove
some α-helical structure (10%), it does not affect either its stability or dimerization
equilibrium.Excitingly,theenergybarrierforthepartialunravellingofdimericLcrHis
low(ΔGH2O~1.7kcalmol-1at25°C),suggestingthatpartiallyunfoldedstatesofLcrH
(held together at the dimeric interface) are present at physiological conditions. It is
thereforeproposedthatsuchalooselyfoldedstructurehasbiologicalrelevance,atthe
very least, when binding its cognate protein partners (the far larger membrane
insertingtranslocatorproteins).

130
130
Chapter5 ConclusionsTheBlackDeathwasoneofthemostdevastatingpandemicsinthehistoryofhuman
kind.Itresultedinthedeathofnearly50millionpeopleinAsia,AfricaandEuropein
the14thcenturyAD[7,207].Thepathogenresponsibleforthisdeadlyinfectionwasthe
bacteriumYersiniapestiswhichcausesseveralformsofplague[7,208].Oninfectionby
Y. pestis, the host’s defences are overcome by a combination of stealth and active
immunesuppressiontargeting innate immunemechanisms.Thetypethreesecretion
system(T3SS)ofY.pestisiscrucialtothesuppressionarmofthisstrategy.Thissystem
injectsasetofeffector(virulent)proteinsintothehostcellcytoplasmwhencomingin
contact with the bacteria compromising the host’s immune system by affecting
phagocytosisandcytokineproduction[208,209].Thus,T3SSprovidesthekeyvirulence
factor inpathogens likeY.pestis. Furthermore, theT3SS is found inovertwodozen
infectiousGram-negativebacteriasuchasvariousstrainsofE.coliandPseudomonas
aeruginosa, a potent biofilm former with a strong connection to cystic fibrosis.
WithoutT3SS,manypathogenicbacteriaareunabletocausedisease[209].Thismakes
theT3SSanattractivetargetfornovelantimicrobialdrugs.
Recently, the World Health Organisation (WHO) published a report on antibiotic
resistanceandhighlightedthatit isanimminentthreatandneedstobeimmediately
addressed[5,210].AccordingtotheWHO,thetruecostofantimicrobialresistancewill
be300millionprematuredeathsandupto$100trillion(£64trillion)losttotheglobal
economyby2050. Thiswill severely impact theworld’sGDP,whichwouldbe0.5%
smallerby2020and1.4%smallerby2030[211].Approximately10%ofthemicrobes
that would be linked to these deaths employ the T3SS making it an extremely
attractivetargetforantimicrobialagents.Inordertodevelopdrugsmoreefficiently,a
complete biochemical understanding of the T3SS, such as the formation of the
infectionmachineryandthemechanismofinfectionarerequired.
To do this, I began studying the T3SS in Y. pestis and more specifically the class II
chaperone LcrH to fully understand the conformational stability and biochemical
behaviourof thisprotein. LcrH iscritical for the formationofa fully functionalT3SS
andsotoothe infectionprocessofmammaliancellsbyY.pestis. Consequently,any
131
131
informationregardingthebiochemicalcharacteristicsofsuchasignificantproteincan
provideapotentialtherapeuticdrugtarget.
Inordertogaininsightintotheprotein’sbehaviour,thefulllengthsequenceencoding
fortheproteinLcrHwasclonedforproteinproductionandpurification.Despitebeing
able to produce and purify LcrH to >95 % the protein proved extremely prone to
aggregation.Inordertoovercomethisproblem,aconstructwascreatedwiththeN-
terminal 20 amino acids and the last 5 amino acids removed (tr-LcrH). Here, the
proteinprovedtobesignificantly lesspronetoaggregation. CDstudiesshowedthat
theremovaloftheN-terminusofLcrHcausedsomeloss inα-helicalcontentbuthad
noeffectonthestabilityoftheprotein.
InordertodeterminetheoligomericstateofbothformsofLcrHandthusobtainaKD
value for dimersation, SEC and equilibrium sedimentations were performed. These
showed that both full-length and truncated LcrH possess the sameweakmonomer-
dimer equilibrium (low µM KD), thermodynamic and conformational stability.
Importantly,chemicaldenaturationrevealedthatbothfulllengthandtruncatedforms
ofLcrHunfoldedina3-statetransition,thestatesbeing(i)folded,(ii)partiallyfolded
dimericintermediateand(iii)unfolded.Thiswasinitiallysurprisingasmostproteinsin
the TPR family, of which LcrH is one, unfold in a cooperative manner. Such non-
cooperativebehaviourmustbeduetothedimerisationinterface.Thedimeriscreated
through interaction between the N-terminus thus the weakly folded intermediate
transitionmust be causedby fraying at the C-terminus; as the C-terminus begins to
unfold,theproteinlosesintegritybeforecompletelyunfolding.
Next, a mutation was introduced that has been shown to disrupt the dimerisation
interfaceand createaprotein thatwas solelymonomeric. Thisproteinwas termed
LE65-tr-LcrHandwasproduced,purifiedandcharacterisedusingidenticalbiochemical
andbiophysicalmethodsasthedimer.Thisrevealedthatthemutanthadthesameα-
helical content as dimeric tr-LcrH but, as expected, did not exist as a dimer.
Furthermore, chemical denaturation studies revealed that the mutant was
substantiallydestabilisedcomparedtotr-LcrHwithasinglesharptransitionbetween
the native folded and the denatured states, a classic 2-state transition. Taken in

132
132
conjunctionwiththeinformationgatheredfromthedimer,itisthereforeevidentthat
the dimer interface provides additional thermodynamic stability to the global
structure.Consequently,somestructuresclosetotheinterface(N-terminus)remains
foldedatequilibriumwhileotherpartsofthestructureareunfolded(C-terminus).
PreviousstudieshaveillustratedthesignificanceoftheN-terminusindeterminingthe
arrangementof thesubunitswithinthedimericstructureofclass IIchaperones. For
example, IpgC10-151 produces head to head dimers whereas full length IpgC forms a
back to head dimer [169]. However, the results presented here clearly show that
removalofthefirst20N-terminalaminoacidshavenoeffectonstabilityofLcrHand
therefore it isunlikelythattheseresiduesaredirectly involvedinsubunitpositioning
withinthedimer.
Within the T3SS in Y. pestis, LcrH interacts with the large membrane translocator
proteinsYopBandYopD.However, themechanismbywhichthesesmallchaperones
find their cognate sequences within the large membrane proteins remains unclear.
Excitingly, the results presented here support one possiblemechanism, termed “fly-
casting”. Here, the weakly folded C-terminal repeats of the chaperone adopt a
partiallyfoldedconformationallowingittomoreeasilyfindthetargetpeptideonthe
translocator protein. The chaperone then refolds and remains attached to the
translocator,producingamorerigidstructure.Itisimportantthattheintegrityofthe
N-terminus is retained during this process as in vivo studies have shown that a
monomeric LE65 LcrH homologue in SycD renders the bacteria non-invasive [168].
Suchascenarioisnotwithoutprecedent.Forexample,thethreeTPRmotif-containing
domainofPP5hasbeenshowntobecomemorestructuredwhenboundtoitscognate
bindingpartner,theCterminusofHsp90[212].Moreover,studiesonthesixankyrin
repeatproteinIκBαshowitalsohasaweaklyfoldedCterminus.Here,repeatsfiveand
sixfolduponbindingtotheircognatepartner,thetranscriptionfactorNF-κB[198,213].
It has been shown that the function and lifetimewithin the cell of IκBα is critically
linkedtowhetherthisregionisstructuredvialigandbindingornot[199].Thishasyet
tobeexploredforthetranslocatorchaperones.

133
133
Insummary,thisresultshowsthatthechaperoneLcrHhasaveryflexibleandweakly
folded C-terminus and forms a dimer that is held together by the dimerisation
interfaceat theN-terminus.Wepropose that sucha flexible structurehasbiological
relevance that is important in binding its cognate protein partners. These results
shouldbegenerallyapplicable toall translocator chaperones,as theyall contain the
same TPR motif fold. Furthermore, both the interaction between the N-terminal
dimerisation interface and the C-terminus with its cognate-binding partners are
potentialmoleculartargetsasanalternativetobroad-spectrumantibiotictherapy.
5.1 FutureworkThe future work in this area must surely focus on the protein-protein interaction
betweenthechaperoneLcrHanditscognatebindingpartnerYopBorYopD.YopBand
YopDarelargetransmembraneproteins.So,tocharacterisetheinteractionitwouldbe
therightstepforwardtocreateapeptideofthebindingdomain.
To our advantage, crystallographic studies have been carried out characterising
peptidesbindingtovariousdomainsofthecognatebindingpartnersinP.aeruginosa
and Shigella flexneri but the KD values have been weak. Therefore, the design of
peptidesthatbindmorestronglyisthenextstep.Indeed,theabilitytodisablebinding
of the translocator to the chaperone through competitive inhibition is a key areaof
research.
SuchstudiesemployingtheT3SSfromY.pestisasamodelsystemwillsurelyprovide
an excellent molecular understanding that could lead to molecularly targeted
treatment.WithsomanypotentpathogenicGram-negativebacteriathatemploythe
T3SS,thesignificanceofthissystemcannotbeignored.

134
134
Chapter6 Bibliography1 Eckburg,P.B.,Bik,E.M.,Bernstein,C.N.,Purdom,E.,Dethlefsen,L.,Sargent,
M.,Gill, S.R.,Nelson,K.E.andRelman,D.A. (2005)Diversityof thehumanintestinalmicrobialflora.Science308,1635–1638.
2 Berg, J.M., Tymoczko, J. L. and Stryer, L. (2002) Biochemistry, Fifth Edition:InternationalVersion,GraniteHillPublishers.
3 Hooper,L.V.andGordon,J. I. (2001)Commensalhost-bacterialrelationshipsinthegut.Science292,1115–1118.
4 Curtis,M.M.andSperandio,V.(2011)Acomplexrelationship:theinteractionamong symbioticmicrobes, invading pathogens, and their mammalian host.MucosalImmunol4,133–138.
5 Snyderman, M. and Wiseman, C. (1996) Guide to Marine Life: Caribbean,Bahamas,Florida.AquaQuestPublications,Inc.NewYork.
6 Bäckhed, F., Ley, R. E., Sonnenburg, J. L., Peterson, D. A. and Gordon, J. I.(2005)Host-bacterialmutualism in the human intestine. Science307, 1915–1920.
7 Perry, R. D. and Fetherston, J. D. (1997) Yersinia pestis--etiologic agent ofplague.ClinicalMicrobiologyReview.10,35-66.
8 Traa, B. S.,Walker, C.,Munos,M. andBlack, R. E. (2010)Antibiotics for thetreatment of dysentery in children. International journal of epidemiology.9(Suppl1):i70–74.
9 Hogan, C. M. Types of commensal relationships. Available from<www.eoearth.org/view/article/156381>.[14thJuly2015].
10 Tlaskalová-Hogenová,H.,Stepánková,R.,Hudcovic,T.,Tucková,L.,Cukrowska,B.,Lodinová-Zádníková,R.,Kozáková,H.,Rossmann,P.,Bártová,J.,Sokol,D.,etal. (2004)Commensalbacteria(normalmicroflora),mucosal immunityandchronicinflammatoryandautoimmunediseases.Immunol.Lett.93,97–108.
11 Schramm,G. E., Johnson, J. A., Doherty, J. A.,Micek, S. T. and Kollef,M.H.(2006) Methicillin-resistant Staphylococcus aureus sterile-site infection: Theimportanceofappropriateinitialantimicrobialtreatment.Crit.CareMed.34,2069–2074.
12 Purves, W. K., Orians, G. H., Sadava, D. and Heller, H. C. (2003) Life: TheScience of Biology: Volume III: Plants and Animals 7 ed., Sinauer AssociatesandW.H.Freeman,Sunderland,USA.
13 Rahal, J. J. (2009) Antimicrobial resistance among and therapeutic optionsagainstgram-negativepathogens.Clin.Infect.Dis.49Suppl1,S4–S10.
14 Henderson, I. R., Navarro-Garcia, F., Desvaux, M., Fernandez, R. C. andAla'Aldeen,D. (2004)TypeVprotein secretionpathway: theautotransporterstory.Microbiol.Mol.Biol.Rev.68,692–744.
15 Kudva, R., Denks, K., Kuhn, P., Vogt, A. and Müller, M. (2013) Proteintranslocationacross the innermembraneofGram-negativebacteria: theSecandTatdependentproteintransportpathways.Researchinmicrobiology.164,505-534.

135
135
16 Greenfield,J.J.andHigh,S.(1999)TheSec61complexislocatedinboththeERand theER-Golgi intermediate compartment. J. Cell. Sci.112 (Pt10), 1477–1486.
17 Natale, P., Brüser, T. and Driessen, A. J. M. (2008) Sec- and Tat-mediatedprotein secretion across the bacterial cytoplasmic membrane--distincttranslocasesandmechanisms.Biochim.Biophys.Acta1778,1735–1756.
18 Mao, C., Cheadle, C. E. andHardy, S. (2013) Stoichiometry of SecYEG in theactivetranslocaseofEscherichiacolivarieswithprecursorspecies.Proc.Natl.Acad.Sci.U.S.A.110,11815-20.
19 Akopian, D., Dalal, K., Shen, K., Duong, F. and Shan, S.-O. (2013) SecYEGactivatesGTPasestodrivethecompletionofcotranslationalproteintargeting.TheJournalofcellbiology.200,397-405.
20 Walter,P.(1981)Translocationofproteinsacrosstheendoplasmicreticulum.I. Signal recognition protein (SRP) binds to in-vitro-assembled polysomessynthesizingsecretoryprotein.TheJournalofCellBiology91,545–550.
21 Cross,B.C.S.,Sinning,I.,Luirink,J.andHigh,S.(2009)Deliveringproteinsforexportfromthecytosol.Nat.Rev.Mol.CellBiol.10,255–264.
22 Valent, Q. A. (1998) The Escherichia coli SRP and SecB targeting pathwaysconvergeatthetranslocon.EMBOJ.17,2504–2512.
23 Angelini, S.,Deitermann, S. andKoch,H.-G. (2005) FtsY, thebacterial signal-recognition particle receptor, interacts functionally and physically with theSecYEGtranslocon.EMBORep,EMBOPress6,476–481.
24 Palmer,T.andBerks,B.C.(2012)Thetwin-argininetranslocation(Tat)proteinexportpathway.Nat.Rev.Microbiol.10,483–496.
25 Jongbloed,J.D.,Martin,U.,Antelmann,H.,Hecker,M.,Tjalsma,H.,Venema,G., Bron, S., van Dijl, J. M. and Müller, J. (2000) TatC is a specificitydeterminantforproteinsecretionviathetwin-argininetranslocationpathway.J.Biol.Chem.275,41350–41357.
26 Delepelaire, P. (2004) Type I secretion in gram-negative bacteria. Biochim.Biophys.Acta1694,149–161.
27 Dawson,R.J.P.andLocher,K.P.(2006)StructureofabacterialmultidrugABCtransporter.Nature443,180–185.
28 Murakami,S.,Nakashima,R.,Yamashita,E.andYamaguchi,A. (2002)CrystalstructureofbacterialmultidrugeffluxtransporterAcrB.Nature419,587–593.
29 Binet, R. and Wandersman, C. (1995) Protein secretion by hybrid bacterialABC-transporters: specific functions of the membrane ATPase and themembranefusionprotein.EMBOJ.14,2298–2306.
30 Thanabalu, T., Koronakis, E., Hughes, C. and Koronakis, V. (1998) Substrate-induced assembly of a contiguous channel for protein export from E.coli:reversiblebridgingofan inner-membranetranslocasetoanoutermembraneexitpore.EMBOJ.17,6487–6496.
31 Sharff,A.,Fanutti,C.,Shi, J.,Calladine,C.andLuisi,B. (2001)Theroleof theTolC family in protein transport and multidrug efflux. From stereochemicalcertaintytomechanistichypothesis.Eur.J.Biochem.268,5011–5026.
32 Graham WV, Turner JR. Introduction to the host and bacterial pathogens-Homelandsecurity:Epitheliaasfirstlinedefenders.InBacterial-EpithelialCellCross-Talk: Molecular Mechanisms in Pathogenesis. McCormick, BA (Ed.).

136
136
2006.Cambridge:CambridgeUniversityPress.33 Koronakis,V.,Sharff,A.,Koronakis,E., Luisi,B.andHughes,C. (2000)Crystal
structureof thebacterialmembraneproteinTolC central tomultidrugeffluxandproteinexport.Nature.405,914-19.
34 Touzé,T.,Eswaran, J.andBokma,E. (2004) Interactionsunderlyingassemblyof the Escherichia coli AcrAB–TolC multidrug efflux system. MolecularMicrobiology.53(2),697-706.
35 Guzzo, J., Duong, F.,Wandersman, C.,Murgier,M. and Lazdunski, A. (1991)The secretion genes of Pseudomonas aeruginosa alkaline protease arefunctionally related to those of Erwinia chrysanthemi proteases andEscherichiacolialpha-haemolysin.Mol.Microbiol.5,447–453.
36 Létoffé,S.,Delepelaire,P.andWandersman,C.(1991)CloningandexpressioninEscherichiacolioftheSerratiamarcescensmetalloproteasegene:secretionof the protease from E. coli in the presence of the Erwinia chrysanthemiproteasesecretionfunctions.J.Bacteriol.173,2160–2166.
37 Duong, F., Lazdunski, A. and Murgier, M. (1996) Protein secretion byheterologous bacterial ABC-transporters: the C-terminus secretion signal ofthe secreted protein confers high recognition specificity.Mol.Microbiol.21,459–470.
38 Filloux, A. (2004) The underlying mechanisms of type II protein secretion.BiochimicaetBiophysicaActa(BBA)-MolecularCellResearch.1694,163-179.
39 Sandkvist,M.(2001)BiologyoftypeIIsecretion.Mol.Microbiol.271–283.40 Camberg, J. L. and Sandkvist, M. (2005) Molecular analysis of the Vibrio
choleraetypeIIsecretionATPaseEpsE.J.Bacteriol.187,249–256.41 Camberg, J. L., Johnson, T. L., Patrick, M., Abendroth, J., Hol, W. G. J. and
Sandkvist,M.(2007)SynergisticstimulationofEpsEATPhydrolysisbyEpsLandacidicphospholipids.EMBOJ.26,19–27.
42 Sandkvist, M., Bagdasarian, M., Howard, S. P. and DiRita, V. J. (1995)Interaction between the autokinase EpsE and EpsL in the cytoplasmicmembrane is required forextracellular secretion inVibrio cholerae.EMBO J.14,1664–1673.
43 Sandkvist,M., Hough, L. P., Bagdasarian,M.M. and Bagdasarian,M. (1999)Direct interaction of the EpsL and EpsM proteins of the general secretionapparatusinVibriocholerae.J.Bacteriol.181,3129–3135.
44 Daefler,S.,Guilvout,I.,Hardie,K.R.,Pugsley,A.P.andRussel,M.(1997)TheC-terminaldomainofthesecretinPulDcontainsthebindingsiteforitscognatechaperone, PulS, and confers PulS dependence on pIVf1 function. Mol.Microbiol.24,465–475.
45 Shevchik, V. E. and Condemine, G. (1998) Functional characterization of theErwiniachrysanthemiOutSprotein,anelementofatypeIIsecretionsystem.Microbiology(Reading,Engl.)144(Pt11),3219–3228.
46 Nouwen,N.,Ranson,N.,Saibil,H.,Wolpensinger,B.,Engel,A.,Ghazi,A.andPugsley,A.P.(1999)SecretinPulD:associationwithpilotPulS,structure,andion-conductingchannelformation.Proc.Natl.Acad.Sci.U.S.A.96,8173–8177.
47 Cornelis,G.R.(2006)ThetypeIIIsecretioninjectisome.Nat.Rev.Microbiol.4,811–825.
48 Mota, L. J. and Cornelis, G. R. (2005) The bacterial injection kit: type III

137
137
secretionsystems.Ann.Med.37,234–249.49 Grant,S.R.,Fisher,E. J.,Chang, J.H.andMole,B.M. (2006)Subterfugeand
manipulation:typeIIIeffectorproteinsofphytopathogenicbacteria.AnnuRevMicrobiol.60,425-49.
50 Lindeberg,M.,Biehl,B.S.,Glasner,J.D.,Perna,N.T.,Collmer,A.andCollmer,C. W. (2009) Gene Ontology annotation highlights shared and divergentpathogenic strategies of type III effector proteins deployed by the plantpathogen Pseudomonas syringae pv tomato DC3000 and animal pathogenicEscherichiacolistrains.BMCMicrobiol.9Suppl1,S4.
51 Torto-Alalibo, T., Collmer, C. W. and Lindeberg, M. (2009) Common andcontrasting themes in host cell-targeted effectors from bacterial, fungal,oomyceteandnematodeplantsymbiontsdescribedusingtheGeneOntologyBMC9Suppl1,S3.
52 Christie, P. J. and Cascales, E. (2005) Structural and dynamic properties ofbacterialtypeIVsecretionsystems(review).Mol.Membr.Biol.22,51–61.
53 Walldén,K.,Williams,R.,Yan,J.,Lian,P.W.,Wang,L.,Thalassinos,K.,Orlova,E.V.andWaksman,G.(2012)StructureoftheVirB4ATPase,aloneandboundtothecorecomplexofatypeIVsecretionsystem.Proc.Natl.Acad.Sci.U.S.A.109,11348–11353.
54 Fronzes, R., Christie, P. J. andWaksman, G. (2009) The structural biology oftypeIVsecretionsystems.Nat.Rev.Microbiol.7,703–714.
55 Costa, T. R. D., Felisberto-Rodrigues, C.,Meir, A., Prevost,M. S., Redzej, A.,Trokter, M. and Waksman, G. (2015) Secretion systems in Gram-negativebacteria:structuralandmechanisticinsights.Nat.Rev.Microbiol.13,343–359.
56 Chagnot,C.,Zorgani,M.A.,Astruc,T.andDesvaux,M. (2013)Proteinaceousdeterminants of surface colonization in bacteria: bacterial adhesion andbiofilmformationfromaproteinsecretionperspective.FrontMicrobiol4,303.
57 Jacob-Dubuisson, F., Fernandez, R. and Coutte, L. (2004) Protein secretionthrough autotransporter and two-partner pathways. Biochim. Biophys. Acta1694,235–257.
58 Dautin, N. and Bernstein, H. D. (2007) Protein secretion in gram-negativebacteriaviatheautotransporterpathway.Annu.Rev.Microbiol.61,89–112.
59 Bernstein, H. D. (2007) Are bacterial “autotransporters” really transporters?TrendsinMicrobiology,Elsevier15,441–447.
60 Leininger, E., Roberts, M., Kenimer, J. G., Charles, I. G., Fairweather, N.,Novotny, P. and Brennan, M. J. (1991) Pertactin, an Arg-Gly-Asp-containingBordetellapertussis surfaceprotein thatpromotesadherenceofmammaliancells.Proc.Natl.Acad.Sci.U.S.A.88,345–349.
61 Hoiczyk,E.,Roggenkamp,A.,Reichenbecher,M.,Lupas,A.andHeesemann,J.(2000)StructureandsequenceanalysisofYersiniaYadAandMoraxellaUspAsrevealanovelclassofadhesins.EMBOJ.19,5989–5999.
62 Pukatzki,S.,Ma,A.T.,Sturtevant,D.,Krastins,B.,Sarracino,D.,Nelson,W.C.,Heidelberg, J. F. and Mekalanos, J. J. (2006) Identification of a conservedbacterial protein secretion system inVibrio choleraeusing theDictyosteliumhostmodelsystem.Proc.Natl.Acad.Sci.U.S.A.103,1528–1533.
63 Mougous, J. D., Cuff, M. E., Raunser, S., Shen, A., Zhou, M., Gifford, C. A.,Goodman, A. L., Joachimiak, G., Ordoñez, C. L., Lory, S., et al. (2006) A

138
138
virulence locus of Pseudomonas aeruginosa encodes a protein secretionapparatus.Science312,1526–1530.
64 Dudley,E.G.,Thomson,N.R.,Parkhill,J.,Morin,N.P.andNataro,J.P.(2006)Proteomic and microarray characterization of the AggR regulon identifies apheU pathogenicity island in enteroaggregative Escherichia coli. Mol.Microbiol.61,1267–1282.
65 Wu, H.-Y., Chung, P.-C., Shih, H.-W., Wen, S.-R. and Lai, E.-M. (2008)Secretome analysis uncovers an Hcp-family protein secreted via a type VIsecretionsysteminAgrobacteriumtumefaciens.J.Bacteriol.190,2841–2850.
66 Bartonickova, L., Sterzenbach, T., Nell, S., Kops, F., Schulze, J., Venzke, A.,Brenneke, B., Bader, S., Gruber, A. D., Suerbaum, S., et al. (2013) Hcp andVgrG1 are secreted components of the Helicobacter hepaticustype VIsecretion system and VgrG1 increases the bacterial colitogenic potential.CellularMicrobiology15,992–1011.
67 Pallen,M.,Chaudhuri,R.andKhan,A.(2002)BacterialFHAdomains:neglectedplayersinthephospho-threoninesignallinggame?TrendsinMicrobiology10,556–563.
68 Schlieker, C., Zentgraf, H., Dersch, P. and Mogk, A. (2005) ClpV, a uniqueHsp100/Clp member of pathogenic proteobacteria. Biol. Chem. 386, 1115–1127.
69 Cascales,E.(2008)ThetypeVIsecretiontoolkit.EMBORep9,735–741.70 Records, A. R. (2011) The type VI secretion system: amultipurpose delivery
systemwithaphage-likemachinery.Mol.PlantMicrobeInteract.24,751–757.71 Kanamaru, S. (2009) Structural similarity of tailed phages and pathogenic
bacterialsecretionsystems.Proc.Natl.Acad.Sci.U.S.A.106,4067–4068.72 Chatterjee, S. N. and Chaudhuri, K. (2011) Outer Membrane Vesicles of
Bacteriawhichareinternalisedbyintestinalepithelialcells.FEBSletters.585,1357-1362.
73 Ho,B.T.,Dong,T.G.andMekalanos,J.J.(2014)Aviewtoakill:thebacterialtypeVIsecretionsystem.CellHostMicrobe15,9–21.
74 Felisberto-Rodrigues, C., Durand, E., Aschtgen, M.-S., Blangy, S., Ortiz-Lombardia, M., Douzi, B., Cambillau, C. and Cascales, E. (2011) Towards astructural comprehension of bacterial type VI secretion systems:characterization of the TssJ-TssM complex of an Escherichia coli pathovar.PLoSPathog.7,e1002386.
75 Boyer, F., Fichant, G., Berthod, J., Vandenbrouck, Y. and Attree, I. (2009)Dissecting the bacterial typeVI secretion systemby a genomewide in silicoanalysis: what can be learned from available microbial genomic resources?BMCGenomics10,104.
76 Zheng,J.,Ho,B.andMekalanos,J.J.(2011)Geneticanalysisofanti-amoebaeandanti-bacterialactivitiesofthetypeVIsecretionsysteminVibriocholerae.PLoSONE6,e23876.
77 Zheng, J. and Leung, K. Y. (2007)Dissectionof a typeVI secretion system inEdwardsiellatarda.Mol.Microbiol.66,1192–1206.
78 Silverman,J.M.,Brunet,Y.R.,Cascales,E.andMougous,J.D.(2012)StructureandregulationofthetypeVIsecretionsystem.Annu.Rev.Microbiol.66,453–472.

139
139
79 Ruiz, F.M., Santillana, E., Spínola-Amilibia,M., Torreira, E., Culebras, E. andRomero, A. (2015) Correction: Crystal Structure of Hcp from Acinetobacterbaumannii: A Component of the Type VI Secretion System. PLoS ONE 10,e0136978.
80 Galindo, C. L., Rosenzweig, J. A., Kirtley, M. L. and Chopra, A. K. (2011)Pathogenesis of Y. enterocolitica and Y. pseudotuberculosis in HumanYersiniosis.JPathog2011,182051.
81 Schroeder,G.N.andHilbi,H.(2008)MolecularpathogenesisofShigellaspp.:controlling host cell signaling, invasion, anddeath by type III secretion. Clin.Microbiol.Rev.21,134–156.
82 Agbor, T. A. and McCormick, B. A. (2011) Salmonella effectors: importantplayersmodulating host cell function during infection. CellularMicrobiology13,1858–1869.
83 Dean, P. (2011) Functional domains andmotifs of bacterial type III effectorproteinsandtheirrolesininfection.FEMSMicrobiol.Rev.35,1100–1125.
84 Wong,A.R.C.,Pearson,J.S.,Bright,M.D.,Munera,D.,Robinson,K.S.,Lee,S.F., Frankel, G. and Hartland, E. L. (2011) Enteropathogenic andenterohaemorrhagic Escherichia coli: even more subversive elements. Mol.Microbiol.80,1420–1438.
85 Bush, K., Courvalin, P., Dantas, G., Davies, J., Eisenstein, B., Huovinen, P.,Jacoby, G. A., Kishony, R., Kreiswirth, B. N., Kutter, E., et al. (2011) Tacklingantibioticresistance.Nat.Rev.Microbiol.9,894–896.
86 Trosky, J. E., Liverman, A. andOrth, K. (2008) Yersinia outer proteins: Yops.CellularMicrobiology10,557–565.
87 Sample,A.K.,Fowler,J.M.andBrubaker,R.R.(1987)Modulationofthelow-calcium response in Yersinia pestis via plasmid-plasmid interaction. Microb.Pathog.2,443–453.
88 Mehigh,R. J.,Sample,A.K.andBrubaker,R.R. (1989)Expressionof the lowcalciumresponseinYersiniapestis.Microb.Pathog.6,203–217.
89 Michiels,T.,Wattiau,P.andBrasseur,R. (1990)SecretionofYopproteinsbyYersiniae.InfectionandImmunity.58,2840-2849.
90 Straley, S.C., Plano,G.V., Skrzypek,E.,Haddix,P. L. andFields,K.A. (1993)Regulation by Ca2+ in the Yersinia low-Ca2+ response. Mol. Microbiol. 8,1005–1010.
91 Koster,M.,Bitter,W.,deCock,H.,Allaoui,A.,Cornelis,G.R.andTommassen,J. (1997) The outer membrane component, YscC, of the Yop secretionmachineryofYersiniaenterocoliticaformsaring-shapedmultimericcomplex.Mol.Microbiol.26,789–797.
92 Diepold,A.,Amstutz,M.,Abel,S.,Sorg,I.,Jenal,U.andCornelis,G.R.(2010)DecipheringtheassemblyoftheYersiniatypeIIIsecretioninjectisome.EMBOJ.29,1928–1940.
93 Spreter, T., Yip, C. K., Sanowar, S.,André, I., Kimbrough, T.G.,Vuckovic,M.,Pfuetzner, R. A., Deng,W., Yu, A. C., Finlay, B. B., et al. (2009) A conservedstructural motif mediates formation of the periplasmic rings in the type IIIsecretionsystem.Nat.Struct.Mol.Biol.16,468–476.
94 Ross, J.A.andPlano,G.V. (2011)AC-terminalregionofYersiniapestisYscDbindstheoutermembranesecretinYscC.J.Bacteriol.193,2276–2289.

140
140
95 Yip, C. K., Kimbrough, T. G., Felise, H. B., Vuckovic, M., Thomas, N. A.,Pfuetzner,R.A.,Frey,E.A.,BrettFinlay,B.,Miller,S.I.andStrynadka,N.C.J.(2005) Structural characterization of the molecular platform for type IIIsecretionsystemassembly.Nature435,702–707.
96 Hodgkinson, J. L., Horsley, A., Stabat, D. and Simon, M. (2009) Three-dimensional reconstruction of the Shigella T3SS transmembrane regionsreveals12-foldsymmetryandnovelfeaturesthroughout.Naturestructural&molecularbiology.16,477-85.
97 Dewoody, R. S. andMerritt, P.M. (2013) Regulation of the Yersinia type IIIsecretion system: traffic control. Frontiers in cellular and infectionmicrobiology.3:4.
98 Allaoui,A.,Woestyn,S.,Sluiters,C.andCornelis,G.R.(1994)YscU,aYersiniaenterocoliticainnermembraneproteininvolvedinYopsecretion.Journalof….
99 Fields,K.A.,Plano,G.V.andStraley,S.C. (1994)A low-Ca2+response (LCR)secretion(ysc) locus lieswithinthe lcrBregionoftheLCRplasmid inYersiniapestis.J.Bacteriol.176,569-79.
100 Minamino,T., Iino,T.andKutuskake,K. (1994)MolecularcharacterizationoftheSalmonellatyphimuriumflhBoperonanditsproteinproducts.J.Bacteriol.176,7630–7637.
101 Creasey,E.A.,Delahay,R.M.,Daniell,S. J.andFrankel,G. (2003)Yeasttwo-hybrid system survey of interactions between LEE-encoded proteins ofenteropathogenic Escherichia coli. Microbiology (Reading, Engl.) 149, 2093–2106.
102 Melén, K., Krogh, A. and Heijne, von, G. (2003) Reliability measures formembraneproteintopologypredictionalgorithms.J.Mol.Biol.327,735–744.
103 Ghosh,P.(2004)ProcessofproteintransportbythetypeIIIsecretionsystem.Microbiologyandmolecularbiologyreviews.62,379-433.
104 Berger,C.,Robin,G.P.,Bonas,U.andKoebnik,R.(2010)Membranetopologyof conserved components of the type III secretion system from the plantpathogen Xanthomonas campestris pv. vesicatoria. Microbiology (Reading,Engl.)156,1963–1974.
105 Diepold,A.,Wiesand,U.andCornelis,G.R.(2011)Theassemblyoftheexportapparatus (YscR,S,T,U,V) of the Yersinia type III secretion apparatus occursindependentlyofother structural componentsand involves the formationofanYscVoligomer.Mol.Microbiol.82,502–514.
106 Day,J.B.andPlano,G.V.(2000)TheYersiniapestisYscYproteindirectlybindsYscX, a secreted componentof the type III secretionmachinery. J. Bacteriol.182,1834–1843.
107 Blaylock, B., Berube, B. J. and Schneewind, O. (2010) YopR impacts type IIIneedlepolymerizationinYersiniaspecies.Mol.Microbiol.75,221–229.
108 Agrain, C., Sorg, I. and Paroz, C. (2005) Secretion of YscP from Yersiniaenterocolitica isessential tocontrol the lengthof the injectisomeneedlebutnottochangethetypeIIIsecretionsubstratespecificity.Mol.Microbiol.
109 Payne,P. L. andStraley, S.C. (1998)YscOof Yersiniapestis is amobile corecomponentoftheYopsecretionsystem.J.Bacteriol.180,3882–3890.
110 Payne, P. L. and Straley, S. C. (1999) YscP of Yersinia pestis is a secretedcomponentoftheYopsecretionsystem.J.Bacteriol.181,2852–2862.

141
141
111 Wood,S.E.,Jin,J.andLloyd,S.A.(2008)YscPandYscUswitchthesubstratespecificityoftheYersiniatypeIIIsecretionsystembyregulatingexportoftheinnerrodproteinYscI.J.Bacteriol.190,4252-62.
112 Marlovits,T.C.,Kubori,T.,Sukhan,A.,Thomas,D.R.,Galán,J.E.andUnger,V.M.(2004)StructuralinsightsintotheassemblyofthetypeIIIsecretionneedlecomplex.Science306,1040–1042.
113 Blocker,A.,Jouihri,N.,Larquet,E.,Gounon,P.,Ebel,F.,Parsot,C.,Sansonetti,P. and Allaoui, A. (2001) Structure and composition of the Shigella flexneri“needlecomplex,”apartofitstypeIIIsecreton.Mol.Microbiol.39,652–663.
114 Hoiczyk, E. and Blobel, G. (2001) Polymerization of a single protein of thepathogenYersiniaenterocoliticaintoneedlespunctureseukaryoticcells.Proc.Natl.Acad.Sci.U.S.A.98,4669–4674.
115 Journet,L.,Agrain,C.,Broz,P.andCornelis,G.R.(2003)Theneedlelengthofbacterialinjectisomesisdeterminedbyamolecularruler.Science302,1757–1760.
116 Kubori,T.,Matsushima,Y.,Nakamura,D.,Uralil,J.,Lara-Tejero,M.,Sukhan,A.,Galán,J.E.andAizawa,S.I.(1998)SupramolecularstructureoftheSalmonellatyphimuriumtypeIIIproteinsecretionsystem.Science.280,602–605.
117 Allaoui, A., Schulte, R. and Cornelis, G. R. (1995)Mutational analysis of theYersinia enterocolitica virC operon: characterization of yscE, F, G, I, J, KrequiredforYopsecretionandyscHencodingYopR-Allaoui(2004).MolecularMicrobiology.18,343-355.
118 Lee,V.T.andSchneewind,O.(1999)TypeIIImachinesofpathogenicyersiniaesecrete virulence factors into the extracellular milieu. Mol. Microbiol. 31,1619–1629.
119 Mueller,C.A.,Broz,P.,Müller,S.A.,Ringler,P.,Erne-Brand,F.,Sorg,I.,Kuhn,M., Engel, A. and Cornelis, G. R. (2005) The V-antigen of Yersinia forms adistinctstructureatthetipofinjectisomeneedles.Science310,674–676.
120 Costa,T.R.D.,Amer,A.A.A.,Farag,S.I.,Wolf-Watz,H.,Fällman,M.,Fahlgren,A.,Edgren,T.andFrancis,M.S.(2013)TypeIIIsecretiontransloconassembliesthatattenuateYersiniavirulence.CellularMicrobiology15,1088–1110.
121 SchubotFD,JacksonMW,PenroseKJ,etal.Three-dimensionalstructureofamacromolecular assembly that regulates type III secretion in Yersinia pestis.(2005).JournalofMolecularBiology.346,1147–1161.
122 Kleiner,M.,Young,J.C.,Shah,M.,VerBerkmoes,N.C.andDubilier,N.(2013)Metaproteomics reveals abundant transposase expression in mutualisticendosymbionts.MBio4,e00223–13.
123 Du,D.,Wang,Z.,James,N.R.,Voss,J.E.,Klimont,E.,Ohene-Agyei,T.,Venter,H.,Chiu,W.andLuisi,B.F.(2014)StructureoftheAcrAB-TolCmultidrugeffluxpump.Nature509,512–515.
124 Mikolosko,J.,Bobyk,K.,Zgurskaya,H.I.andGhosh,P.(2006)ConformationalflexibilityinthemultidrugeffluxsystemproteinAcrA.Structure14,577–587.
125 Pei,X.-Y.,Hinchliffe,P.,Symmons,M.F.,Koronakis,E.,Benz,R.,Hughes,C.andKoronakis, V. (2011) Structures of sequential open states in a symmetricalopeningtransitionoftheTolCexitduct.Proc.Natl.Acad.Sci.U.S.A.108,2112–2117.
126 Lu, C., Turley, S.,Marionni, S. T., Park, Y.-J., Lee, K. K., Patrick,M., Shah, R.,

142
142
Sandkvist,M., Bush,M. F. and Hol,W. G. J. (2013) Hexamers of the type IIsecretion ATPase GspE from Vibrio cholerae with increased ATPase activity.Structure21,1707–1717.
127 Korotkov,K.V.,Johnson,T.L.,Jobling,M.G.,Pruneda,J.,Pardon,E.,Héroux,A.,Turley,S.,Steyaert,J.,Holmes,R.K.,Sandkvist,M.,etal.(2011)Structuraland functional studies on the interaction of GspC and GspD in the type IIsecretionsystem.PLoSPathog.7,e1002228.
128 Abendroth, J., Mitchell, D. D., Korotkov, K. V., Johnson, T. L., Kreger, A.,Sandkvist,M.andHol,W.G.J.(2009)Thethree-dimensionalstructureofthecytoplasmic domains of EpsF from the type 2 secretion system of Vibriocholerae.J.Struct.Biol.166,303–315.
129 Abendroth,J.,Kreger,A.C.andHol,W.G.J.(2009)Thedimerformedbytheperiplasmic domain of EpsL from the Type 2 Secretion System of Vibrioparahaemolyticus.J.Struct.Biol.168,313–322.
130 Abendroth, J.,Murphy, P., Sandkvist,M., Bagdasarian,M. and Hol,W. G. J.(2005)TheX-raystructureofthetypeIIsecretionsystemcomplexformedbytheN-terminaldomainofEpsEandthecytoplasmicdomainofEpsLofVibriocholerae.J.Mol.Biol.348,845–855.
131 Abendroth, J., Rice, A. E., McLuskey, K., Bagdasarian, M. and Hol, W. G. J.(2004)ThecrystalstructureoftheperiplasmicdomainofthetypeIIsecretionsystem protein EpsM from Vibrio cholerae: the simplest version of theferredoxinfold.J.Mol.Biol.338,585–596.
132 Korotkov,K.V.,Gray,M.D.,Kreger,A.,Turley,S.,Sandkvist,M.andHol,W.G.J.(2009)Calciumisessentialforthemajorpseudopilininthetype2secretionsystem.J.Biol.Chem.284,25466–25470.
133 Raghunathan, K., Vago, F. S., Grindem, D., Ball, T., Wedemeyer, W. J.,Bagdasarian,M.andArvidson,D.N. (2014)The1.59Åresolutionstructureofthe minor pseudopilin EpsH of Vibrio cholerae reveals a long flexible loop.Biochim.Biophys.Acta1844,406–415.
134 Korotkov, K. V. and Hol, W. G. J. (2008) Structure of the GspK-GspI-GspJcomplex from the enterotoxigenic Escherichia coli type 2 secretion system.Nat.Struct.Mol.Biol.15,462–468.
135 Korotkov, K. V., Pardon, E., Steyaert, J. and Hol, W. G. J. (2009) Crystalstructure of the N-terminal domain of the secretin GspD from ETECdeterminedwiththeassistanceofananobody.Structure.17,255–265.
136 Korotkov,K.V.andHol,W.G.J.(2013)Crystalstructureofthepilotinfromtheenterohemorrhagic Escherichia coli type II secretion system. J. Struct. Biol.182,186–191.
137 Gamez,A.,Mukerjea,R.,Alayyoubi,M.,Ghassemian,M.andGhosh,P.(2012)Structure and interactionsof the cytoplasmic domainof the Yersinia type IIIsecretionproteinYscD.J.Bacteriol.194,5949–5958.
138 Wiesand,U., Sorg, I., Amstutz,M.,Wagner, S., vandenHeuvel, J., Lührs, T.,Cornelis, G. R. and Heinz, D. W. (2009) Structure of the type III secretionrecognitionprotein YscU fromYersinia enterocolitica. J.Mol. Biol.385, 854–866.
139 Sun,P.,Tropea,J.E.,Austin,B.P.,Cherry,S.andWaugh,D.S.(2008)StructuralcharacterizationoftheYersiniapestistypeIIIsecretionsystemneedleprotein

143
143
YscFincomplexwithitsheterodimericchaperoneYscE/YscG.J.Mol.Biol.377,819–830.
140 Schubot,F.D.,Cherry,S.,Austin,B.P.,Tropea, J.E.andWaugh,D.S. (2005)Crystal structure of the protease-resistant core domain of Yersinia pestisvirulencefactorYopR.ProteinSci.14,1679–1683.
141 Derewenda,U.,Mateja,A.,Devedjiev,Y.,Routzahn,K.M.,Evdokimov,A.G.,Derewenda,Z.S.andWaugh,D.S. (2004)ThestructureofYersiniapestisV-antigen, an essential virulence factor and mediator of immunity againstplague.Structure12,301–306.
142 Schreiner, M. and Niemann, H. H. (2012) Crystal structure of the YersiniaenterocoliticatypeIIIsecretionchaperoneSycDincomplexwithapeptideoftheminortranslocatorYopD.BMCStructBiol12,13.
143 Hare,S.,Bayliss,R.,Baron,C.andWaksman,G.(2006)Alargedomainswapinthe VirB11 ATPase of Brucella suis leaves the hexameric assembly intact. J.Mol.Biol.360,56–66.
144 Smith,M.A., Coinçon,M., Paschos, A., Jolicoeur, B., Lavallée, P., Sygusch, J.and Baron, C. (2012) Identification of the binding site of Brucella VirB8interactioninhibitors.Chem.Biol.19,1041–1048.
145 Chandran,V.,Fronzes,R.,Duquerroy,S.,Cronin,N.,Navaza,J.andWaksman,G. (2009) Structure of the outer membrane complex of a type IV secretionsystem.Nature462,1011–1015.
146 Rivera-Calzada, A., Fronzes, R., Savva, C. G., Chandran, V., Lian, P. W.,Laeremans,T.,Pardon,E.,Steyaert,J.,Remaut,H.,Waksman,G.,etal.(2013)Structure of a bacterial type IV secretion core complex at subnanometreresolution.EMBOJ.32,1195–1204.
147 Durand,E.,Zoued,A.,Spinelli,S.,Watson,P.J.H.,Aschtgen,M.S.,Journet,L.,Cambillau, C. and Cascales, E. (2012) Structural characterization andoligomerizationof theTssLprotein,acomponentsharedbybacterial typeVIandtypeIVbsecretionsystems.J.Biol.Chem.287,14157–14168.
148 Pietrosiuk, A., Lenherr, E. D., Falk, S., Bönemann, G., Kopp, J., Zentgraf, H.,Sinning,I.andMogk,A.(2011)MolecularbasisfortheuniqueroleoftheAAA+chaperoneClpVintypeVIproteinsecretion.J.Biol.Chem.286,30010–30021.
149 Kudryashev,M.,Wang,R.Y.-R.,Brackmann,M.,Scherer,S.,Maier,T.,Baker,D.,DiMaio,F.,Stahlberg,H.,Egelman,E.H.andBasler,M.(2015)StructureofthetypeVIsecretionsystemcontractilesheath.Cell160,952–962.
150 Shneider,M.M.,Buth,S.A.,Ho,B.T.,Basler,M.,Mekalanos,J.J.andLeiman,P.G.(2013)PAAR-repeatproteinssharpenanddiversifythetypeVIsecretionsystemspike.Nature500,350–353.
151 Button,J.E.andGalán,J.E.(2011)Regulationofchaperone/effectorcomplexsynthesis in a bacterial type III secretion system.Mol.Microbiol. 81, 1474–1483.
152 Feldman, M. F. and Cornelis, G. R. (2003) The multitalented type IIIchaperones:allyoucandowith15kDa.FEMSMicrobiol.Lett.219,151–158.
153 Parsot,C.,Hamiaux,C.andPage,A.-L.(2003)Thevariousandvaryingrolesofspecificchaperones in type III secretionsystems.Curr.Opin.Microbiol.6,7–14.
154 Wilharm, G., Dittmann, S. and Schmid, A. (2007) On the role of specific

144
144
chaperones, the specific ATPase, and the proton motive force in type IIIsecretion.Internationaljournalofmedicalmicrobiology.297,27-36.
155 Trame,C.B.andMcKay,D.B. (2003)Structureof theYersiniaenterocoliticamolecular-chaperone protein SycE. Acta Crystallogr. D Biol. Crystallogr. 59,389–392.
156 Phan,J.,Tropea,J.E.andWaugh,D.S.(2004)StructureoftheYersiniapestistypeIIIsecretionchaperoneSycHincomplexwithastablefragmentofYscM2.ActaCrystallogr.DBiol.Crystallogr.60,1591–1599.
157 Schubot,F.D.,Jackson,M.W.,Penrose,K.J.,Cherry,S.,Tropea,J.E.,Plano,G.V.andWaugh,D.S.(2005)Three-dimensionalstructureofamacromolecularassembly that regulates type III secretion inYersiniapestis. J.Mol.Biol.346,1147–1161.
158 Locher,M., Lehnert,B.,Krauss,K.,Heesemann, J.,Groll,M.andWilharm,G.(2005) Crystal structure of the Yersinia enterocolitica type III secretionchaperoneSycT.J.Biol.Chem.280,31149–31155.
159 Büttner,C.R.,Cornelis,G.R.,Heinz,D.W.andNiemann,H.H.(2005)CrystalstructureofYersiniaenterocolitica type III secretionchaperoneSycT.ProteinSci.14,1993–2002.
160 Luo,Y.,Bertero,M.G., Frey,E.A.,Pfuetzner,R.A.,Wenk,M.R.,Creagh, L.,Marcus, S. L., Lim, D., Sicheri, F., Kay, C., et al. (2001) Structural andbiochemical characterization of the type III secretion chaperones CesT andSigE.Nat.Struct.Biol.8,1031–1036.
161 Johnson, S., Deane, J. E. and Lea, S. M. (2005) The type III needle and thedamagedone.Curr.Opin.Struct.Biol.15,700–707.
162 Birtalan,S.C.,Phillips,R.M.andGhosh,P.(2002)Three-dimensionalsecretionsignals in chaperone-effector complexes of bacterial pathogens.Mol. Cell9,971–980.
163 Stebbins,C.E.andGalán,J.E.(2001)MaintenanceofanunfoldedpolypeptidebyacognatechaperoneinbacterialtypeIIIsecretion.Nature414,77–81.
164 Birtalan, S. and Ghosh, P. (2001) Structure of the Yersinia type III secretorysystemchaperoneSycE.Nat.Struct.Biol.8,974–978.
165 Costa,S.C.P.,Schmitz,A.M.,Jahufar,F.F.,Boyd,J.D.,Cho,M.Y.,Glicksman,M. A. and Lesser, C. F. (2012) A new means to identify type 3 secretedeffectors: functionally interchangeable class IB chaperones recognize aconservedsequence.MBio3(1),e00243-11.
166 Job, V.,Matteï, P.-J., Lemaire, D., Attree, I. andDessen, A. (2010) StructuralbasisofchaperonerecognitionoftypeIIIsecretionsystemminortranslocatorproteins.J.Biol.Chem.285,23224–23232.
167 Lunelli, M., Lokareddy, R. K., Zychlinsky, A. and Kolbe, M. (2009) IpaB-IpgCinteractiondefinesbindingmotiffortypeIIIsecretiontranslocator.Proc.Natl.Acad.Sci.U.S.A.106,9661–9666.
168 Büttner,C.R.,Sorg,I.,Cornelis,G.R.,Heinz,D.W.andNiemann,H.H.(2008)Structure of the Yersinia enterocolitica type III secretion translocatorchaperoneSycD.J.Mol.Biol.375,997–1012.
169 Barta,M.L.,Zhang,L.,Picking,W.L.andGeisbrecht,B.V.(2010)Evidenceforalternative quaternary structure in a bacterial Type III secretion systemchaperone.BMCStructBiol10,21.

145
145
170 Blatch,G. L. and Lässle,M. (1999) The tetratricopeptide repeat: a structuralmotifmediatingprotein-proteininteractions.Bioessays.21,932-9.
171 Das, A. K., Cohen, P. and Barford, D. (1998) The structure of thetetratricopeptide repeats of protein phosphatase 5: implications for TPR-mediatedprotein–proteininteractions.EMBOJ.17,1192-1199.
172 D'Andrea,L.D.andRegan,L.(2003)TPRproteins:theversatilehelix.Trendsinbiochemicalsciences.28,655-662.
173 Quinaud,M.,Plé,S.,Job,V.,Contreras-Martel,C.,Simorre,J.-P.,Attree,I.andDessen,A.(2007)StructureoftheheterotrimericcomplexthatregulatestypeIIIsecretionneedleformation.Proc.Natl.Acad.Sci.U.S.A.104,7803–7808.
174 Tan,Y.W.,Yu,H.B.,Sivaraman,J.,Leung,K.Y.andMok,Y.-K.(2009)Mappingof the chaperoneAcrHbinding regions of translocatorsAopB andAopDandcharacterizationofoligomericandmetastableAcrH-AopB-AopDcomplexes inthetypeIIIsecretionsystemofAeromonashydrophila.ProteinSci.18,1724–1734.
175 Adam,P.R.,Patil,M.K.,Dickenson,N.E.,Choudhari,S.,Barta,M.,Geisbrecht,B.V.,Picking,W.L.andPicking,W.D.(2012)Bindingaffectsthetertiaryandquaternary structures of the Shigella translocator protein IpaB and itschaperoneIpgC.Biochemistry51,4062–4071.
176 Lokareddy, R. K., Lunelli, M., Eilers, B., Wolter, V. and Kolbe, M. (2010)CombinationoftwoseparatebindingdomainsdefinesstoichiometrybetweentypeIIIsecretionsystemchaperoneIpgCandtranslocatorproteinIpaB.J.Biol.Chem.285,39965–39975.
177 Quinaud, M., Chabert, J., Faudry, E., Neumann, E., Lemaire, D., Pastor, A.,Elsen,S.,Dessen,A.andAttree,I.(2005)ThePscE-PscF-PscGcomplexcontrolstypeIIIsecretionneedlebiogenesisinPseudomonasaeruginosa.J.Biol.Chem.280,36293–36300.
178 Miroux,B.andWalker,J.E.(1996)Over-productionofproteinsinEscherichiacoli: mutant hosts that allow synthesis of some membrane proteins andglobularproteinsathighlevels.J.Mol.Biol.260,289–298.
179 Dumon-Seignovert, L., Cariot, G. and Vuillard, L. (2004) The toxicity ofrecombinant proteins in Escherichia coli: a comparison of overexpression inBL21(DE3),C41(DE3),andC43(DE3).ProteinExpr.Purif.37,203–206.
180 Studier, F. W. (2005) Protein production by auto-induction in high densityshakingcultures.ProteinExpr.Purif.41,207–234.
181 Sambrook,J.andRussell,D.W.(1989)SDS-polyacrylamidegelelectrophoresisofproteins.Molecularcloning:alaboratorymanual,Thirdedition.ColdSpringHarborLaboratoryPress.
182 Laemmli,U.K. (1970)Cleavageof structuralproteinsduring theassemblyoftheheadofbacteriophageT4.Nature.227,680-685.
183 Gill, S. C. and Hippel, von, P. H. (1989) Calculation of protein extinctioncoefficientsfromaminoacidsequencedata.Anal.Biochem.182,319–326.
184 Scott,D.J.,Harding,S.E.andRowe,A.J.(2005)AnalyticalUltracentrifugation,RoyalSocietyofChemistry.
185 Dynamic Light Scattering: an Important Tool for Protein Crystallography andNanotechnology, Viscotek Europe Ltd. Available from:<http://www.chemeurope.com>.[3September2015].

146
146
186 Dynamic light scattering (DLS) for particle size characterization of proteins,Malvern Instruments Ltd. Available from: <http://www.malvern.com>. [4September2015].
187 ISA - ASTRID2 and the Rosetta Mission, Aarhus University. Available from:<http://www.isa.au.dk>.[5September2015].
188 Gore, M. G. (2000) Spectrophotometry and Spectrofluorimetry, OxfordUniversityPress.
189 Greenfield, N. J. (2006) Using circular dichroism spectra to estimate proteinsecondarystructure.NatProtoc1,2876–2890.
190 Principles of fluorescence, Edinburgh Super-resolution Imaging Consortium.Availablefrom:<http://www.esric.org/education/fluorescence>.[5September2015].
191 Creighton,T.E.(1997)ProteinFunction:APracticalApproach,Secondedition.OxfordUniversityPress.
192 Fluorescence Spectroscopy, University of Warwick Business Facilities -Analytical Equipment. Available from:<http://www2.warwick.ac.uk/services/ris/business/analyticalguide/fluorescence>.[5September2015].
193 Privalov, P. L., Gill, S. J. (1988) Stability of Protein Structure. Adv. ProteinChem.39,191-234.
194 Wilkins,M.R.,Gasteiger,E.,Bairoch,A.,Sanchez,J.C.,Williams,K.L.,Appel,R.D.andHochstrasser,D.F.(1999)ProteinidentificationandanalysistoolsintheExPASyserver.MethodsMol.Biol.112,531–552.
195 Walters,J.,Milam,S.L.andClark,A.C.(2009)Practicalapproachestoproteinfolding and assembly: spectroscopic strategies in thermodynamics andkinetics.Meth.Enzymol.455,1–39.
196 Pace, C. N. (1986) Determination and analysis of urea and guanidinehydrochloridedenaturationcurves.Meth.Enzymol.131,266–280.
197 Tanford, C. (1970) Protein denaturation. C. Theoretical models for themechanismofdenaturation.Adv.ProteinChem.24,1–95.
198 Truhlar, S. M. E., Torpey, J. W. and Komives, E. A. (2006) Regions ofIkappaBalpha thatare critical for its inhibitionofNF-kappaB.DNA interactionfold upon binding to NF-kappaB. Proc. Natl. Acad. Sci. U.S.A. 103, 18951–18956.
199 O'Dea,E.L.,Barken,D.,Peralta,R.Q.,Tran,K.T.,Werner,S.L.,Kearns,J.D.,Levchenko, A. and Hoffmann, A. (2007) A homeostatic model of IkappaBmetabolismtocontrolconstitutiveNF-kappaBactivity.Mol.Syst.Biol.3,111.
200 Deu,E.andKirsch,J.F.(2007)TheunfoldingpathwayforApoEscherichiacoliaspartate aminotransferase is dependent on the choice of denaturant.Biochemistry46,5810–5818.
201 Doyle,S.M.,Braswell,E.H.andTeschke,C.M.(2000)SecAfoldsviaadimericintermediate.Biochemistry39,11667–11676.
202 Main,E.R.G.,Lowe,A.R.,Mochrie,S.G.J.,Jackson,S.E.andRegan,L.(2005)A recurring theme inproteinengineering: thedesign, stabilityand foldingofrepeatproteins.Curr.Opin.Struct.Biol.15,464–471.
203 Main, E. R.G., Jackson, S. E. andRegan, L. (2003) The folding anddesignofrepeatproteins:reachingaconsensus.Curr.Opin.Struct.Biol.13,482–489.

147
147
204 Phillips,J.J.,Javadi,Y.,Millership,C.andMain,E.R.G.(2012)ModulationofthemultistatefoldingofdesignedTPRproteinsthroughintrinsicandextrinsicfactors.ProteinSci.21,327–338.
205 Javadi,Y.andMain,E.R.G.(2009)Exploringthefoldingenergylandscapeofaseries of designed consensus tetratricopeptide repeat proteins. Proc. Natl.Acad.Sci.U.S.A.106,17383–17388.
206 Main,E.R.G.,Stott,K.,Jackson,S.E.andRegan,L.(2005)Localandlong-rangestability in tandemly arrayed tetratricopeptide repeats. Proc.Natl. Acad. Sci.U.S.A.102,5721–5726.
207 Cohn,S.K.(2008)4EpidemiologyoftheBlackDeathandSuccessiveWavesofPlague.MedicalHistory,CambridgeUniversityPress52,74–100.
208 Matsumoto, H. and Young, G. M. (2009) Translocated effectors of Yersinia.Curr.Opin.Microbiol.12,94–100.
209 Gong, H., Vu, G.-P., Bai, Y., Yang, E., Liu, F. and Lu, S. (2010) DifferentialexpressionofSalmonellatypeIIIsecretionsystemfactorsInvJ,PrgJ,SipC,SipD,SopAandSopBinculturesandinmice.Microbiology(Reading,England)156,116–127.
210 Smith,R.D. andCoast, J. (2002)Antimicrobial resistance: a global response.Bull.WorldHealthOrganization.80,126–133.
211 Anthony King & ChemistryWorld, Antibiotic resistance will kill 300 millionpeopleby2050.Availablefrom:<www.scientificamerican.com>.[2September2015].
212 Cliff, M. J., Williams, M. A., Brooke-Smith, J., Barford, D. and Ladbury, J. E.(2005)MolecularrecognitionviacoupledfoldingandbindinginaTPRdomain.J.Mol.Biol.346,717–732.
213 Lamboy, J. A., Kim, H., Lee, K. S. and Ha, T. (2011) Visualization of thenanospringdynamicsoftheIκBαankyrinrepeatdomaininrealtime.
Recommended