Nutrition Programs for Growing Nutrition Programs for Growing HeifersHeifers
José Eduardo P. Santos
VMTRC

Goals of a Nutrition Program for Growing Heifers
1. Achieve puberty and sexual maturity early
2. Achieve adequate body weight, height, and frame size at calving
3. Decrease age at first calving with adequate body size, without compromising mammary development and lactation performance
4. Economically sound

Feeding Program for Growing Heifers
Divided into:
Preweaning feeding program
Prepubertal feeding program
Postpubertal feeding program
The Dairy Production CycleThe Dairy Production Cycle
Maternity PenCalfCalf
Hutch/Calf penHutch/Calf pen
Group PensGroup Pens
WeaningWeaning
Breeding Age HeiferBreeding Age Heifer
Bred heiferBred heifer
Springing Heifer
FreshHigh Group
Medium Group
Low Group
Far-off dry cows
Close-up dry cows

Target Growth for Holstein Heifers
Prepubertal period: 3 to 9 months BW gain: 1.6 to 1.8 lbs/d Wither height: 1.4”/month
Breeding period: 13 months BW: 780 lbs 49 to 50” wither height BCS: 3.0 - 3.5

Postpubertal Period
10 months to calving BW gain: 1.8 to 2.0 lbs/d Wither height: 0.5 to 0.6”/month
Prepartum (22 - 24 months): BW: 1350 to 1400 lbs pre-calving or 1200 lbs
after calving Height: 54-56” at the withers BCS < 4.0 at calving (3.25 - 3.75)

Heifer Weight in Herds with Different Production Levels (Heinrichs and Losinger, 1998)
100200300400500600700800900
10001100
BW
, lb
3 6 12 18
Age, mo
< 16,000 16 to 20,000 > 20,000

Lactation Performance
Intrinsic factors that affect milk production during first lactation: Number of milk secreting mammary cells (Tucker,
1981)
GeneticsMammary development during the allometric
phase (Sejrsen and Purup, 1997)
Ability of the animal to compete for feed and to deliver nutrients to the mammary glandBody size

Mammary Gland Development
Four Phases: Fetal life:
Basic structure: stroma, circulatory system, and few ducts Isometric: first 60 to 90 days of life
Gland grows at the same rate of the body: stroma and blood vessels
Allometric: 3 to 9 months (puberty) Gland grows at a faster rate than the rest of the body: fat
pad and ducts (Sinha and Tucker, 1969) Determines the number of milk-secreting cells that will be
present during lactation Isometric: After puberty
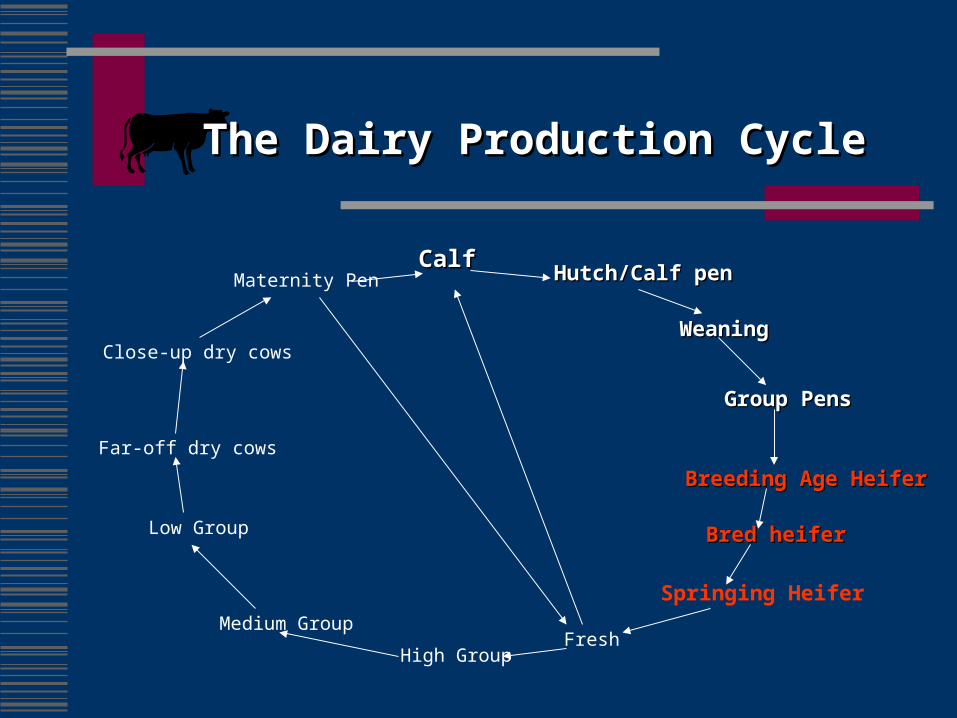
Two Schools
European (Danish): Kris Sejrsen and colleagues Accelerated growth rates during the allometric phase is
detrimental to mammary development and milk yield potential
American: M. VanAmburgh, M. VandeHaar and others
Negative effects of accelerated growth rates during the prepubertal period can be overcome by diet formulation
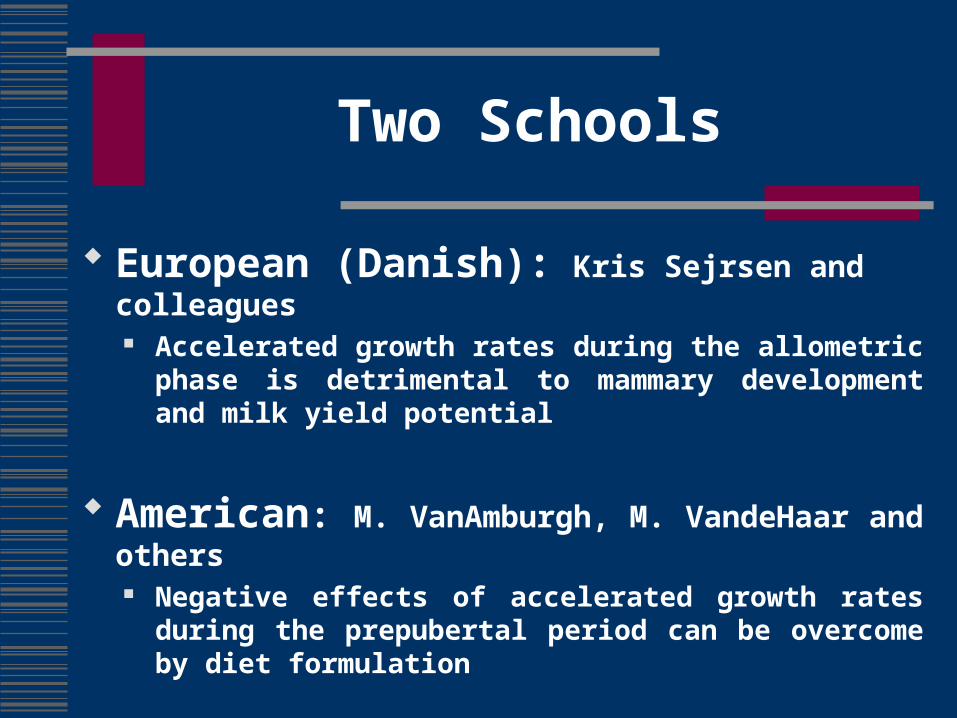
Danish Data
Growth rates above 1.6 lbs/d during the prepubertal period:
Reduce parenchymal DNA in the mammary gland
Decrease milk production during first lactation (10 to 20% lower)
Mechanism: not clear, but seems to be associated with reduced sensitivity of mammary cells to IGF-I
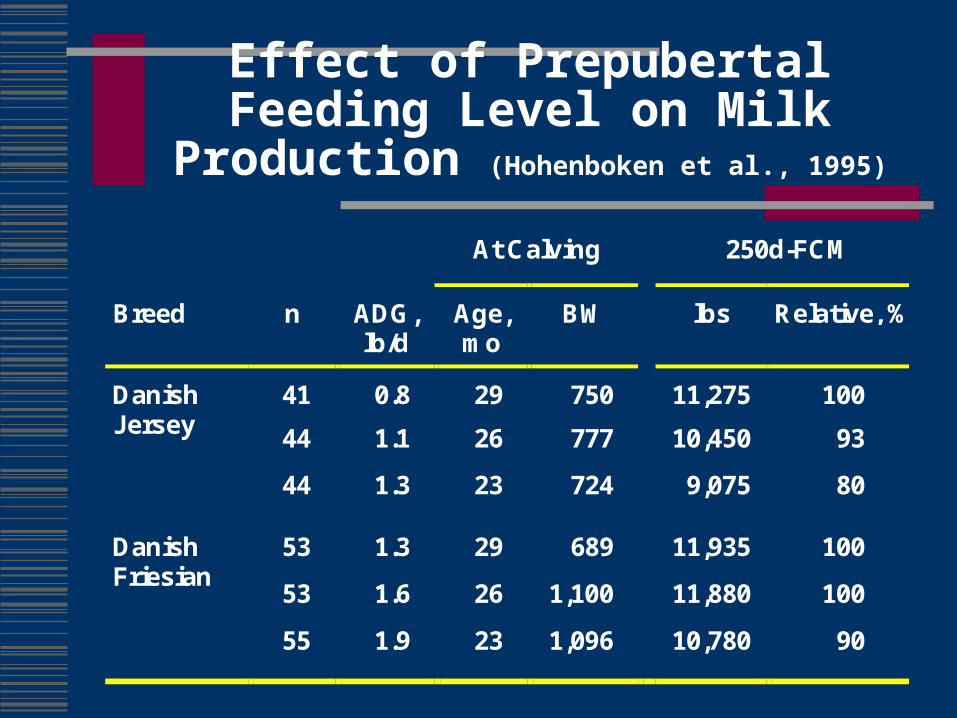
Effect of Prepubertal Feeding Level on Milk Production (Hohenboken et al., 1995)
At Calving 250d-FCM
Breed n ADG,lb/d
Age,mo
BW lbs Relative, %
41 0.8 29 750 11,275 100DanishJersey 44 1.1 26 777 10,450 93
44 1.3 23 724 9,075 80
53 1.3 29 689 11,935 100DanishFriesian
53 1.6 26 1,100 11,880 100
55 1.9 23 1,096 10,780 90
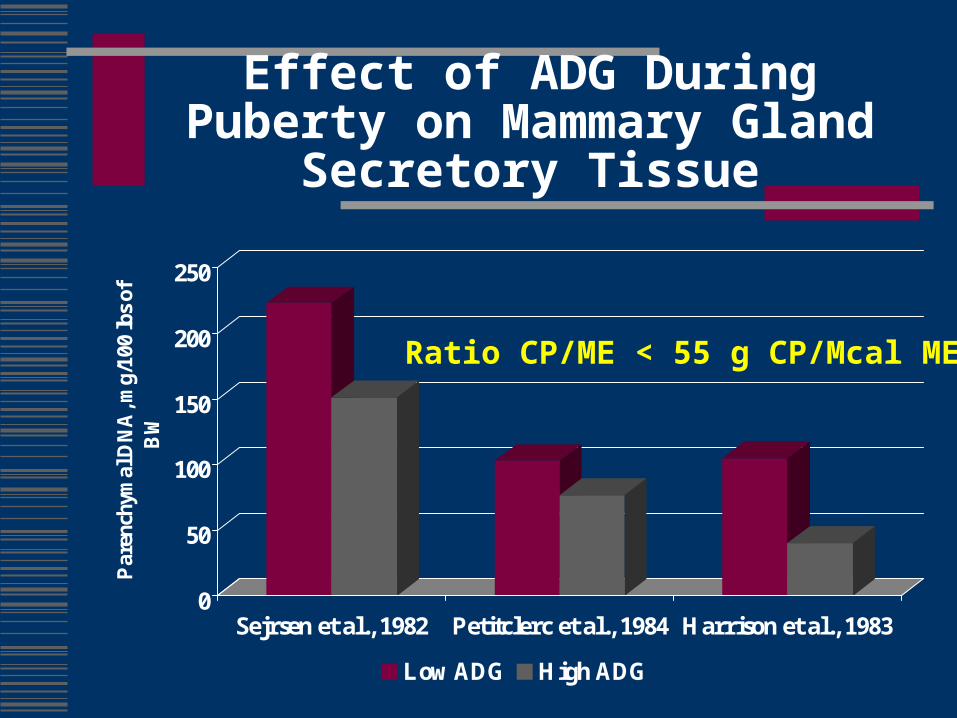
Effect of ADG During Puberty on Mammary Gland Secretory Tissue
0
50
100
150
200
250
Par
ench
ymal
DN
A, m
g/10
0 lb
s of
B
W
Sejrsen et al., 1982 Petitclerc et al., 1984 Harrison et al., 1983
Low ADG High ADG
Ratio CP/ME < 55 g CP/Mcal ME

Effect of ADG During Puberty on Mammary Gland Secretory Tissue
100
125
150
175
200
225
250
275
300
Par
ench
ymal
DN
A, m
g/10
0 lb
s of
B
W
Capuco et al., 1995 Radcliff et al., 1997
Low ADG with Alfalfa High ADG with Alfalfa Low ADG with CS High ADG with CS
Ratio CP/ME
55
83
89 68

Effect of Prepubertal ADG on Performance During First Lactation (Van Amburgh et al., 1998)
60616263646566676869707172
Milk 3.5% FCM
1.5 lb/d 1.83 lb/d 2.1 lb/d
a
abb
aab
b
a,b P < 0.05
CP:ME = 62.3, 66.7, 63.5 g/Mcal

Recommendations
Formulate diets to achieve and ADG of 1.7 to 1.8 lbs/d
Adjust CP content of the diet Ratio CP to ME: 64 g/Mcal Hoffman (1998) suggested that protein quality
may be an issue. However, response to RUP sources is not consistent in growing heifers Maximize microbial protein

Data from Cornell University (Elrod and Butler, 1993)
Excess degradable protein in diets of breeding heifers might decrease conception ratesCP : 21%RDP = 82.5% of CP
CR dropped from 82 to 60%

Effect of Ionophores on Rumen Bacteria (Gram +)
Extracellular Intracellular ATP H+ H+
ADP
H+ H+
K+ K+
Na+ Na+
H+ H+
M
M

Rumen Fermentation
CHOProtein
MicrobialProtein + NH3
Glucose
Pyruvate
Propionate
Acetate + Butyrate
CO2 + CH4 +
H2

Use of Ionophores in Diets for Growing Heifers
Control coccidiosis
Ionophore-resistant bacteria (Gram - ) produce more propionate and less acetate Increase efficiency of energy utilization
Reduce DMI
May or may not increase ADG
Increase feed efficiency
May reduce age at puberty

Influence of Ionophores on Performance of Growing Cattle (167 trials with 11,414 animals)
-8
-6
-4
-2
0
2
4
6
DMI ADG F/G
Cha
nge,
%
Monensin Lasalocid Lanna (1997)

Guidelines for Feeding Growing Heifers
Adjust energy content of diets to promote an ADG of 1.7 to 1.8 lbs/d
ME content of the diet 1.0 to 1.2 Mcal/lb of DM
NEg: 0.40 to 0.45 Mcal/lb of DM
Energy requirements for breeding heifers: Maintenance: 780 lbs = 14 Mcal/d
1 lb of gain is equivalent to 4.3 Mcal of ME

Guidelines for Feeding Growing Heifers
Limit CP to no more than 16 or 17% for heifers with BW greater than 300 lbs
Maintain a CP:MP ratio of 64 g of CP for every Mcal of ME
Add Ionophores to the diet: Monensin: 200 to 300 mg/hd/d or 20 to 30 ppm
Lasalocid: 200 to 300 mg/hd/d or 20 to 30 ppm
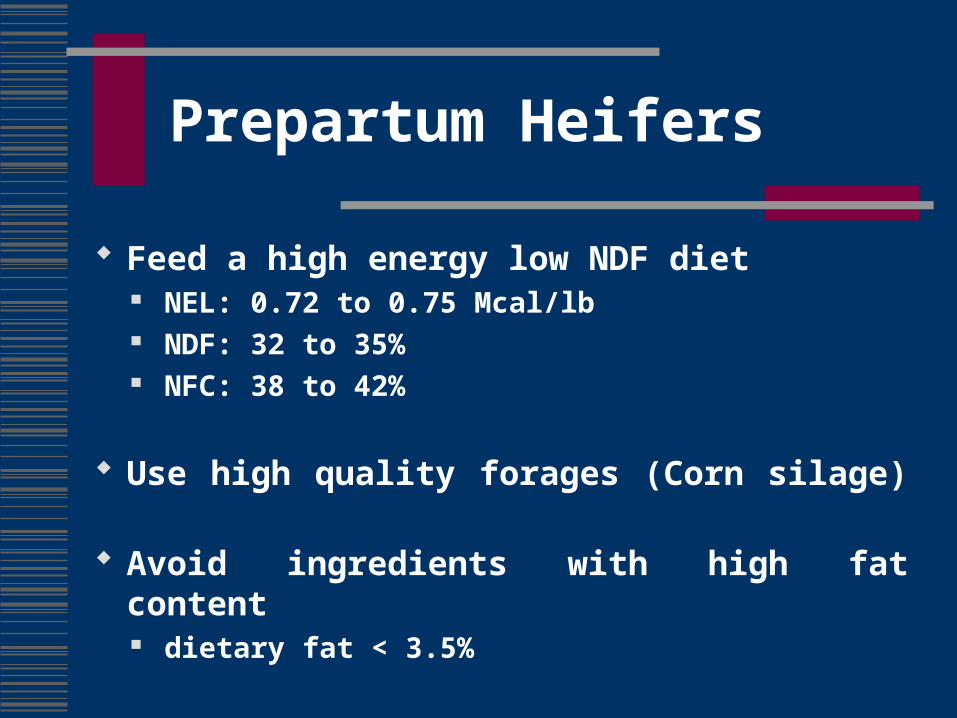
Prepartum Heifers
Feed a high energy low NDF diet NEL: 0.72 to 0.75 Mcal/lb NDF: 32 to 35% NFC: 38 to 42%
Use high quality forages (Corn silage)
Avoid ingredients with high fat content dietary fat < 3.5%

Prepartum Heifers
Keep CP at 14 to 15% during the last 3 to 4 weeks prepartum
Close-up heifer group should be consuming 22 to 25 lb of DM/hd/d (1.6`- 1.7% of BW)
Feed a low Na and K diet to minimize udder edema

Cost of Feeding Replacements
California (1999 - 2000) 4 to 12 months:
$ 100.00 to 120.00/ton DM
13 to 23 months:$ 80.00 to $ 95.00/ton DM
Recommended