Page 1
St. Andrew’s High School
Numeracy Across The
Curriculum
A staff guide to how the Maths department teach certain topics in Numeracy.

Page 2
Contents Page
Page
1. Basic Calculations Mental Agility Addition Subtraction Multiplication Division Order of Operations
1
2. Fractions
Fraction of a Quantity 8
3. Percentages Percentage of a Quantity
10
4. Information Handling
Bar Graphs Line Graphs Pictographs Pie Charts Averages
13
5. Solving Equations
Simple unknowns More complicated equations
21
6. Changing the Subject of a Formula
23
7. Ratio and Proportion Writing Ratio Using Ratio Direct Proportion Indirect Proportion
24
8. Unit Conversion
26
9. Estimating Measurement
28
10. Coordinates
29
11. Integers 29

Page 1
1. Basic Calculations Vocabulary:
Addition (+) Subtraction (-) Multiplication (×) Division (÷) Equals (=) Sum of Less than Multiply Divide Is equal to More than Take away Times Share Same as Add Minus Product Split Makes Total Subtract Lots of Groups of Will be And Difference Sets of Plus Between
Mental Agility Mental Agility is when pupils are required to work out the answer in their head without doing any written working. This is practiced regularly within the BGE often as starter questions and pupils undertake a Mental Agility assessment once per term. Pupils are encouraged to use various strategies for this type of questions, for example: Partitioning 25 + 47 = 25 + 40 = 65 + 7 = 72 Tens or ones first 276 – 153 = 276 – 100 = 176 – 50 = 126 – 3 = 123 Re-ordering 43 + 18 + 17 = 43 + 17 + 18 = 60 + 18 = 78 Compensation 37 + 19 = 37 + 20 – 1 = 56 184 – 28 = 184 – 30 + 2 = 156 Number Line 826 – 354 = Good strategy for visual learners

Page 2
Addition For written ADDITION calculations carried out without a calculator, the method below is used throughout the maths department.
Example 1 Add 487 + 729
4 8 7 + 7 2 9 1 2 1 6
Instead of showing a sum like the one above, pupils can work out 487 + 700 + 20 + 9 by showing jottings (rough steps). We would not expect this calculation to be worked out mentally.
Example 2 Add 56·82 + 39·6
5 6 · 8 2 + 3 9 · 6 0 9 6 · 4 2
Other methods are possible and pupils are encouraged to use the method which they feel most confident with.
The calculation begins with the UNITS column on the far right, and any tens are carried to the next column. This process is repeated for the hundreds column (and any other columns) until the calculation has been completed.
1 1
The calculation begins with the HUNDREDTHS column on the far right, and any tenths are carried to the next column. This process is
repeated for the tenths, units and tens (and any other columns) until the calculation has
been completed. Pupils would be encouraged to keep the decimal point in a separate column to ensure the digits were in the correct place.
Depending on the ability of the class, some pupils may be encouraged to add the zero
after the 6 to help with this as well.
1 1

Page 3
Subtraction For written SUBTRACTION calculations carried out without a calculator, the method below – called DECOMPOSITION – is used throughout the maths department.
Example 1 Subtract 257 from 821
8 2 1 – 2 5 7 5 6 4
Example 2 Subtract 23·7 from 76·19
7 6 · 1 9 – 2 3 · 7 0 5 2 · 4 9
When Is This Taught? All pupils are given regular opportunities to practise this basic skill at all levels of study. Naturally, there is considerable prior knowledge of this when pupils begin S1. As with addition, some pupils – usually but not always those of lower ability – refer to these types of calculations as “chimney sums”.
Starting from the right hand column, the pupil carries out
the calculation “top minus bottom”. If the calculation would not result in a digit which is positive, then the
calculation “cannot be done” without borrowing a TEN
from the next column. This process is repeated until all
the possible calculations have been carried out. This process
is also true for decimal calculations. Pupils would be
encouraged to keep the decimal point in a separate column to ensure the digits were in the correct place.
Depending on the ability of the class, some pupils may be encouraged to add a zero at
the end of the second number to help with this.
1
5 1
1 7 1

Page 4
× 9
× 30
add answers
Multiplication Times tables - Pupils are required to learn these, and practise regularly, for all mathematics courses. For written MULTIPLICATION calculations carried out without a calculator, the methods below are used throughout the maths department to help pupils develop a variety of approaches to non-calculator multiplication. Example 1 39 × 6 Method 1
Example 2 Long multiplication is a more complex skill. It has been taught at Primary school and is reinforced during Secondary stages.
Multiplying by multiples of 10 and 100.
Pupils are taught that to multiply by 10 every digit is moved one place to the left so the point moves one place to the right. To multiply by 100 every digit is moved two places to the left so the point moves two places to the right. It can be easier for pupils to remember that the point moves however to know that it is mathematically correct to move the digits.
Method 2 30 × 6 = 180 9 × 6 = 54 Therefore 39 × 6 = 234 (180 + 54)
Method 3 (mental strategy) 40 × 6 = 240 40 is 1 too many so take 6×1 away Therefore 39 × 6 = 234 (240 - 6)
3 9 × 6
2 3 4
6 1
× 3 9
5 4 9
+ 1 8 3 0
2 3 7 9
5

Page 5
Example 1
a) Multiply 354 by 10
Th H T U 3 5 4 3 5 4 0
b) Multiply 50·6 by 100
Th H T U · t
5 0 · 6
5 0 6 0 · 0
5 0 · 6 × 1 0 0 = 5 0 · 6 0 = 5060 Example 2 Pupils will also be familiar with this method:
a) 2·36 × 20
2·36 × 2 = 4·72
4·72 × 10 = 47·2
So, 2·36 × 20 = 47·2
b) 38·4 × 50
38·4 × 5 = 192
192 × 10 = 1920
So, 38·4 × 50 = 1920
All digits are moved 2 places to the left hence the point moves 2 places to the right.
Every digit moves up one place and a zero is added if necessary.
Page 6
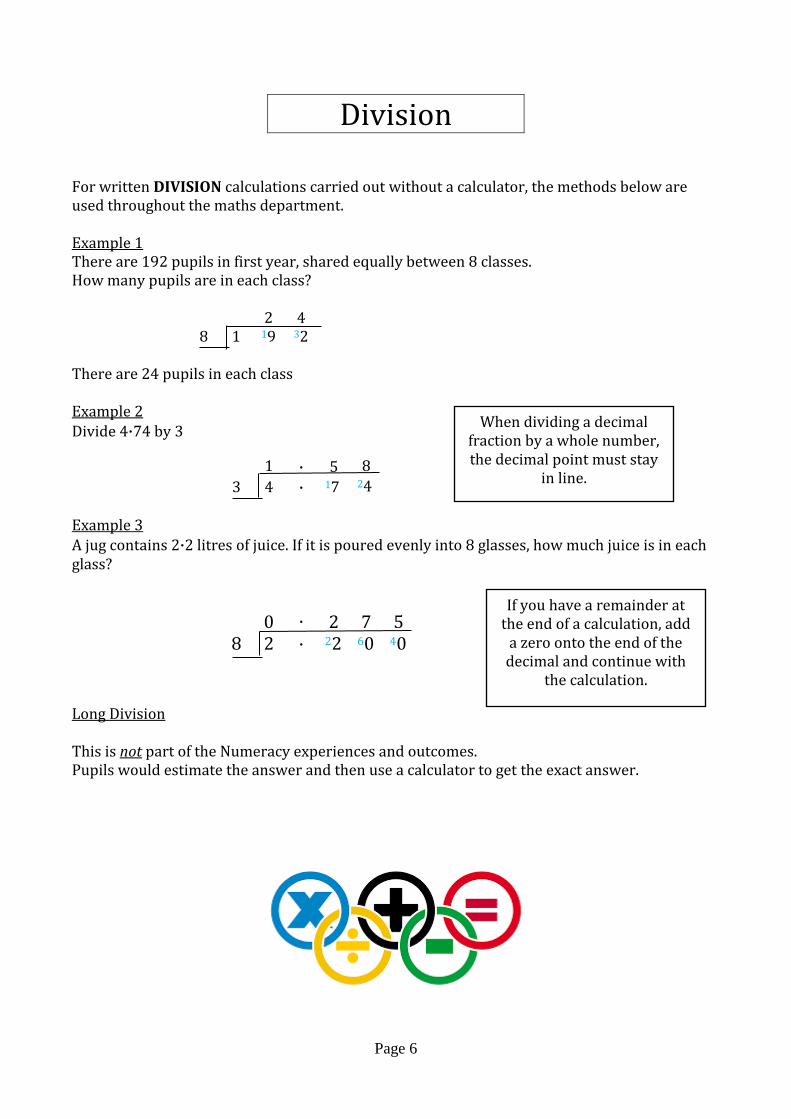
Division For written DIVISION calculations carried out without a calculator, the methods below are used throughout the maths department. Example 1 There are 192 pupils in first year, shared equally between 8 classes. How many pupils are in each class?
2 4 8 1 19 32
There are 24 pupils in each class Example 2 Divide 4·74 by 3 Example 3 A jug contains 2·2 litres of juice. If it is poured evenly into 8 glasses, how much juice is in each glass?
Long Division This is not part of the Numeracy experiences and outcomes. Pupils would estimate the answer and then use a calculator to get the exact answer.
1 · 5 8
3 4 · 17 24
0 · 2 7 5 8 2 · 22 60 40
When dividing a decimal fraction by a whole number, the decimal point must stay
in line.
If you have a remainder at the end of a calculation, add
a zero onto the end of the decimal and continue with
the calculation.
Page 7
Order of Operations Pupils will be shown the order in which a series of calculations should be worked out. We use BIDMAS as a memory aid:
Brackets
Indices *note Indices are powers eg. 52(= 5 × 5) = 25
Divide
Multiply
Add
Subtract
Examples
1) 10 + 2 × 7 not 12 × 7 = 10 + 14 = 24
2) 12 – 10 ÷ 2 not 2 ÷ 2 = 12 – 5 = 7
3) (5 + 4) × 3 = 9 × 3 = 27
4) 20 – (1 + 3)2
= 20 – 42 = 20 – 16 = 4
NOTE:
Any calculations within brackets must be done first Any indices are done after brackets Multiplication and division have equal priority Addition and subtraction have equal priority
When Is This Taught? “Order of Operations” is introduced in Primary School then taught within S1 course and reinforced throughout stages. The understanding of BIDMAS is vital for study on algebra.
Page 8
2. Fractions
Calculating a Fraction of a Quantity
METHOD 1 – all pupils are shown this method
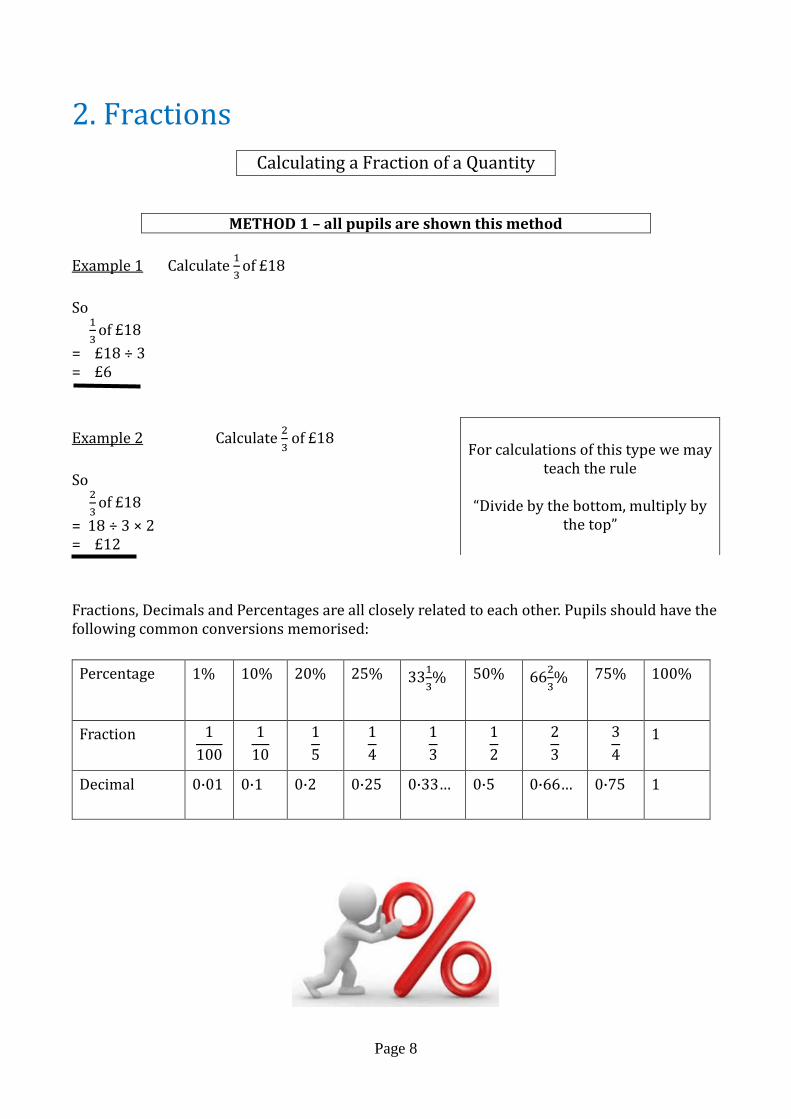
Example 1 Calculate 1
3 of £18
So
1
3 of £18
= £18 ÷ 3 = £6
Example 2 Calculate
2
3 of £18
So
2
3 of £18
= 18 ÷ 3 × 2 = £12
Fractions, Decimals and Percentages are all closely related to each other. Pupils should have the following common conversions memorised:
Percentage 1% 10% 20% 25% 331
3% 50% 66
2
3% 75% 100%
Fraction 1
100
1
10
1
5
1
4
1
3
1
2
2
3
3
4
1
Decimal 0·01 0·1 0·2 0·25 0·33… 0·5 0·66… 0·75 1
For calculations of this type we may
teach the rule
“Divide by the bottom, multiply by the top”

Page 9
1
1
Adding/Subtracting Fractions
Pupils must ensure that fractions have the same denominator. Once this has been done, pupils add the numerators and the denominator stays the same.
Example 1
Example 2
2
7+
3
7
=5
7
1
3+
1
4
=4
12+
3
12
=7
12
Multiplying Fractions
Multiply the top two numbers and the bottom two numbers to make a new fraction.
3
2×
2
5
=6
10
=3
5
OR you can cross cancel before you multiply
3
2×
2
5
=3
1 ×
1
5
=3
5
Always leave the fraction in its
simplest form
×3 ×4
÷2

Page 10
÷2
Dividing Fractions
2
3÷
4
5
=2
3×
5
4
=10
12
=5
6
NOTE: only more able pupils will encounter division of fractions
3. Percentages
Calculating the Percentage of a Quantity using a Calculator
METHOD 1 – all pupils are shown this method Example 1 Calculate 18% of £860 So 18% of £860 = (18 100) × 860 = £154·80
Example 2 Calculate 3·2% of £1850 So 3·2% of £1850
= (3·2 100) × 1850
= £59·20
When dividing fractions, we turn the
second fraction upside down and multiply
For calculations of this type we
may teach the rule
“Percentage divided by 100, then multiply by the amount”
Using the same rule as above still
makes it relatively straightforward to deal with the decimal percentage.

Page 11
METHOD 2 – pupils would be made aware of these methods
Example 1 Calculate 22% of £550
So 22% of £550 = 0·22 x 550 = £121
Example 2 Calculate 1·7% of £300 So
1·7% of £300 = 0·017 x 300 = £5·10 When Is This Taught?
S1-3 All pupils are expected to be able to carry out simple percentages
and, where appropriate, pupils are extended to decimal percentages.
S4-6 Pupils following N4 and N5 are expected to be able to carry out
these calculations. N3 pupils are not required to calculate decimal percentages.
Calculating the “Standard” Percentages
50% is the same as finding a half (1
2) DIVIDE BY 2
25% is the same as finding one quarter (1
4) DIVIDE BY 4
10% is the same as finding one tenth (1
10) DIVIDE BY 10
5% is to find 1
2 of 10% DIVIDE BY 10 THEN DIVIDE BY 2
1% is the same as finding one hundredth (1
100) DIVIDE BY 100
331
3% is the same as finding one third (
1
3) DIVIDE BY 3
For calculations of this type we may
teach the rule
“convert the percentage to its decimal equivalent, then multiply by the
quantity”
Using the same rule as above makes the
calculation more difficult for many pupils, although it is similar to the
previous method.

Page 12
Using the “Standard” Percentages to find other percentages
Example 1 Calculate 30% of £4000
10% of £4000 = £400 30% of £4000 = 400 × 3 = £1200
Example 2 Calculate 75% of £332
There are different possibilities here, but the quickest way is to divide by 4 (to get 25%) then multiply by 3.
25% of £332 = 332 ÷ 4 = £83 75% = 83 × 3= £249 Example 3 Calculate 6% of £140
The method taught here is to divide by 100(to get 1%) then to multiply by 6. 1% of £140 = £1·40 6% = 1·40 x 6 = £8·40
Types of questions Mental Agility 50% of £80 - Pupils should be able to work out the answer in their head
Non-calculator 20% of £135 – Would expect pupils to show some working for this
Calculator 17% of £294 – Pupils would use a calculator for this
Pupils are taught to divide by 10 (to get
10%) and multiply by 3 (to get 30%)

Page 13
4. Information Handling
Bar Graphs When drawing bar graphs in maths, all pupils are taught to adhere to the following rules: 1. There should be a vertical number scale clearly labelled. 2. The data being surveyed should be clearly labelled along the bottom of the bar graph. 3. The bars should be of uniform thickness, and drawn carefully using a ruler. 4. Where DISCRETE data is involved (i.e. if the survey is asking for a response from a group of choices), the bars should be equally spaced apart and should not be touching each other. 5. The bars should only be touching if the data is CONTINUOUS (e.g. measuring rainfall, heights, weights etc) 6. The completed graph should be given a title.
Example 1 – Bar Graph for Discrete Data A class of 30 pupils were asked to name their favourite chip shop supper. The results are shown below. Draw a neat bar graph to illustrate this information.
Favourite Supper Number Of People
Fish 4 Sausage 7
Pie 2 King Rib 5 Pudding 3
Type of Supper
FISH SAUSAGE
Number of People
PIE KING RIB PUDDING 0
1
2
3
4
5
6
7
8 Favourite Type Of Supper
Bars evenly spaced, same thickness, straight edges
Clear labelling, clear number
scale
Graph Title

Page 14
Example 2 – Bar Graph for Continuous Data The rainfall, in millimetres, was recorded each day in November 2013 for the town of Burntisland. The results are shown in the table below. Draw a bar graph to illustrate this information.
Rainfall(mm) Number Of Days
0-9 1 10-19 9 20-29 8 30-39 5 40-49 7
When Is This Taught?
S1 Bar graphs are taught at Primary School and are revised in S1.
0-9 10-19 20-29 30-39 40-49 0
1
2
3
4
5
6
7
8
Rainfall In Burntisland - Nov 2013
Bars same thickness, straight
edges, touching
Clear labelling, clear number
scale
Graph Title
9
Number of Days
Rainfall (mm)
Page 15
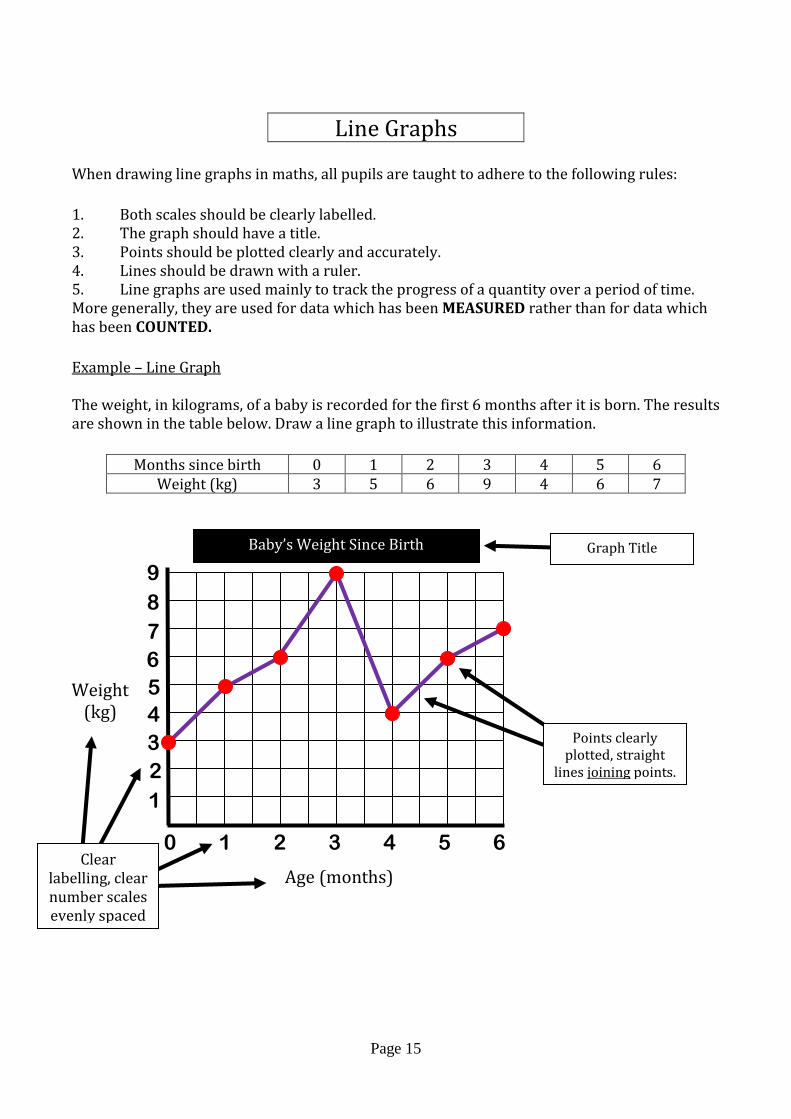
Line Graphs When drawing line graphs in maths, all pupils are taught to adhere to the following rules:
1. Both scales should be clearly labelled. 2. The graph should have a title. 3. Points should be plotted clearly and accurately. 4. Lines should be drawn with a ruler. 5. Line graphs are used mainly to track the progress of a quantity over a period of time. More generally, they are used for data which has been MEASURED rather than for data which has been COUNTED.
Example – Line Graph The weight, in kilograms, of a baby is recorded for the first 6 months after it is born. The results are shown in the table below. Draw a line graph to illustrate this information.
Months since birth 0 1 2 3 4 5 6
Weight (kg) 3 5 6 9 4 6 7
Weight (kg)
6
7
1 2 3 4 5 6 0
Age (months)
Graph Title
Clear labelling, clear number scales evenly spaced
Baby’s Weight Since Birth
Points clearly plotted, straight
lines joining points.
5
4
3
2
1
8
9

Page 16
Scatter Graphs Scatter graphs can also be called scatter diagrams, scatter plots or scatter charts. They are used to show the relationship between two variables in a set of data. This is different from a line graph because time is not usually one of the variables. We still follow the same rules:
1. Both scales should be clearly labelled. 2. The graph should have a title. 3. Points should be plotted clearly and accurately. However, instead of joining the points up, we draw one straight line through the data which we call a line of best fit.
Example – Scatter Graph The height and weight of a football team are recorded below:
Joe Bob Tom Jack Pete Paul James
Height (cm) 168 176 174 184 180 172 182 Weight (kg) 70 85 80 90 88 76 86
Weight (kg)
160 170 180
Height (cm)
Graph Title
Clear labelling, clear number scales evenly spaced
Football Team Height vs. Weight
Points clearly plotted with line of best fit drawn through the
points
70
80
90
Page 17
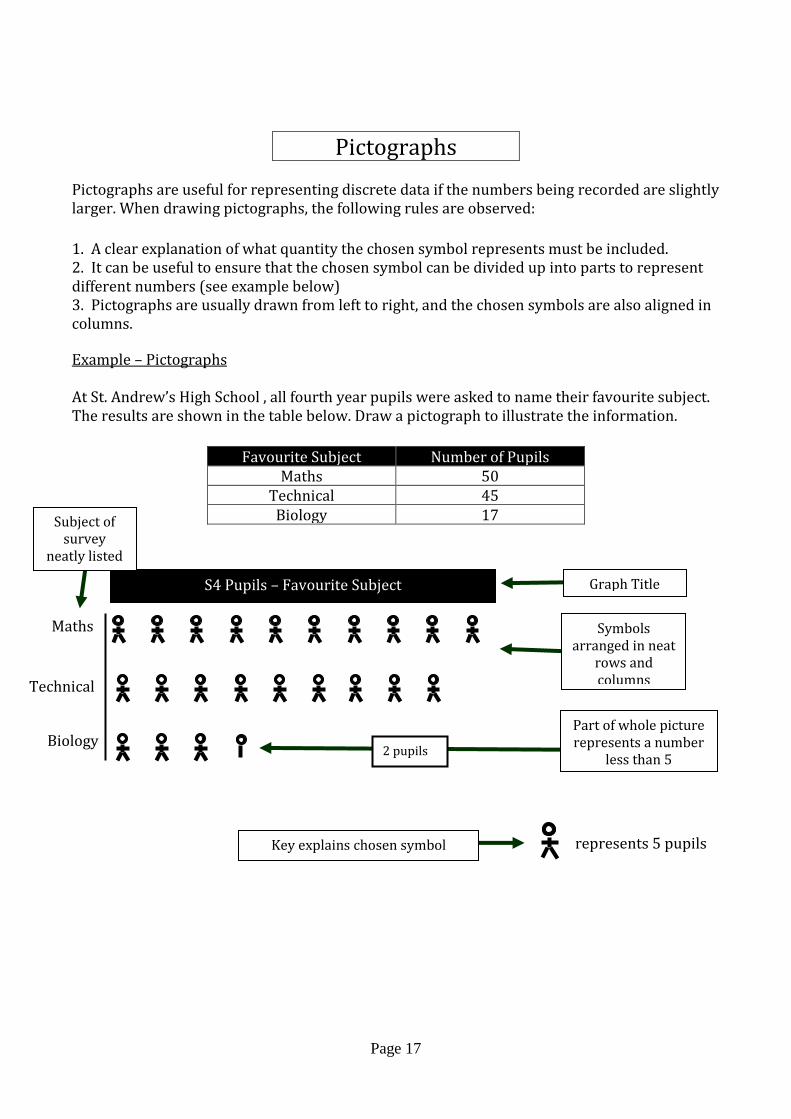
Pictographs Pictographs are useful for representing discrete data if the numbers being recorded are slightly larger. When drawing pictographs, the following rules are observed:
1. A clear explanation of what quantity the chosen symbol represents must be included. 2. It can be useful to ensure that the chosen symbol can be divided up into parts to represent different numbers (see example below) 3. Pictographs are usually drawn from left to right, and the chosen symbols are also aligned in columns.
Example – Pictographs At St. Andrew’s High School , all fourth year pupils were asked to name their favourite subject. The results are shown in the table below. Draw a pictograph to illustrate the information.
Favourite Subject Number of Pupils
Maths 50 Technical 45 Biology 17
Maths
Technical
Biology
represents 5 pupils
S4 Pupils – Favourite Subject
Key explains chosen symbol
Graph Title
Subject of survey
neatly listed
Symbols arranged in neat
rows and columns
Part of whole picture represents a number
less than 5 2 pupils
Page 18
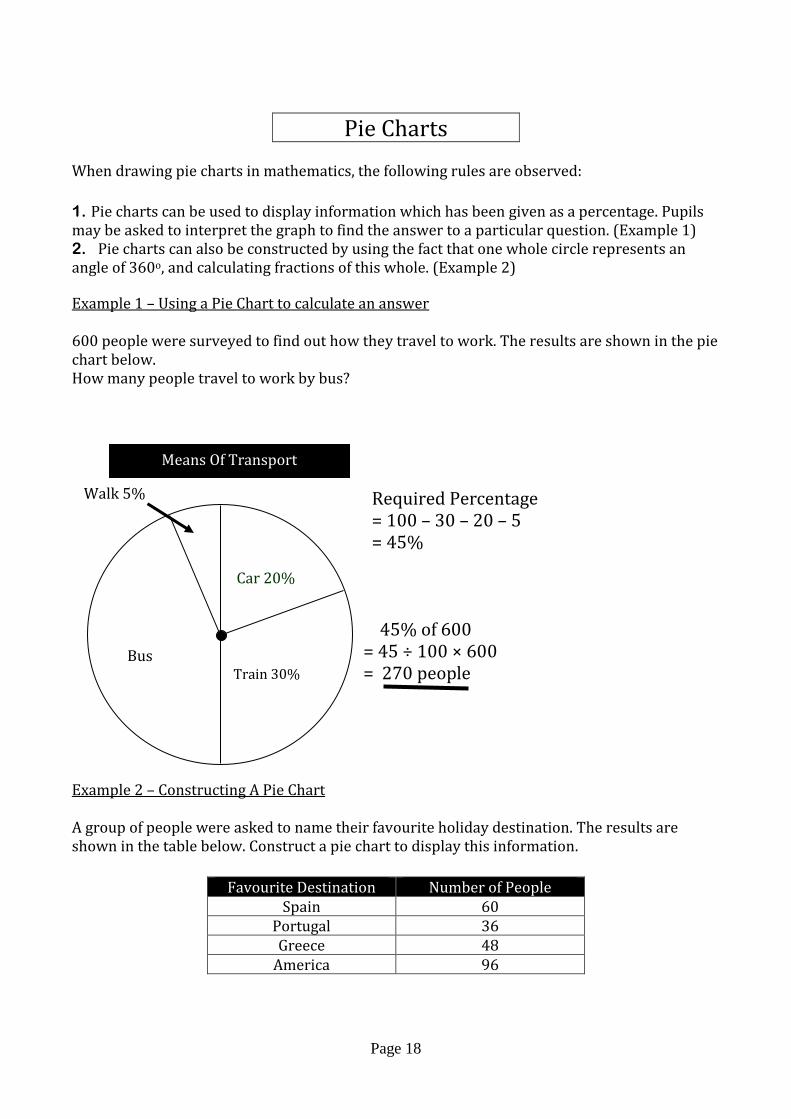
Pie Charts When drawing pie charts in mathematics, the following rules are observed:
1. Pie charts can be used to display information which has been given as a percentage. Pupils may be asked to interpret the graph to find the answer to a particular question. (Example 1) 2. Pie charts can also be constructed by using the fact that one whole circle represents an angle of 360o, and calculating fractions of this whole. (Example 2) Example 1 – Using a Pie Chart to calculate an answer 600 people were surveyed to find out how they travel to work. The results are shown in the pie chart below. How many people travel to work by bus?
45% of 600 = 45 ÷ 100 × 600 = = 270 people Example 2 – Constructing A Pie Chart A group of people were asked to name their favourite holiday destination. The results are shown in the table below. Construct a pie chart to display this information.
Favourite Destination Number of People
Spain 60 Portugal 36 Greece 48
America 96
Bus Train 30%
Car 20%
Walk 5% Required Percentage = 100 – 30 – 20 – 5 = 45%
Means Of Transport

Page 19
Total Number Of People = 60 + 36 + 48 + 96 = 240
Note: Each sector should be labelled with the appropriate category or a key should be shown.
AVERAGES Pupil are taught 3 ways of finding the average value to provide information about a set of data. MEAN - The mean is found by adding all the data together and dividing by the number of
values. MEDIAN - The median is the middle value when all the data is written in numerical order.
(If there are two middles the median is half-way between these values) MODE - The mode is the value that occurs most often.
60 240
× 360o = 90o Angle for Spain =
36 240
× 360o = 54o Angle for Portugal =
48 240
× 360o = 72o Angle for Greece =
96 240
× 360o = 144o Angle for America =
Favourite Holiday Destination
Spain
Portugal
Greece
America

Page 20
Pupils are also taught about measures of spread. For the BGE this consists of: RANGE - The range of a set of data is the highest value subtract the lowest value. Example Class 1K scored the following marks for their homework task Find the mean, median, mode and range for these results.
6, 9, 7, 5, 6, 6, 10, 9, 8, 4, 8, 5, 7
Mean = (6+9+7+5+6+6+10+9+8+4+8+5+7)/13 = 90/13
= 6·923…..
= 6·9 (to 1 decimal place) Median Ordered values: 4, 5, 5, 6, 6, 6, 7, 7, 8, 8, 9, 9, 10 Median = 7 Mode = 6 (most frequent value) Range = 10 – 4 = 6 When Is This Taught? LINE GRAPHS, PICTOGRAPHS, PIE CHARTS AND AVERAGES
Line Graphs S1-3 Pupils use line graphs in S1
S4-6 All levels are taught to draw and interpret line graphs to varying levels of difficulty. National 4 and National 5 Maths and Lifeskills are taught how to estimate from a line of best fit.
Scatter Graphs S1-3 Pupils use Scatter Graphs in S1
S4-6
Scatter Graphs are used mainly by pupils studying National 4 and National 5 Lifeskills.
Pictographs S1-3 Pupils use pictographs in S1.
S4-6
Pictographs are used mainly by National 3 level pupils, and occasionally by National 4 level pupils.
Pie Charts S1-3 Pupils use Pie Charts in S1, mainly with percentage calculations.
S4-6
National 3 pupils are mainly required to interpret very simple pie charts. National 4 and National 5 level pupils would be expected to be able to construct a pie chart as well as interpret it.
AVERAGES
S1-3 Pupils are taught averages as part of the Information Handling
topic in S1.

Page 21
5. Solving Equations
Simple Unknowns on One Side
MAIN METHOD 1 – all pupils are shown this method Example 1 Solve the equation a + 15 = 22
a + 15 = 22 a = 22 – 15 a = 7
Example 2 Solve the equation b – 9 = 14
b – 9 = 14 b = 14 + 9 b = 23
Example 3 Solve the equation 5p = 60
5p = 60 p = 60 5
p = 12
OTHER METHOD 2 – pupils may be made aware of this method to help understanding.
Example 1 Solve the equation a + 15 = 22
a + 15 = 22 –15 –15 a = 7
Example 2 Solve the equation b – 9 = 14
b – 9 = 14 +9 +9 b = 23
The balance method is used to isolate the letter, or unknown. Here, the pupils would be taught to do the same to both sides, that
is to subtract 15.
The balance method is used to isolate the letter, or unknown. Here, the pupils would be taught to do the same to both sides, that
is to add on 9.
Pupils are taught the trick ‘change the side, change the operation’, so here they would move the “add 15” to the other side of the
equation and it would become “subtract 15“ on the other side.
Pupils are taught to move the “subtract 9” to the other side of the equation and it
would become “add 9“ on the other side.
Pupils are taught to move the “multiply by 5” to the other side of the equation
and it would become “divide by 5“ on the other side.

Page 22
Example 3 Solve the equation 5p = 60
5p = 60 5 5 p = 12
When Is This Taught?
S1-3 Pupils are introduced to solving equations in S1. The topic is re-
visited in S3.
S4-6 Solving equations is an essential skill for all but the least able
pupils.
Two Step Equations
MAIN METHOD 1 – all pupils are shown this method Example 1 Solve the equation 3y + 2 = 29
3y + 2 = 29 3y = 29 – 2 3y = 27 y = 27 ÷ 3 y = 9
Example 2 Solve the equation 6t – 1 = 47
6t – 1 = 47 6t = 47 +1
6t = 48
t = 48 6
t = 8
Pupils are taught ‘change side, change operation’ rule here but with two steps. Pupils are taught to move “add
2” to the other side of the equation and it would become “subtract 2”. Similarly, “multiply by 3” would be moved to the other side of the equation to become
“divide by 3”.
Pupils are taught to move “subtract 1” to the other side of the equation and it would become “add 1”. Similarly, “multiply by 6” would be moved to the
other side of the equation to become “divide by 6”.
The balance method is again used to isolate the letter, or unknown. Here, the pupils
would be taught that 5p means “5 times p”, so they would divide both sides by 5.

Page 23
When Is This Taught?
S1-3 The more able pupils would tackle equations of this nature in S1, and only pupils who are recommended for National 3 would not
tackle equations of this sort by the end of BGE.
S4-6
Solving equations is an essential skill for most pupils. Less able pupils are not assessed in this topic, are not likely to study equations of this nature. (Note: there is no algebra in the
Mathematics Lifeskills courses)
6. Changing the Subject of a Formula Pupils should be given the following guidance:
If the desired variable is on the right hand side, reverse the formula Remove fractions by multiplying through on both sides Remove brackets Use normal rules for solving equations Apply one step at a time and show each step clearly If the desired variable lies under a root, reverse the operation
Examples: a) Change the subject of the formula to e
𝑓 = 2𝑒 + 5 2𝑒 + 5 = 𝑓 (reverse)
2𝑒 = 𝑓 − 5
𝑒 = 𝑓−5
2 (2 changes side from × to ÷)
b) Change the subject of the formula to m:
𝑘 = √𝑚𝑛
√𝑚𝑛 = 𝑘 (reverse) 𝑚𝑛 = 𝑘2 (square root changes to square)
𝑚 = 𝑘2
𝑛 (changes side from × to ÷)
When Is This Taught?
S4-6 National 4 and National 5 Mathematics. (Note: Techniques for
inverse operations should be emphasised)

Page 24
7. Ratio & Proportion Ratios are used to compare different quantities. Pupils are taught in maths to write, simplify and use ratios. Writing Ratios Example 1 To make a fruit drink 4 parts water is mixed with 1 part cordial. The ratio of water to cordial is 4 : 1 The ratio of cordial to water is 1 : 4. Simplifying Ratios Example 2 Pupils are shown that ratios can be simplified in much the same way as fractions. 10 : 6 divide both sides by 2 5 : 3 Using Ratio Ratio calculations involve working out a missing value using ratio or sharing an amount in the given ratio. Example 3 The ratio of fruit to nuts in a chocolate bar is 3 : 2. If a bar contains 15g of fruit, what weight of nuts will it contain? Proportional Division If sharing a quantity in a given ratio pupils must:
1) Calculate the ‘number of parts’ 2) Divide the quantity by the number of parts (this gives you the value of 1 part) 3) Multiply each number in the ratio by the value of 1 part
Fruit Nuts 3 2
15 10
The order is important when writing ratios
To simplify a ratio pupils are shown to divide each figure in the ratio by a common factor.
Pupils are encouraged to use a table to help find missing values
using ratios.
×5 ×5

Page 25
Example 4 £35 is split between Jack and Jill in the ratio 3 : 2. How much does Jack receive and how much does Jill receive Number of shares: 3 parts + 2 parts = 5 parts Value of 1 share: £35 ÷ 5 = £7 Jack’s share: 3 x £7 = £21 Jill’s share: 2 x £7 = £14 (check that £21 + £14 = £35) Direct Proportion Pupils will be shown to:
Set working out in a table or with clear headings Divide by the given amount to find the unitary value Multiply to find the required amount Write the final answer under the table
With direct proportion, as one quantity increases so does the other and as one quantity decreases so does the other. Example 5 6 copies of a textbook cost £69. Find the cost of 4 textbooks.
Textbooks Cost 6 £69 1 £11·50 4 £46
The cost of 4 textbooks is £46 Indirect (or Inverse) Proportion Pupils will be shown to:
Set working out in a table or with clear headings Multiply to find out how long/much the unitary value will be Divide to find the required amount Write the final answer under the table
With indirect proportion, as one quantity increases the other decreases.
÷6 ÷6
×4 ×4
Page 26
Example If it takes 5 men 12 hours to paint a fence, how long will it take 6 men?
Men Hours 5 12 1 60 6 10
It takes 6 men 10 hours to paint the fence. When Is This Taught?
S1-3 All pupils will learn about writing and simplifying ratio in S2. The
better pupils will go on and learn to use ratio in calculations.
S4-6 Ratio and proportion are taught within the National 4 Numeracy
unit.
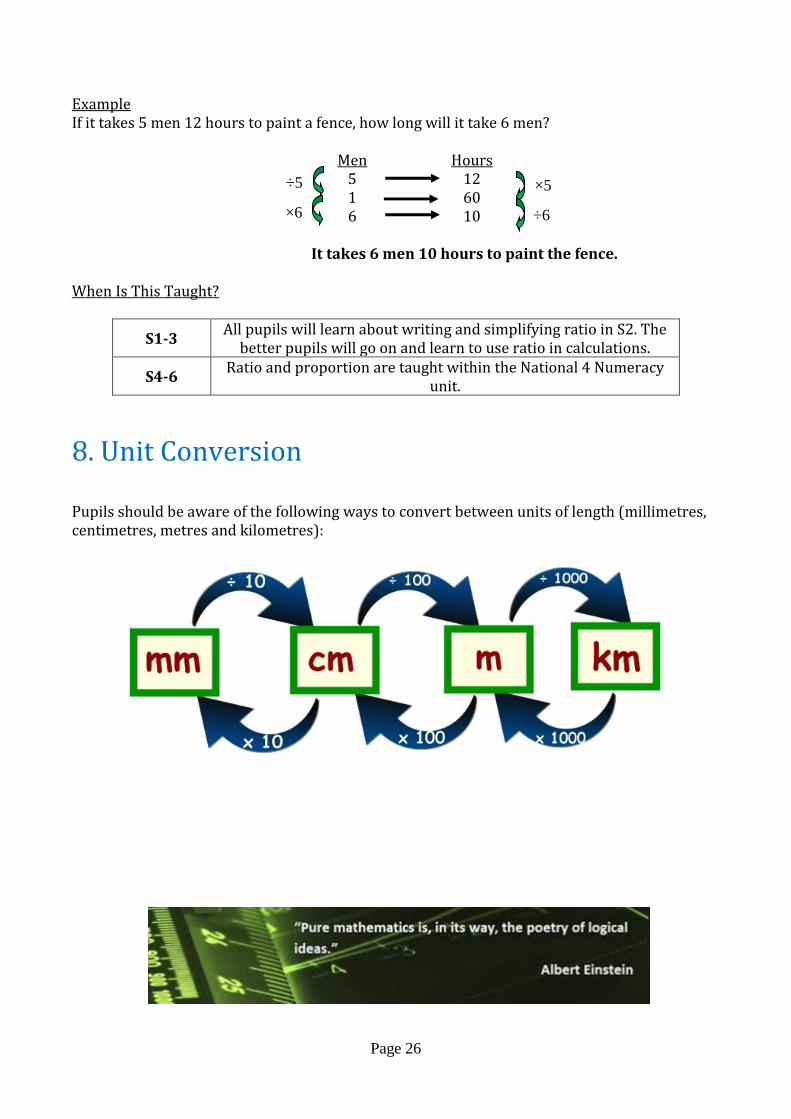
8. Unit Conversion Pupils should be aware of the following ways to convert between units of length (millimetres, centimetres, metres and kilometres):
÷5 ×5
×6 ÷6
Page 27
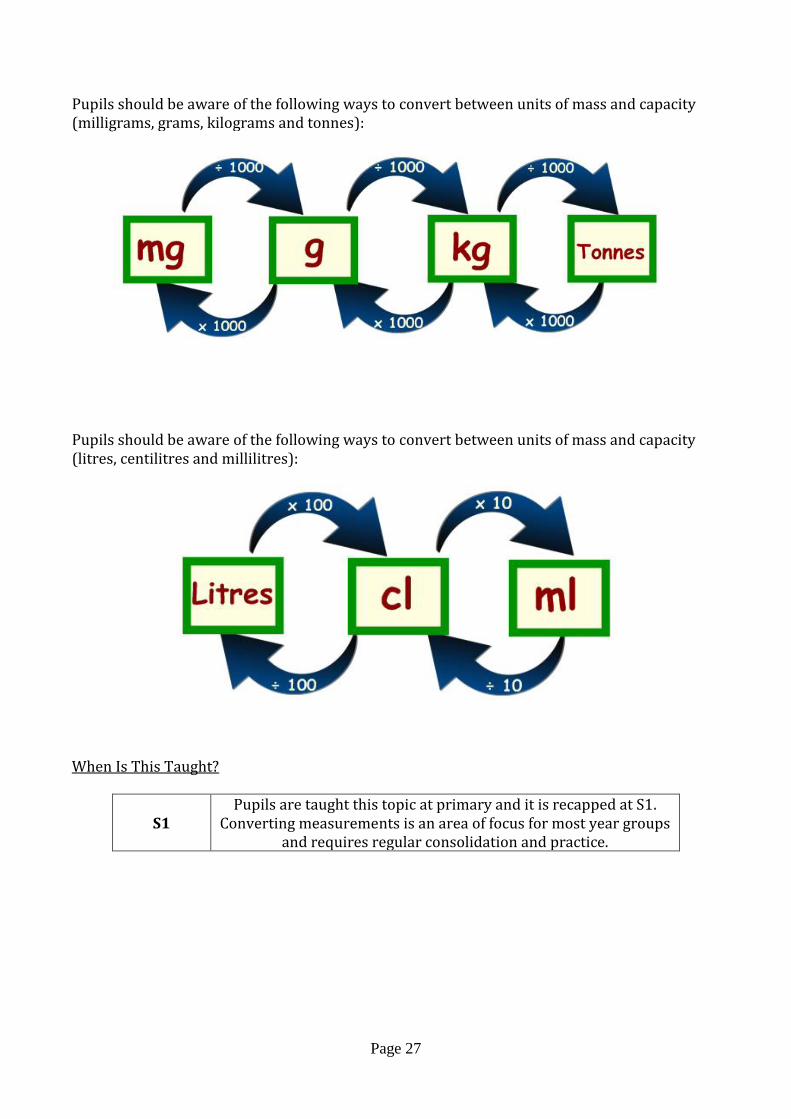
Pupils should be aware of the following ways to convert between units of mass and capacity (milligrams, grams, kilograms and tonnes):
Pupils should be aware of the following ways to convert between units of mass and capacity (litres, centilitres and millilitres):
When Is This Taught?
S1 Pupils are taught this topic at primary and it is recapped at S1.
Converting measurements is an area of focus for most year groups and requires regular consolidation and practice.

Page 28
9. Estimating Measurement Pupils will practice estimation of Length
Height and length in cm and m Length of a ruler = 30 cm Height of a door = 2m
Area/Weight/Volume
Small weights, small areas, small volumes Weight of a bag of sugar = 1 kg Area of an envelope = 10 × 8 = 80 cm2 Volume of lemonade bottle = 1 litre
NOTE: In the outside world, measurements of length tend to be stated in mm e.g. worktop heights for kitchen units. When Is This Taught?
S1 Pupils are taught this topic at primary and it is recapped in S1.

Page 29
10. Coordinates (2, 4)
When Is This Taught?
S1-3 Pupils are taught this topic at primary and it is recapped in S1 and
will extend this into a 4 quadrant grid where negative numbers are involved.
11. Integers Integers are positive and negative whole numbers. Pupils should all be familiar with the number line as shown:
Pupils will learn how to add, subtract, multiply and divide integers in S1.
Adding and Subtracting
Some integer calculations for add and subtract can be done by moving up and down the number line
For plotting coordinates we teach the rule: along then up When drawing a coordinate grid pupils must make sure:
Numbers are evenly spaced Numbers are drawn ‘on the line’
and not ‘in the boxes’
x-coordinate y-coordinate

Page 30
Examples 1) 4 – 5
= −1 2) −2 + 7
= 5 3) 2 + 9 – 10 + 6
= 3 However, when adding and subtracting negative numbers pupils must remember that when two signs appear next to each other and are different, then you subtract. When two signs are next to each other and are the same, then you add:
Note: negative numbers are usually written in brackets
Examples
1) 10 + (− 7) = 10 – 7 = 3
2) 4 – (−3) = 4 + 3 = 7
3) −7 – (−4) = −7 + 4 = −3
Multiplying and Dividing
The rule for multiplying and dividing is very similar to the rule for adding and subtracting.
When the signs are different the answer is negative When the signs are the same the answer is positive
Examples 1) 5 × (−4)
= −20
2) (−6) × 3 = −18
3) (−3) × (−4) = 12
4) 10 ÷ (−2) = −5
5) (−24) ÷ 6 = −4
6) (−30) ÷ (−10) = 3
When Is This Taught?
S1 Pupils cover negative numbers and the number line at primary
school. This is extended into adding, subtracting, multiplying and dividing negative numbers in S1
S4-6 Negative numbers are revisited as part of National 4.
Recommended