Nuclear Mega ProjectRisk Analysis Model
Oak Ridge TennesseeNovember 5, 2009

2
Content
– Objectives
– Risk Assessment Approach
– Nuclear Risk Assessment Model Overview
– Lessons Learned
3
Objectives
■ Present a new approach to analyzing risks of large and complex projects that may be directly applied to DOE
■ Discuss an example of how this methodology was recently used in a nuclear project, and how this can fit DOE’s unique challenges
■ Present the benefits of using a risk assessment for protecting the government’s interests and reduce risk exposure

4
Content
– Objectives
– Risk Assessment Approach
– Nuclear Risk Assessment Model Overview
– Lessons Learned

5
Approach to risk assessment follows a logical progression of risk identification, impact, and mitigation analysis
RiskIdentification
RiskAnalysis
Risk Mitigation
Life Cycle Maintenance
ProjectStages
PurposeCapture relevant
risksMinimize risk
impact on projectUpdate outputs as
project evolves
Key Tasks Develop views on risk causation
Identify all “root causes” of risk and corresponding cost and schedule impacts
Map risks to project tasks, escalation rates, and/or cost elements
Analyze underlying risk causations
Assess root cause likelihood
Estimate individual cost and schedule risk impacts
Run pre-mitigation Monte Carlo simulation
Develop view of overall project impacts
Identify risks with most significant impact on project cost and schedule
Develop mitigation strategies
Run post-mitigation Monte Carlo simulation
Develop customized reports
Develop and update maintenance process
Update Model and inputs as events, both internal and external to project, arise
Products Preliminary Risk Register
Distributions of Cost and PCD
Risk Mitigation Strategies
Risk Analysis Model
Quantify impact of risk

6
The core of the risk assessment approach is the Nuclear Risk Assessment (NRA) Model
Total project cost (overnight; escalation; impact of delay)
Schedule
Financing Cost
Relative Economics
Cost Recovery
Risk Areas
Levelized cost of energy for nuclear versus alternative baseload technologies
Ability to fully recover project costs
Impact AreaFocus of Nuclear Risk Assessment Model
Separate, stand-alone assessment
Cost impact of schedule delay
Project Cost
Total cost of financing plant construction (debt and equity)
ReplacementPower
Lost margin opportunity

7
The NRA Model captures the complex inter-relationships among risks and their ultimate impact on schedule and costs
Illustrative Risk Alignment
CostEstimate
Cost and Schedule
Integration
ScheduleEstimate
Cost Impacts Schedule Impacts
Approval Delays
Approval Delays
Quantities Mobilization
Rework Rework
Performance Performance
Design Changes
Design Changes
Escalation Turnover
Timing of risk occurrence is addressed through detailed WBS and schedule alignment
By definition, each risk has three basic components:– A root cause– A probability (or likelihood) of the cause
giving rise to a specific impact (or range of impacts)
– A potential, future impact, or consequence
There are two distinct types of impacts modeled in the assessment– Risks having less than a 100% chance
of occurring– Uncertainties around quantity and price
assumptions are not associated with a probability and have a continuous impact distribution for all iterations

8
The risk model, and accompanying analysis, focuses on quantifying risk and uncertainty - and impacts of mitigation
Purpose of the Mitigation View
Understand the range of possible mitigating actions – by key risk element
Determine the individual and collective impacts of mitigating actions
Define appropriate scenarios and combinations of mitigating actions
Provide for an ongoing framework and capability to assess risk mitigation
Pre-Mitigation Impact Distribution
Freq
uenc
y
Total Project Cost
Post-Mitigation Impact Distribution
Freq
uenc
y
Total Project Cost
MitigationImpact

9
A range of potential risk prevention and mitigation activities are considered for individual risks
Contract Ts & Cs
AdvancedPlanning Impact
Mitigation
Supply ChainManagement
Owner Project
Management
WorkforceStrategy
Risk Prevention and Mitigation Categories
Contract Ts & Cs: Contractual terms that provide the appropriate incentives / penalties for contractor performance, allocate risks in the most effective manner, and allow owners to have the necessary project oversight
Advanced Planning: Detailed planning activities aimed at identifying and resolving issues that could impact schedule and costs (e.g., extensive construction planning)
Owner Project Management: Ensuring availability of deep project management capabilities and performance metrics that allow the owner to provide active oversight of project activities
Workforce Strategy: Activities which allow the development and retention of the needed pool of skilled resources (technical and craft)
Supply Chain Management: Direct involvement in selecting, monitoring, and evaluating supplier performance
Impact Mitigation: Activities that may lessen the severity of the impact in the event a risk does occur
Description

10
Project Maturity Curve
The model was developed to reflect a current view of potential outcomes and be updated as events evolve
Initial views may be based on a preliminary estimate reflecting a low degree of engineering completion
– Underlying logic for planning and execution would reflect an initial perspective on scope, roles and performance levels
– Cost and schedule elements individually subject to changes in unit and factor costs
Nature of DOE EM projects requires a model that can be updated effectvely
Expected Project Cost
Risk Categories
Planned Project
ScheduleProg
ress
Time
ProjectFormation
Timen + 1
Timen + 2
Timen + …
Current View
Project Completion
$xx
20yy
PoliticalEPC
OEM / TechnologyRegulatory
FinancingMarket
Decision and EventOutcomes
11
Content
– Objectives
– Risk Assessment Approach
– Nuclear Risk Assessment Model Overview
– Lessons Learned

12
Task start date, duration, and dependencies interact to determine end dates and critical path
The risk register contains risks associated with nuclear plant construction and defines how they impact the project cost and/or schedule
Likelihood of occurrence and impact data are included from both a pre- and post-mitigation perspective
Monte Carlo is run through cash flow projection with simultaneous adjustments to task durations, cost bases, and escalation rates
The core of the risk model is a cash flow projection that uses Monte Carlo simulation to integrate cost and schedule risks
Root causeLikelihood of occurrenceImpact type (cost, schedule, relative economics, and/or cost recovery)WBS element, cost element, and/or escalation rate impactedImpact range (across triangular or normal distribution)
Risk Register
Simplified Model Architecture
Project Schedule1
Task start date Task duration - dynamically linked to schedule risksTask dependencies (driving critical path) Cash Flow Projection
By schedule task and yearDynamic to capture quantity estimate uncertainty and cost and schedule risksReports total nominal project costs through completion date, financing costs, and lost margin opportunity / replacement power
1: Excel-based
Cost EstimateVendor & owner costs distributed across schedule tasks and broken down by cost factorCosts adjustable for uncertainty and cost risks
Real dollar cost estimates referred to as ‘cost basis’(by schedule task)

13
The effectiveness of the NRA Model relies on the underlying analytics as well as customized, dynamic features
The cost impact assessment is based on a dynamic nominal cash flow projection by schedule task and across the construction period – Baseline cost estimates are adjusted for risk via overnight costs,
escalation factors, and schedule extensions– Baseline schedule estimates are adjusted for risk via duration
extensions for individual schedule tasks– Resulting project completion date depends on aggregation of
schedule task start dates, durations, and inter-dependencies– Costs by schedule task are summed for each year to yield total
project costs
The combined impact of the risk factors is assessed through a Monte Carlo simulation that generates a distribution of commercial operation dates, project costs, and lost margin opportunity – The impact of risks on financing costs is modeled through
alternative scenarios
Significance of individual risks can be measured by a covarianceanalysis and by isolating risks to assess discrete impact
Key Model Characteristics
• Dynamic, risk-adjustable schedule
• Dynamic, risk-adjustable cash flow projection linked to project schedule
• Cost breakdown into cost factors with distinct, risk-adjustable escalation rates
• Task specific run rates to simulate cost of schedule extension
• Cost factor specific spend curves to simulate distribution of cost over years
• Uncertainty ranges built into cost estimates and combined with risk in Monte Carlo simulation

14
Attributes
Likelihood of Occurrence
Impact / Distribution
The Project Risk Register documents specific attributes for each risk, including likelihood and impact
AND, OR, and AND/OR relationship between impacts for a single root cause (i.e. for covariance)
Impact Interdependencies
A detailed, qualitative description of an event and consequence'sRisk Description
A short title for each risk which allows for ease of identificationRisk Name
Incremental cost or schedule impact relative to baseline across a defined distribution if risk event occurs
Impacts
The activity (or group of activities) associated with the cost or schedule impact
Schedule Tasks, Cost Factors, and Escalation Rate Impacted
Probability associated with this risk occurringLikelihood of Occurrence
Predefined risk categories to group each risk by primary driverRisk Category
DescriptionAttribute
100%Uncertainty (e.g., commodity price
5%
17.5%
50%
82.5%
95%
Probability
Unlikely
Level
Very Likely
Very Unlikely
Possible
Likely
ImpactDistribution
Mean and standard deviation
Mean and standard deviation
Most likely, low, and high values
Technology riskProject risk
Market riskPolitical risk
Financial riskRegulatory risk
Risk Register OverviewRisk Categories
15
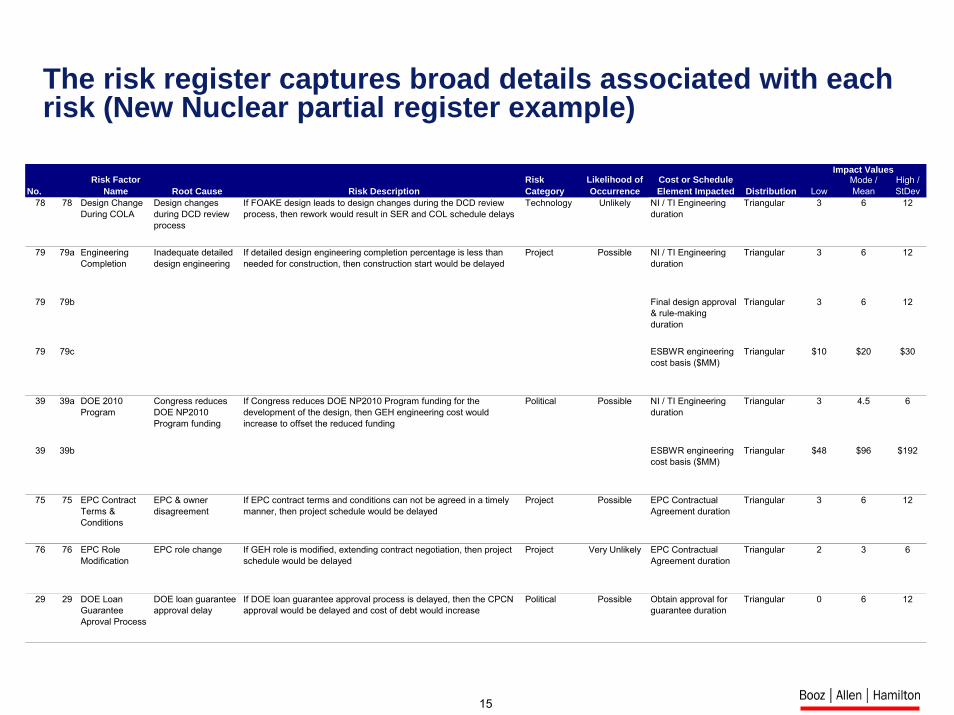
The risk register captures broad details associated with each risk (New Nuclear partial register example)
No.Risk Factor
Name Root Cause Risk DescriptionRisk Category
Likelihood of Occurrence
Cost or Schedule Element Impacted Distribution Low
Mode / Mean
High / StDev
78 78 Design Change During COLA
Design changes during DCD review process
If FOAKE design leads to design changes during the DCD review process, then rework would result in SER and COL schedule delays
Technology Unlikely NI / TI Engineering duration
Triangular 3 6 12
79 79a Engineering Completion
Inadequate detailed design engineering
If detailed design engineering completion percentage is less than needed for construction, then construction start would be delayed
Project Possible NI / TI Engineering duration
Triangular 3 6 12
79 79b Final design approval & rule-making duration
Triangular 3 6 12
79 79c ESBWR engineering cost basis ($MM)
Triangular $10 $20 $30
39 39a DOE 2010 Program
Congress reduces DOE NP2010 Program funding
If Congress reduces DOE NP2010 Program funding for the development of the design, then GEH engineering cost would increase to offset the reduced funding
Political Possible NI / TI Engineering duration
Triangular 3 4.5 6
39 39b ESBWR engineering cost basis ($MM)
Triangular $48 $96 $192
75 75 EPC Contract Terms & Conditions
EPC & owner disagreement
If EPC contract terms and conditions can not be agreed in a timely manner, then project schedule would be delayed
Project Possible EPC Contractual Agreement duration
Triangular 3 6 12
76 76 EPC Role Modification
EPC role change If GEH role is modified, extending contract negotiation, then project schedule would be delayed
Project Very Unlikely EPC Contractual Agreement duration
Triangular 2 3 6
29 29 DOE Loan Guarantee Aproval Process
DOE loan guarantee approval delay
If DOE loan guarantee approval process is delayed, then the CPCN approval would be delayed and cost of debt would increase
Political Possible Obtain approval for guarantee duration
Triangular 0 6 12
Impact Values
16
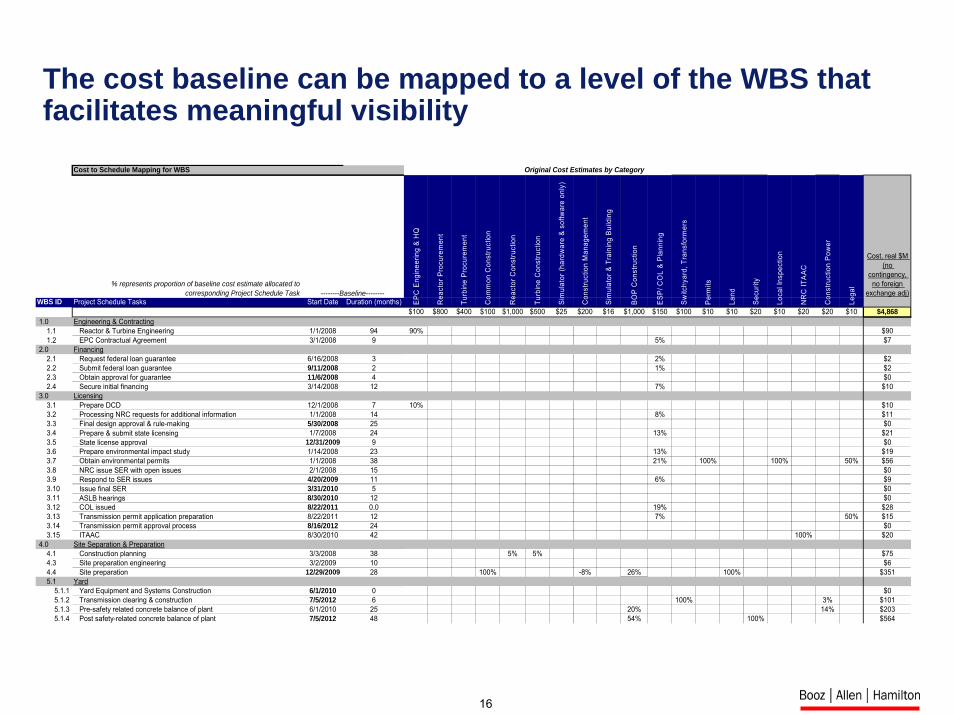
Cost to Schedule Mapping for WBS Original Cost Estimates by Category
% represents proportion of baseline cost estimate allocated to corresponding Project Schedule Task
Cost, real $M (no
contingency, no foreign
exchange adj)WBS ID Project Schedule Tasks Start Date Duration (months)
$100 $800 $400 $100 $1,000 $500 $25 $200 $16 $1,000 $150 $100 $10 $10 $20 $10 $20 $20 $10 $4,868 1.0 Engineering & Contracting 1.1 Reactor & Turbine Engineering 1/1/2008 94 90% $90 1.2 EPC Contractual Agreement 3/1/2008 9 5% $7 2.0 Financing 2.1 Request federal loan guarantee 6/16/2008 3 2% $2 2.2 Submit federal loan guarantee 9/11/2008 2 1% $2 2.3 Obtain approval for guarantee 11/6/2008 4 $0 2.4 Secure initial financing 3/14/2008 12 7% $10 3.0 Licensing 3.1 Prepare DCD 12/1/2008 7 10% $10 3.2 Processing NRC requests for additional information 1/1/2008 14 8% $11 3.3 Final design approval & rule-making 5/30/2008 25 $0 3.4 Prepare & submit state licensing 1/7/2008 24 13% $21 3.5 State license approval 12/31/2009 9 $0 3.6 Prepare environmental impact study 1/14/2008 23 13% $19 3.7 Obtain environmental permits 1/1/2008 38 21% 100% 100% 50% $56 3.8 NRC issue SER with open issues 2/1/2008 15 $0 3.9 Respond to SER issues 4/20/2009 11 6% $9 3.10 Issue final SER 3/31/2010 5 $0 3.11 ASLB hearings 8/30/2010 12 $0 3.12 COL issued 8/22/2011 0.0 19% $28 3.13 Transmission permit application preparation 8/22/2011 12 7% 50% $15 3.14 Transmission permit approval process 8/16/2012 24 $0 3.15 ITAAC 8/30/2010 42 100% $20 4.0 Site Separation & Preparation 4.1 Construction planning 3/3/2008 38 5% 5% $75 4.3 Site preparation engineering 3/2/2009 10 $6 4.4 Site preparation 12/29/2009 28 100% -8% 26% 100% $351 5.1 Yard 5.1.1 Yard Equipment and Systems Construction 6/1/2010 0 $0 5.1.2 Transmission clearing & construction 7/5/2012 6 100% 3% $101 5.1.3 Pre-safety related concrete balance of plant 6/1/2010 25 20% 14% $203 5.1.4 Post safety-related concrete balance of plant 7/5/2012 48 54% 100% $564
EPC
Eng
inee
ring
& H
Q
Turb
ine
Proc
urem
ent
Rea
ctor
Pro
cure
men
t
Com
mon
Con
stru
ctio
n
Rea
ctor
Con
stru
ctio
n
Turb
ine
Con
stru
ctio
n
Land--------Baseline--------
Sim
ulat
or &
Tra
inin
g Bu
ildin
g
Con
stru
ctio
n M
anag
emen
t
Con
stru
ctio
n Po
wer
Switc
hyar
d, T
rans
form
ers
Perm
its
Loca
l Ins
pect
ion
ESP/
CO
L &
Plan
ning
Sim
ulat
or (h
ardw
are
& so
ftwar
e on
ly)
Lega
l
NR
C IT
AAC
Secu
rity
BOP
Con
stru
ctio
n
The cost baseline can be mapped to a level of the WBS that facilitates meaningful visibility

17
The cost baseline links costs and schedule by the allocation of each cost category to one or more schedule tasks
5.2.4 Component C equipment
5.2.5 Component C construction
1.1 Engineering
•
5.2.1 Long lead items
5.2.2 Component A construction
5.2.3 Component B construction
•
Engi
neer
ing
100%
NI
Proc
urem
ent
NI
Con
stru
ctio
n
…15%
32%
20%
100%
$__ $__ $__
Con
stru
ctio
n M
anag
emen
t
30%
19%
30%
$__
Con
stru
ctio
nPo
wer
…
19%
12%
50%
$__
38%
24%
38% 19%
100% 100% 100% 100% 100%
$__M
$__M
$__M
$__M
2%
32%
21%
$__M
$__M
Step 1: Baseline cost estimates
Step 2: Percentage of baseline costs allocated to each schedule task
Cost to Schedule Mapping (extract)
Schedule Tasks
Step 3: Each schedule task cost is allocated to individual cost factors
Totals:
Example
18
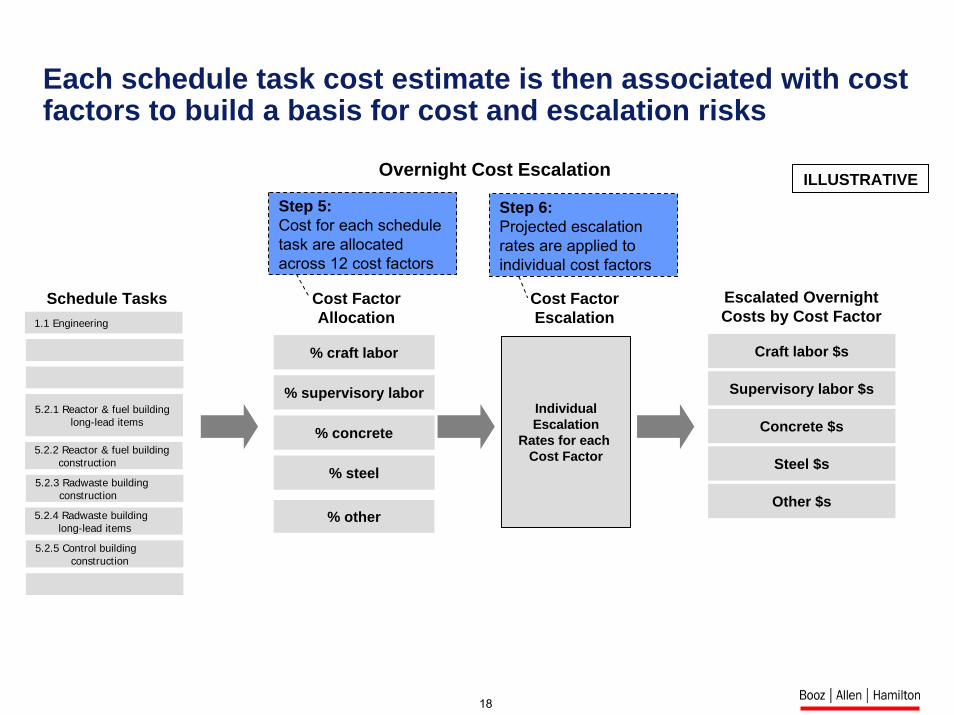
Each schedule task cost estimate is then associated with cost factors to build a basis for cost and escalation risks
% craft labor
% supervisory labor
% concrete
% steel
% other
Cost Factor Allocation
Craft labor $s
Supervisory labor $s
Concrete $s
Steel $s
Other $s
Escalated Overnight Costs by Cost Factor
Overnight Cost Escalation
5.2.4 Radwaste building long-lead items
5.2.5 Control building construction
1.1 Engineering
5.2.1 Reactor & fuel building long-lead items
5.2.2 Reactor & fuel building construction
5.2.3 Radwaste building construction
Schedule Tasks
IndividualEscalation
Rates for each Cost Factor
Cost Factor Escalation
ILLUSTRATIVEStep 5: Cost for each schedule task are allocated across 12 cost factors
Step 6: Projected escalation rates are applied to individual cost factors

19
Probability distribution outputs provide a view into the range of outcomes given the identified risk impacts
Project Completion Date and Total Cost Distributions
Source: Booz Allen analysis
01234567
0
20
40
60
80
100
Cost ($B, nominal)
Cum
ulative Probability (%)
Prob
abili
ty (%
)
Contributions to cost variance from baseline can be disaggregated into separate probability distributions:– Cost basis– Escalation rates– Schedule extensions
The distribution for each element can be viewed individually or aggregate in a total project cost perspective
Probability (%) Cumulative Probability (%)
0
5
10
15
20
0
20
40
60
80
100Project Completion Date
Number of times a specific outcome occurs in the Monte Carlo simulation, indicating the probability of that specific outcome
Cumulative probability
Expected outcome at a given probability level (e.g., P50)
20
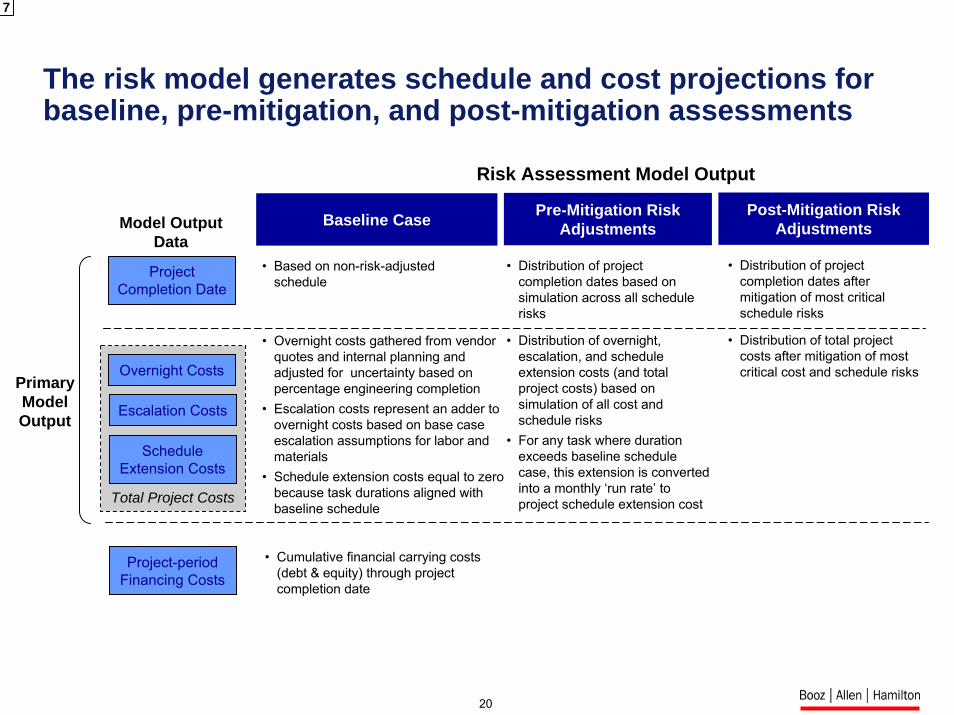
The risk model generates schedule and cost projections for baseline, pre-mitigation, and post-mitigation assessments
7
Project Completion Date
Total Project Costs
Overnight Costs
Escalation Costs
Schedule Extension Costs
Project-period Financing Costs
Model Output Data
Baseline Case Pre-Mitigation Risk Adjustments
Post-Mitigation Risk Adjustments
• Based on non-risk-adjusted schedule
• Overnight costs gathered from vendor quotes and internal planning and adjusted for uncertainty based on percentage engineering completion
• Escalation costs represent an adder to overnight costs based on base case escalation assumptions for labor and materials
• Schedule extension costs equal to zero because task durations aligned with baseline schedule
• Cumulative financial carrying costs (debt & equity) through project completion date
• Distribution of project completion dates based on simulation across all schedule risks
• Distribution of overnight, escalation, and schedule extension costs (and total project costs) based on simulation of all cost and schedule risks
• For any task where duration exceeds baseline schedule case, this extension is converted into a monthly ‘run rate’ to project schedule extension cost
• Distribution of project completion dates after mitigation of most critical schedule risks
• Distribution of total project costs after mitigation of most critical cost and schedule risks
Risk Assessment Model Output
Primary Model Output
21
0.23
0.04
0.04
0.10
0.16
0.48
0.90
0.06
0.06
0.07
0.12
0.13
0.16
0.92
1.00Risk 1
Risk 2
Risk 3
Risk 4
Risk 5
Risk 6
Risk 7
Risk 8
Risk 9
Risk 10
Risk 11
Risk 12
Risk 13
Risk 14
Risk 15
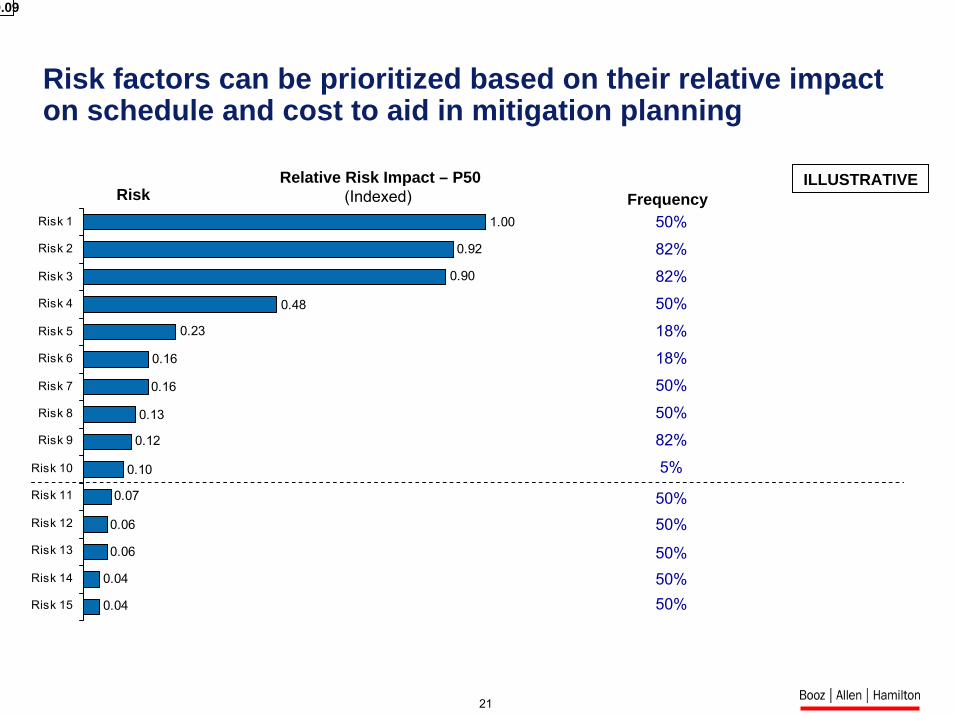
Relative Risk Impact – P50(Indexed) Risk
Risk factors can be prioritized based on their relative impact on schedule and cost to aid in mitigation planning
0.09
Frequency
5%
50%
18%
18%
50%
50%
82%
82%
50%
82%
50%50%
50%50%50%
ILLUSTRATIVE

22
020406080
100
1/1/
2010
4/1/
2010
7/1/
2010
10/1
/201
0
1/1/
2011
4/1/
2011
7/1/
2011
10/1
/201
1
1/1/
2012
4/1/
2012
7/1/
2012
10/1
/201
2
1/1/
2013
4/1/
2013
7/1/
2013
0
20
40
60
80
100
< 7.
07
- 7.1
7.1
- 7.2
7.2
- 7.3
7.3
- 7.4
7.4
- 7.5
7.5
- 7.6
7.6
- 7.7
7.7
- 7.8
7.8
- 7.9
7.9
- 8.0
8.0
- 8.1
8.1
- 8.2
8.2
- 8.3
8.3
- 8.4
8.4
- 8.5
8.5
- 8.6
8.6
- 8.7
8.7
- 8.8
8.8
- 8.9
8.9
- 9.0
9.0
- 9.1
9.1
- 9.2
9.2
- 9.3
9.3
- 9.4
> 9.
4
Cum
ulat
ive
Prob
abili
ty, %
Aggregation of the resultant mitigation actions reveals the potential to reduce overall project schedule and cost risks
Project Completion Date DistributionPre- versus Post-Mitigation
Illustrative Mitigation ActionsTotal Project Cost DistributionPre- versus Post-Mitigation
$xxM P50 reduction
Y month P50 reductionCum
ulat
ive
Prob
abili
ty, %
Owners rights vs.EPC are clearly defined to include oversight roles and responsibilitiesPerformance reporting requirements are specified including minimum standardsDevelop detailed construction plans and sequence activities in a way that minimizes the potential for interferencePerform detailed review of construction schedules and resource loading plans for potential productivity bottlenecks Create a mechanism, e.g., a roundtable, to obtain craft input on key hiring training and retention issuesPartner with local governments on program design for craft workforce attraction and trainingEstablish mandatory hold and witness points in equipment vendor fabrication process
ILLUSTRATIVE

23
Content
– Objectives
– Mega Project Risks: A Perspective
– Nuclear Risk Assessment Model Overview
– Lessons Learned

24
Lessons learned from mega-projects risk analysis:
Stability is unlikely. Risks will change as project circumstances evolve. Owners cannot rely only on front-end risk analysis to carry them through the project.
Recurring risk assessment allows owners to factor into the analysis additional in-formation and insights as they become known. A continuous view of risk allows the owner to react with fore-sight, rather than in desperation.
Expect the unexpected. Even the most elegant plans can go awry for a multi-year project, particularly one where the early planning work occurs eight to ten years in advance of the actual completion date and includes first-of-a-kind engineering.
25
Lessons learned from mega-projects risk analysis:
It is important that project owners get the fundamentals right starting with planning
•Establishing workable financing structures
•Meeting regulatory needs
•Demonstrating capabilities to execute
•Detailed and reasonable risk apportionment
Underestimation is common. Since most mega-projects under-perform, it is logical that owners would thoroughly assess their risk in recognition.
•They need to elevate the intensity of their risk analyses; the premise that “lightning won’t strike twice” can be an expensive lesson to learn—again.
•Yet, many owners believe that their project will be different and immune to the circumstances that befell others.
26
How can DOE benefit from integrating a rigorous risk analysis methodology into complex project and programs?
Provides a means of assessing the risk of the applicant-not only based on financial but on their project assessment approaches
Presents a risk profile of top risks of programs and their impacts on schedule and cost assumptions
Provides a forum for negotiating contracts that could allow for shifting risks to EPC contractors
Provides an additional methodology to allow for effective project management and adjust to real time situations
Provides a common forum for stakeholders to evaluate program success
Recommended