NSDC Skill Gap Study of the North East - Manipur
2
Disclaimer: National Skill Development Corporation (NSDC) engaged ICRA Management Consulting Services Limited (IMaCS) to prepare this report, which is based on independent research and analysis done by IMaCS. This report is not based or derived from any other report or research paper. Any similarity with any other paper may purely be a coincidence.
All rights reserved. All copyright in this report and related works is solely and exclusively owned by NSDC. The same may not be reproduced, wholly or in part in any material form (including photocopying or storing it in any medium by electronic means and whether or not transiently or incidentally to some other use of this report), modified or in any manner communicated to any third party except with the written approval of NSDC.
This report is for information purposes only. While due care has been taken during the compilation of this report to ensure that the information is accurate to the best of IMaCSs’ and NSDC’s knowledge and belief, the content is not to be construed in any manner whatsoever as a substitute for professional advice.
IMaCS and NSDC neither recommend nor endorse any specific products or services that may have been mentioned in this report and nor do they assume any liability or responsibility for the outcome of decisions taken as a result of any reliance placed in this report.
Neither IMaCS nor NSDC shall be liable for any direct or indirect damages that may arise due to any act or omission on the part of the user due to any reliance placed or guidance taken from any portion of this report.

NSDC Skill Gap Study of the North East - Manipur
3
About National Skill Development Corporation
National Skill Development Corporation (NSDC) is a pioneering Public Private Partnership (PPP), set up
under the aegis of the Ministry of Finance, in July 2008, with a mandate to skill 150 million by 2022.
NSDC‟s mission is as follows:
Upgrade skills to international standards through significant industry involvement and develop
necessary frameworks for standards, curriculum and quality assurance.
Enhance, support and coordinate private sector initiatives for skill development through appropriate
PPP models; strive for significant operational and financial involvement from the private sector.
Focus on underprivileged sections of society and backward regions of the country thereby enabling a
move out of poverty; similarly, focus significantly on the unorganised or informal sector workforce.
Play the role of a „market-maker‟ by bringing financing or viability gap funding, particularly in
sectors where market mechanisms are ineffective or missing.
Prioritise initiatives that can have multiplier or catalytic effect as opposed to one-off impact.
Globally, NSDC is a unique PPP in the area of skill development. NSDC‟s key differentiators are as
follows:
Funds as well as provides strategic support to the skill development activities of stakeholders and
potential partners.
Monitors implementation over entire life of the project.
Enables skill development in high growth and unorganised sectors.
Facilitates creation of „Train the Trainer‟, centres
Accountable for raising skills to international standards through sector specific industry involvement
and setting systems and frameworks for standards, curriculum and quality assurance.
Set up Sector Skill Councils
Commissions periodic reports including skill gap surveys
Support of industry associations, hence access to the best industry data enabling creation of industry
specific curriculum, employability, etc.
Facilitates creation of Labour Market Information Systems (LMIS)

NSDC Skill Gap Study of the North East - Manipur
4
Foreword
National Skill Development Corporation (NSDC) is a pioneering Public Private Partnership (PPP), set up
under the aegis of the Ministry of Finance, in July 2008, with a mandate to skill 150 million persons by
2022.
NSDC‟s mission is as follows:
Upgrade skills to international standards through significant industry involvement and develop
necessary frameworks for standards, curriculum and quality assurance.
Enhance, support and coordinate private sector initiatives for skill development through appropriate
PPP models; strive for significant operational and financial involvement from the private sector.
Focus on underprivileged sections of society and backward regions of the country thereby enabling a
move out of poverty; similarly, focus significantly on the unorganised or informal sector workforce.
Play the role of a „market-maker‟ by bringing financing or viability gap funding, particularly in
sectors where market mechanisms are ineffective or missing.
Prioritise initiatives that can have multiplier or catalytic effect as opposed to one-off impact.
Globally, NSDC is a unique PPP in the area of skill development. NSDC‟s key differentiators are as
follows:
Funds as well as provides strategic support to the skill development activities of stakeholders and
potential partners.
Monitors implementation over entire life of the project.
Enables skill development in high growth and unorganised sectors.
Facilitates creation of „Train the Trainer‟, centres
Accountable for raising skills to international standards through sector specific industry involvement
and setting systems and frameworks for standards, curriculum and quality assurance.
Set up Sector Skill Councils
Commissions periodic reports including skill gap surveys
Support of industry associations, hence access to the best industry data enabling creation of industry
specific curriculum, employability, etc.
Facilitates creation of Labour Market Information Systems (LMIS)

NSDC Skill Gap Study of the North East - Manipur
5
Foreword
The North Eastern States comprise Arunachal Pradesh, Assam, Manipur, Meghalaya, Mizoram,
Nagaland, Sikkim, and Tripura.
The eight States located in India‟s North-East cover an area of 2,62,179 sq. km. constituting 7.9 per cent
of the country‟s total geographical area, and 46million people or about 4 per cent of the total population
of the country (Census 2011).
Most North Eastern States have remained one of the under developed and untapped regions of the
country. Some of the reasons are as follows:
Remoteness and isolation because of being mostly landlocked
Lack of access to markets
Limited connectivity to the rest of India
Limited infrastructure
Challenges in land acquisition
Widespread use of traditional cultivation methods that are inefficient
Lack of facilities such as cold storage for warehousing fruits and transporting to market
Inadequate infrastructure that could help transport goods from the region
Difficulty in accessing bank credit for enterprises
Lack of confidence in seeking credit by small and tiny sector enterprises

NSDC Skill Gap Study of the North East - Manipur
6
Poor awareness of markets, changing demand patterns, raw material sourcing, technology, branding
and quality standards
High and widespread dependence on Governments‟ programmes for market access, subsidy and
training
Educated seeking, mostly, Government jobs or relocating out of the region
Stigma against labour oriented jobs
Dependence on, mainly, local market for selling products from small and tiny sector
Inadequate telecommunications connectivity
Despite these disadvantages, there are success stories of entrepreneurs who have started on small scale,
overcome the difficulties and have grown in the last 15-20 years to make a name for themselves in the
region. Though small now, their number is likely to grow as more people travel outside the region, attain
education, training and skills, investing is made attractive by the States, markets linkages are developed,
substantial buyers are attracted to the products from the region and, trained and skilled persons can be
gainfully employed within the region.
It is in this context that the North Eastern Council (NEC) and the Ministry of Development of North
Eastern Region (DoNER) have prepared Vision 2020 for the North Eastern Region.
The Vision 2020 envisages the following targets by 2020:
Overall GSDP growth at a CAGR of 11.64 per cent between 2007-09 and 2019-20.
Overall per capita income growth of 12.95 per cent between 2007-09 and 2019-20.
To support this vision, the Ministry of Development of North Eastern Region has formulated a Strategic
Plan 2010-16 focusing on three broad dimensions:
(A) Rapid socio-economic development:
Facilitating preparation of Strategic Plans for key sectors such as Agriculture, Road, Civil Aviation,
Railways, Inland Water Transport, Power, Tele-Communication & IT, HRD, Health and Handloom &
Handicrafts and implementation of the Plans so prepared by the line-Ministries and North Eastern
States.
Facilitating formulation of Projects, Schemes and Programmes by major Central Ministries in
consonance with the requirement of the North-Eastern Region.

NSDC Skill Gap Study of the North East - Manipur
7
Increasing the effectiveness of developmental expenditure in the North-East Region through higher
levels of transparency, systemic improvements and independent monitoring mechanism.
Creating an in-house database on important socio-economic indicators in the Region and its periodic
assessment.
Facilitating preparation of Regional Plan by the NEC.
Providing critical support to the NEC for identification of appropriate regional projects and their
implementation.
Facilitating funding by External Agencies in critical Sectors in the North Eastern States.
Undertaking pilot or demonstration projects in the North-East Region in certain sectors to provide
fillip to these sectors.
(B) Building capacities and competencies in critical sectors in the North Eastern States
Preparation of a Plan of Action for building capacities and competencies in critical sectors in the
North Eastern States.
Identifying institutes and organizations for imparting training and building capacities in the North
Eastern Region.
Setting up of Training Institutes in the Region in important fields through line Ministries, NEC or
States.
Augmenting the capacity of the existing training institutes in the North Eastern States.
Use of IT as a tool to upgrade skills.
(C)Promote the strengths of the Region
Preparation of a „Plan of Action‟ for projecting and promoting key strengths of the Region.
Promoting student and cultural exchanges among the States of the Region on one hand and between
the Region and the rest of the country.
Organizing business summits, exhibitions and cultural festivals to promote the Region.
Undertaking well-conceived promotional campaigns in the print and electronic media for projecting a
positive image of the Region.
Arranging festivals and cultural exchanges between the Region and the neighbouring countries.
Highlighting the achievements and success stories from the Region in mainstream media.
Instituting an Award Scheme to honour and showcase the achievements of talented people of the
Region.
NSDC Skill Gap Study of the North East - Manipur
8
While this requires substantial investment, implementation of Action Agenda outlined in the Vision and
Strategic Plan, it also requires imparting of skills at all levels.
The North Eastern States, clubbed together, have some common attributes. But they also have significant
variations related to culture, language, values, work preferences and ethics, and overall environment
related to Government, infrastructure, terrain, proximity to or availability of markets and services. Hence,
the skilling interventions may vary across states and districts despite, similarities of activities.
Given the above background, ICRA Management Consulting Services Limited (IMaCS) has been
mandated by the NSDC to assist in identifying development and employment potential of districts of
North Eastern States.
Manipur is an oval shaped valley surrounded by nine hill ranges. Its altitude varies from 790 m above sea
level in the valley to 2,020 m in the hills. It has sub-tropical climate. The State has been historically ruled
by several kings as a tiny independent State. It came under British India in 1892 and is an Indian State
since 1949.
The State is home to several ethnic groups presenting complex socio-economic structure. It accounts for
0.7 per cent of India‟s land area and 0.22 per cent of population. It has had a slow rate of urbanisation.
Just about 25 per cent of population lives in urban areas.
Rural development programmes in the State include NREGS, SJGSY, SGRY, IAY, PMGY and PMGSY.
Industrial development is extremely slow. Handloom and handicrafts is the only surviving industry apart
from some SSI activity.

NSDC Skill Gap Study of the North East - Manipur
9
This report has been structured in three parts:
Part I includes Foreword, Acknowledgements, Approach and Methodology, and Study Limitations.
Part II concentrates on the diagnostic analysis of Manipur, human resources requirement, skill gaps
assessed for Manipur.
Part III presents a detailed set of recommendation for Manipur.
Manipur

NSDC Skill Gap Study of the North East - Manipur
10
Acknowledgements
Carrying out a large scale survey is always a challenge. However, this task was made easy for the team by
the support that they received from various stakeholders. The team acknowledges, with grateful thanks,
useful information, references and support provided by NSDC and Ministry of Development of North
Eastern Region.
IMaCS team has travelled through the districts of Manipur to conduct the surveys for this study. The team
has interacted with a cross-section of stakeholders. This survey exercise would not have been possible
without the support of key stakeholders some of whom we have listed below.
Mr. D.S. Poonia, Chief Secretary, Manipur
Mr. O. Nabakishore Singh, Commissioner, Department of Commerce & Industries
Mr. Munindra Singh, Director, State Planning Department
Ms. Jacintha Lazarus, Deputy Commissioner, Churachandpur District
Mr. R. K. Dinesh, Deputy Commissioner, Thoubal District
Mr. T. Sithlou, Deputy Commissioner, Bishnupur District
Mr. K.Lakshmi Kumar, Deputy Commissioner, Imphal East District
Dr. W Gyaneshor Singh, Dean, Regional Institute of Medical Sciences
Dr. Sarat Chandra, Administrative Head (Imphal), NIT
Mr. M Lokendro Singh, Chief Engineer, PWD
Mr. S Joykumar Singh, Managing Director, Manipur Industrial Development Corporation Ltd.
Ms. Indira Oinam Singh, Head, Women‟s Income Generation Centre, Thoubal.
In addition, there are many persons or organisations who have contributed greatly towards the successful
completion of this study. The team conveys sincere thanks to all of them for their generous support and
contribution.

NSDC Skill Gap Study of the North East - Manipur
11
TABLE OF CONTENTS
About National Skill Development Corporation ....................................................................................... 3
Foreword ................................................................................................................................................. 4
Foreword ................................................................................................................................................. 5
Acknowledgements ............................................................................................................................... 10
PART – I: Introduction .......................................................................................................................... 18
1. Report Objectives .......................................................................................................................... 19
2. Approach and Methodology ........................................................................................................... 19
3. Study Limitations .......................................................................................................................... 21
PART – II (a): Diagnostic Analysis of Manipur ..................................................................................... 22
4.1 Macro-Economic Overview ....................................................................................................... 23
4.2 Industrial Activity Overview ...................................................................................................... 27
4.3 Demography and Employment Overview ................................................................................... 30
4.4 Government Policy Support ....................................................................................................... 33
4.5 Infrastructure Overview ............................................................................................................. 34
4.6 Key Findings from the Diagnostic Analysis................................................................................ 38
4.7 SWOT Analysis of Manipur ....................................................................................................... 41
PART – II (b): Identification of growth sectors ...................................................................................... 42
5.1 Criteria for selecting growth sectors ........................................................................................... 43
5.2 Framework for identifying growth engines ................................................................................. 43
5.3 Identified sectors for livelihood and local demand sectors .......................................................... 44
5.4 Identified sectors for migration .................................................................................................. 45
5.5 Type of skilling required in identified sectors ............................................................................. 46
5.6 Type of skilling required in sectors identified for migration ........................................................ 47
PART – II (c): District level Analysis of Manipur .................................................................................. 48
6.1.Bishnupur ........................................................................................................................................ 49
6.1.1 Economy ...................................................................................................................................... 49
6.1.2Demography .................................................................................................................................. 49
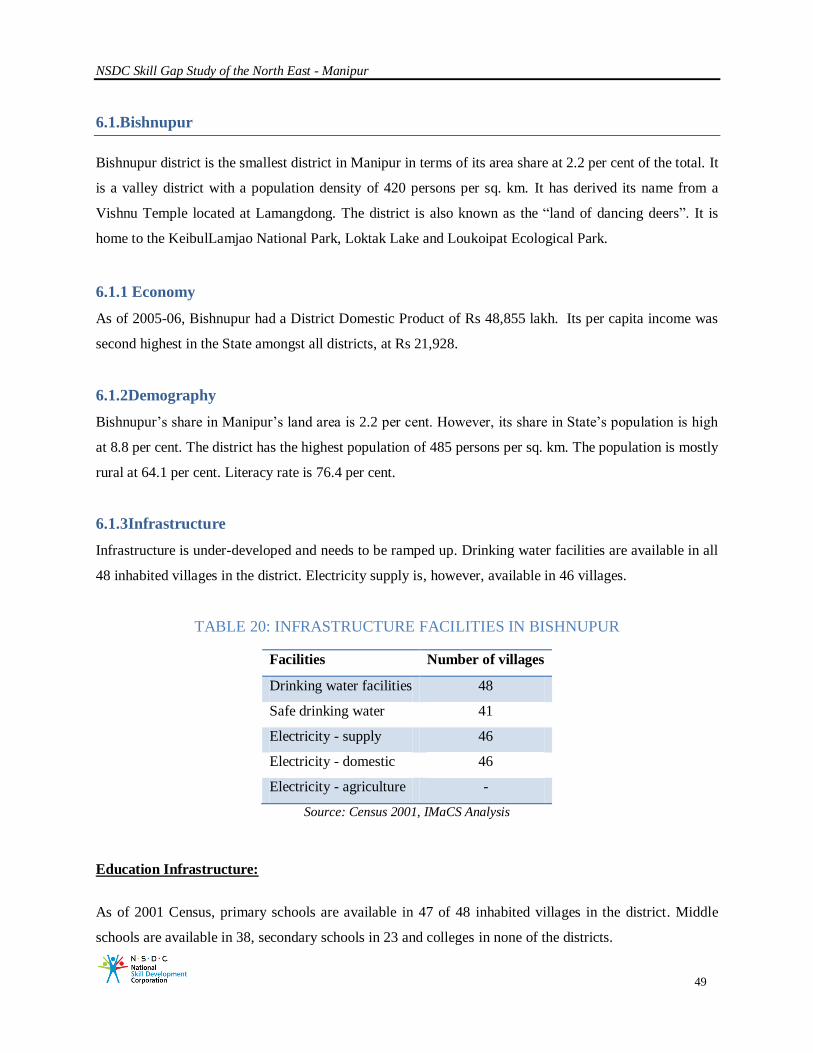
6.1.3Infrastructure ................................................................................................................................. 49
6.1.4 Employment Pattern ..................................................................................................................... 50
6.1.5 Potential sectors in district ............................................................................................................ 50
6.2 Chandel ........................................................................................................................................... 51
NSDC Skill Gap Study of the North East - Manipur
12
6.2.1 Economy ...................................................................................................................................... 52
6.2.2Demography .................................................................................................................................. 52
6.2.3Infrastructure ................................................................................................................................. 52
6.2.4 Employment Pattern ..................................................................................................................... 53
6.2.5 Potential sectors in district ............................................................................................................ 53
6.3 Churachandpur ................................................................................................................................ 54
6.3.1 Economy ...................................................................................................................................... 54
6.3.2Demography .................................................................................................................................. 54
6.3.3Infrastructure ................................................................................................................................. 54
6.3.4 Employment Pattern ..................................................................................................................... 55
6.3.5 Potential sectors in district ............................................................................................................ 55
6.4 Imphal (West and East) .................................................................................................................... 56
6.4.1 Economy ...................................................................................................................................... 57
6.4.2Demography .................................................................................................................................. 57
6.4.3Infrastructure ................................................................................................................................. 57
6.4.4 Employment Pattern ..................................................................................................................... 59
6.4.5 Potential sectors in district ............................................................................................................ 59
6.5 Senapati ........................................................................................................................................... 61
6.5.1 Economy ...................................................................................................................................... 61
6.5.2Demography .................................................................................................................................. 61
6.5.3Infrastructure ................................................................................................................................. 62
6.5.4 Employment Pattern ..................................................................................................................... 63
6.5.5 Potential sectors in district ............................................................................................................ 63
6.6 Tamenglong..................................................................................................................................... 64
6.6.1 Economy ...................................................................................................................................... 64
6.6.2Demography .................................................................................................................................. 64
6.6.3Infrastructure ................................................................................................................................. 64
6.6.4 Employment Pattern ..................................................................................................................... 65
6.6.5 Potential sectors in district ............................................................................................................ 66
6.7 Thoubal ........................................................................................................................................... 66
6.7.1 Economy ...................................................................................................................................... 66
6.7.2Demography .................................................................................................................................. 66

NSDC Skill Gap Study of the North East - Manipur
13
6.7.3Infrastructure ................................................................................................................................. 67
6.7.4 Employment Pattern ..................................................................................................................... 68
6.7.5Potential sectors in district ............................................................................................................. 68
6.8 Ukhrul ............................................................................................................................................. 69
6.8.1 Economy ...................................................................................................................................... 69
6.8.2Demography .................................................................................................................................. 69
6.8.3Infrastructure ................................................................................................................................. 69
6.8.4 Employment Pattern ..................................................................................................................... 70
6.8.5 Potential sectors in district ............................................................................................................ 71
PART – II (d): Skill Gap Analysis ......................................................................................................... 72
7.1Handloom and Handicraft ................................................................................................................. 73
7.1(a) Skill mapping and gap analysis in handloom and handicraft ......................................................... 75
7.2Food and food processing ................................................................................................................. 77
7.2(a) Food and food processing ............................................................................................................ 77
7.2(b) Skill mapping and gap analysis in food and processing industry................................................... 82
7.3Hotels ............................................................................................................................................... 85
7.3(a) Skill mapping and gap analysis in tourism and hospitality ............................................................ 86
7.4IT and Software ................................................................................................................................ 88
7.4(a) Skill mapping and gap analysis in IT and Software ...................................................................... 88
7.5Fisheries ........................................................................................................................................... 90
7.5(a) Skill mapping and gap analysis in fishery .................................................................................... 91
7.6 Construction .................................................................................................................................... 92
7.6(a) Skill mapping and gap analysis in construction ............................................................................ 92
7.7 Border Trade ................................................................................................................................... 93
7.7(a) Skill mapping and gap analysis in border trade ............................................................................ 94
7.7 Other potential sectors ..................................................................................................................... 94
PART – II (e): Forecasting of Human Resource Requirement ................................................................ 96
8.1 Human resource forecasting model .................................................................................................. 97
8.2 Incremental demand in Manipur....................................................................................................... 98
8.3 District-wise human resource requirement in Manipur – 2011-21 ..................................................... 99
8.4 Stakeholder feedback ..................................................................................................................... 101
PART – III: Recommendations ............................................................................................................ 104

NSDC Skill Gap Study of the North East - Manipur
14
9.1 Interventions for human resource Demand-Supply gap management .............................................. 105
9.2 Areas for skilling within state – 2011-21 ........................................................................................ 106
9.3 Skilling for migration..................................................................................................................... 110
9.4 Capacity creation within State ........................................................................................................ 111
9.5Private sector skill development opportunities at the district level ................................................... 112
9.5 Key interventions for Manipur ....................................................................................................... 127
Annexure ............................................................................................................................................ 128
1. Methodology used for Demand projections .................................................................................. 129
2. List of Abbreviations ................................................................................................................... 130
3. List of people met in Manipur ...................................................................................................... 131
4. Manipur – List of Handicrafts Clusters ......................................................................................... 134
5. Training Capacity of Vocational Education in Manipur ................................................................ 135
About ICRA Management Consulting Services Limited ...................................................................... 136

NSDC Skill Gap Study of the North East - Manipur
15
LIST OF TABLES
TABLE 1: COMPARISON OF GROSS STATE DOMESTIC PRODUCT ............................................................................... 23
TABLE 2: COMPARISON OF MANIPUR‟S PER CAPITA INCOME WITH INDIA AND NER ............................................ 26
TABLE 3: DISTRICT WISE PRODUCTION AND INVESTMENT ........................................................................................ 27
TABLE 4: SECTOR WISE DISTRIBUTION OF ENTERISES AND EMPLOYMENT IN MANIPUR .................................... 28
TABLE 5: COOPERATIVE SOCIETIES ................................................................................................................................ 29
TABLE 6: DISTRICT DEMOGRAPHIC PROFILE OF MANIPUR ........................................................................................ 30
TABLE 7: POPULATION BY AGE-GROUPS ....................................................................................................................... 31
TABLE 8: DISTRIBUTION OF MAIN WORKERS BY PROFESSION .................................................................................. 32
TABLE 9: DISTRICT WISE INDUSTRIAL DEVELOPMENT PLAN .................................................................................... 34
TABLE 10: ROAD LENGTH IN MANIPUR .......................................................................................................................... 35
TABLE 11: TELECOM INFRASTRUCTURE ........................................................................................................................ 36
TABLE 12: EDUCATION INFRASTRUCTURE .................................................................................................................... 36
TABLE 13: HEATH INFRASTRUCTURE ............................................................................................................................. 37
TABLE 14: AVAILABILITY OF WATER, SANITATION AND LIGHTING ......................................................................... 37
TABLE 15: UPCOMING INDUSTRIAL INFRASTRUCTURE IN MANIPUR ....................................................................... 38
TABLE 16: SHORTLISTED SECTORS ................................................................................................................................. 44
TABLE 17: SHORTLISTED SECTORS ................................................................................................................................. 45
TABLE 18: SKILLING REQUIRED ....................................................................................................................................... 46
TABLE 19: TYPE OF SKILLING REQUIRED FOR MIGRATION ........................................................................................ 47
TABLE 20: INFRASTRUCTURE FACILITIES IN BISHNUPUR ........................................................................................... 49
TABLE 21: EDUCATION INFRASTRUCTURE IN BISHNUPUR ......................................................................................... 50
TABLE 22: INFRASTRUCTURE FACILITIES IN CHANDEL .............................................................................................. 52
TABLE 23: EDUCATION INFRASTRUCTURE IN CHANDEL ............................................................................................ 53
TABLE 24: INFRASTRUCTURE FACILITIES IN CHURACHANDPUR .............................................................................. 54
TABLE 25: EDUCATION INFRASTRUCTURE IN CHURACHANDPUR ............................................................................ 55
TABLE 26: INFRASTRUCTURE FACILITIES IN IMPHAL EAST ....................................................................................... 57
TABLE 27: INFRASTRUCTURE FACILITIES IN IMPHAL WEST ...................................................................................... 58
TABLE 28: EDUCATION INFRASTRUCTURE IN IMPHAL EAST ..................................................................................... 58
TABLE 29: EDUCATION INFRASTRUCTURE IN IMPHAL WEST..................................................................................... 58
TABLE 30: INFRASTRUCTURE FACILITIES IN SENAPATI .............................................................................................. 62
TABLE 31: EDUCATION INFRASTRUCTURE IN SENAPATI ............................................................................................ 62
TABLE 32: INFRASTRUCTURE FACILITIES IN TAMENGLONG ..................................................................................... 64
TABLE 33: EDUCATION INFRASTRUCTURE IN TAMENGLONG .................................................................................... 65
TABLE 34: INFRASTRUCTURE FACILITIES IN THOUBAL .............................................................................................. 67
TABLE 35: EDUCATION INFRASTRUCTURE IN THOUBAL ............................................................................................ 67
TABLE 36: INFRASTRUCTURE FACILITIES IN UKHRUL ................................................................................................ 70
TABLE 37: EDUCATION INFRASTRUCTURE IN UKHRUL .............................................................................................. 70
TABLE 38: DISTRICT WISE PLANTS GROWN ................................................................................................................... 80
TABLE 39: COMPARATIVE YIELD PER HECTARE AND SHARE AT ALL-INDIA LEVEL ............................................. 81
TABLE 40: WELL-KNOWN TOURIST SPOTS IN MANIPUR .............................................................................................. 85
TABLE 41: TOURIST ARRIVALS IN MANIPUR ................................................................................................................. 86
TABLE 42: MANIPUR - FISHERY ........................................................................................................................................ 90
TABLE 43: FACILITIES AT INTEGRATED CHECK POST ................................................................................................. 93
TABLE 44: MANIPUR‟s DISTRICT WISE INCREMENTAL HUMAN RESOURCES REQUIREMENT: 2011-2021 .......... 100
TABLE 45: STAKEHOLDER FEEDBACK .......................................................................................................................... 101
TABLE 46: SKILL LEVEL WISE HUMAN RESOURCE REQUIREMENT IN BISHNUPUR .............................................. 113
TABLE 47: SKILL LEVEL WISE HUMAN RESOURCE REQUIREMENT IN CHANDEL ................................................. 115
TABLE 48: SKILL LEVEL WISE HUMAN RESOURCE REQUIREMENT IN CHURACHANDPUR ................................. 117
TABLE 49:SKILL LEVEL WISE HUMAN RESOURCE REQUIREMENT IN IMPHAL WEST .......................................... 119
TABLE 50: SKILL LEVEL WISE HUMAN RESOURCE REQUIREMENT IN IMPHALEAST ........................................... 120
TABLE 51: SKILL LEVEL WISE HUMAN RESOURCE REQUIREMENT IN SENAPATI ................................................. 121

NSDC Skill Gap Study of the North East - Manipur
16
TABLE 52: SKILL LEVEL WISE HUMAN RESOURCE REQUIREMENT IN TAMENGLONG......................................... 123
TABLE 53: SKILL LEVEL WISE HUMAN RESOURCE REQUIREMENT IN THOUBAL ................................................. 125
TABLE 54: SKILL LEVEL WISE HUMAN RESOURCE REQUIREMENT IN UKHRUL ................................................... 126

NSDC Skill Gap Study of the North East - Manipur
17
LIST OF FIGURES
FIGURE 1: GROSS STATE DOMESTIC PRODUCT ............................................................................................................. 23
FIGURE 2: PERCENTAGE DISTRIBUTION OF GROSS STATE DOMESTIC PRODUCT ................................................... 24
FIGURE 3: SECTOR-WISE DISTRIBUTION OF GROSS STATE DOMESTIC PRODUCT .................................................. 25
FIGURE 4: DISTRICT DOMESTIC PRODUCT ..................................................................................................................... 25
FIGURE 5: DISTRICT WISE PER CAPITA INCOME IN MANIPUR .................................................................................... 26
FIGURE 6: REGISTERED MANUFACTURING UNITS ....................................................................................................... 27
FIGURE 7: OAEs AND ESTABLISHMENTS IN MANIPUR ................................................................................................. 28
FIGURE 8: MAIN AND MARGINAL WORKERS ................................................................................................................. 32
FIGURE 9: THRUST AREAS IDENTIFIED UNDER DRAFT INDUSTRIAL AND INVESTMENT POLICY, 2011 .............. 33
FIGURE 10: TOTAL INSTALLED CAPACITY ..................................................................................................................... 35
FIGURE 11: EMPLOYMENT PATTERN IN BISHNUPUR DISTRICT .................................................................................. 50
FIGURE 12: EMPLOYMENT PATTERN IN CHANDEL DISTRICT ..................................................................................... 53
FIGURE 13: EMPLOYMENT PATTERN IN CHURACHANDPURDISTRICT ...................................................................... 55
FIGURE 14: EMPLOYMENT PATTERN IN IMPHALEAST DISTRICT ............................................................................... 59
FIGURE 15: EMPLOYMENT PATTERN IN IMPHAL WEST DISTRICT ............................................................................. 59
FIGURE 16: EMPLOYMENT PATTERN IN SENAPATI DISTRICT ..................................................................................... 63
FIGURE 17: EMPLOYMENT PATTERN IN TAMENGLONG DISTRICT ............................................................................ 65
FIGURE 18: EMPLOYMENT PATTERN IN THOUBAL DISTRICT ..................................................................................... 68
FIGURE 19: EMPLOYMENT PATTERN IN UKHRULDISTRICT ........................................................................................ 71
FIGURE 20: BUSINESS PRACTICES IN MANIPUR‟S HANDLOOM & HANDICRAFTS SECTOR .................................... 74
FIGURE 23: HUMAN RESOURCES FORECASTING MODEL............................................................................................. 97
FIGURE 22: HUMAN RESOURCES REQUIREMENT IN MANIPUR ................................................................................... 98
FIGURE 23: DEMAND AND SUPPLY OF HUMAN RESOURCES IN MANIPUR ............................................................... 99
FIGURE 24: DEMAND-SUPPLY OF HUMAN RESOURCES IN MANIPUR – 2011-21 ...................................................... 105
FIGURE 25: AREAS FOR SKILLING WITHIN STATE BETWEEN 2011 AND 2021.......................................................... 106
FIGURE 26: AREAS FOR SKILLING FOR DEMAND SECTORS IDENTIFIED WITHIN MANIPUR ................................ 107
FIGURE 27: LIVELIHOOD ACTIVITIES IN MANIPUR WHICH NEED SKILL UP-GRADATION ................................... 108
FIGURE 28: AREAS FOR SKILLING FOR MIGRATION TO OTHER STATES OR OVERSEAS....................................... 110
FIGURE 29: INTERVENTION FOR CAPACITY CREATION WITHIN THE STATE ......................................................... 111
NSDC Skill Gap Study of the North East - Manipur
18
PART – I: Introduction
NSDC Skill Gap Study of the North East - Manipur
19
1. Report Objectives
National Skill Development Corporation (NSDC) has mandated ICRA Management Consulting Services
Limited (IMaCS) to assess the development and employment generation potential of eight North Eastern
states of India. As per the Terms of Reference, the report objectives are as follows:
i. Review the socio-economic profile of the North Eastern Region
ii. Identify developmental opportunities keeping in mind factor endowments and stakeholder
perspectives
iii. Identify specific developmental initiatives/projects which also have impact on employment
generation
iv. Assess skills required to aid in such employment generation
v. Suggest suitable interventions/recommendations to achieve the same at a regional level
2. Approach and Methodology
The study has been conducted in three phases:
Phase – 1: Diagnostic Phase
The objective of this phase was to understand the socio-economic profile of the North Eastern Region.
The focus was on analyzing the economic and social position of the Region based on evolution of the
level and type of economic activity and social development in each State. The factor advantages,
constraints facing the Region either due to Regional factors or common among the states, and the
challenges going forward have been analysed. We have thus identified the factor endowments of the State
and the potential it holds. At the end of this stage, we have presented a snapshot of the State on economic
and social aspects and a SWOT analysis of the State.
Phase – 2: Synthesis Phase
This was carried-out in two modules:
Module 1: Assessment of Development Potential
Module 2: Assessment of Employment Potential and Gaps
Module 1: Assessment of Development Potential:
The objective of this phase was to identify development opportunities across formal and informal sectors
which provide livelihood opportunities for employment. We have also kept in mind the opportunities for

NSDC Skill Gap Study of the North East - Manipur
20
employment/livelihood generation identified as per the Vision 2020. This leads to the framework for
identification of formal and informal sector employment/skilling opportunities
For this exercise, we have interacted with a cross-section of stakeholders of the Government/Industry to
understand the following:
What are the key developmental areas to focus?
What needs to be done to leverage key strengths and factor endowments?
How can bottlenecks to development be cleared?
What various stakeholders need to do for development?
Based on the factor endowments and primary surveys conducted, we have identified potential and high
growth opportunities for North Eastern States.
Module 2: Assessment of Employment Potential
For the developmental opportunities identified, we have assessed the following:
Employment potential in the Region and on account of these identified developmental opportunities
Skills required to be developed among the North Eastern Region workforce to tap into the same.
This phase has been executed by: Profiling skills required sustaining traditional skills and tapping into
factor endowments, especially in the informal sector (wherever scalable) and Interacting with industry
(small, medium and large) and groups engaged in formal and informal sectors.
Phase – 3: Recommendations
Our interventions focus on various measures/potential ideas/projects required to be pursued for
Development and Employment Generation. These interventions focus on the following:
What is the enabling environment to be created to further development and employment
generation?
What are the interventions to enhance employment generation/job creation?
What are the potential opportunities that can be tapped thereof and structured for private sector
investment and NSDC interventions?
The report derives content for analyses from both, primary survey and secondary sources.

NSDC Skill Gap Study of the North East - Manipur
21
The surveys were undertaken by visiting several districts of Arunachal Pradesh, Assam, Manipur,
Meghalaya, Mizoram, Nagaland, Sikkim and Tripura and meeting key stakeholders identified with
the help of State/District Government Departments of Labour, Planning or Industries and using
internal research and databases.
Significant secondary research was also carried out in order to validate the findings of primary
survey.
3. Study Limitations
While care has been taken to ensure correctness of information, the report outcomes for entire North East
are affected by the following circumstances:
While the field survey has been conducted keeping in mind maximum coverage, the survey has been
constrained by factors such as - weather: a major part of the survey was conducted in the rainy season
with landslides and flooding; availability of transportation; proper road connectivity; availability of
persons to interview at select locations and offices; lack of documented and latest information; and
inaccessible distances from within a State.
While some states had updated statistics, for others approximations have been made because of dated
or non-existent data, particularly, for industries and institutions that have come up in recent years.
Approximations include use of past growth rates for projections, regional average, national average,
productivity growth, benchmarks with other states and others.
NSDC Skill Gap Study of the North East - Manipur
22
PART – II (a): Diagnostic Analysis of Manipur

NSDC Skill Gap Study of the North East - Manipur
23
4.1 Macro-Economic Overview
As of 2010-11, Manipur had a Gross State Domestic Product (GSDP) of Rs7,184 crore. It has increased at
a CAGR of 5.8 per cent between 2004-05 and 2010-11. The growth in Manipur‟s GSDP has been lower
than All-India average of 8.6 per cent and North East Region average of 6.3 per cent in the same period.
FIGURE 1: GROSS STATE DOMESTIC PRODUCT
(Rs Lakh)
Source: Central Statistical Organisation, Ministry of Programme Implementation & Statistics; IMaCS Analysis
TABLE 1: COMPARISON OF GROSS STATE DOMESTIC PRODUCT
Source: Central Statistical Organisation, Ministry of Programme Implementation & Statistics; IMaCS Analysis
* Aggregation of GSDP of all eight North Eastern States.

NSDC Skill Gap Study of the North East - Manipur
24
The tertiary sector makes the biggest contribution to GSDP, at 42 per cent. It is followed by secondary
sector at 33 per cent and primary sector at 25 per cent. Between 2004-05 and 2010-11, the contribution of
primary sector has remained stagnant, while the contribution of secondary sector has decreased from 37
per cent to 33 per cent. Contribution of tertiary sector, however, has increased from 39 per cent to 42 per
cent because of transport and communications.
FIGURE 2: PERCENTAGE DISTRIBUTION OF GROSS STATE DOMESTIC PRODUCT
(Rs Lakh)
Source: Central Statistical Organisation, Ministry of Programme Implementation & Statistics; IMaCS Analysis
Sector wise break-up of GSDP for 2010-11 indicates that construction, followed by agriculture is the
biggest contributor to Manipur‟s GSDP. Manufacturing plays a small role Manipur‟s economy. Its share
has increased from 4 per cent in 2004-05 to 5 per cent in 2010-11.

NSDC Skill Gap Study of the North East - Manipur
25
FIGURE 3: SECTOR-WISE DISTRIBUTION OF GROSS STATE DOMESTIC PRODUCT
Source: Central Statistical Organisation, Ministry of Programme Implementation & Statistics; IMaCS Analysis
Imphal (West and East) is the biggest contributor to Manipur‟s GSDP. Ukhrul, Tamenglong and Chandel,
have smallershare. Imphal, Thoubal and Bishnupur, together, contribute about 70 per cent to GSDP
FIGURE 4: DISTRICT DOMESTIC PRODUCT
(Rs Lakh)
Source: Statistical Abstract, Manipur, 2009; Directorate of Economics and Statistics, Government of Manipur,
2005-06

NSDC Skill Gap Study of the North East - Manipur
26
As of 2009-10, Manipur had a per capita income of Rs 29,684, which is lower than both the India average
of Rs54,835, and the North East Region (NER) average of Rs46,359. Imphal West has the highest per
capita income, followed by Bishnupur and Tamenglong. Senapati district has the lowest per capita
income, as compared to other districts of Manipur.
TABLE 2: COMPARISON OF MANIPUR‟S PER CAPITA INCOME WITH INDIA & NER
Source: Central Statistical Organisation, Ministry of Programme Implementation & Statistics; IMaCS Analysis
FIGURE 5: DISTRICT WISE PER CAPITA INCOME IN MANIPUR
(Rs)
Source: Statistical Abstract, Manipur, 2009; Directorate of Economics and Statistics, Government of Manipur,
2005-06; MOSPI

NSDC Skill Gap Study of the North East - Manipur
27
4.2 Industrial Activity Overview
During 2005-06, 867 factories were registered, employing 7,364 persons. About 92 per cent of them had
access to power. District wise data shows that maximum production was in the Imphal East district at Rs
291 lakh at an investment of Rs 40 lakh.
FIGURE 6: REGISTERED MANUFACTURING UNITS
Sources: Statistical Abstract Manipur, 2009; IMaCS Analysis
Over 90 per cent of units were in the tiny sector. There were about eight workers employed per registered
factory. Imphal and Thoubal districts accounted for over 88 per cent of the total production of
manufactured goods and 96 per cent of investment, by value.
TABLE 3: DISTRICT WISE PRODUCTION AND INVESTMENT
(2005-06)
SIDO-Small Industries Development Organisation; Sources: Statistical Abstract Manipur, 2009; IMaCS Analysis

NSDC Skill Gap Study of the North East - Manipur
28
As per the Fifth Economic Census, 2005, Manipur had over 96,000 enterprises, employing 221,567
persons. While 51 per cent of the employment is in Own Account Enterprises (OAE), the remaining 49
per cent is in establishments.
FIGURE 7: OAEs AND ESTABLISHMENTS IN MANIPUR
OAE: Own Account Enterprises; Source: Fifth Economic Census 2005
TABLE 4: SECTOR WISE DISTRIBUTION OF ENTERISES AND EMPLOYMENT IN
MANIPUR
Enterprises Employment
Major activity group OAE Estt. Total OAE Estt. Total
Mining & quarrying 345 38 383 506 322 828
Manufacturing 16,052 4,048 20,100 23,535 15,890 39,425
Electricity, gas & water supply 15 33 48 23 243 266
Construction 2,234 511 2,745 2,573 2,198 4,771
Sale, maint. & repair 799 907 1,706 1,242 3,343 4,585
Wholesale trade 232 114 346 322 364 686
Retail trade 39,991 5,002 44,993 54,366 13,647 68,013
Restaurants & hotels 4,787 1,394 6,181 8,439 4,691 13,130

NSDC Skill Gap Study of the North East - Manipur
29
Enterprises Employment
Major activity group OAE Estt. Total OAE Estt. Total
Transport & storage 3,581 775 4,356 3,888 2,008 5,896
Post & telecommunication 730 191 921 935 572 1,507
Financial intermediation 65 90 155 152 1,119 1,271
Real estate, banking & service 498 234 732 756 974 1,730
Public administration, defence
& social serv. 29 737 766 97 24,363 24,460
Education 735 3,676 4,411 1,122 27,815 28,937
Health & social work 190 477 667 439 4,599 5,038
Other community & personal
serv. 6,029 1,900 7929 14,487 6,537 21,024
Total non-agricultural
activities 76,312 20,127 96,439 112,882 108,685 221,567
OAE: Own Account Enterprises; Source: Fifth Economic Census 2005
Manufacturing and retail trade account for over 67 per cent of non-agricultural activities in Manipur and
employ over 48 per cent of total non-agricultural workforce.
TABLE 5: COOPERATIVE SOCIETIES
(2008-09)
Type of society No. Type of society No.
Apex 18 Housing 220
Milk supply 546 Farming 61
Marketing 20 Labour contract 309
Sugarcane 20* Poultry 211
Weavers 1,889 Piggery farming 160
Thrift and credit 87 Other industrial 2,491
Consumer 151 Other non-credit industrial 2,057

NSDC Skill Gap Study of the North East - Manipur
30
Self-help groups (SHG) play a vital role in providing training and revenue generation avenues for the
women folk, mostly, working from home in the cottage industry segment.
Non-government organisations play a vital role in providing training in other industries, particularly,
related to agriculture and horticulture. They also help raise awareness such as detrimental effect of jhum
cultivation and sensitise Government towards members‟ concerns. There are several NGOs in social
welfare and health sectors as well.
4.3 Demography and Employment Overview
As per Census 2011, majority of Manipur‟s population (19 per cent) is concentrated in the Imphal West
district, followed by 16.6per cent in Imphal East district. About 52 per cent of Manipur‟s population is
concentrated in the valley, which constitutes 10 per cent of total area covered by all districts. Literacy rate
has improved from 70 per cent in 2001 to about 80 per cent in 2011.
TABLE 6: DISTRICT DEMOGRAPHIC PROFILE OF MANIPUR
District
Area
share
District
type
Population
density
(per
sq.km)*
Rural to
Urban
population
Population
share*
Male to
Female
population*
Percentage
of tribal
population Towns
Inhabited
villages
Literacy
rate*
Senapati$ 14.7% Hill 109 100.0% 13.0% 1.07 43.3% 0 607 75.0%
Tamenglong 19.7% Hill 32 100.0% 5.1% 1.05 95.4% 0 171 70.4%
Churachandpur 20.5% Hill 59 100.0% 10.0% 1.03 93.2% 0 540 84.3%
Chandel 14.8% Hill 43 87.4% 5.3% 1.07 91.9% 1 350 70.8%
Ukhrul 20.4% Hill 40 100.0% 6.7% 1.06 95.5% 0 198 81.8%
Imphal East 3.2% Valley 638 72.6% 16.6% 0.99 6.3% 6 197 82.8%
Imphal West 2.3% Valley 992 44.5% 18.9% 0.97 4.8% 10 114 86.7%
Bishnupur 2.2% Valley 485 64.1% 8.8% 1.00 2.9% 7 48 76.4%
Thoubal 2.3% Valley 708 64.0% 15.5% 0.99 1.2% 9 90 76.7%
$Does not include three subdivisions
Source: Census 2001; Statistical Abstract Manipur, 2009; *Census 2011

NSDC Skill Gap Study of the North East - Manipur
31
Over 60 per cent of Manipur‟s population falls in the working age range of 15-59 years. Valley districts
of Bishnupur, Thoubal, Imphal West and Imphal East constitute 65 per cent of the total population in the
15-59 age group and 70 per cent over 60 years. Hill districts of Senapati, Tamenglong, Ukhrul and
Chandel account for 24 per cent of population in the 15-59 age group and 21 per cent of those over 60.
TABLE 7: POPULATION BY AGE-GROUPS
District/
Age group
0-14 15-59 60+ Others* Total 0-14 15-59 60+ Others*
Senapati# 53,475 94,407 8,417 214 156,513 34.2% 60.3% 0.1% 0.1%
Tamenglong 37,589 66,620 6,363 927 111,499 33.7% 59.7% 0.8% 0.8%
Churachandpur 75,455 137,973 14,002 475 227,905 33.1% 60.5% 0.2% 0.2%
Bishnupur 67,814 124,257 15,427 870 208,368 32.5% 59.6% 0.4% 0.4%
Thoubal 128,471 211,287 24,038 344 364,140 35.3% 58.0% 0.1% 0.1%
Imphal West 128,958 280,267 34,342 815 444,382 29.0% 63.1% 0.2% 0.2%
Imphal East 127,901 239,189 27,513 633 395,236 32.4% 60.5% 0.2% 0.2%
Ukhrul 49,314 82,321 8,960 183 140,778 35.0% 58.5% 0.1% 0.1%
Chandel 37,728 73,759 6,678 72 118,237 31.9% 62.4% 0.1% 0.1%
Manipur 706,705 1,310,080 145,740 4,533 2,167,058 32.6% 60.5% 0.2% 0.2%
Others-non-respondents
# Does not include three subdivisions
Census 2001
Source: Statistical Abstract Manipur, 2009
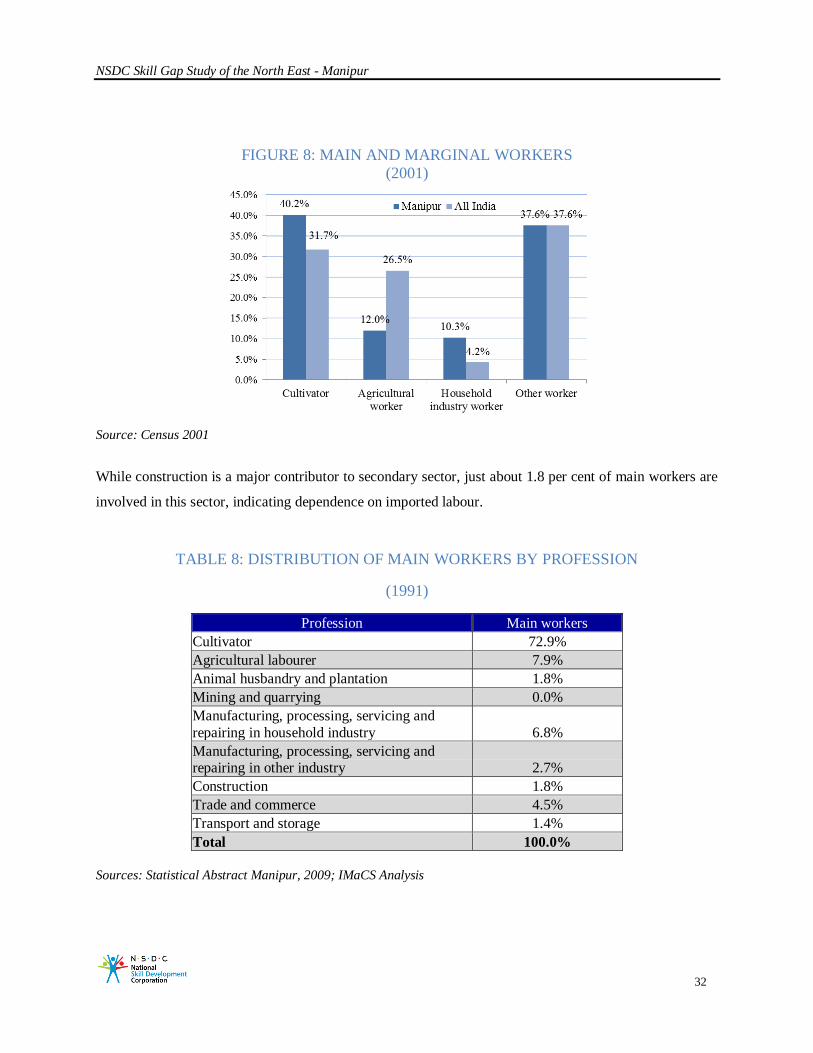
Over 52 per cent of main and marginal workers were engaged in cultivation or agricultural labour. About
10 per cent are household industry workers.
NSDC Skill Gap Study of the North East - Manipur
32
FIGURE 8: MAIN AND MARGINAL WORKERS
(2001)
Source: Census 2001
While construction is a major contributor to secondary sector, just about 1.8 per cent of main workers are
involved in this sector, indicating dependence on imported labour.
TABLE 8: DISTRIBUTION OF MAIN WORKERS BY PROFESSION
(1991)
Profession Main workers
Cultivator 72.9%
Agricultural labourer 7.9%
Animal husbandry and plantation 1.8%
Mining and quarrying 0.0%
Manufacturing, processing, servicing and
repairing in household industry 6.8%
Manufacturing, processing, servicing and repairing in other industry 2.7%
Construction 1.8%
Trade and commerce 4.5%
Transport and storage 1.4%
Total 100.0%
Sources: Statistical Abstract Manipur, 2009; IMaCS Analysis

NSDC Skill Gap Study of the North East - Manipur
33
4.4 Government Policy Support
The Draft Industrial and Investment Policy of Manipur, 2011, has identified key area that need to be
placed thrust upon.
FIGURE 9: THRUST AREAS IDENTIFIED UNDER DRAFT INDUSTRIAL AND
INVESTMENT POLICY, 2011

NSDC Skill Gap Study of the North East - Manipur
34
Under District-wise Industrial Development Plan, industrial estates are planned in all eight districts. In
addition, industrial parks, Gems and jewellery park and cold chains are also planned in various districts of
the State.
TABLE 9: DISTRICT WISE INDUSTRIAL DEVELOPMENT PLAN
Type of facilities Locations
Industrial estates All districts
Industrial parks Imphal West, Imphal East and Thoubal
Industrial locations (additional) Jiribam (Imphal East), Litan (Ukhrul), Noney
(Tamenglong), Nambol (Bishnupur), Churachandpur
and Thoubal, Senapati
Tourism infrastructure Tulihal airport (Imphal), Kakching (Thoubal),
Loktak Lake (Bishnupur)
Gems and jewellery park Imphal, Kakching (Thoubal)
Cold chains, warehousing, packing, refrigeration Several locations
Apparel park (silk focus) Appropriate locations
Border trade Moreh (Chandel), Jiribam (Imphal East)
Source: Draft Industrial and Investment Policy of Manipur, Department of Commerce and Industry, Government of
Manipur
4.5 Infrastructure Overview
Roads are the major transport infrastructure of Manipur. The airport is small and railways are practically
non-existent. Manipur has three National Highways connecting Imphal to Dimapur and border town of
Moreh, Jirighat and Mizoram. Government of India has entered into a trilateral agreement with Thailand
and Myanmar to construct a Trans-Asian Highway via Moreh.
The Tulihal Airport connects the state to Tripura, Nagaland and other states via Assam. There are plans
to expand the small airport to increase parking space. A new terminal building with cold storage facilities
is also on the anvil. The nearest railway stations are in Assam and Nagaland. A railway line is being
constructed to connect Assam with Imphal.

NSDC Skill Gap Study of the North East - Manipur
35
TABLE 10: ROAD LENGTH IN MANIPUR
Dist.- district; Source: Statistical Abstract Manipur 2009; IMaCS Research
Manipur has a central sector-owned 25.96 MW gas based plant, 45.91 MW state-owned diesel plant, 80.9
MW hydro plant (central sector) and 5.45 MW of renewable power. In 2010-11, the normal deficit in
Manipur was 11.1 per cent. About 86 per cent of inhabited villages had electric connection as of 2008-09.
While mobile telephony has expanded and almost all major players have networks there, the state suffers
from bandwidth constraints and terrain related network constraints.
FIGURE 10: TOTAL INSTALLED CAPACITY
(MW)
Sources: Central Electricity Authority

NSDC Skill Gap Study of the North East - Manipur
36
TABLE 11: TELECOM INFRASTRUCTURE
Telecom infrastructure (2009)
GSM cellular subscribers 5,519,150
Internet/broadband subscribers 99,432
Post offices 697
Telephone exchanges 54
Wireless subscribers 5,309,850
Wireline subscribers 326,372
Sources: Cellular Operators Association of India, Ministry of Communications & Information Technology, Telecom
Regulatory Authority of India
Manipur has a total of 4,089 schools. On average, there is one school per 100 children in 6-14 years age
group. In terms of higher and technical education, there are two universities, 62 general colleges, 68
professional colleges, one National Institute of Technology and seven Industrial Training Institutes (ITI).
In terms of health infrastructure, it had one doctor per 3,500 to 4,000 patients in 2008. Between 2000 and
2005, about 7,800 patients tested positive for HIV/AIDS, 78 per cent in the 21-40 age group and 8 per
cent in 0-10 year group.
TABLE 12: EDUCATION INFRASTRUCTURE
NSDC Skill Gap Study of the North East - Manipur
37
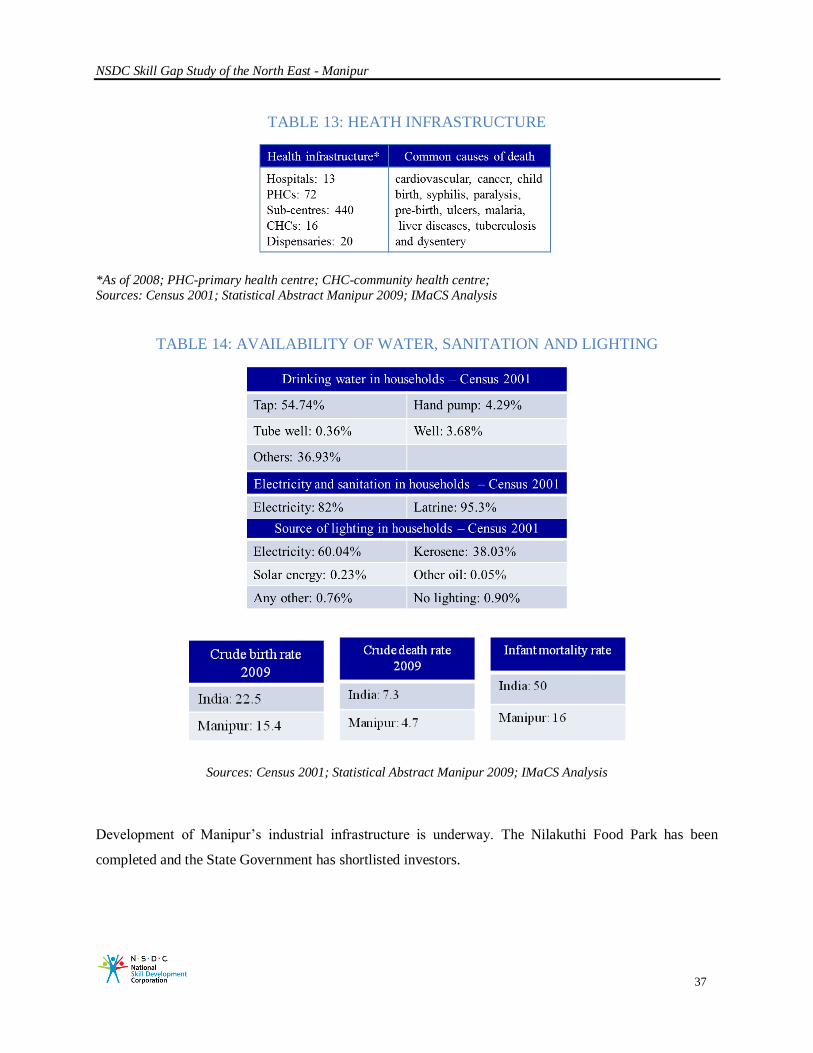
TABLE 13: HEATH INFRASTRUCTURE
*As of 2008; PHC-primary health centre; CHC-community health centre;
Sources: Census 2001; Statistical Abstract Manipur 2009; IMaCS Analysis
TABLE 14: AVAILABILITY OF WATER, SANITATION AND LIGHTING
Sources: Census 2001; Statistical Abstract Manipur 2009; IMaCS Analysis
Development of Manipur‟s industrial infrastructure is underway. The Nilakuthi Food Park has been
completed and the State Government has shortlisted investors.

NSDC Skill Gap Study of the North East - Manipur
38
TABLE 15: UPCOMING INDUSTRIAL INFRASTRUCTURE IN MANIPUR
Infrastructure Description
Nilakuthi food park Food park has been completed in 2011 on a land-area of about 31 acres.
The Manipur Food Industries Corporation Limited is the implementing
agency. The park has capacity to host 40 to 50 food processing units for
which common facilities have been provided.
Integrated infrastructural
development project (IID)
The Government of India has sanctioned the IID project at Moreh with a
total project cost of Rs 5.75 crore (GOI-Rs. 4 crore, State-Rs 0.75 crore,
SIDBI loan-Rs 1 crore). Land acquisition is under way.
Export promotion
industrial park (EPIP)
The Government of India has approved the EPIP project at
KhunutaChingjin in the Kakching sub-division of Thoubal district at a
project cost of Rs 15 crore (GOI-Rs 10 crores, State-Rs 5 crore). Land
acquisition is under way.
Trade centre The Government of India has sanctioned Rs 1 crore each for construction
of two trade centres, one at Moreh and another at Imphal. Construction of
the Moreh Trade Centre is complete and that of the Imphal Trade Centre at
Porompat, is ongoing.
Industrial growth centre
(IGC)
Government of India has approved IGC project at Lamlai-Napet at a cost of
Rs 30 crore. Land acquisition is under way.
4.6 Key Findings from the Diagnostic Analysis
Macro-economic:
At 5.8 per cent, Manipur‟s economy has grown at a lower rate than the North Eastern region (6.3 per
cent) and India‟s 8.6 per cent, between 2004-05 and 2011. Primary, secondary and tertiary sector
shares have remained almost constant with slight drop in share of secondary sector compensated by
an increase in tertiary sector. Tertiary sector growth was 7.4 per cent, driven by healthcare, education,
storage and communications.

NSDC Skill Gap Study of the North East - Manipur
39
Agriculture, construction, trade and hotels, public administration and other services (healthcare and
education) are key contributors to economy. State Government is significantly dependent on Central
Government grants and subsidies.
Valley districts (Imphal East and West, Bishnupur and Thoubal) contribute around 70 per cent to total
district domestic product. Manipur‟s average per capita income is around Rs 30,500 as compared to
Rs 48,300 in NE regions and Rs 62,000 in India.
Demographics and social indicators:
The state has a large rural population. Some hill districts have 100 per cent rural population. Valley is
densely populated with non-tribal population while hills are sparsely populated with predominantly
tribal population.
At about 80 per cent, overall literacy rate is higher than India average. There is a school for every 100
children in 6-14 age group. School drop-out rates are high, at 25-35 per cent. Higher education
infrastructure consists predominantly of general colleges (62), seven ITIs, two universities, a National
Institute of Technology, and an Institute of Plastics.
Health indicators such as birth rate, death rate and infant mortality rate also score higher than India
average.
Employment and employment generation sectors:
The total working age labour pool is 12-13 lakh. Agriculture employs around 5 lakh, non-agricultural
sector employs around 2.4 lakhs and State Government around 72,000. About 5 lakh unemployed or
marginal workers. Between 2011 and 2021, 12.5-13 lakh persons are expected to reach working age
population.
Non-agriculture sector is dominated by: a) small scale sector manufacturing, 95 per cent of which is
unregistered or informal (Rs 330 crores) b) retail trade.
Handloom and handicraft form a large part of Manipur‟s informal sector.
Government Policy:
The State Industrial Policy, released in 2000 had a few areas as thrust sectors. Out of those, some of
the areas like bamboo, handloom, handicraft, plantation fibre, and KVI have seen some growth since
then. These are sectors which have grown due to availability of natural resources and traditional skills
of the people.

NSDC Skill Gap Study of the North East - Manipur
40
Other sectors like electronics and IT, food and fruit processing, mines and minerals have seen
minimal growth due to lack of adequate infrastructure, lack of investment (both from within and from
outside the state) and lack of market linkage.
Tea, rubber and coffee have been started on an experimental basis.
Factor advantages and current disadvantages:
The State‟s advantages include: soil and climate suitable for horticulture, tourism (fruit festivals, wild
life, lake, tribal), educated labour force, equal participation of men and women in work force, air
travel connectivity, active international border with Myanmar (Moreh-Tamu).
Disadvantages include: security concerns, low entrepreneurial activity, traditional sector dependence
poor state of physical infrastructure (power, cold chains, road, rail) and slow pace of development,
poor creditworthiness making loans almost impossible to get, dependence on Government jobs and
lack of vocational training centres.
Jobs demand exceeds supply; theme to sustain in future. Skilling for employability outside state
imperative.
State Government Policy:
The Government has spelt out several sectors in the draft policy document. Implementation plan
necessary for focus sectors.
Skill development plan includes training programmes for youth within and outside the State.
Met with success in terms of training outside state in hospitality and beauty courses, with good
placement record.
NSDC Skill Gap Study of the North East - Manipur
41
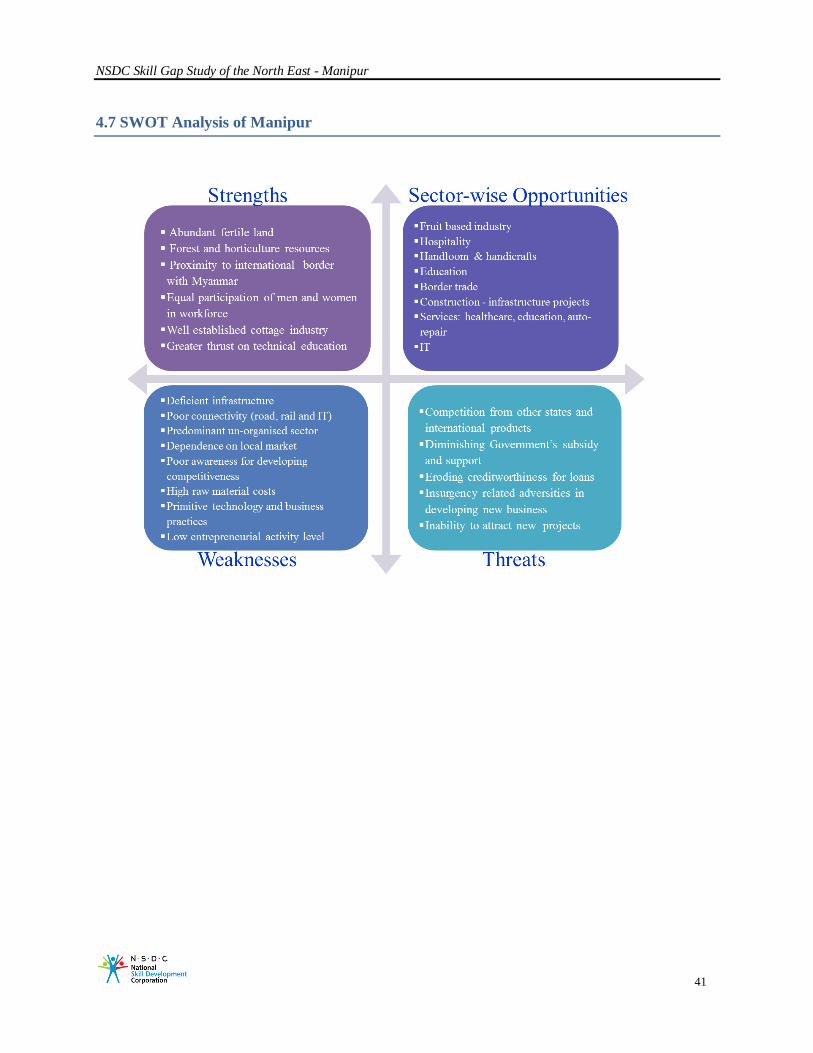
4.7 SWOT Analysis of Manipur

NSDC Skill Gap Study of the North East - Manipur
42
PART – II (b): Identification of growth sectors

NSDC Skill Gap Study of the North East - Manipur
43
5.1 Criteria for selecting growth sectors
Given below are the criteria we have adopted for selecting sectors with potential for employment
generation:
Resident skills that will continue to be a source of employment generation in next 10 years – skill
development required for enhancing competitiveness.
Sectors with policy support from Central and State Government for expansion, training and
marketing.
Product is unique to the region or occurs abundantly because of factor advantages, but has just started
to be exploited as an economic activity.
Infrastructure investment required to support industrial and economic growth; investment which has
started or is planned.
Common service trades such as electricians, plumbers and repair mechanics – those which require
service quality enhancement.
5.2 Framework for identifying growth engines

NSDC Skill Gap Study of the North East - Manipur
44
The framework mentioned above has been used to identify potential sectors where economic activities
will create employment between 2011 and 2021.The growth engines for a state‟s economy are driven by
the factor advantages within the state, market conditions, industry value chain available and Government
policy support. These factors lead to growth in economic output which in turn determines the annual
incremental employment opportunities within the state.
5.3 Identified sectors for livelihood and local demand sectors
Based on the framework mentioned above, sectors have been identified for skilling and upgrading skills.
These sectors are expected to provide employment opportunities in the coming 10 years. Sectors for
domestic demand have been identified based on factor endowments, policy thrust, market potential,
historical presence, availability of trained manpower, availability and quality of training centre, time
taken to train and employment opportunities.
TABLE 16: SHORTLISTED SECTORS
Sector
Market
Linkage
Historical
Presence
Infrastructure
Adequacy
Availability
and quality of
training centre
Time taken to
train*
Employment
opportunities**
Handloom & handicraft × √ √ × Medium High
Food Processing × × √ × Low Medium
Apiculture × √ √ × Low Low
Hotels √ × × × Medium Medium
IT/ITES × × × × High High
Horticulture × √ √ × High High
Construction - √ × × Low to Medium High
Border Trade - √ × × Medium High
Forest-based industry × √ - × Low Medium
Other services: Motor
Repair, Nursing, Beauty
Culture etc.
- × × ×
Low Low to Medium
*Low : Up to one year; Medium : One to two years; High: More than two years.
** Low: Employment potential of 0 to 500 persons; Medium: 500 to 1,000 persons; High: More than 1,000 persons. Source: IMaCS Analysis

NSDC Skill Gap Study of the North East - Manipur
45
5.4 Identified sectors for migration
Sectors for migration have been identified based on natural aptitude, youth aspiration, market potential,
availability of trained manpower, availability and quality of training centre and time taken to train.
TABLE 17: SHORTLISTED SECTORS
Sector Basic factor advantages
Potential for
jobs after
skilling
Advanced factor
advantages required
Industry value
chain required
Handloom & Handicraft
Traditional sector with well
developed skills and large
employment base
Within Manipur Transport, telecom,
IT
Lenders, distributors,
suppliers
Food Processing Growing horticulture sector Within Manipur
Cold chain, power,
transport, telecom Lenders
Apiculture Forest resource, flowers Within Manipur
Transport, packaging,
telecom Distributors
Hotels Tourism potential
Within &
outside Manipur
Transport, IT,
telecom Lenders, suppliers
IT/ITES Educational institutions
Outside
Manipur IT, telecom, power Lenders
Horticulture Soil & climate Within Manipur
Transport, IT,
telecom
Lenders, distributors,
suppliers
Construction Infrastructure projects Within Manipur - -
Border Trade
International border –
Moreh
Within &
outside Manipur
Transport, telecom,
IT -
Forest-based Industry Forest resource Within Manipur
Transport, telecom,
packaging, power Distributors
Other services: Motor
Repair, Nursing, Beauty
culture, etc.
Preference for services,
educational institutions
Within &
outside Manipur - Suppliers
Source: IMaCSSurvey and Analysis

NSDC Skill Gap Study of the North East - Manipur
46
5.5 Type of skilling required in identified sectors
Skilling requirements have been classified into speciality skills, new skills and skill up-gradation for each
of the sectors identified.
TABLE 18: SKILLING REQUIRED
Sectors Specialty skills New skills Skill up-gradation
Handloom
Handicrafts
Horticulture
Apiculture
Food processing
Tourism and hospitality
Traditional restaurants
IT/ITES
Healthcare
Construction
Beauty Culture
Border trade
Motor repair
Forest based products
Specialty skills: technical or specific knowledge base essential
New skills: training centres largely non-existent
Skill-up-gradation: out-dated techniques and knowledge base

NSDC Skill Gap Study of the North East - Manipur
47
5.6 Type of skilling required in sectors identified for migration
For migration related skills as well, skilling requirements have been classified into speciality skills, new
skills and skill up-gradation for the identified sectors.
TABLE 19: TYPE OF SKILLING REQUIRED FOR MIGRATION
Sectors Specialty skills New skills Skill up-gradation
Sectors for migration
Beauty
Hospitality and wellness
IT / ITES
Retail Services
Fashion Designing
Flight attendants
Ground staff at the airports
Healthcare
Language Skills
Specialty skills: technical or specific knowledge base essential
New skills: training centres largely non-existent
Skill-up-gradation: outdated techniques and knowledge base
Source: IMaCS Analysis

NSDC Skill Gap Study of the North East - Manipur
48
PART – II (c): District level Analysis of Manipur
NSDC Skill Gap Study of the North East - Manipur
49
6.1.Bishnupur
Bishnupur district is the smallest district in Manipur in terms of its area share at 2.2 per cent of the total. It
is a valley district with a population density of 420 persons per sq. km. It has derived its name from a
Vishnu Temple located at Lamangdong. The district is also known as the “land of dancing deers”. It is
home to the KeibulLamjao National Park, Loktak Lake and Loukoipat Ecological Park.
6.1.1 Economy
As of 2005-06, Bishnupur had a District Domestic Product of Rs 48,855 lakh. Its per capita income was
second highest in the State amongst all districts, at Rs 21,928.
6.1.2Demography
Bishnupur‟s share in Manipur‟s land area is 2.2 per cent. However, its share in State‟s population is high
at 8.8 per cent. The district has the highest population of 485 persons per sq. km. The population is mostly
rural at 64.1 per cent. Literacy rate is 76.4 per cent.
6.1.3Infrastructure
Infrastructure is under-developed and needs to be ramped up. Drinking water facilities are available in all
48 inhabited villages in the district. Electricity supply is, however, available in 46 villages.
TABLE 20: INFRASTRUCTURE FACILITIES IN BISHNUPUR
Facilities Number of villages
Drinking water facilities 48
Safe drinking water 41
Electricity - supply 46
Electricity - domestic 46
Electricity - agriculture -
Source: Census 2001, IMaCS Analysis
Education Infrastructure:
As of 2001 Census, primary schools are available in 47 of 48 inhabited villages in the district. Middle
schools are available in 38, secondary schools in 23 and colleges in none of the districts.
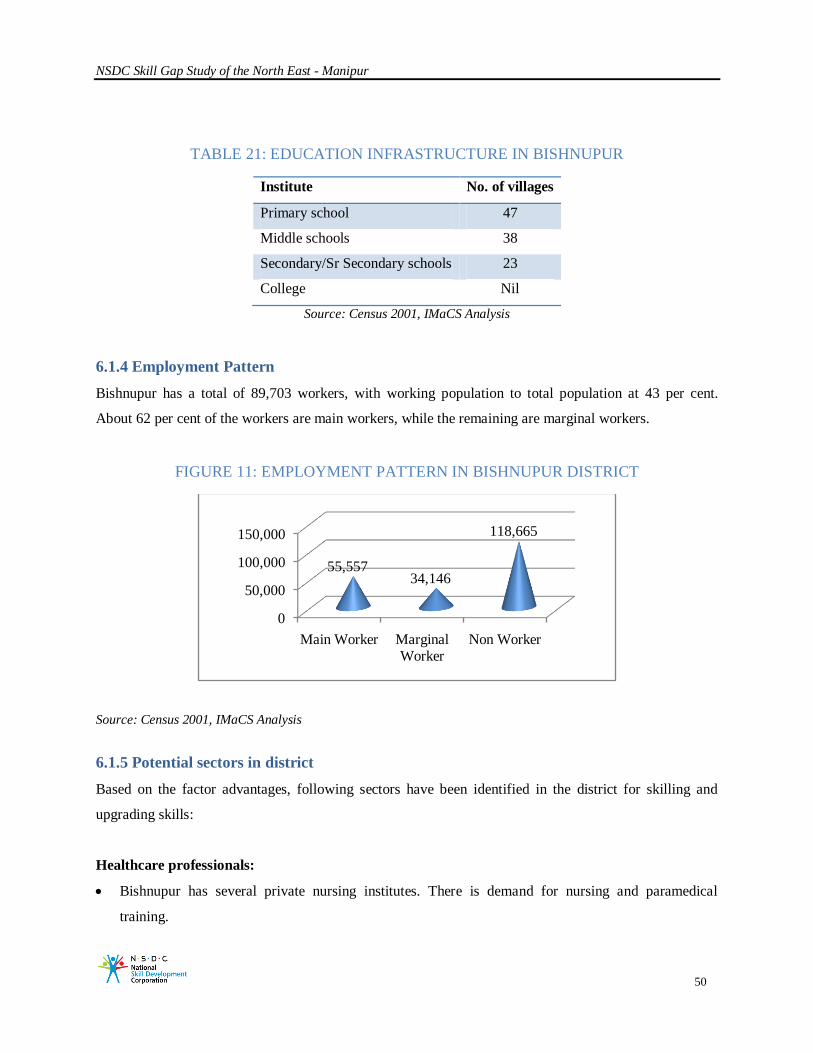
NSDC Skill Gap Study of the North East - Manipur
50
TABLE 21: EDUCATION INFRASTRUCTURE IN BISHNUPUR
Institute No. of villages
Primary school 47
Middle schools 38
Secondary/Sr Secondary schools 23
College Nil
Source: Census 2001, IMaCS Analysis
6.1.4 Employment Pattern
Bishnupur has a total of 89,703 workers, with working population to total population at 43 per cent.
About 62 per cent of the workers are main workers, while the remaining are marginal workers.
FIGURE 11: EMPLOYMENT PATTERN IN BISHNUPUR DISTRICT
Source: Census 2001, IMaCS Analysis
6.1.5 Potential sectors in district
Based on the factor advantages, following sectors have been identified in the district for skilling and
upgrading skills:
Healthcare professionals:
Bishnupur has several private nursing institutes. There is demand for nursing and paramedical
training.
0
50,000
100,000
150,000
Main Worker Marginal Worker
Non Worker
55,55734,146
118,665

NSDC Skill Gap Study of the North East - Manipur
51
The Directorate of Health Services, Manipur, has plans to set up seven nursing institutes in the
districts, one in Bishnupur. They are to be funded by the Ministry of Health, Government of India.
The plan has got delayed from the original Eleventh Plan target.
Fisheries:
Almost all agricultural households have fish ponds; In Bishnupur district alone, there are around
5,000 households in the Loktak Lake area who depend on fisheries for livelihood.
Demand exceeds supply; Fish imported from Kolkata; Grass and other carp, katla, rahoo, mirgan,
pengba, cat fish, ngapai, etc., are best suited for pisciculture in the state.
Outdated fish farming techniques, low investment, lack of funds, natural disasters like flood and
diseases are major impediments; There is no processing unit for fish in the state at present.
Handicraft:
Bishnupur district is well known for its embroidery work along with handloom weaving.
There is one artisan cluster in Bishnupur.
Forest based product:
Bishnupur has a well-developed carpentry industry.
Wood is procured from hill district of Tamenglong.
Furniture from wood is sold mainly locally, on order from the city folks and army.
Tourism circuit:
The Loktak Lake and Adjoining Wild Life Sanctuary provide a tourism circuit along with other
places in the state.
Being close to Imphal, the tourism circuit can be developed for day trips.
6.2 Chandel
The Chandel district (formerly known as Tengnoupal district) came into existence on May 13, 1974.It is
the border district of the State. Its neighbours are Myanmar on the south, Ukhrul district on the east,
Churachandpur district on the south and west, and Thoubal district on the north. It is about 64 km. away
from Imphal. The National Highway No. 39 passes through this district.

NSDC Skill Gap Study of the North East - Manipur
52
6.2.1 Economy
As of 2005-06, as compared to other districts, Chandel made the lowest contribution to Manipur‟s GSDP
at Rs 22,277 lakh. The district‟s per capita income during the same period was third lowest at Rs 16,261.
6.2.2Demography
Chandel‟s share in Manipur‟s land area is 14.8 per cent and its share in State‟s population is low at 5.3 per
cent. Population density in the district is third lowest as compared to other districts at just43. Majority of
the population is rural, at 87.4 per cent. Population is mostly tribal in nature at 91.9 per cent. Literacy
rate is at 70.8 per cent.
6.2.3Infrastructure
Drinking water facilities are available in 323 out of 350 inhabited villages in the district. Electricity
supply is, however, available in 190 villages.
TABLE 22: INFRASTRUCTURE FACILITIES IN CHANDEL
Facilities Number of villages
Drinking water facilities 323
Safe drinking water 125
Electricity - supply 190
Electricity - domestic 190
Electricity - agriculture -
Source: Census 2001, IMaCS Analysis
Education Infrastructure:
As of 2001 Census, primary schools are available in 214 of 350 inhabited villages in the district. Middle
schools are available in 50, secondary schools in 16 and colleges in two villages.

NSDC Skill Gap Study of the North East - Manipur
53
TABLE 23: EDUCATION INFRASTRUCTURE IN CHANDEL
Institute No. of villages
Primary school 214
Middle schools 50
Secondary/Sr Secondary schools 16
College 2
Source: Census 2001, IMaCS Analysis
6.2.4 Employment Pattern
Chandel district has a total of 54,545 workers, bringing the working population ratio as a percentage of
total population at 46 per cent. About 73 per cent of the workers are main workers, while the remaining
are marginal workers.
FIGURE 12: EMPLOYMENT PATTERN IN CHANDEL DISTRICT
Source: Census 2001, IMaCS Analysis
6.2.5 Potential sectors in district
Based on the factor advantages, following sectors have been identified in the district for skilling and
upgrading skills:
Border trade:
Manipur shares 398 km of international border with Myanmar. The Moreh-Tamu border in
Chandel district is most suited for cross-border trade.
It is also the most active border trade centre among the 13 locations identified by the Government
of India for integrated check posts.
0
20,000
40,000
60,000
80,000
Main Worker Marginal Worker
Non Worker
39,935
14,610
63,782

NSDC Skill Gap Study of the North East - Manipur
54
Trade has increased from Rs. 95.48 million in 2001-02 to Rs. 298.19 million in 2009-2010.
Land customs station exists and integrated check post is being developed.
Development of border trade has the potential to change the district‟s economy by generating
employment in support sectors such as boarding and lodging, transportation and logistics.
6.3 Churachandpur
Churachandpur district is the largest district in Manipur in terms of its area share at 20.5 per cent. In 2006,
the Ministry of Panchayati Raj named Churachandpur as one of the 250 most backward districts of India.
It is currently receiving funds from the Backward Regions Grant Fund Programme.
6.3.1 Economy
As of 2005-06, the district had a District Domestic Product at Rs 39,641 lakh. Its per capita income was
second lowest as compared to other districts at Rs 15,509.
6.3.2Demography
Churachandpur‟s share in Manipur‟s land area is 20.5 per cent and its share in State‟s population is at 10
per cent. Population density in the district is low at just 59. It is 100 per cent rural. Percentage of tribal
population to total population is high at 93.2 per cent. Literacy rate is 84.3 per cent.
6.3.3Infrastructure
Infrastructure in the district needs more development. Drinking water facilities are available in 539 out of
540 inhabited villages in the district. Electricity supply is, however, available in 306 villages.
TABLE 24: INFRASTRUCTURE FACILITIES IN CHURACHANDPUR
Facilities Number of villages
Drinking water facilities 539
Safe drinking water 161
Electricity - supply 306
Electricity - domestic 306
Electricity - agriculture -
Source: Census 2001, IMaCS Analysis

NSDC Skill Gap Study of the North East - Manipur
55
Education Infrastructure:
As of 2001 Census, primary schools are available in 295 out of 540 inhabited villages in the district.
Middle schools are available in 143, secondary schools in 48 and colleges in five villages.
TABLE 25: EDUCATION INFRASTRUCTURE IN CHURACHANDPUR
Institutes No. of villages
Primary school 395
Middle schools 143
Secondary/Sr Secondary schools 48
College 5
Source: Census 2001, IMaCS Analysis
6.3.4 Employment Pattern
Churachandpur district has a total of 99,363 workers, bringing the working population ratio as a
percentage of total population at 44 per cent. About 72 per cent of the workers are main workers, while
the remaining are marginal workers.
FIGURE 13: EMPLOYMENT PATTERN IN CHURACHANDPURDISTRICT
Source: Census 2001, IMaCS Analysis
6.3.5 Potential sectors in district
Based on the factor advantages, following sectors have been identified in the district for skilling and
upgrading skills:
0
50,000
100,000
150,000
Main Worker Marginal Worker
Non Worker
71,933
27,430
128,542

NSDC Skill Gap Study of the North East - Manipur
56
Handloom and Forest based products:
Churachandpur district is surrounded by forest, which provides local crafts persons with opportunities
to make products from dry flowers and wood.
The district is also well known for cane and bamboo products.
Apiculture is a livelihood opportunity in the district.
Tribal handloom is a traditional product, which the State Government is supporting by organising
them under self-help groups are imparting training and tools.
Horticulture:
The district is known for its pineapples. Annual pineapple festival is held in the district.
There is potential for development of cold storage and refrigerated transportation of pineapples for
processing in the State.
Healthcare and training:
There is demand for nursing and paramedical training.
The Directorate of Health Services, Manipur, has plans to set up seven nursing institutes in the
districts, one in Churachandpur. They are to be funded by the Ministry of Health, Government of
India. The plan has got delayed from the original Eleventh Plan target.
Tourism circuit:
The Khuga dam near Mata village is a beautiful artificial lake of North Eastern India. This along with
the Ngaloi falls and Loktak lake in Bishnupur can form a tourism circuit.
Being close to Imphal, it can be created a day trip centre with a combination of tribal culture,
handicrafts village and eco-tourism.
6.4 Imphal (West and East)
Imphal West and East districts were earlier one district. They were split into two districts in 1997.
Together, the two districts contribute to the maximum share of Manipur‟s population at 36.6 per cent.
Imphal city is the capital of Manipur and the main commercial hub for all economic activity.
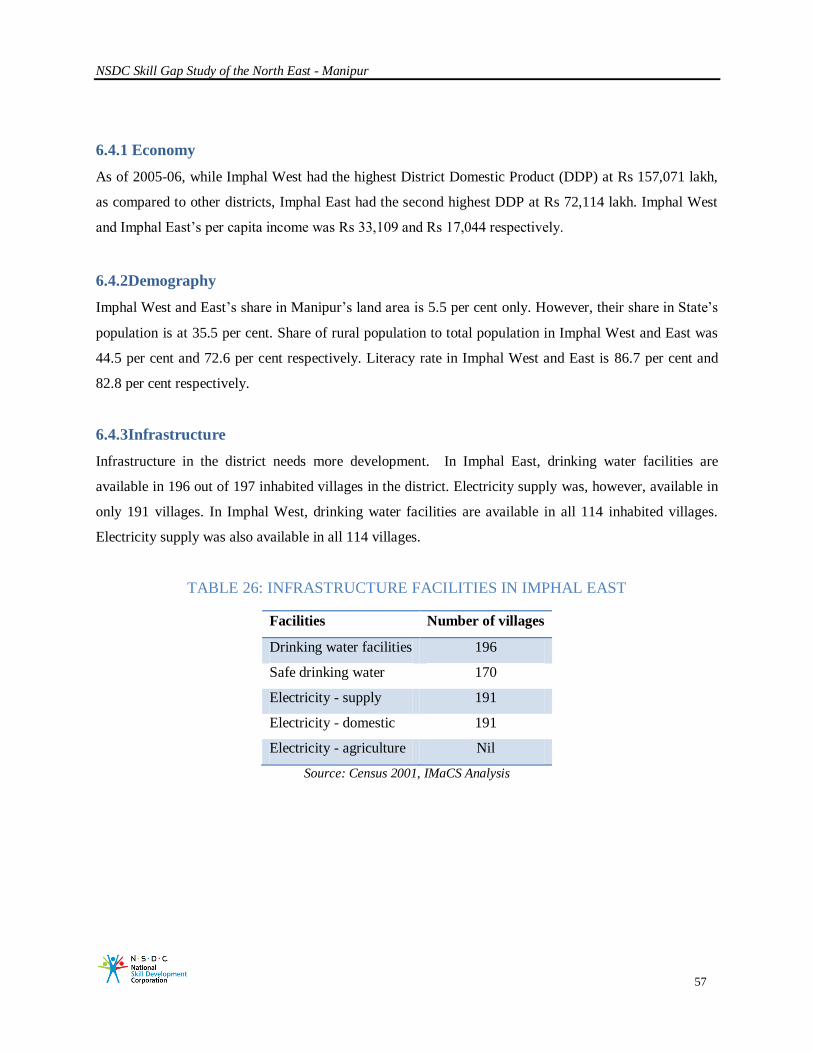
NSDC Skill Gap Study of the North East - Manipur
57
6.4.1 Economy
As of 2005-06, while Imphal West had the highest District Domestic Product (DDP) at Rs 157,071 lakh,
as compared to other districts, Imphal East had the second highest DDP at Rs 72,114 lakh. Imphal West
and Imphal East‟s per capita income was Rs 33,109 and Rs 17,044 respectively.
6.4.2Demography
Imphal West and East‟s share in Manipur‟s land area is 5.5 per cent only. However, their share in State‟s
population is at 35.5 per cent. Share of rural population to total population in Imphal West and East was
44.5 per cent and 72.6 per cent respectively. Literacy rate in Imphal West and East is 86.7 per cent and
82.8 per cent respectively.
6.4.3Infrastructure
Infrastructure in the district needs more development. In Imphal East, drinking water facilities are
available in 196 out of 197 inhabited villages in the district. Electricity supply was, however, available in
only 191 villages. In Imphal West, drinking water facilities are available in all 114 inhabited villages.
Electricity supply was also available in all 114 villages.
TABLE 26: INFRASTRUCTURE FACILITIES IN IMPHAL EAST
Facilities Number of villages
Drinking water facilities 196
Safe drinking water 170
Electricity - supply 191
Electricity - domestic 191
Electricity - agriculture Nil
Source: Census 2001, IMaCS Analysis

NSDC Skill Gap Study of the North East - Manipur
58
TABLE 27: INFRASTRUCTURE FACILITIES IN IMPHAL WEST
Facilities Number of villages
Drinking water facilities 114
Safe drinking water 104
Electricity - supply 114
Electricity - domestic 114
Electricity - agriculture Nil
Source: Census 2001, IMaCS Analysis
Education Infrastructure:
As of 2001 Census, in Imphal East, primary schools are available in 189 out of 197 inhabited villages in
the district. Middle schools are available in 100, secondary schools in 50 and colleges in six villages. In
Imphal West district, primary schools are available in 112 out of 114 inhabited villages in the district.
Middle schools are available in 74, secondary schools in 53 and colleges in five villages.
TABLE 28: EDUCATION INFRASTRUCTURE IN IMPHAL EAST
Institute No. of villages
Primary school 189
Middle schools 100
Secondary/Sr Secondary schools 50
College 6
Source: Census 2001, IMaCS Analysis
TABLE 29: EDUCATION INFRASTRUCTURE IN IMPHAL WEST
Institute No. of villages
Primary school 112
Middle schools 74
Secondary/Sr Secondary schools 53
College 5
Source: Census 2001, IMaCS Analysis

NSDC Skill Gap Study of the North East - Manipur
59
6.4.4 Employment Pattern
Imphal East has a total of 156,882 workers, bringing the working population ratio as a percentage of total
population at 40 per cent. About 68 per cent of the workers are main workers, while the remaining are
marginal workers. Imphal West has a total of 178,111 workers, bringing the working population ratio as a
percentage of total population at 40 per cent. About 72 per cent of the workers are main workers, while
the remaining are marginal workers.
FIGURE 14: EMPLOYMENT PATTERN IN IMPHALEAST DISTRICT
Source: Census 2001, IMaCS Analysis
FIGURE 15: EMPLOYMENT PATTERN IN IMPHAL WEST DISTRICT
6.4.5 Potential sectors in district
Based on the factor advantages, following sectors have been identified in the district for skilling and
upgrading skills:
0
50,000
100,000
150,000
200,000
250,000
Main Worker Marginal Worker
Non Worker
106,562
50,320
237,994
0
100,000
200,000
300,000
Main Worker Marginal Worker
Non Worker
129,101
49,010
266,271

NSDC Skill Gap Study of the North East - Manipur
60
Hotels:
Being the capital city, well connected by road and air, and located at the heart of a small State, it is
ideal for locating hotels with tourism circuits nearby.
However, as of now, there is only one 3-Star category hotel, located in Imphal. It is extremely popular
and three-four years old.
Insurgency news is a big deterrent to tourism.
Lifting off permit norm for foreigners may help increase foreign tourist inflow in coming years.
Some foreign arrivals started from Japan, Thailand, Europe, mainly for business trips.
Easing of land norms may also help.
Very few eateries or restaurants for middle-class in Imphal.
IT, Call Centre:
There are seven to eight active IT entrepreneurs, employing up to 75 persons.
They are mostly dependent on State Government or Central Government projects.
STPI infrastructure is helpful, but inadequate because of poor bandwidth.
Better trained persons seek jobs outside the State. Locally hired persons need retraining.
Sports trainers:
Manipur has produced many national and international award winning athletes (wrestling, boxing);
Football, Martial arts and Polo also popular.
Handloom and handicrafts:
Imphal had four major handloom clusters which include weaving, embroidery, mats, hand block
printing, appliqué work and carpets.
Woven silk products command a premium. They are sold outside State in Delhi, Bangalore and other
places.
Arts and crafts melas are also key selling markets.
Food processing:
The Nilakuthi food park offer opportunity for development of food processing.
Takyel and other local food processing units also have enough business to supply to local market.
While they would like to expand beyond local market, skills are required to scale up.

NSDC Skill Gap Study of the North East - Manipur
61
Construction:
Roads and railway projects are the main drivers of construction activity.
A long awaited hydro-electric project may generate opportunities for employment, when it comes up
for construction.
Auto mechanics:
Repairing done for two and four wheelers, and heavy vehicles. For heavy vehicles – two types of
units, i.e., body making and engine repairing are mostly located in Imphal. However, power shortage,
a major constraint.
There are around more than 300 units in Imphal with around 5-10 persons in each unit. Mechanics
(non-authorised dealer) are trained on the job and have no formal training
Large and medium size vehicles are sent to Guwahati or Dimapur.
6.5 Senapati
Senapati District is located in the northern part of Manipur. It is bounded on the east by Ukhrul District,
on the west by Tamenglong District, on the north by Phek District of Nagaland and on the south by
Imphal East District and Imphal West District. The District is at an altitude varying from 1061 m to 1788
m above sea level. Literacy rate in the district is very low at just 28.4 per cent.
6.5.1 Economy
As of 2005-06, the DDP of Senapati was Rs 48,567 lakh. It had the lowest per capita income as compared
to other districts at Rs 14,798.
6.5.2Demography
Senapati‟s share in Manipur‟s land area is 14.7 per cent. However, its share in State‟s population is at 13
per cent. Population density in the district is 109 persons per sq. km. It is 100 per cent rural.Literacy rate
is at 75 per cent.

NSDC Skill Gap Study of the North East - Manipur
62
6.5.3Infrastructure
Infrastructure in the district needs more development. Drinking water facilities are available in 487 out of
491 inhabited villages in the district. Electricity supply is, however, available in 432 villages.
TABLE 30: INFRASTRUCTURE FACILITIES IN SENAPATI
Facilities Number of villages
Drinking water facilities 487
Safe Drinking water 182
Electricity (Power Supply) 432
Electricity (domestic) 432
Electricity (Agriculture) Nil
Source: Census 2001, IMaCS Analysis
Excluding three sub-divisions.
Education Infrastructure:
As of 2001 Census, primary schools were available in 283 out of 491 inhabited villages in the district.
Middle schools were available in 73, secondary schools in 18 and colleges in two villages.
TABLE 31: EDUCATION INFRASTRUCTURE IN SENAPATI
Institute No. of villages
Primary school 283
Middle schools 73
Secondary/Sr Secondary schools 18
College 2
Source: Census 2001, IMaCS Analysis

NSDC Skill Gap Study of the North East - Manipur
63
6.5.4 Employment Pattern
Senapati has a total of 71,888 workers, bringing the working population ratio as a percentage of total
population at 46 per cent. About 69 per cent of the workers are main workers, while the remaining are
marginal workers.
FIGURE 16: EMPLOYMENT PATTERN IN SENAPATI DISTRICT
Source: Census 2001, IMaCS Analysis
6.5.5 Potential sectors in district
Based on the factor advantages, following sectors have been identified in the district for skilling and
upgrading skills:
Horticulture and Forest based activities:
Senapati district has 80 per cent forest. It could provide employment opportunities for tribal tourism,
dry flowers and wood products.
Apiculture is a livelihood activity in the district.
There is potential for growing orchids on the lower reaches of the hills in the district.
Construction:
Construction and upgrading the road infrastructure is a key activity planned for Senapati
district.
There is several construction works under the MNREGA.
0
50,000
100,000
Main Worker Marginal Worker
Non Worker
49,873
22,015
84,625

NSDC Skill Gap Study of the North East - Manipur
64
6.6 Tamenglong
Tamenglong is the least populous district in Manipur, with a total population share of 4.9 per cent. On the
other hand, its share in State‟s area is high at 19.7 per cent. Thus, the population density is also lowest at
25 persons per sq. km. This district is bounded by Nagaland state on the north, by Senapati district on the
north and east, by Churchandpur district on the south and by Imphal West district and Assam state on the
west. In 2006, the Ministry of Panchayati Raj named Tamenglong one of the country's 250 most
backward districts
6.6.1 Economy
As of 2005-06, the district had the second lowest DDP amongst all districts at Rs24,205 lakh. Its per
capita income was, however, third highest at Rs19,743.
6.6.2Demography
Tamenglong‟s share in Manipur‟s land area is19.7 per cent. However, its share in State‟s population is
only at 5.1 per cent. Thus, the population density in the district is low at just 32 persons per sq. km. This
is the lowest population density in Manipur. Rural population as a percentage of total population is at 100
per cent. Most of the population is tribal at 95.4 per cent of the total population. Literacy rate is 70.4per
cent.
6.6.3Infrastructure
Infrastructure in the district needs more development. Drinking water facilities are available in all 171
inhabited villages in the district. Electricity supply is, however, available in 75 villages.
TABLE 32: INFRASTRUCTURE FACILITIES IN TAMENGLONG
Facilities Number of villages
Drinking water facilities 171
Safe Drinking water 75
Electricity (Power Supply) 75
Electricity (domestic) 75
Electricity (Agriculture) Nil
Source: Census 2001, IMaCS Analysis

NSDC Skill Gap Study of the North East - Manipur
65
Education Infrastructure:
As of 2001 Census, primary schools were available in 157 out of 171 inhabited villages in the district.
Middle schools were available in 68, secondary schools in 15 and colleges in one village.
TABLE 33: EDUCATION INFRASTRUCTURE IN TAMENGLONG
Institute No. of villages
Primary school 157
Middle schools 68
Secondary/Sr Secondary schools 15
College 1
Source: Census 2001, IMaCS Analysis
6.6.4 Employment Pattern
Tamenglong has a total of 50,863workers, with a working population of 46 percent of total population at
46 per cent. About 85per cent of the workers are main workers, while the remaining are marginal
workers.
FIGURE 17: EMPLOYMENT PATTERN IN TAMENGLONG DISTRICT
Source: Census 2001, IMaCS Analysis
0
20,000
40,000
60,000
80,000
Main Worker Marginal Worker
Non Worker
43,353
7,510
60,636

NSDC Skill Gap Study of the North East - Manipur
66
6.6.5 Potential sectors in district
Based on the factor advantages, following sectors have been identified in the district for skilling and
upgrading skills:
Horticulture and floriculture:
Tamenglong is well known for oranges.
The district organizes annual orange festival.
Orchids are found abundantly in this district. They offer potential for growth through tissue culture
based plantation.
Construction:
The Public Works Department has several roads and bridges projects for the district.
The road linking Tamenglong to other districts is also being upgraded.
Forest based product:
Abundance of forests give rise to opportunities for developing forest based products sectors such as
dry flowers and wood craft.
6.7 Thoubal
Thoubal is a valley district. It is the second most populous district of Manipur in terms of its population
density at 708 persons per sq. km. (after Imphal West district). Its share in Manipur‟s land area is 2.3 per
cent, however, share in population is high at 15.9 per cent.
6.7.1 Economy
As of 2005-06, the district had the third highest DDP in Manipur at Rs70,052 lakh. Its per capita income
was Rs17,575.
6.7.2Demography
Thoubal has the lowest share in Manipur‟s land area at 2.3 per cent. Its share in State‟s population is,
however, high at 15.5 per cent. The population density in the district is 708 persons per sq.km. The

NSDC Skill Gap Study of the North East - Manipur
67
district is mostly rural, with rural population at 64 per cent of the total population. Literacy rate is 76.7 per
cent.
6.7.3Infrastructure
The district has a fairly developed system of road transport. All towns and important villages in the
district are connected either by the National or State or district or village roads. The National Highway
No. 39- Indo-Burma Road, passes through the heart of the district. Drinking water facilities are available
in all 90 inhabited villages in the district. Electricity supply is available in 84 villages.
TABLE 34: INFRASTRUCTURE FACILITIES IN THOUBAL
Facilities Number of villages
Drinking water facilities 90
Safe Drinking water 88
Electricity (Power Supply) 84
Electricity (domestic) 84
Electricity (Agriculture) Nil
Source: Census 2001, IMaCS Analysis
Education Infrastructure:
As of 2001 Census, primary schools were available in 88 out of 91 inhabited villages in the district.
Middle schools were available in 58, secondary schools in 35 and colleges in one village.
TABLE 35: EDUCATION INFRASTRUCTURE IN THOUBAL
Institute No. of villages
Primary school 88
Middle schools 58
Secondary/Sr Secondary schools 35
College 1
Source: Census 2001, IMaCS Analysis

NSDC Skill Gap Study of the North East - Manipur
68
6.7.4 Employment Pattern
Thoubal district has a total of 177,343 workers, bringing the working population ratio as a percentage of
total population at 49 per cent. About 63 per cent of the workers are main workers, while the remaining
are marginal workers.
FIGURE 18: EMPLOYMENT PATTERN IN THOUBAL DISTRICT
Source: Census 2001, IMaCS Analysis
6.7.5Potential sectors in district
Based on the factor advantages, following sectors have been identified in the district for skilling and
upgrading skills:
Horticulture:
Among the plantation crops, pineapples are the most important and are cultivated in the slopes of low
hills and hillocks.
Although tea plantation is yet to take its shape in the district, a blend of local variety is grown in
Pallel and Waikhong area.
Another important plantation crop is chillies.
Bamboos and plantain trees are common everywhere.
The soil and climatic conditions in the district support various types of fruit-bearing plants in the
districts. Important varieties are pineapple, pear, peach, jack fruit, banana, mango, lemon, plum,
guava, amla, etc.
0
50,000
100,000
150,000
200,000
Main Worker Marginal Worker
Non Worker
111,486
65,857
186,797

NSDC Skill Gap Study of the North East - Manipur
69
Handloom and Handicraft:
There are four handloom and handicrafts clusters in the district.
Kouna, or water reed is unique product of district, which is used for making bags, mats, boxes,
etc. It has both local and international demand.
Embroidery, pottery and cane products are also made in the district under self-help groups or
NGOs.
IT, Call Centre:
The district administration is keen to develop IT/ITeS sector.
6.8 Ukhrul
Ukhrul is one of the oldest districts of Manipur. It is situated 83 km from the State capital – Imphal. It is
the land of the colourful Tangkhuls. It is a hill district, with a second lowest population density in
Manipur at 31 persons per sq. km. (after Tamenglong district).
6.8.1 Economy
As of 2005-06, the district had a DDP of Rs29,266 lakh. Its per capita income was Rs18,653. The district
is primarily agrarian in nature.
6.8.2Demography
Ukhrul‟s share in Manipur‟s land area is 20.4 per cent. However, its share in State‟s population is at 6.7
per cent only. Thus, the population density in the district is low at just 40 persons per sq.km. The district
has 100 per cent rural population. It has the highest percentage of tribal population in the State at 95.5 per
cent of its total population. Literacy rate is 81.8 per cent.
6.8.3Infrastructure
Infrastructure in the district needs more development. Drinking water facilities are available in all the
198 inhabited villages in the district. Electricity supply is, however, available in 154 villages.

NSDC Skill Gap Study of the North East - Manipur
70
TABLE 36: INFRASTRUCTURE FACILITIES IN UKHRUL
Facilities Number of villages
Drinking water facilities 198
Safe Drinking water 110
Electricity (Power Supply) 154
Electricity (domestic) 154
Electricity (Agriculture) Nil
Source: Census 2001, IMaCS Analysis
Education Infrastructure:
As of 2001 Census, primary schools were available in 188 out of 198 inhabited villages in the district.
Middle schools were available in 79, secondary schools in 36 and colleges in one village.
TABLE 37: EDUCATION INFRASTRUCTURE IN UKHRUL
Institute No. of villages
Primary school 188
Middle schools 79
Secondary/Sr Secondary schools 36
College 1
Source: Census 2001, IMaCS Analysis
6.8.4 Employment Pattern
Ukhrul district has a total of 66,515 workers, bringing the working population ratio as a percentage of
total population at 47 per cent. About 78 per cent of the workers are main workers, while the remaining
are marginal workers.

NSDC Skill Gap Study of the North East - Manipur
71
FIGURE 19: EMPLOYMENT PATTERN IN UKHRULDISTRICT
Source: Census 2001, IMaCS Analysis
6.8.5 Potential sectors in district
Based on the factor advantages, following sectors have been identified in the district for skilling and
upgrading skills:
Handicraft and Arts:
Ukhrul is well known for its traditional Nungbi pottery.
Music and musical instruments are important in the Tangkhuls culture.
Sericulture is a traditional household activity.
Tourism:
Ukhrul has potential for development as a tourism destination.
Some of the district‟s attractions include Khayang Peak, Khangkhui Cave, Flower Garden,
Kachouphung Lake, Dilily Water Falls, and Saline Springs.
Being a mountainous region, the birds, animals, flowers and plants offer opportunities for
developing nature tourism and walking trails.
Construction:
Construction and upgrading the road infrastructure is a key activity planned for Ukhrul
district.
There is several construction work under the MNREGA.
0
20,000
40,000
60,000
80,000
Main Worker Marginal Worker
Non Worker
51,564
14,951
74,263

NSDC Skill Gap Study of the North East - Manipur
72
PART – II (d): Skill Gap Analysis

NSDC Skill Gap Study of the North East - Manipur
73
7.1Handloom and Handicraft
Wood craft
Manipur‟s wood craft is of superior quality; Can fetch Rs. 100-2,000 a piece; Flower vases, tribal
crafts; Sold locally or on bulk order.
Work mostly done with hand with basic cutting and chiselling hand tools; Work conditions are
poor. Master craftsmen of SHGs provide basic training; Productivity: 8-10 pieces per month per
craftsman.
Kouna, cane and bamboo
Kouna grown in paddy fields: once sown, 3-4 crops a year for 15 years; Cane grows as windings
on trees: one crop in 3-4 years; Needs forest cover to grow; Bamboo grows on lower hills.
Large scale plantations required for commercial exploitation of bamboo; Climate and soil
conditions well suited for growing.
Products: Bags, hats, floor mats, table mats, furniture, household items such as containers,
decorative pieces such as wall clocks; 50-60 pieces per month per person; Each SHG of 10-15
members; Women-centric.
Packaging and transportation of products a major concern.
Marketable products, new tools and techniques, quality work sheds and modern skills necessary
for better productivity and margins.
Flowers
There is an orchidarium just outside Imphal; Over 110 varieties of orchids can be found there;
Bloom season: March-May.
Not commercially exploited; Tissue culture facilities required to develop plantations; Policy
support and skills also necessary.
Dry flowers
Combination of forest based products used to make artificial flowers: peepal leaves, cones, sticks,
jute, sola from West Bengal, etc.

NSDC Skill Gap Study of the North East - Manipur
74
Manual collection of raw materials from forest by friends and family; Competitive quality and
remunerative; New products adopted to compete with international products that come through
the border.
Currently, only few SHGs are involved; Mostly self-trained; Transport of delicate flowers results
in giving up big orders from long distance; Flowers mainly sold in melas in other states.
Home food products and bee keeping
Traditional industry, but new entrepreneurial activity; Training required in food products
manufacturing process; Packaging obtained primarily from Guwahati; Women-centric home-
based procurement and sales; Product: pickles, cheweys; Raw material procured locally.
Apiculture techniques not well developed, although climate supports it.
FIGURE 20: BUSINESS PRACTICES IN MANIPUR‟S HANDLOOM & HANDICRAFTS
SECTOR
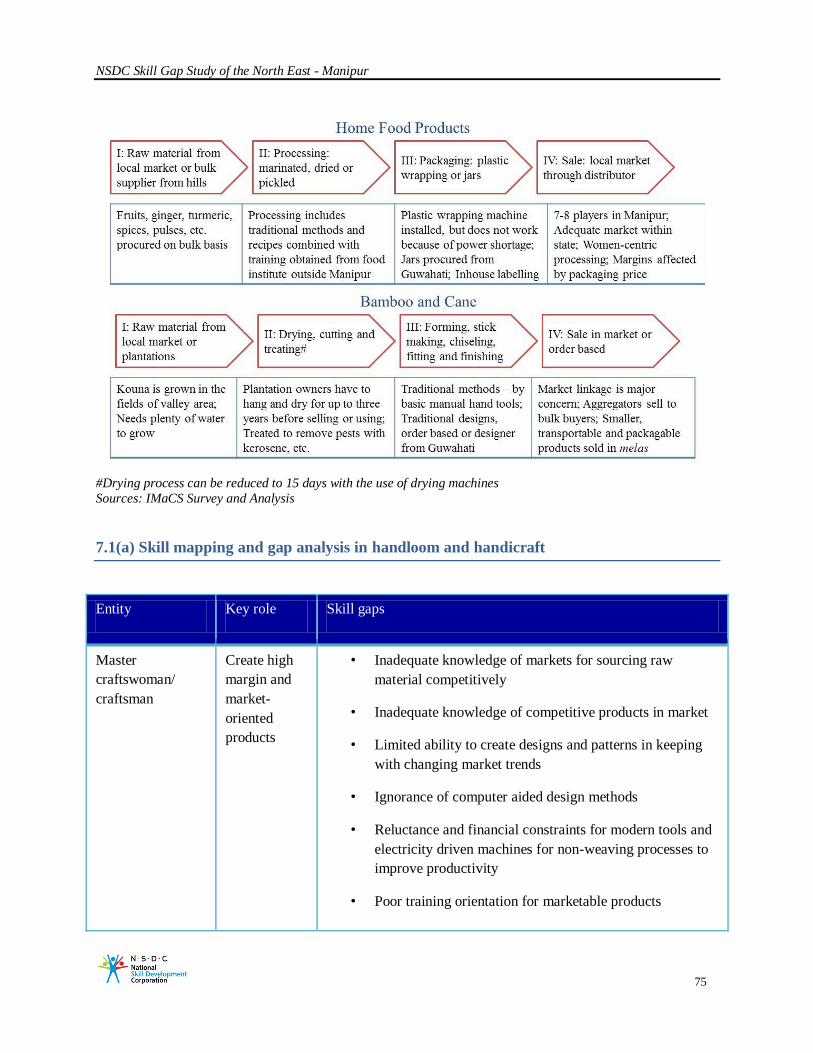
NSDC Skill Gap Study of the North East - Manipur
75
#Drying process can be reduced to 15 days with the use of drying machines
Sources: IMaCS Survey and Analysis
7.1(a) Skill mapping and gap analysis in handloom and handicraft
Entity Key role Skill gaps
Master
craftswoman/
craftsman
Create high
margin and
market-
oriented
products
• Inadequate knowledge of markets for sourcing raw
material competitively
• Inadequate knowledge of competitive products in market
• Limited ability to create designs and patterns in keeping
with changing market trends
• Ignorance of computer aided design methods
• Reluctance and financial constraints for modern tools and
electricity driven machines for non-weaving processes to
improve productivity
• Poor training orientation for marketable products

NSDC Skill Gap Study of the North East - Manipur
76
Entity Key role Skill gaps
Crafts person Quality and
wastage
awareness
• Scant knowledge of quality standards followed in market
• Limited ability to judge products requirements according
to market competition – market perception is regional not
global
• Ignorance of wastage reduction requirements
• Limited design innovation to cater to local market
requirements
• Limited use of tools and techniques to scale up business
and overcome periods on under-utilisation
Aggregator or
agent
Networking
for increasing
sales
• Poor market intelligence gathering techniques – limited to
regional market
• Inadequate entrepreneurial skills
Entity Expected competency
Master craftswoman/
craftsman
• Knowledge of markets for raw material procurement
• Knowledge of competitive products in market
• Ability to create designs and patterns in keeping with changing market
trends
• Adopting computer aided design methods
• Adopting modern tools and electricity driven machines for non-weaving
processes to improve productivity
• Imparting training that is market oriented and develops interest in
innovation
• Use of varies samples and visual aids in market-oriented training
Crafts person • Knowledge of quality standards (formal or informal) followed in
market, especially, related to environment (e.g., pest treatment materials

NSDC Skill Gap Study of the North East - Manipur
77
Entity Expected competency
for natural products)
• Ability to judge products requirements according to market competition
• Adoption of techniques to reduce wastage
• Keenness to innovate in design and use of new tools and techniques to
scale up business and overcome periods on under-utilisation
Aggregator or agent • Micro-finance skills
• Gathering market knowledge and collecting competitive samples
• Learning new process techniques, trade trends and market standards
• Assertive communication and negotiation skills
7.2Food and food processing
7.2(a) Food and food processing
Entity Key role Skill gaps
Entrepreneur/
SHG lead
executive
Creating market-
oriented products
at good profit
margins
• Inadequate training in food technology and new
processing methods
• Raw material procurement at competitive prices
• Food packaging techniques and use of tools
• Market expansion through bulk deals and quality
improvement
• Inability to scale up because of lack of bulk-training
tools and techniques
• Poor market intelligence outside state

NSDC Skill Gap Study of the North East - Manipur
78
Entity Key role Skill gaps
• Branding and visibility techniques
• Assertive communication and negotiation skills
Workers Quality standards
and scalability
• Awareness of new skills and technology for scalability
• Acceptance of new skills and techniques
• Awareness of quality standards for international
competitiveness
Distributor Market creation • Market distribution limited to markets within state
• Brand and value awareness creation
• Assertive communication and negotiation skills
Entity Expected competency
Entrepreneur/ SHG
lead executive
• Food technology specialist along with traditional knowledge of processing
and tastes (regional and outside)
• Ability to source raw material at competitive prices
• Financing skills
• Use of modern food packaging techniques and machines
• Ability to expand market beyond state through bulk deals with large entities
and innovative products of required quality standards
• Use of bulk-training tools and techniques of members for scaling up
• Developing market intelligence outside state
• Introducing branding and visibility techniques
• Developing assertive communication and negotiation skills

NSDC Skill Gap Study of the North East - Manipur
79
Entity Expected competency
Workers/ members • Interest in new skills and technology for scalability
• Awareness of quality standards for international competitiveness
Distributor • Gathering market intelligence in terms of competitive and new products
• Market expansion outside state
• Brand and value awareness creation among potential buyers
• Developing assertive communication and negotiation skills
The State Government has set up a Food Park in July 2011. Medium or large scale food processing units
do not exist as of now.
Climatic and soil conditions favour pineapple, lemon, orange, banana, chilly, ginger, passion
fruit, bamboo shoots, turmeric, pepper, tomatoes, etc.
There are about 15 small food processing units around Imphal, mostly organised under women‟s
self-help groups; Products are sold locally.
Food Park has common facilities for 55 entrepreneurs (in 1st phase) for processing fruits, spices,
fish, meat and poultry.
Common facilities include warehouse, cold storage, workshop, electricity, banking and post
facility, water supply and Connectivity Bridge to Nilakuthi (location of Food Park).
Proposal has been floated for a tetra pack unit under a scheme of Ministry of Commerce for
packaging and labelling facility.
Most fruits are produced in the hill districts; Lack of cold storage units and poor transportation
from hill to market – major reasons for wastage and low price realisations; Multiple-cropping
practised.
State Government still to attract entrepreneurs to Food Park; Four-five final applicants.
Small fruit processing self-help groups do not have packaging facility and selling capacity.
Seasonality and high cost of inputs for processing and packaging, make end product expensive.
Average payback period varies from one to 4 years depending on plant type; About 8 tonnes of
pineapples yield 1tonne of juice concentrate and 2 tonnes yield a tonne of juice.

NSDC Skill Gap Study of the North East - Manipur
80
Higher productivity and quality certification are necessary. Focus on large scale production of one or two
select products would improve salability.
The quality of the products is good. There are no test labs, at present, for quality certification of
products.
Both hired and persons from the family work on plantations. Proper farmer training required on
plantation, crop management, harvesting, and processing.
State Horticulture Department provides training to farmers in model seed villages; More training
needed to increase productivity.
The present intake in Central Agricultural University is 70 in B.Sc. and 5-10 in PG; Passed out
students go for further studies, some take up State Government job and some go overseas.
TABLE 38: DISTRICT WISE PLANTS GROWN
District-wise Plants Grown
Senapati Tuber crops such as potato and tapioca; Banana; All kinds of
vegetables; Shallots; Tree Beans; Gooseberry; Orchids;
Turmeric; Ginger; Bonsai and medicinal plants.
Tamenglong Orange; Bamboo shoot; Lemon; All kinds of vegetables;
Banana; Tree beans; Rubber; Tea; Gooseberry; Orchids;
Turmeric; Ginger; Bonsai plants.
Chandel Bamboo shoot; Banana; Tree beans; All kinds of vegetables;
Passion fruits; Turmeric, Ginger; Gooseberry; Medicinal plants.
Ukhrul Lemon; Banana; Tree beans; Gooseberry; Shallots; Tea
Churachandpur All kinds of vegetables; Banana; Tree beans; Rubber; Turmeric;
Ginger; Pineapple; Passion fruits; Gooseberry; Medicinal plants;
Bonsai Plants
Valley: Imphal,
Thoubal, Bishnupur
All kind of vegetables; Pineapple; Banana; Mango, Passion fruit
; Shallots; Tuber crops; Chinese Chive; Tree bean; Arecanut;
Water Melons; Ginger; Turmeric; Orchids; Bonsai and
medicinal plants.
Sources: IMaCS Survey and Analysis

NSDC Skill Gap Study of the North East - Manipur
81
Organic certification is a double edged sword. Primitive techniques and competition among North Eastern
states makes pricing important.
Fruits and vegetable are grown organically; While organic certification could help increase
prices, lack of market warrants that prices be maintained low.
Predominant use of manual or animal operated implements.
Local pineapple and orange growers hold annual fairs to increase quality awareness of the fruits;
Prices have increased; however, few long term buyers.
Almost every state in the North East grows similar fruits and vegetables because of similarity of
soil and climatic conditions; each state consumes its own, as of now.
Grades and tastes vary by state; each claims its fruit is the best quality and organic.
From planting to transport to market, costs increase to rates at which planter get little profit at
market price; Middlemen and bulk (processing) buyers demand lower prices.
TABLE 39: COMPARATIVE YIELD PER HECTARE AND SHARE AT ALL-INDIA LEVEL
Product Yield (Tonnes/Hectare) Manipur as percentage of all-India
Manipur All-India Area Production
Fruits 8.06 11.22 0.7% 0.5%
Vegetables 10.49 16.17 0.2% 0.1%
Spices 0.87 1.58 0.3% 0.2%
Sources: Directorate of Economics and Statistics, Ministry of Agriculture; IMaCS Survey and Analysis

NSDC Skill Gap Study of the North East - Manipur
82
7.2(b) Skill mapping and gap analysis in food and processing industry
Entity Key role Skill gaps
Plantation grower Producing fruits
and vegetables
• Knowledge of soil, weather, scientific cultivation
methods, irrigation techniques
• Cropping for income throughout the year
• Certifications and produce quality labelling
• Pre-cooling and warehousing techniques
• Market knowledge
• Optimum transportation knowledge
• Contract farming
Farm extension
workers
Plantation
maintenance and
production
• Knowledge of soil, weather, scientific cultivation
methods, plant protection, and irrigation techniques
• Acceptance of new skills and techniques
• Awareness of quality standards for competitiveness
Food processing
entrepreneur
Producing and
selling processed
foods
• Food technology and processing methods
• Preservation, packaging and storage
• Alternative products
• Market distribution, trade and pricing
• Brand and value awareness creation
• Assertive communication and negotiation skills

NSDC Skill Gap Study of the North East - Manipur
83
Entity Key role Skill gaps
Warehousing and
Cold-chain
operators and
managers
Preserving quality
of food in storage
and transit
• Types of warehousing for each product and at transit
points
• Essentials of cold chain infrastructure maintenance for
produce from farm to buyer
• Types of refrigeration/cold storage at different stages
• Quality standards
Transporter or
aggregator
Reaching food
from farm to
processor or buyer
• Awareness of new forms of food transport
• Quality standards for foods
• Modes of transport for different markets
Entity Expected competency
Plantation grower
and farm worker
• Scientific methods for soil testing, seeds, planting (including high
density planting), spacing, nutrition, irrigation methods for different
seasons, nutrition, weeding, mulching, use of approved chemicals, plant
protection and disease management techniques, post-harvest grading,
storage (including pre-cooling) and packing
• Multi-crop and multi-farm work (under MNREGA) for income through
the year; Contract farming requirements
• Certifications and produce quality labelling for branding and exports
• Market pricing and demand supply assessment for year‟s crop
• Knowledge of refrigerated transportation, product mixing, temperature
and humidity control at farm warehouse for maintaining product quality.
• Computer skills
Food processing
entrepreneur
• Food technology and processing technology
• Use of machinery and cold chain management knowledge

NSDC Skill Gap Study of the North East - Manipur
84
Entity Expected competency
• Preservation, packaging and storage techniques for quality assurance
• Alternative products such as fruit-based cosmetics, fibre from pineapple
• Market development, import/export markets/requirements and pricing
skills
• Brand and value awareness creation
• Assertive communication and negotiation skills
Entity Expected competency
Warehousing and
Cold-chain operators
and managers
• Storage at farm level, transport, cold storage near processing plant or at
railway/airport
• Refrigeration and control of temperature, humidity, air flow, etc.
• Separation of products to avoid inter-product smells
• Appreciation of quality standards required at consumer‟s end
• Waste reduction and management
• Margins and pricing knowledge
Transporter or
aggregator
• Refrigeration, and control of stacking, temperature, humidity, air flow,
etc.
• Separation of products to avoid inter-product smells
• Appreciation of quality standards required at consumer‟s end
• Margins and pricing knowledge
• Waste reduction and management

NSDC Skill Gap Study of the North East - Manipur
85
7.3Hotels
There is only one 3-Star category hotel, located in Imphal; extremely popular; Three-four years
old.
Insurgency news is a big deterrent to tourism.
Lifting off permit norm for foreigners may help increase foreign tourist inflow in coming years;
some foreign arrivals started from Japan, Thailand, Europe: mainly business trips.
Easing of land norms may also help.
Very few eateries or restaurants for middle-class.
Transportation costs are high.
Several picturesque, but undeveloped spots in state.
State Government and local hotelier send residents outside Manipur for skill development in
hospitality.
Airport at Imphal has improved tourist inflows; Rail connectivity being developed.
TABLE 40: WELL-KNOWN TOURIST SPOTS IN MANIPUR
Well-known tourist spots
Loktak
lake
Sendra
Island
ShriGovindaji
temple
Khwairamband
Bazar (IMA market)
Langthabal
Kaina
Keibul Lam
National Park
Moirang
Potential for tourism development
Handloom and handicraft exhibition centres with live artisans/trainers and sales
Pineapple (Imphal and Churachandpur) and orange (Tamenglong) festivals
Eco and forest tourism in the hill districts and forests; Health tourism
Imphal Orchidarium (owned by the State Forest Department)
Sports tourism / museums (Manipur has produced several renowned national-level sports
persons)
Ukhrul as hill station and tribal tourism destination

NSDC Skill Gap Study of the North East - Manipur
86
Eateries and restaurants in Imphal
Border tourism (Moreh-Myanmar border)
TABLE 41: TOURIST ARRIVALS IN MANIPUR
Year Tourist spots Foreign tourists Domestic tourists Total
1990-91 29 185 90,685 90,870
1991-92 29 374 91,290 91,664
1992-93 29 221 62,374 62,595
1993-94 29 350 72,980 73,330
1994-95 29 370 82,798 83,168
1995-96 29 288 84,025 84,313
1996-97 29 219 87,074 87,293
1997-98 31 173 91,620 91,793
1998-99 31 294 89,664 89,958
1999-00 29 335 99,399 99,734
2000-01 29 409 103,854 104,263
2001-02 41 131 73,842 73,973
2002-03 41 227 89,829 90,056
2003-04 41 296 93,430 93,726
2004-05 41 248 97,054 97,302
2005-06 41 348 93,331 93,679
2006-07 42 263 120,572 120,835
2007-08 54 460 101,000 101,460
17-year CAGR 4% 6% 1% 1%
Sources: Economic Survey Manipur, 2008-09; IMaCS Survey and Analysis
7.3(a) Skill mapping and gap analysis in tourism and hospitality

NSDC Skill Gap Study of the North East - Manipur
87
Activity Entity Skill gaps and expected competencies
Tourism Tour operators,
logistics operators
and activity
trainers
• Package tour offering and management
• Travel, ticketing and transport arrangement
• Vehicle upkeep
• Understanding IATA guidelines
• Advertising and branding along with other channel
partners at airports, key market places, online and on
television
• Event management – outdoor and indoor
• Training related to musicians, fitness, adventure
sports, forest trails, running arts and crafts centre for
tourists, etc.
• Security and well being of tourists
• Customer relationship skills
• Computer and multiple language skills
Hospitality:
hotels and
restaurants
Catering,
housekeeping and
management
• Chefs and restaurant managers
• Hotel management skills
• Quality assurance awareness
• Knowledge of disaster management
• Multi-lingual and culturally sensitive
• Ability to follow set standards
• Ease of transaction management (debit/credit card,
etc.)
• Computer skills
• Professionalism and etiquette

NSDC Skill Gap Study of the North East - Manipur
88
7.4IT and Software
There are seven to eight active IT entrepreneurs in Manipur; Revenue varies from Rs. 50-60 lakh to
Rs. 4-5 crore per annum.
Employment is up to 75 persons; Senior persons involved in design and architecture and fresh recruits
in coding; Employees leave for lower paying government jobs when opportunity arises.
Mostly dependent on State Government or Central Government projects; typically, project duration
varies from 6 months to a year, depending on complexity of work; AMCs also.
STPI infrastructure is helpful, but inadequate; Poor bandwidth, speed of 2mbps.
BSNL is the only ISP company option; Private providers are either expensive or of poor quality.
Better money in Government projects; Exports market competitive; There is low-cost benefit, but
middlemen and poor standing among big market players makes it difficult to bag business.
Better trained persons seek jobs outside state; Locally hired persons need retraining (bio-metrics,
software development, networking, etc.); NIT, NIIT, Aptech are the major suppliers of trained IT
persons; Fresh recruits paid Rs. 8,000-9,000; Experienced Rs. 20,000-25,000.
There are six IT training centres of Government and around 25 private centres in Manipur, mostly
located in Imphal; 110 annual intake in DOEACC and 99 per cent pass out.
Poor law and order a major concern in expanding business, getting bank credit and attracting
investments from outside state.
7.4(a) Skill mapping and gap analysis in IT and Software
Entity Skill gap Expected competency

NSDC Skill Gap Study of the North East - Manipur
89
IT entrepreneur Competitiveness outside
Manipur
Employee retention
Dependence on
Government contracts
Ability to establish tie-ups,
business contacts outside state
Ability to develop long-term job
security through provident fund,
pension, etc.
Ability to develop new business
areas based on local
competencies in, say, arts
Call centre employee Inadequate level of
language skills
Personality development,
confidence and telesales
skills
Improved spoken and written
English
Multi-lingual communication
Assertiveness and sales skills
Personality development
IT education and
trainer
Focus on traditional
courses
Institutions lack industry-
linked faculty
Web technology for animation,
mathematics and programming
for gaming, „midi‟ for music, etc.
Introduction of new technology

NSDC Skill Gap Study of the North East - Manipur
90
7.5Fisheries
Fish produced within State is inadequate for meeting consumption demand. Estimated shortage is 47 per
cent.
About 98 per cent of fish in valley and 75 per cent in hills is consumed in fresh form; Rest are sun
dried and smoked.
Almost all agricultural households have fish ponds; In Bishnupur district alone, there are around
5,000 households in the Loktak Lake area who depend on fisheries for livelihood.
Demand exceeds supply; Fish imported from Kolkata; Grass and other carp, katla, rahoo, mirgan,
pengba, cat fish, ngapai, etc., are best suited for pisciculture in the state.
Outdated fish farming techniques, low investment, lack of funds, natural disasters like flood and
diseases are major impediments; there is no processing unit for fish in the state at present.
TABLE 42: MANIPUR - FISHERY
As of 2007-08
District
No. of
fishery
division
No. of fish
farms
Total fish
production
(Tonnes)
Fresh fish
sales
(Tonnes)
Estimated
demand
(Tonnes)
Senapati 2 1 478 359 1,250
Tamenglong 2 2 467 351 1,250
Churachandpur 2 2 586 440 2,000
Chandel 2 2 387 291 1,250
Ukhrul 2 1 486 365 1,750
Imphal East 2 3 986 937 3,250
Imphal West 4 2 3,824 3,633 9,750
Bishnupur 2 3 5,809 5,693 3,750
Thoubal 2 2 5,629 5,517 3,250
Manipur 20 18 18,652 17,586 27,500
Sources: Statistical Abstract Manipur, 2009; IMaCS Survey and Analysis

NSDC Skill Gap Study of the North East - Manipur
91
7.5(a) Skill mapping and gap analysis in fishery
Entity Skill gap Expected competency
Entrepreneur
(processing)
Fish processing technology
Ice factory linkage
Knowledge of maintaining
freshness
Preserving,
canning/packaging and
labelling
Sales and marketing
Ability to establish fish
processing unit with
technology and new processing
techniques
Ability to develop market
inside and outside state (tastes,
trade, etc.)
Storage and transport
capabilities
Fish farmer Inadequate knowledge of
modern methods
Pondage knowledge
Use of modern fish farming
techniques: breeding, feeding,
disease protection, etc.
Rearing of appropriate fish-mix
for greater yield
Preserving and storage
techniques

NSDC Skill Gap Study of the North East - Manipur
92
7.6 Construction
Potential and existing construction activity in Manipur pertains to development of railway line, roads and
proposed power projects.
NHPC, State PWD, Railway Board are the key stakeholders in Manipur‟s infrastructure
development.
Road projects range from small connecting roads to hamlets in the hills (under PMGSY or
MNREGA) to highway improvement; Building projects have been outsourced (to Simplex);
Water supply under PHED.
PWD employees are mostly from the state; there are around 1,500 casual labourers; Inadequate
skills – reason why big projects are outsourced to outside construction companies; Short-term
training conducted by NITHE, NOIDA, for highway construction.
Delays in many projects are mainly because of poor law and order situation, frequent road
blockades on links where raw materials are brought through, and extortion.
The rail link up to Tupul is to be completed by 2014 and the extension to from Imphal by 2016;
Railways has its own training set up.
NHPC has staff strength of 541 in Manipur; 60 per cent are from Manipur; Training provided in
their own training sessions.
Stone crushing of stones from river-beds is an allied industry; Requires little training, mostly for
machine operations.
7.6(a) Skill mapping and gap analysis in construction
Entity Skill gap Expected competency
Construction labourer Basic skills
lacking
Masonry and civil works
Carpentry
Machine operation
Electric works
Welding
Street furniture, fixtures and signage
Knowledge of road erosion, sediment

NSDC Skill Gap Study of the North East - Manipur
93
Entity Skill gap Expected competency
control, drainage, jointing, sloping,
materials and optimum mixes, excavation,
rock management, grading, compacting,
road maintenance, pavements, joint
sealing, barriers and safety, etc.
7.7 Border Trade
Manipur shares 398 km of international border with Myanmar; Moreh-Tamu border point is most
suited for cross-border trade.
It is also the most active border trade centre among the 13 locations identified by the Government
of India for integrated check posts.
Trade has increased from Rs. 95.48 million in 2001-02 to Rs. 298.19 million in 2009-2010.
Land customs station exists; Integrated check post is being developed.
TABLE 43: FACILITIES AT INTEGRATED CHECK POST
Facilities at Integrated Check Post
Immigration department Bank counter
Police and women constables Animal and plant quarantine
Land customs department Quality certification & food testing agency
Customs preventive department Trade facilitation counter
Forests department Truck parking
Narcotics & drug control department Staff quarters
Postal department & telecom Rest house

NSDC Skill Gap Study of the North East - Manipur
94
7.7(a) Skill mapping and gap analysis in border trade
Entity Skill gap Expected competency
Traders Banking norms
Taxes and duties
Trade and
transactions
Letter of credit with bank
Knowledge of taxation and duties on
traded goods for both sides
Exchange rate implications
Import-export procedures
Import-export documentation
Categorisation of traded goods and
declarations, etc.
Precedence clause – whether
imports/exports from India precede in
exchange mechanism
Knowledge of Foreign Trade Agreements
7.7 Other potential sectors
Healthcare professionals
Manipur has two medical colleges; RIMS: teaching staff – 257; PG students – 150; Interns – 65-70
Most medical doctors practice within state; some go to other states or overseas; For major surgeries,
patients are referred to hospitals in Guwahati, Kolkata, Delhi, etc.; Lack of modern equipment, a
major impediment.
There are three major nursing colleges; Directorate of Health Services, Manipur, has plans to set up
seven nursing institutes in the districts; To be funded by Ministry of Health, Government of India;
Delayed from Eleventh Plan Target

NSDC Skill Gap Study of the North East - Manipur
95
Automobile mechanics
Repairing done for two and four wheelers, and heavy vehicles. For heavy vehicles – two types of
units, i.e., body making and engine repairing; Mostly located in Imphal; Power shortage, a major
constraint.
There are around more than 300 units in Imphal; About 5-10 persons in each unit; Mechanics (non-
authorised dealer) are trained on the job; No formal training
Large and medium size vehicles are sent to Guwahati or Dimapur; Trends reversing.
Sports trainer
Manipur has produced many national and international award winning athletes (wrestling, boxing);
Football, Martial arts and Polo also popular.

NSDC Skill Gap Study of the North East - Manipur
96
PART – II (e): Forecasting of Human Resource Requirement

NSDC Skill Gap Study of the North East - Manipur
97
8.1 Human resource forecasting model
IMaCS has developed a model for estimating human resources requirement for the state based on growth
of potential industries at district level. The model is depicted diagrammatically as follows:
FIGURE 21: HUMAN RESOURCES FORECASTING MODEL
Source: IMaCS Analysis

NSDC Skill Gap Study of the North East - Manipur
98
8.2 Incremental demand in Manipur
According to our estimates, Manipur will have an incremental demand of around 2.30 lakh persons
between 2011 and 2021. Most of this will come from handicrafts, followed by horticulture and handloom.
In addition, an extra demand of about 7 per cent may be created as the people in the age-groups of 50 to
60 years retire in the next 10 years.
FIGURE 22: HUMAN RESOURCES REQUIREMENT IN MANIPUR
Source: IMaCS Analysis

NSDC Skill Gap Study of the North East - Manipur
99
The demand is expected to fall short of supply, leaving an excess supply of human resources of 8.18 lakh.
The IMaCS skill pyramid analysis indicates that while there will be excess supply at the top two tiers of
the pyramids, there will be a small excess demand at the bottom two tiers of the pyramid.
FIGURE 23: DEMAND AND SUPPLY OF HUMAN RESOURCES IN MANIPUR
Specialised skills include: master weavers, food technologist, PhDs, Designers, etc.
Source: IMaCS Analysis
8.3 District-wise human resource requirement in Manipur – 2011-21
We have estimated incremental human resources requirement at district level for all the sectors. From
that, we can see that maximum demand between 2011 and 2021 is expected to come from Thoubal
district, followed by Imphal (East and West together).

NSDC Skill Gap Study of the North East - Manipur
100
TABLE 44: MANIPUR‟s DISTRICT WISE INCREMENTAL HUMAN RESOURCES REQUIREMENT: 2011-2021
Districts /
sectors
Human Resource Requirement in 2011 and 2021
Hand
loom
Handi
crafts
Horti
culture
Food
processin
g Hotels IT /ITES
Health
care
Educatio
n
Motor
Repair
Border
trade
Beauty
Culture
Construc
tion
Forest
based
industry Total
Bishnupur 2,622 27,957 3,559 - - 150 689 401 90 - 33 - 1,579 37,081
Chandel 670 - - - - - - 233 90 10,292 - - - 11,284
Churachand
pur 1,942 1,864 8,897 - 70 - - 440 90 - - - 32 13,334
Imphal West
4,537
18,638 - 2,063 46 1,134 1,378 809 2,355 - 167
8,407
-
62,999 Imphal East 18,638 - - 70 1,134 1,378 763 1,448 - 33 -
Senapati 2,186 - 3,559 - - - - 589 90 - - 1,495 - 7,919
Tamenglong 1,758 - 8,897 - 31 - - 239 90 - - 1,121 - 12,136
Thoubal 1,869 79,212 4,449 - - 150 689 556 90 - 33 - - 87,049
Ukhrul 1,197 - - - - - - 356 90 - - - - 1,644
Manipur 16,781 146,309 29,361 2,063 216 2,567 4,133 4,387 4,434 10,292 268 11,023 1,611 233,446
Source: IMaCS Analysis

NSDC Skill Gap Study of the North East - Manipur
101
8.4 Stakeholder feedback
IMaCS has interacted with different stakeholders in the State, to gauge their views on skill requirements
in Manipur. The Stakeholder feedback is given in the table below.
TABLE 45: STAKEHOLDER FEEDBACK
Stakeholder Key findings
Industry feedback
(overall)
• Need to create infrastructure (roads, electricity, telecom) to reduce
cost of production and transportation; Transportation increases costs
by almost double the production costs making economic activity
unviable
• Each state should focus on a few key economic areas for development
rather than trying everything
Sector-specific feedback
Handloom and Handicrafts • Raw material sourcing adds to cost; Despite factor advantages raw
materials such a threads not available from within the State, e.g., in
sericulture
• Products are high priced, sold in melas and trade fairs
• Facilities for transportation and packaging of large and odd shaped
goods not available
• Training provided locally, infrastructure inadequate
• Younger generation not interested in working in traditional sectors
Horticulture and fruit
processing
• Lack of cold storage facilities and transportation
• Investors interested to explore areas such as oranges, chilly, ginger,
pineapple
• Newly created infrastructure in Imphal is not located close to
plantations
• Market linkage missing for most horticulture products
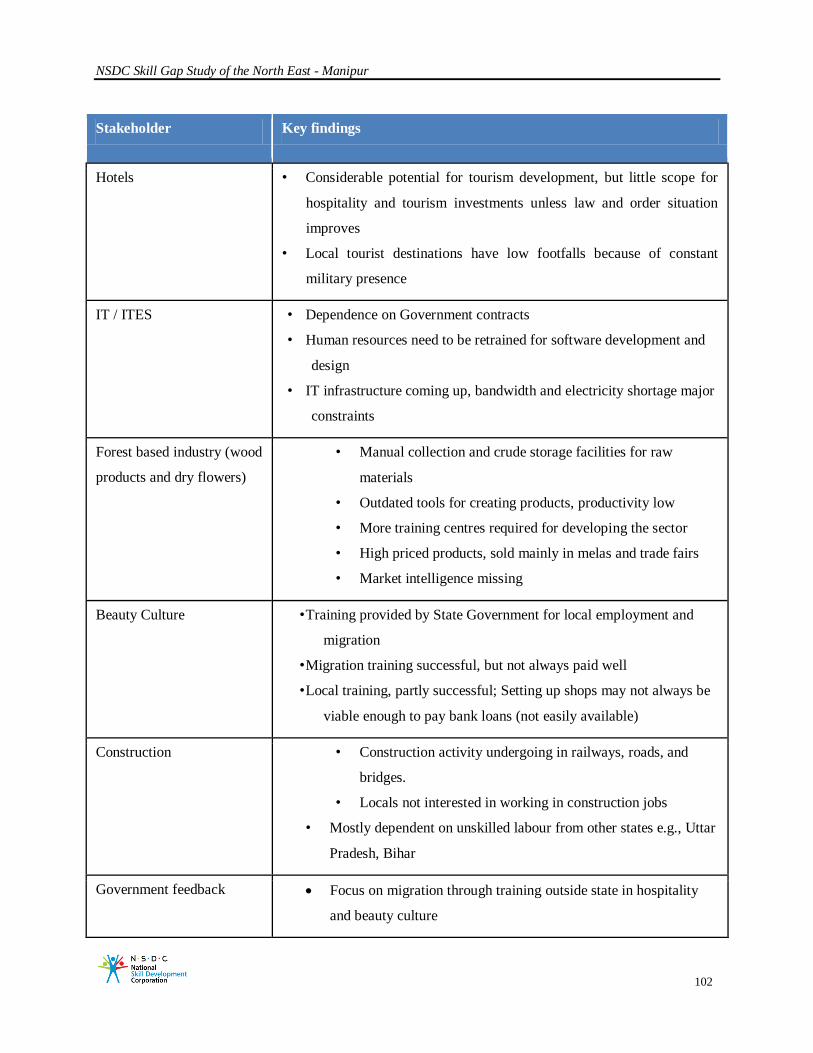
NSDC Skill Gap Study of the North East - Manipur
102
Stakeholder Key findings
Hotels • Considerable potential for tourism development, but little scope for
hospitality and tourism investments unless law and order situation
improves
• Local tourist destinations have low footfalls because of constant
military presence
IT / ITES • Dependence on Government contracts
• Human resources need to be retrained for software development and
design
• IT infrastructure coming up, bandwidth and electricity shortage major
constraints
Forest based industry (wood
products and dry flowers)
• Manual collection and crude storage facilities for raw
materials
• Outdated tools for creating products, productivity low
• More training centres required for developing the sector
• High priced products, sold mainly in melas and trade fairs
• Market intelligence missing
Beauty Culture • Training provided by State Government for local employment and
migration
• Migration training successful, but not always paid well
• Local training, partly successful; Setting up shops may not always be
viable enough to pay bank loans (not easily available)
Construction • Construction activity undergoing in railways, roads, and
bridges.
• Locals not interested in working in construction jobs
• Mostly dependent on unskilled labour from other states e.g., Uttar
Pradesh, Bihar
Government feedback Focus on migration through training outside state in hospitality
and beauty culture

NSDC Skill Gap Study of the North East - Manipur
103
Stakeholder Key findings
Local training is attractive only because of subsidy involved; hence
largely unsuccessful
Food processing is a focus area of development; infrastructure created
recently, few takers yet
Educational institutions
feedback
Students from technical training institutes such as Engineering, IT and
Plastics find employment, primarily, outside state.
Students from diploma courses go for higher level courses, high level
of unemployment
Students from general colleges find local employment in Government
or remain unemployed
Students / Unemployed
youths feedback
Open to explore opportunities outside the State, as locally
opportunities are scarce
After getting exposure outside, willingness to come back if
opportunities are presented
Preference for Government jobs
Lack of industry exposure
NABARD Introduction of new horticulture products is possible only when food-
grain growing farmers have alternative subsistence level income
during the period when crop has still not reached harvest period.
Source: IMaCS Survey

NSDC Skill Gap Study of the North East - Manipur
104
PART – III: Recommendations

NSDC Skill Gap Study of the North East - Manipur
105
9.1 Interventions for human resource Demand-Supply gap management
IMaCS has used the following framework of interventions for human resources demand-supply gap
management:
FIGURE 24: DEMAND-SUPPLY OF HUMAN RESOURCES IN MANIPUR – 2011-21
Source: IMaCS Analysis

NSDC Skill Gap Study of the North East - Manipur
106
9.2 Areas for skilling within state – 2011-21
Areas for skilling within the State have been identified at different levels of the pyramid.
FIGURE 25: AREAS FOR SKILLING WITHIN STATE BETWEEN 2011 AND 2021
Specialised skills include: master weavers, food technologist, PhDs, Designers, etc.
Source: IMaCS Analysis
Locally, around 2.33 lakh persons will be demanded from various existing and up-coming sectors in the
State in the next 10 years. Another seven per cent may be added due to persons working in the 50-60 year
age group, who may come up for retirement in the 10 years.

NSDC Skill Gap Study of the North East - Manipur
107
FIGURE 26: AREAS FOR SKILLING FOR DEMAND SECTORS IDENTIFIED WITHIN
MANIPUR
Sector Basic Skills:
1.48 L
Skill Category
Level-I: 49,920
Skill Category
Level-II: 32,371
Specialised Skill:
2,334
Handloom Weaving Weaving Entrepreneurship Weaving at Master
level, Designing
Handicraft Artisanship Artisanship Entrepreneurship,
Agent
Craftspersonship at
Master level
Horticulture Growing Farm extension
services
Entrepreneurship Marketing
Food
Processing
Working at Shop
floor
Distribution,
packaging
SHG lead
executive,
Entrepreneurship
Food technologist,
Management
Hospitality Housekeeping Chefs, Attendants Manager,
Entrepreneurship
Tourism package
development
planning
IT / ITES Data entry
personnel
Call centre: customer
service, helpline
IT
entrepreneurship,
training
IT system specialist
Healthcare - Paramedics Nurses and Doctors Specialists
Education - - Teachers,
Principals
Researcher, Trainer
Motor
Repair
Mechanical work Mechanical work Entrepreneurship
Border
Trade
Helping: loading Logistic providers,
trading
FTA Specialist Training
Beauty - Beauticians Manager, Agent Hair and skin

NSDC Skill Gap Study of the North East - Manipur
108
Sector Basic Skills:
1.48 L
Skill Category
Level-I: 49,920
Skill Category
Level-II: 32,371
Specialised Skill:
2,334
Culture specialists
Construction Construction
labourer
Mason, Welder,
Machine operator,
Electric Works
Agent, Contractor Project manager
Forest based Growing, cutting,
collecting
Craftsmanship - -
In addition to the areas identified above, there will also be continued demand in livelihood activities like
agriculture, fishery and animal husbandry.
FIGURE 27: LIVELIHOOD ACTIVITIES IN MANIPUR WHICH NEED SKILL UP-
GRADATION
Activity Description Skill level 2011 employment
Agriculture
(Cultivation)
Rice and maize are two
main cereal crops
cultivated in Manipur.
About 22% of the area
is under „jhum‟
cultivation.
Mostly, unscientific
methods of cultivation
used.
379,705
Fishery About 98% of the fish
in Valley and 75% of
the fish in Hills is
consumed in fresh
form. Rest is sun dried
Outdated fish farming
techniques used.
800
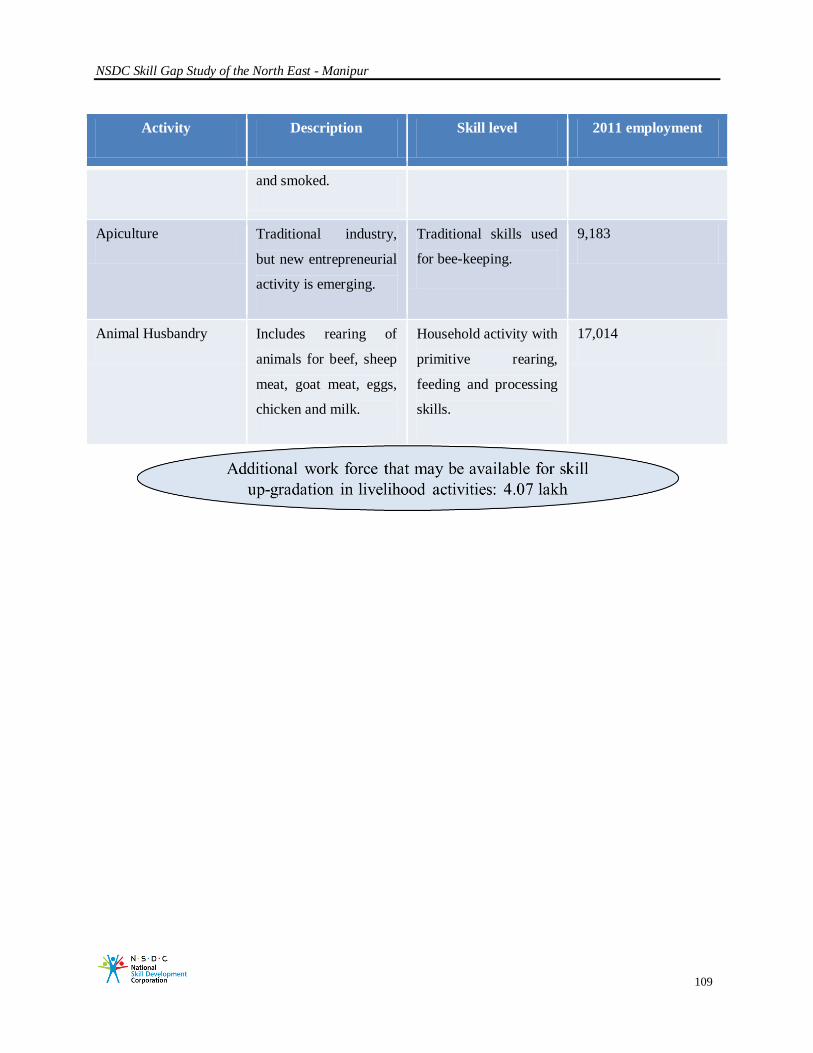
NSDC Skill Gap Study of the North East - Manipur
109
Activity Description Skill level 2011 employment
and smoked.
Apiculture Traditional industry,
but new entrepreneurial
activity is emerging.
Traditional skills used
for bee-keeping.
9,183
Animal Husbandry Includes rearing of
animals for beef, sheep
meat, goat meat, eggs,
chicken and milk.
Household activity with
primitive rearing,
feeding and processing
skills.
17,014

NSDC Skill Gap Study of the North East - Manipur
110
9.3 Skilling for migration
An excess pool of working population of around81,813 persons is expected to be available per year for
migration outside the State during the period 2011-21. In the absence of local job opportunities, this pool
would be required to be trained for skills that are in demand outside state. The sectors identified based on
local aptitude and interests are mainly in the services and highly skilled areas.
FIGURE 28: AREAS FOR SKILLING FOR MIGRATION TO OTHER STATES OR
OVERSEAS
CoE: Centre of Excellence; Source: IMaCS Analysis

NSDC Skill Gap Study of the North East - Manipur
111
9.4 Capacity creation within State
The human resource needs to be skilled across the sectors which present employment opportunities and
the capacity needs to be created to achieve the same.
FIGURE 29: INTERVENTION FOR CAPACITY CREATION WITHIN THE STATE
Source: IMaCS Analysis

NSDC Skill Gap Study of the North East - Manipur
112
9.5Private sector skill development opportunities at the district level
9.5.1 Bishnupur– skilling interventions
Healthcare professionals
Nurses training for day care, emergencies and critically ill patients
Paramedics training: ward boys, nursing orderly, pharmacist, medical record officer, mobile
healthcare service, ambulance attendants, emergency outside hospitals, etc.
Fisheries
Pondage knowledge
Modern fish farming techniques: breeding, feeding, disease protection, etc.
Rearing of appropriate fish-mix for greater yield
Preserving and storage techniques
Establishing fish processing unit with technology and new processing techniques
Market development skills inside and outside state
Storage and transport capabilities

NSDC Skill Gap Study of the North East - Manipur
113
TABLE 46: SKILL LEVEL WISE HUMAN RESOURCE REQUIREMENT IN BISHNUPUR
Some figures might not add up, due to rounding off of the decimal points.
Source: IMaCS Analysis

NSDC Skill Gap Study of the North East - Manipur
114
9.5.2 Chandel– skilling interventions
Border Trade
Letter of credit with bank
Knowledge of taxation and duties on traded goods for both sides
Exchange rate implications
Import-export procedures
Import-export documentation
Categorisation of traded goods and declarations, etc.
Precedence clause – whether imports/exports from India precede in exchange mechanism
Foreign Trade Agreements
Trade related economy
Hospitality related
Logistics: warehousing, preservation and storage; transportation: construction of dwellings and
support infrastructure
Technicians (electricians, plumbers, etc.)

NSDC Skill Gap Study of the North East - Manipur
115
TABLE 47: SKILL LEVEL WISE HUMAN RESOURCE REQUIREMENT IN CHANDEL

NSDC Skill Gap Study of the North East - Manipur
116
9.5.3 Churachandpur– skilling interventions
Forest based activities
Increasing productivity through proper use of tools and raw material collection techniques
Gauging competition from other states and countries
Creation of products in keeping with changing market trends
Imparting training that is market oriented and develops interest in innovation
Use of varies samples and visual aids in market-oriented training
Handloom and handicraft
Quality standards and certifications
Assessment of competitive environment and sample collection
Wastage reduction
Innovation in design through use of new tools and techniques to scale up business and overcome
periods on under-utilisation
Micro-finance raising skills
Assertive communication, language and negotiation skills
Introduction of packaging materials and techniques, e.g., styrofoam

NSDC Skill Gap Study of the North East - Manipur
117
TABLE 48: SKILL LEVEL WISE HUMAN RESOURCE REQUIREMENT IN
CHURACHANDPUR

NSDC Skill Gap Study of the North East - Manipur
118
9.5.4 Imphal West and East- skilling interventions
Hotels
Chefs and restaurant managers
Hotel management skills
Quality assurance awareness
Crisis management
Multi-lingual and culturally sensitive
Ability to follow set standards
Transactions management (debit/credit card, etc.)
Computer skills
Professionalism and etiquette
IT, Call Centre
Marketing and business generation
Developing new business areas based on local competencies such as arts, sports
Improved spoken and written English
Multi-lingual communication
Assertiveness and sales skills
Web technology for animation, mathematics and programming for gaming, „midi‟ for music, etc.
Sports trainers & auto mechanics
To run various disciplines in sports academy
Automobile training to repair cars and other vehicles

NSDC Skill Gap Study of the North East - Manipur
119
TABLE 49:SKILL LEVEL WISE HUMAN RESOURCE REQUIREMENT IN IMPHAL WEST
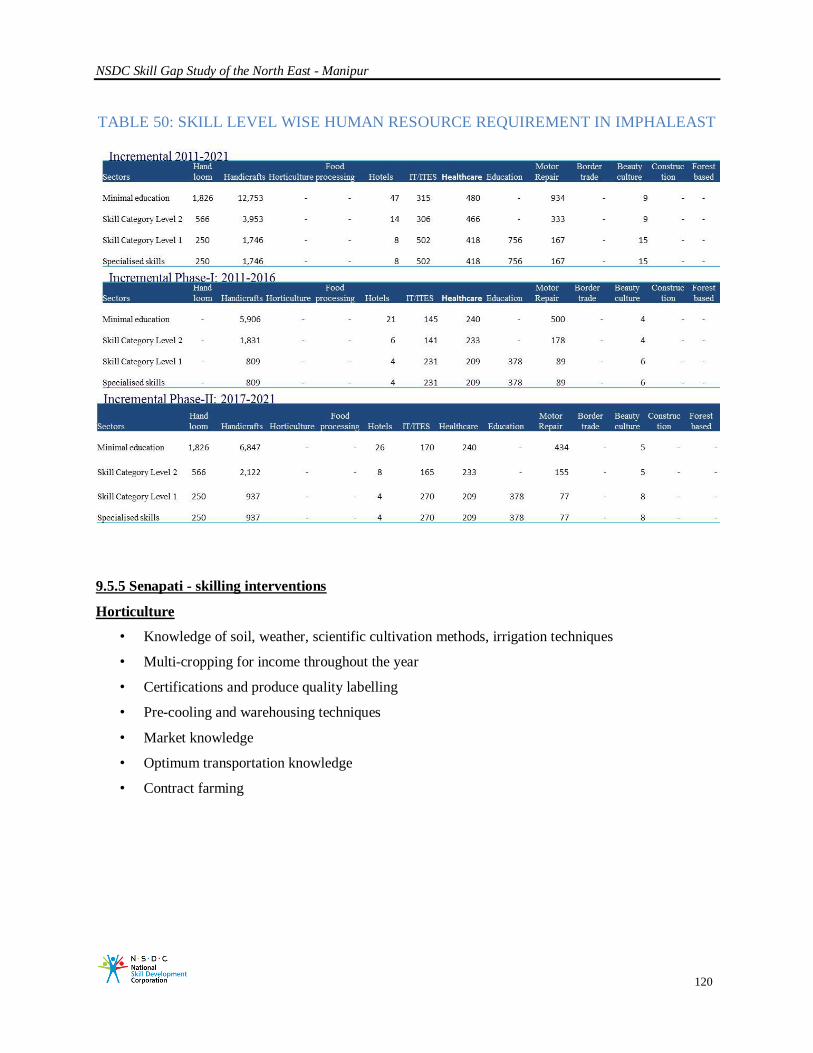
NSDC Skill Gap Study of the North East - Manipur
120
TABLE 50: SKILL LEVEL WISE HUMAN RESOURCE REQUIREMENT IN IMPHALEAST
9.5.5 Senapati - skilling interventions
Horticulture
• Knowledge of soil, weather, scientific cultivation methods, irrigation techniques
• Multi-cropping for income throughout the year
• Certifications and produce quality labelling
• Pre-cooling and warehousing techniques
• Market knowledge
• Optimum transportation knowledge
• Contract farming

NSDC Skill Gap Study of the North East - Manipur
121
TABLE 51: SKILL LEVEL WISE HUMAN RESOURCE REQUIREMENT IN SENAPATI

NSDC Skill Gap Study of the North East - Manipur
122
9.5.6 Tamenglong- skilling interventions
Horticulture
• Knowledge of soil, weather, scientific cultivation methods, irrigation techniques
• Multi-cropping for income throughout the year
• Certifications and produce quality labelling
• Pre-cooling and warehousing techniques
• Market knowledge
• Optimum transportation knowledge
• Contract farming
Hospitality (Orange festival)
• Chefs and restaurant managers
• Hotel management skills
• Quality assurance awareness
• Crisis management
• Multi-lingual and culturally sensitive
• Ability to follow set standards
• Transactions management (debit/credit card, etc.)
• Computer skills
• Professionalism and etiquette

NSDC Skill Gap Study of the North East - Manipur
123
TABLE 52: SKILL LEVEL WISE HUMAN RESOURCE REQUIREMENT IN
TAMENGLONG

NSDC Skill Gap Study of the North East - Manipur
124
9.5.7 Thoubal - skilling interventions
Horticulture
• Knowledge of soil, weather, scientific cultivation, irrigation techniques
• Multi-cropping for income throughout the year
• Certifications and produce quality labelling
• Pre-cooling and warehousing techniques
• Market knowledge
• Optimum transportation knowledge
• Contract farming
Embroidery
Quality standards and certifications
Assessment of competitive environment and sample collection
Innovation in design and productivity enhancement through use of computerised embroidery
machines
Assertive communication, language and negotiation skills
IT, Call Centre
Marketing and business generation
Developing new business areas based on local competencies such as arts, sports
Improved spoken and written English
Multi-lingual communication
Assertiveness and sales skills
Web technology for animation, mathematics and programming for gaming, „midi‟ for music, etc.

NSDC Skill Gap Study of the North East - Manipur
125
TABLE 53: SKILL LEVEL WISE HUMAN RESOURCE REQUIREMENT IN THOUBAL

NSDC Skill Gap Study of the North East - Manipur
126
9.5.8 Ukhrul - skilling interventions
Handloom
Marketing and business generation
Developing new business areas based on local competencies such as arts, sports
Improved spoken and written English
Multi-lingual communication
Assertiveness and sales skills
Web technology for animation, mathematics and programming for gaming, „midi‟ for music, etc.
TABLE 54: SKILL LEVEL WISE HUMAN RESOURCE REQUIREMENT IN UKHRUL

NSDC Skill Gap Study of the North East - Manipur
127
9.5 Key interventions for Manipur
Interventions for Manipur have been arrived at keeping in mind that of all North Eastern States,
Manipuris are among the least inclined to migrate. However, excess supply of educated or trained
persons over what can be accommodated from demand generated within the State in the next 10
years, indicates that some amount of skilling for migration will be essential.
As the economy of Manipur grows and new areas of employment develop, this migrated skill base
can be leveraged to attract them back and make a contribution to the State‟s economy.
There is an expected excess demand in the skill level 1. Additional capacity would be required to be
created for about 250 persons per year to match skill training with industry requirements.
Areas of capacity creation for vocational training include: weaving, artisans, farm-extension services,
products distribution, packaging, chefs, call centre-customer service, paramedics, mechanics, border-
trade, beauty and wellness, mason, welding, machine operations, logistic, electric works, crafts,
computer operations, food technology, and computer/ laptop/ cell-phone repairs.
Combining skill training with entrepreneurial skills would be essential, depending on the level of
training imparted. Manipur lacks entrepreneurial activity in any activity that is not related to
handloom and handicraft. However, there are signs of such activity coming up, especially, in the
food, hospitality, and healthcare sectors.
Specialist skill development institutes for sports and arts would help use the traditional skills of local
youth.
Between 2011 and 2021, around 81,000 persons will be available for training for skills that relate to
demand outside the State. Key opportunities include retail, hospitality, IT, fashion design, nursing,
cooks (overseas), beauticians, call-centre operator, etc.
Re-skilling for livelihood opportunities in weaving, fisheries and apiculture would also be required
for over 6 lakh persons.

NSDC Skill Gap Study of the North East - Manipur
128
Annexure

NSDC Skill Gap Study of the North East - Manipur
129
1. Methodology used for Demand projections
The following methodology has been adopted for making demand side projections of human resources:
Identification of key economic activities in each district.
Estimation of current employment numbers in each district, based on information available from
Government publications and IMaCS primary survey.
Forecasting of future employment requirements, using different assumptions (explained in the slide
on assumptions) for each industry.
Different assumptions have been used because of differences in nature, demand and growth potential,
factor endowments, commercialisation status, policy thrust, past growth trends, past and expected
investments, employment pattern and opportunities for migration of all economic activities.
Forecasts have been done for all existing and potential industries identified by us. District wise
distribution of employment in 2021 is assumed to remain same as it was in 2011.

NSDC Skill Gap Study of the North East - Manipur
130
2. List of Abbreviations
List of Abbreviations
BRO Border Roads Organisation
BSNL Bharat Sanchar Nigam Limited
CAGR Compound Annual Growth Rate
DDP District Domestic Product
DoNER Ministry of Development of North Eastern Region
GDP Gross Domestic Product
GSDP Gross State Domestic Product
HEP Hydro-electric Power
HRD Human Resource Development
IT Information Technology
ITI Industrial Training Institute
mn Million
MU Million Units
NEC North Eastern Council
NEDFi North Eastern Development Finance Corporation Limited
NER North Eastern Region
NES North Eastern States
NGO Non-Governmental Organisation
NIT National Institute of Technology
No. Number
NSDC National Skill Development Corporation
O&M Operation and Maintenance
PPP Public Private Partnership
PWD Public Works Department
SHG Self Help Group
SIDO Small Industries Development Organisation

NSDC Skill Gap Study of the North East - Manipur
131
3. List of people met in Manipur
Person Met Designation Organisation
Organisation
Type District
D.S. Poonia Chief Secretary Secretariat
State
Government State
Jacintha Lazarus
Deputy Commissioner,
Churachandpur District District HQ
State
Government
Churachandpur
R. K. Dinesh
Deputy Commissioner,
Thoubal District District HQ
State
Government
Thoubal
T. Sitlhou
Deputy Commissioner,
Bishenpur District District HQ
State
Government
Bishnupur
K. Lakshmi Kumar
Deputy Commissioner,
Imphal East District District HQ
State
Government
Imphal East
T.S. Arun Kumar
General Manager, District
Industries Centre, Imphal East District
State Government
Imphal Ease
L. Praphullo Singh
Assistant Director – Industries
(Design) District
State
Government
Imphal East
H. Vandana
Cluster Development
Executive
BasikhongKitnapan
ung cluster SHG Imphal East
H. Anil
Vice President (STPI, Imphal
West) X-treme Wave Entrepreneur Imphal West
ThennemZou President (KamdouVeng village, Churachandpur)
SHG Churachandpur
K. Vungzamawi
Secretary (Churachandpur
district) Zapada NGO Churachandpur
DGM NABARD Government Churachandpur
D. Pudaite
Entrepreneur Churachandpur
Manmasi Men SHG
Beekeeping SHG Churachandpur
Merigold
Dry flowers
Award winning
SHG Churachandpur
Generale Manager
(Bishenpur) DIC Government Bishnupur
Holkhothamg
Mate
Secretary (Churachandpur
district)
Ideal Handloom &
Handicrafts
Cooperative Society SHG Churachandpur
Gin Gangte
Grower
(Churachandpurdistrict) Farmer Private Churachandpur
A Kharsi-Singh Chief Conservator of Forests Forest Department Government State
R K (Ongghi)
Purnima Devi
Proprietor (Wangkhei,
Imphal)
Ladies Handloom
House Private Imphal West
Head (Churachandpur district)
Private Churachandpur
Group of brick makers
(Churachandpur)
Private Churachandpur
S. Ibeni Deb Head trainer (Thoubal district)
Social Economic
Development SHG SHG Thoubal
Lead weaver (Thoubal
district)
TangkhaManingKh
en SHG Thoubal

NSDC Skill Gap Study of the North East - Manipur
132
Person Met Designation Organisation
Organisation
Type District
Lead weaver (Thoubal
district)
SangaiyumphomNu
ngphouMathake SHG Thoubal
Sunibala Devi Head (Thoubal district)
NingolMouTengban
g SHG Thoubal
Head (Thoubal district) Guide Women SHG Thoubal
Indira Oinam Head (Thoubal district)
Women‟s Income
Generation Centre
(WIGC)
NGO-award
winning Thoubal
Mr.Biken Counsellor (Imphal)
Centre for Mental
Hygiene NGO Imphal West
Proprietor (Imphal West) S. P. Embroidery
Entrepreneur
(National
MSME award
winner, ISO certified, credit
rated) Imphal West
Mr. Imo Thiyam Project Director (Imphal) CIPET
Technical
Institution Imphal
Dr.Sarat Chandra Administrative Head (Imphal) NIT
Technical
Institution Imphal
Ms.Kulakarani Joint Director
Planning
Department
State
Government State
Meira Foods Proprietor (Imphal East)
Action for
Community
Transformation
Cooperative-
Entrepreneur Imphal East
O Nabakishore
Singh Commissoner
Commerce &
Industries
Department
State
Government State
S Joykumar Singh Managing Director
Manipur Industrial
Develoment
Corporation Limited Stae Government State
Sanatkumar Singh,
Kirti Singh Chemist Food Park
State
Government State
L Achouba, L
Modon
Fisheries
department
State
Government Bishnupur
Anil Singh
IT Department
State
Government State
Noren Sharma Proprietor Stone crushing unit Private
Imphal/Senapati
border
Dr. W Gyaneshor
Singh Dean
Regional Institute
of Medical Sciences
(RIMS) NER Imphal
Dr.SinamSekhorjit
Singh Director RIMS NER Imphal
Dr. S Bilashini
Devi Doctor RIMS NER Imphal
M Lokendro Singh Chief Engineer Public Works State Imphal

NSDC Skill Gap Study of the North East - Manipur
133
Person Met Designation Organisation
Organisation
Type District
Department (PWD) Government
Munindra Singh Director State Planning
State
Government Imphal
Tombi Devi, S.
Chaotombi Devi,
K Vijya Devi
Cluster Development
Executive, Chairman,
Secretary
LamdingCherapur
Cluster SHG Thoubal
L Modhu Singh, Y
Lukhoi Singh, M M Singh, N I Devi
CDE, Designer, President, Secretary
Southern Handloom
Weavers
Development Federation
Handllom
Society (Consortium) Thoubal
Dr. U Chaoba and
others Professor
Horticulture
Department, Central
Agricultural
University
Central
University Imphal
H Nandakumar
Sharma Vice Chancellor Manipur University State University Imphal
Y Mani Proprietor Auto Mechanic Private Imphal
Dr.Dhabali Singh Proprietor Classic Hotel Private Imphal
T Amuba Singh
Senior Finance and Accounts
Officer NHPC Government
T Shyam Kumar Manager Civil NHPC Government

NSDC Skill Gap Study of the North East - Manipur
134
4. Manipur – List of Handicrafts Clusters
Location District Product Details
Loktak area,
Utlou village Bishnupur Yengthou Mat Mattresses
Churachandpur Cane and Bamboo craft
Baskets, mats, Furniture like Murah, Chair, Hat, Candle stand, Tray, Table lamps etc.
Imphal Cane and Bamboo craft
Baskets, mats, Furniture like Murah, Chair, Hat, Candle stand, Tray, Table lamps etc.
Chairel Nongpok
Sekmai, Andro Imphal Coiled Pottery
Flower pot, smoking pipe, pressure cooker, water
filter, various type of plate, agarbati stand, pot
Imphal Jewellery Traditional metal jewellery
Aheiban Leikai, Imphal
Imphal Bell Metal Sengabetel container, Krishna kanti dish, senga
Keirao Imphal Stone Carving Panels, memorial stones and idols
Imphal Hand Embroidery
Phanek Mapal Naiba (Longi), Pillow cover, bed
sheets, handkerchief, table cloth, T.V. and Radio
Cover, Wall hangings and decorative items
Imphal Carpet Traditional Blanket, carpets
Imphal Applique Work Ritual dresses
Imphal Handblock
printing Traditional dress material, dhoti and chadar
Imphal Toys & Dolls Typical dancing design of dolls
Kongba bazar
area Imphal East Kauna Grass reed
Mat, Cushion square, Cushion round, Murah, wall
decorative items
Konthoujam
village Imphal West Yengthou Mat Mattresses
Heirangoitbong,
Khongnang
Pheidekpi
Imphal West Brass and bell metal
Utensils, musical instruments, ritual objects
Tamenglong Cane and
Bamboo craft
Baskets, mats, Furniture like Murah, Chair, Hat,
Candle stand, Tray, Table lamps etc.
Kakching Thoubal Cane and
Bamboo craft
Baskets, mats, Furniture like Murah, Chair, Hat,
Candle stand, Tray, Table lamps etc.
Khangabok village, Yairipok
area
Thoubal Kauna Grass reed Mat, Cushion square, Cushion round, Murah, wall
decorative items
Thongjao Thoubal Coiled Pottery Flower pot, smoking pipe, pressure cooker, water filter, various type of plate, agarbati stand, pot
Longpi village Ukhrul Coiled Pottery Flower pot, smoking pipe, pressure cooker, water filter, various type of plate, agarbati stand, pot
Indpur Cane & Bamboo
Craft
Heirangkhoithong Bell Metal Sengabetel coantainer, Krishna kanti dish, senga

NSDC Skill Gap Study of the North East - Manipur
135
5. Training Capacity of Vocational Education in Manipur
Location District Product Details
Loktak area,
Utlou village Bishnupur Yengthou Mat Mattresses
Churachandpur Cane and Bamboo craft
Baskets, mats, Furniture like Murah, Chair, Hat, Candle stand, Tray, Table lamps etc.
Imphal Cane and Bamboo craft
Baskets, mats, Furniture like Murah, Chair, Hat, Candle stand, Tray, Table lamps etc.
Chairel Nongpok
Sekmai, Andro Imphal Coiled Pottery
Flower pot, smoking pipe, pressure cooker, water
filter, various type of plate, agarbati stand, pot
Imphal Jewellery Traditional metal jewellery
Aheiban Leikai, Imphal
Imphal Bell Metal Sengabetel container, Krishna kanti dish, senga
Keirao Imphal Stone Carving Panels, memorial stones and idols
Imphal Hand Embroidery
Phanek Mapal Naiba (Longi), Pillow cover, bed
sheets, handkerchief, table cloth, T.V. and Radio
Cover, Wall hangings and decorative items
Imphal Carpet Traditional Blanket, carpets
Imphal Applique Work Ritual dresses
Imphal Handblock
printing Traditional dress material, dhoti and chadar
Imphal Toys & Dolls Typical dancing design of dolls
Kongba bazar
area Imphal East Kauna Grass reed
Mat, Cushion square, Cushion round, Murah, wall
decorative items
Konthoujam
village Imphal West Yengthou Mat Mattresses
Heirangoitbong,
Khongnang
Pheidekpi
Imphal West Brass and bell metal
Utensils, musical instruments, ritual objects
Tamenglong Cane and
Bamboo craft
Baskets, mats, Furniture like Murah, Chair, Hat,
Candle stand, Tray, Table lamps etc.
Kakching Thoubal Cane and
Bamboo craft
Baskets, mats, Furniture like Murah, Chair, Hat,
Candle stand, Tray, Table lamps etc.
Khangabok village, Yairipok
area
Thoubal Kauna Grass reed Mat, Cushion square, Cushion round, Murah, wall
decorative items
Thongjao Thoubal Coiled Pottery Flower pot, smoking pipe, pressure cooker, water filter, various type of plate, agarbati stand, pot
Longpi village Ukhrul Coiled Pottery Flower pot, smoking pipe, pressure cooker, water filter, various type of plate, agarbati stand, pot
Indpur Cane & Bamboo
Craft
Heirangkhoithong Bell Metal Sengabetel coantainer, Krishna kanti dish, senga

NSDC Skill Gap Study of the North East - Manipur
136
About ICRA Management Consulting Services Limited
IMaCS - An introduction
ICRA Management Consulting Services Limited (IMaCS) is a multi-line management consulting firm
headquartered in India. It has an established track record of 17 years in management and development
consulting across various sectors and countries. IMaCS has completed more than 1,200 consulting
assignments with about 600 clients and has worked in over 40countries across the globe. IMaCS is a
wholly-owned subsidiary of ICRA Limited (ICRA), one of India‟s leading credit rating agencies. IMaCS
operated as an independent division of ICRA till March 20051, when it was de-merged from ICRA and
became a standalone company in its present form.
Through the process of carrying out several assignments over the past 17 years, IMaCS has accumulated
considerable analytical and consulting expertise, backed by the following organisational capabilities:
An extensive and organised database on several sectors.
Knowledge of key factors of success in different projects and program.
An ability to research emerging global trends, both in specific countries as well as in different sectors,
based on primary and secondary data.
Performance benchmarking
Quantitative and financial modelling
Ability to identify the various types of risks and suggest appropriate strategies to mitigate the same
Ability to work in different geographies on its own and through affiliate partners
1 Under the name “ICRA Advisory Services”

NSDC Skill Gap Study of the North East - Manipur
137
Recommended