1
NOAA’s Automated Distribution Infrastructure for Digital Charts
LCDR Mark Wetzler1, Marc Higgins1, John Tucker1and Brad Christian2 1NOAA’s Office of Coast Survey and 2Rose Point Navigation Systems
Abstract NOAA has developed a hardware and file infrastructure which allows third parties to build software that can automate the downloading of the current versions of NOAA’s digital nautical charts. The distribution infrastructure consists of three components: Three geographically separated and mirrored Web servers with high bandwidth connections to the internet; static links to NOAA chart files; and two eXtensible Markup Language (.XML) product catalogs—one for Electronic Navigational Charts (ENCs) and one for Raster Navigational Charts (RNCs). The product catalogs contain chart metadata, release dates and URL addresses of the static links for downloading the charts. Software applications can be developed that read the .XML product catalog files to determine the current status of charts available. This can be compared to the status of charts on a mariner’s system, and needed updates automatically determined for download to the mariner’s computer. Electronic Chart System (ECS) and Electronic Chart Display and Information System (ECDIS) developers can build applications which automate the management of user chart suites thus enabling mariners to always have the current chart edition directly from NOAA. Today’s high bandwidth Internet connections via satellite, WiFi access at marinas, and cell tower connections allow for downloads to occur while at sea. NOAA produces, maintains and makes available for free distribution a suite of 671 ENCs and 1019 RNCs. During an average week there are 225 critical corrections applied to 55 ENCs and 115 RNCs. This large volume of updates makes it difficult for the user to manually maintain a local chart suite. A chart suite that is maintained in an automated fashion, with information downloaded directly from the hydrographic office, allows the user to effortlessly have the most current information. *Note—Any mention of a commercial product is for informational purposes and does not constitute an endorsement by the U.S. Government or any of its employees or contractors. Introduction The foundation of the United States economy is the Marine Transportation System— the network of oceans, rivers, canals, locks, dams, ports, and aids to navigation. Shipping on these “marine highways” moves people and cargo around the country, and connects the US to global markets for international trade and affordable goods. The importance of these highways is significant. Roughly 15% of the United States Gross Domestic Product flows through the ports. Water born commerce in the U.S. is a $1 trillion industry. More than 78% of U.S. overseas trade by weight and 38% by value comes and goes by shipi. The Office of Coast Survey (OCS) is responsible for producing the suite of nautical charts that covers the coastal waters of the U.S. and its territories, in support of this vital waterborne commerce.
2
Other constituents who rely on the suite of nautical charts include the U.S. fisheries industry and recreational boaters. In 2006 alone the fishing industry generated $103 billion in sales, $44.3 billion in income and supported over 1.5 million jobs.ii The U.S. Coast Guard reported that there were 12,746,126 registered recreational boats in the U.S. in 2006.iii OCS is working to be the provider of choice for information needed for safe navigation and to expand its constituent base beyond the traditional navigation community.iv A methodology to realize these goals is to enhance the product distribution system thereby making products more readily available. This will result in increased breadth, speed, and frequency of chart dissemination. The automated distribution infrastructure described in this paper significantly enhances OCS’s current distribution mechanism by allowing third party programmers to directly access chart suite metadata and data. The end result is that the mariner will increase efficiency and improve navigational safety by always having the most recent digital chart edition aboard with minimal effort. Background In 2002 OCS began delivering ENCs to customers digitally with a commercially available Web based distribution package. The service was expanded in 2005 to include distribution of RNCs. The commercial interface was designed to meet the needs of the majority of customers by providing graphical and textual methods for selecting and downloading desired charts. The software was designed for manual selection and download of charts by individual users. No functionality for automated selection and download was available within the commercial package. Several times a year OCS would receive requests from customers, Web developers, and ECS programmers asking for chart metadata so that they could develop software or processes utilizing that metadata. From a review of customer inquiries it was clear that software developers who wanted to automate processes were not having their needs met with the commercial package and its manual selection and download interface. Simultaneously, OCS was also developing Continuity of Operations (COOP) plan. One aspect was to resolve how to continue chart distribution if the server for distributing charts was unavailable. By working with NOAA’s Web Operation Center (WOC) a simple COOP solution was implemented. Once a week all of the ENCs and RNCs were packaged into two .ZIP files, uploaded to the WOC and mirrored to three geographically separated servers that were publicly available. Over time it was found that many customers preferred this distribution mechanism over the existing Web based distribution package. This preference was due to its reliability, bandwidth and simplicity. Based upon customer requests and strategic evolution the WOC site (www.charts.noaa.gov) evolved, but the basic requirement of simplicity was kept.

3
During a February 2006 visit from industry NOAA was requested to make metadata available to supplement product distribution. The recommendation was that metadata be placed in an .XML format and made available online. With customer requirements, robust Web distribution technology, and a metadata model to emulate, OCS began generating .XML files containing chart metadata in January of 2008. The project objective was to “Make up-to-date Nautical Chart System (NCS) data easily accessible to developers for reliable redistribution of chart products and services.”v In addition to the two full suite .ZIP files, the charts were prepackaged and made available as regional in individual .ZIP files. This increased flexibility for developing systems that automate download. Though the development of the infrastructure was not revolutionary, it is a strong example of evolution of a business model based on customer feedback, analysis of Web statistics, and appropriate use of Web technology. OCS Business Model for Digital Chart Product Distribution The new business model for chart product distribution is tiered based upon customer needs and skill levels. The automated distribution infrastructure is designed for advanced customers, i.e. developers and distributors. Table 1 portrays three tiers of OCS customers, by experience level, with corresponding links to the distribution mechanism.
Digital Data Distribution Model
Defining Characteristics Mechanism to Access Products Current URL
Casual Customer
Do not know what products are available. RNC Graphical User Interface (GUI) http://www.charts.noaa.gov/InteractiveCatalog/nrnc.shtml
Might be interested in viewing one or two charts or downloading charts in a coverage area. Chart numbers do not mean much to this group. Geographic catalog is of the most value.
ENC Graphical User Interface (GUI) http://www.charts.noaa.gov/InteractiveCatalog/nenc.shtml
Intermediate Customer Understand chart catalogs and chart numbers. Text Interface http://www.charts.noaa.gov/RNCs/RNCs.shtml Want to download a set of charts for their local area. Text Interface http://www.charts.noaa.gov/ENCs/ENCs.shtml
GUI by State http://www.charts.noaa.gov/InteractiveCatalog/nstate.shtml
GUI by Coast Guard District http://www.charts.noaa.gov/InteractiveCatalog/ncgd.shtml
Advanced Customer Want to automate download by checking .XML file. RNC Product Catalog http://www.charts.noaa.gov/RNCs/RNCProdCat.xml
Want to check to see most current product. ENC Product Catalog http://www.charts.noaa.gov/ENCs/ENCProdCat.xml Want to develop a portfolio management system for their customers. Want to automate processing of chart information
4
Digital Data Distribution Model by Customer Skill Levels Table 1
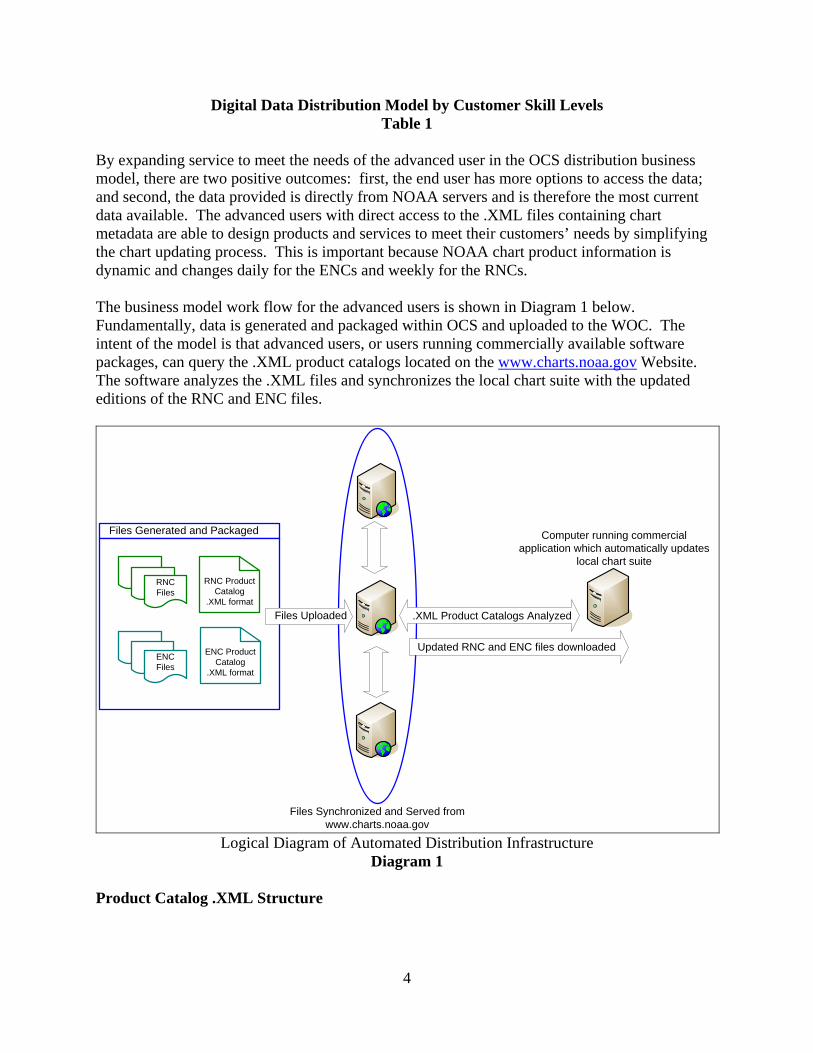
By expanding service to meet the needs of the advanced user in the OCS distribution business model, there are two positive outcomes: first, the end user has more options to access the data; and second, the data provided is directly from NOAA servers and is therefore the most current data available. The advanced users with direct access to the .XML files containing chart metadata are able to design products and services to meet their customers’ needs by simplifying the chart updating process. This is important because NOAA chart product information is dynamic and changes daily for the ENCs and weekly for the RNCs. The business model work flow for the advanced users is shown in Diagram 1 below. Fundamentally, data is generated and packaged within OCS and uploaded to the WOC. The intent of the model is that advanced users, or users running commercially available software packages, can query the .XML product catalogs located on the www.charts.noaa.gov Website. The software analyzes the .XML files and synchronizes the local chart suite with the updated editions of the RNC and ENC files.
Files Synchronized and Served fromwww.charts.noaa.gov
Updated RNC and ENC files downloaded
.XML Product Catalogs Analyzed
Computer running commercial application which automatically updates
local chart suite
RNC Files
ENC Files
RNC Product Catalog
.XML format
ENC Product Catalog
.XML format
Files Generated and Packaged
Files Uploaded
Logical Diagram of Automated Distribution Infrastructure Diagram 1
Product Catalog .XML Structure

5
Automated processes using the infrastructure are reliant on the structure of the product catalogs for the ENC and RNC files. The following two sections of this paper describe each field in the product catalogs. In each catalog there are different fields to determine the currency of an ENC or a RNC chart product. The download locations for the product catalogs are listed in Table 1. ENC Product Catalog .XML For each ENC there is information that includes the tags <name>, <lname> (title), <src_chart> (equivalent raster chart number), <cscale> (equivalent raster chart scale), <coast_guard_districts> and <states>. Each ENC dataset is available for download as a .ZIP file. The <zipfile_location> tag includes the URL of download location, and the <zipfile_datetime> tag includes the date and time that the .ZIP file was created. By providing the <zipfile_location> link developers can write software which downloads requested files directly from the NOAA Website. This enables the distribution of the current chart products. Chart products need not be archived by third parties to be distributed. This mitigates the risk of outdated files being sent to mariners. ENCs have edition numbers and dates. The <edtn> tag is the Edition Number, the <updn> tag is the Update Number, the <uadt> tag is the Update Application date and the <isdt> tag is the Issue Date. The Update Application Date is the date that a Base Cell (000 file extension) is created. The Issue Date is the date that an Update Patch (001, 002, etc., file extension) is created. Software applications can be programmed to read the dates and editions of the ENCs in the Product Catalog .XML, compare this information against the dates and editions of the ENCs on the user’s local machine, and determine the ENCs that require updating. Those ENCs can be downloaded from the <zipfile_location> URL and installed on the local machine. Other information for each ENC includes the <nm_agency> tag which designates either the National Geospatial-Intelligence Agency (NGA) or U.S. Coast Guard, and the tags <doc> and <date> which represent the latest published document through which the ENC is cleared. The <cov> tag includes information describing the geographic coverage of the ENC. RNC Product Catalog .XML For each RNC there is information that includes the tags <number>, <title> (title), <coast_guard_districts> and <states>. Each RNC dataset is available for download as a .ZIP file. The <zipfile_location> tag includes the URL of download location, and the <zipfile_datetime> tag includes the date and time that the .ZIP file was created. RNCs have edition numbers and dates. These tags include the <source_edition> (equivalent to the paper chart), <raster_edition>, <ntm_edition> (Notice to Mariners edition), <source_date> (equivalent to the paper chart) and <ntm_date> (Notice to Mariners date). The Source Date is the date of the paper chart edition. The Notice to Mariners Date is the date when a new version of
6
the RNC is created. Every week a new version of each RNC is produced and uploaded. The RNCs each have an incremented Notice to Mariners edition number and a new Notice to Mariners date, and may or may not include an actual chart correction. There are additional tags that indicate the last time the RNC included a chart correction. These tags are <source_edition_last_correction>, <raster_edition_last_correction> and <ntm_edition_last_correction>. Software applications can be programmed to read the dates and editions of the RNCs in the Product Catalog .XML, compare this information against the dates and editions of the RNCs on the user’s local machine, and determine the RNCs that require updating. Those RNCs can be downloaded from the <zipfile_location> URL and installed on the local machine. Other information for each RNC includes the <nm_agency> tag which is NGA or U.S. Coast Guard, and the tags <doc> and <date> which represent the latest published document through which the RNC is cleared. The <cov> tag includes information describing the geographic coverage of the RNC.
Legal Requirements to Carry Updated Digital Charts
The International Maritime Organizations’ ECDIS Performance Standard resolution specifies the need for current ENCs and RNCs. It states that the chart information to be used in ECDIS should be the latest edition of that originated by a government authorized hydrographic office, should conform to IHO standards, and that it should be adequate and up-to-date for the intended voyage as required by regulation V/20 of the 1974 SOLAS Convention.
OCS updates on average 55 ENCs and 115 RNCs each week. The digital charts being distributed are the latest editions of ENCs and RNCs with all updates applied. ENCs are made available on a daily basis as they are updated. RNCs are distributed weekly as they are updated. This rapid update cycle makes it difficult for mariners to always have the latest chart information.
Developers Utilizing the Automated Distribution Infrastructure iNavX The first company known to utilize the automated distribution infrastructure was GPSNavX. GPSNavX provides mobile marine navigation software for Macs and iPhones. The iPhone software developed is called iNavX. This innovative application utilizes the RNC Product Catalog file to build a database from which users select the desired charts. Charts can be manually selected from the full database, or the database can be filtered to charts containing the iPhone’s GPS position. Once a chart is selected through the iNavX software, it is downloaded to the iPhone directly from NOAA servers. Charts can be downloaded via WiFi or cellular connection. Diagram 2 shows displays from the application in chart view and the database for chart selection based upon the user’s position.

7
Two Views in iNavX
Diagram 2 Rose Point Navigation Rose Point Navigation Systems enhanced their PC based ECS Coastal Explorer 2009 to utilize NOAA’s automated distribution infrastructure. Coastal Explorer features the ability to automatically query the RNC Product Catalog file and download the updated chart products to the mariner’s computer. The process, though complex behind the scene, is straight forward from the mariner’s perspective. When the mariner installs charts he or she selects the download/install chart button. The dialog box in Diagram 3 appears. If the mariner selects the “Change your chart subscription regions” option Diagram 4 appears. The mariner can select one or more U.S. Coast Guard districts (Diagram 4). Once Districts have been chosen, the mariner selects the “Check for chart updates option” (Diagram 3) and the chart updates are automatically installed. Behind the scenes Coastal Explorer queries the product catalog, compares it to files on the user’s computer (Diagram 5), downloads the updated RNCs (Diagram 6), unzips the files to the chart directory (Diagram 7) and then loads them into the Coastal Explorer database (Diagram 8). The images below show the simplicity of Coastal Explorer’s updating process. The ease of the process promotes recreational boaters having the most up-to-date charts, thereby increasing navigational safety.

8
Options for Downloading or Installing
Charts Diagram 3
Selecting Coast Guard Districts
Diagram 4
Chart Update Status Dialog Box
Diagram 5
Downloading Progress Bar
Diagram 6
Installing Progress Bar
Diagram 7
Updating Chart Portfolio Progress Bar
Diagram 8
BBN Technologies By utilizing the automated distribution infrastructure and other Web-based information, BBN Technologies has developed a Web page, chartserver.bbn.com, which displays all of the NOAA BSB charts quilted together in the Google Maps interface (Diagram 9). The Web page is a well designed interface that allows the selection of individual chart panels so that they are highlighted, allowing the entire panel to be viewable to its margins. With the whole panel

9
viewable the user can see chart notes, edition numbers, latitude and longitude scales and other chart metadata information depicted on a paper chart. ChartViewport has a toggle button allowing Markers to pinpoint the locations on a chart where corrections have been applied (Diagram 10). When a Marker is selected then an Info Window pops up, displaying information about that particular critical correction. ChartViewport allows charts to be downloaded by linking back to the .ZIP file stored on the www.charts.noaa.gov site. BBN Technologies keeps ChartViewport up-to-date with a backend application that reads the RNC Product Catalog file, the updated RNCs, and the chart updates listed on the Local Notice to Mariners Website. This information is then processed and posted.
ChartViewport Web page
Diagram 9

10
Marker Selected with an Info Window Pop Up
Diagram 10 Evaluation of Metrics A careful analysis of available metrics indicates that the automated distribution infrastructure is successful. The number of hits and number of charts downloaded have increased dramatically over the last 10 months due to the automated distribution infrastructure. During this same period Web site hits and downloads from the existing distribution system remain unchanged. OCS is pursuing multiple distribution mechanisms in order to meet the needs of a diverse customer base. Web statistics allow OCS to calculate the number of charts downloaded each month. The number of downloads attributable to iNavX and Coastal Explorer 2009 can be determined because each package has a User Agent name that is logged with each chart download. This provides the data needed to understand the efficacy of the automated distribution infrastructure. One method to determine the success of the new automated data infrastructure is to compare it to distribution during the year before the existence of the infrastructure. The average number of RNCs downloaded per month during the 1st quarter of CY08 was 155,171. The average number of RNCs downloaded per month during the 1st quarter of CY09 was 271,228. The increase number of downloads from 1st quarter of CY08 to 1st quarter CY09 is 116,057, with 90,749 being attributable to the automated distribution infrastructure. This is an increase in downloads by 74.8% over the same quarter for CY08, of which 78.2% of the increase is a result of the automated distribution infrastructure.
11
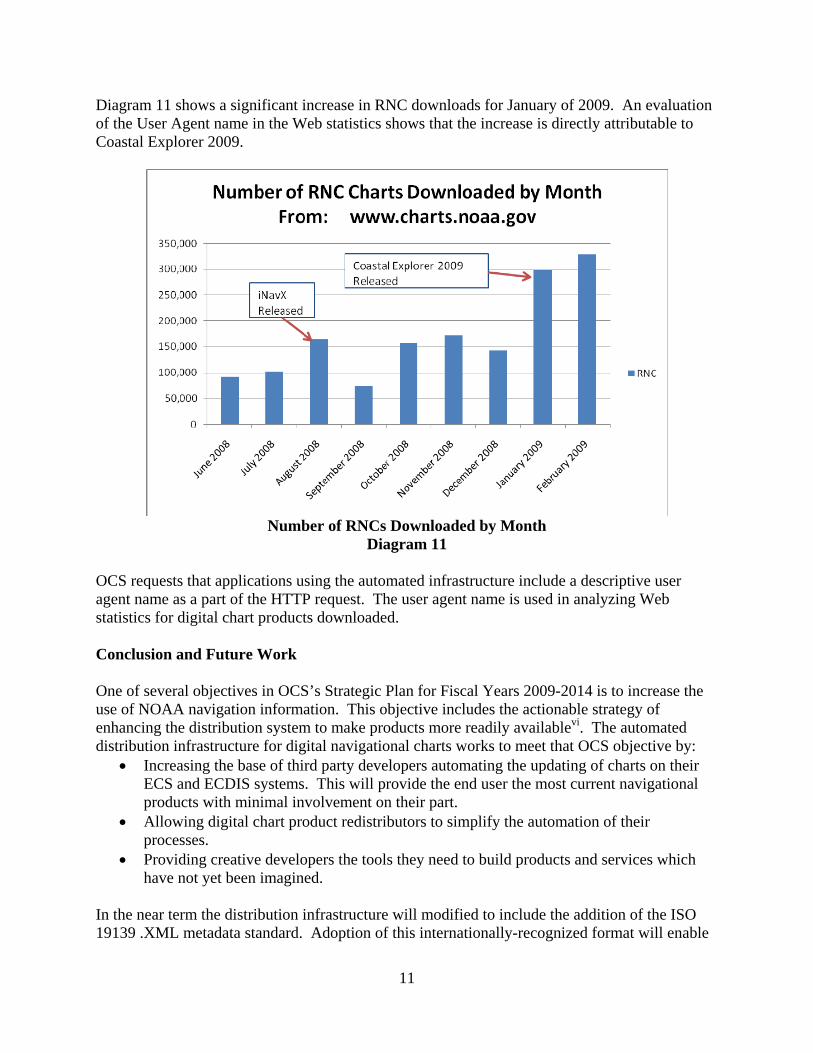
Diagram 11 shows a significant increase in RNC downloads for January of 2009. An evaluation of the User Agent name in the Web statistics shows that the increase is directly attributable to Coastal Explorer 2009.
Number of RNCs Downloaded by Month
Diagram 11 OCS requests that applications using the automated infrastructure include a descriptive user agent name as a part of the HTTP request. The user agent name is used in analyzing Web statistics for digital chart products downloaded. Conclusion and Future Work One of several objectives in OCS’s Strategic Plan for Fiscal Years 2009-2014 is to increase the use of NOAA navigation information. This objective includes the actionable strategy of enhancing the distribution system to make products more readily availablevi. The automated distribution infrastructure for digital navigational charts works to meet that OCS objective by:
• Increasing the base of third party developers automating the updating of charts on their ECS and ECDIS systems. This will provide the end user the most current navigational products with minimal involvement on their part.
• Allowing digital chart product redistributors to simplify the automation of their processes.
• Providing creative developers the tools they need to build products and services which have not yet been imagined.
In the near term the distribution infrastructure will modified to include the addition of the ISO 19139 .XML metadata standard. Adoption of this internationally-recognized format will enable

12
potential users who are unfamiliar with NOAA’s nautical charts to search and find products more easily by searching and coding against a documented standard. Based upon the standard, there will be an individual .XML file for each chart product. These files will supplement the monolithic ENC and RNC .XML product catalogue files. The monolithic product catalogues are limited in that they have no published schema and use in-house terminology which may not be understood internationally. Another advantage of utilizing the standard is that each product will have an individual .XML file. When checking to see if a file is updated it only requires analyzing a small file instead of downloading a 3 MB dataset for the entire chart suite. Because of increasing wireless and satellite internet connectivity, it is anticipated that ECDIS and ECS developers will include automated chart download capability in their software. This will enable their users to quickly and easily update their charts, ensuring the most recent versions are in use during near coastal transits such as entering port. Developers interested in more information about the automated distribution infrastructure should contact OCS via the Inquiries and Discrepancies page, located at www.nauticalcharts.noaa.gov. From the OCS home page, select the “Contact” and then “Submit an Inquiry” links. References i NOAA’s Office of Program Planning and Integration, 2008, National Oceanic & Atmospheric Administration Strategic Plan FY 2009-2014. ii NOAA’s National Marine Fisheries Service, 2006, Fisheries Economics of the United States 2006. iii U.S. Coast Guard, 2006, 2006 Boating Statistics. iv NOAA’s Office of Coast Survey, NOAA’s Office of Coast Survey 2009-2014 Strategic Plan v NOAA’s Office of Coast Survey, 2008, National Oceanic and Atmospheric Administration NOS Nautical Charting System 6501 Operational Analysis 2007. vi NOAA’s Office of Coast Survey, NOAA’s Office of Coast Survey 2009-2014 Strategic Plan
Recommended


![2010 Half Year Financial Results FINAL.ppt [Read-Only]...Profit before tax and amortisation up by 53% HY10 HY09 £m £m Revenue 501.1 492.0 EBITA before restructuring and one‐off](https://img.dokumen.tips/doc/110x75/5f5b73bbb2fd354c9247ebb6/2010-half-year-financial-results-finalppt-read-only-profit-before-tax-and.jpg)


![2010 Half Year Financial Results FINAL.ppt [Read-Only] · Profit before tax and amortisation up by 53% HY10 HY09 £m £m Revenue 501.1 492.0 EBITA before restructuring and one‐off](https://img.dokumen.tips/doc/110x75/5f519371cfea8c66d42f0603/2010-half-year-financial-results-finalppt-read-only-profit-before-tax-and-amortisation.jpg)