A SEMINAR PAPER ON
Nitrogen Use Efficiency in Cereal Crops in Bangladesh
Course Title: Seminar
Course Code: SSC 598
Term: Summer, 2018
Submitted To:
Course Instructors Major Professor
1. Dr. Md. Mizanur Rahman Dr. G. K. M. Mustafizur Rahman
Professor Professor
BSMRAU Department of Soil Science
2. Dr. A. K. M. Aminul Islam BSMRAU
Professor
BSMRAU
3. Dr. Md. Rafiqul Islam
Professor
BSMRAU
4. Dr. Dinesh Chandra Shaha
Professor
BSMRAU
Submitted By:
Md. Nahidul Islam Nahid
MS Student
Reg. No: 13-05-2931
Department of Soil Science
BANGABANDHU SHEIKH MUJIBUR RAHMAN AGRICULTURAL UNIVERSITY,
SALNA, GAZIPUR-1706
I
ABSTRACT
Cereal crops play a vital role in ensuring national food security of Bangladesh. Cereal crops
contribute a lot to the agricultural sector of Bangladesh. Cereal crops in Bangladesh
especially rice and wheat are very much responsive to nitrogenous fertilizer. The present
condition of nitrogen use efficiency (NUE) in cereals is not up to the mark. The efficiency of
applied nitrogenous fertilizers is less than 50% due to different types of losses such as
denitrification, volatilization, surface runoff and leaching from soil-plant system.
Improvement of present condition of nitrogen use efficiency (NUE) is very essential to
increase the production of cereal crops as well as to reduce the cost of production. Urea super
granule (USG) can play a great role as a nitrogenous fertilizer to improve the efficiency of
nitrogen use in cereal crops. Besides, crop improvement and need-based fertilizer
management are very important. Nitrogen use efficiency need to be in an acceptable limit so
that grain yield can be improved through optimum application of nitrogen.
II
TABLE OF CONTENTS
SL. NO. TITLE
PAGE
1 ABSTRACT
I
2 TABLE OF CONTENTS II
3 LIST OF TABLES III
4 LIST OF FIGURES IV
5
INTRODUCTION
1-3
6
MATERIALS AND METHODS
4
7 REVIEW OF FINDINGS
4-20
8 CONCLUSION
21
9 REFERENCES
22-26
III
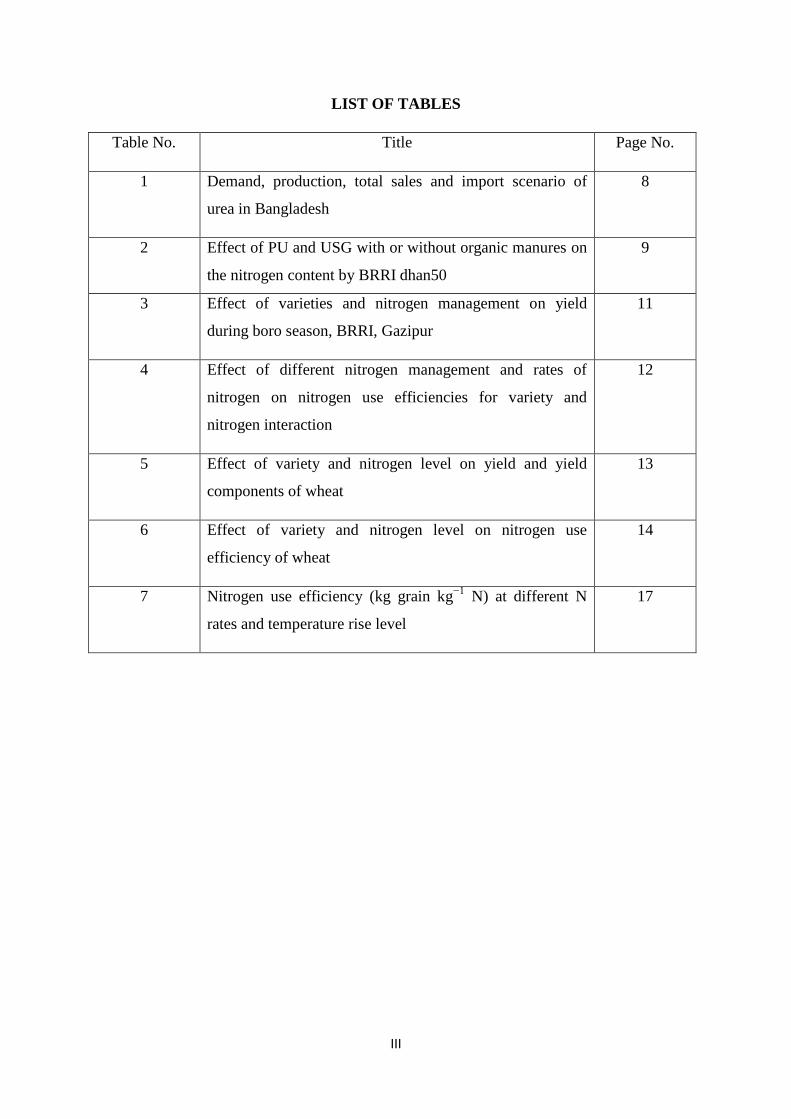
LIST OF TABLES
Table No. Title Page No.
1 Demand, production, total sales and import scenario of
urea in Bangladesh
8
2 Effect of PU and USG with or without organic manures on
the nitrogen content by BRRI dhan50
9
3 Effect of varieties and nitrogen management on yield
during boro season, BRRI, Gazipur
11
4 Effect of different nitrogen management and rates of
nitrogen on nitrogen use efficiencies for variety and
nitrogen interaction
12
5 Effect of variety and nitrogen level on yield and yield
components of wheat
13
6 Effect of variety and nitrogen level on nitrogen use
efficiency of wheat
14
7 Nitrogen use efficiency (kg grain kg−1
N) at different N
rates and temperature rise level
17
IV
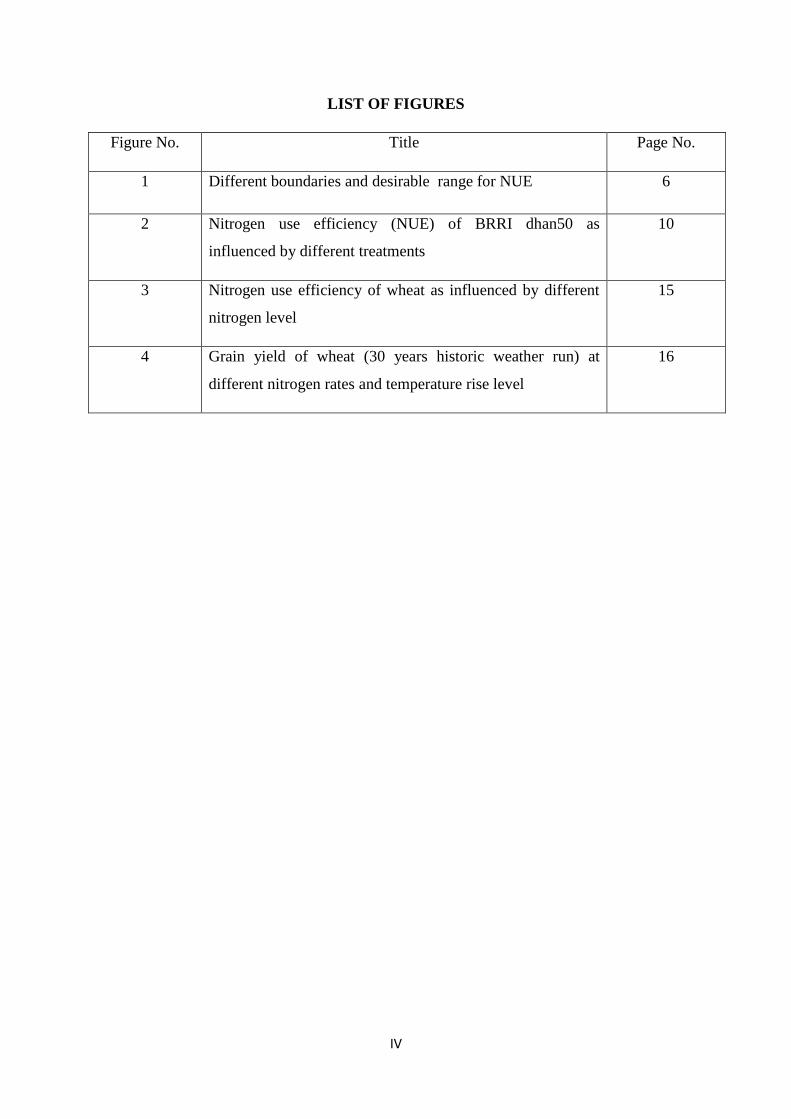
LIST OF FIGURES
Figure No. Title Page No.
1 Different boundaries and desirable range for NUE 6
2 Nitrogen use efficiency (NUE) of BRRI dhan50 as
influenced by different treatments
10
3 Nitrogen use efficiency of wheat as influenced by different
nitrogen level
15
4 Grain yield of wheat (30 years historic weather run) at
different nitrogen rates and temperature rise level
16
1
CHAPTER I
INTRODUCTION
Bangladesh is an agricultural country having a higher rate of population growth. It is one of
the most densely populated nations in the world. The economy of Bangladesh is largely
dependent on its agricultural sector. More than 80% population of the country depends on
agriculture directly or indirectly as their chief source of livelihood (Shah et al., 2008). The
main purpose of agriculture is to provide food for the overgrowing population. To meet the
food requirement of almost 160 million people it needs to produce a huge amount of food
every year. Though Bangladesh has achieved food security in the recent past but it still faces
huge challenges in maintaining this achievement. This is because of its overgrowing
population, changes in food habits and little or no space for the expansion of cropland as well
as cropping intensity (Timsina et al., 2016). In Bangladesh, the structure of the agricultural
sector is largely dependent on the cereal crops production like other South-Asian countries
(Ghose et al., 2014).
Cereals are generally the crops of Gramineae family. They are usually grown for their
palatable, nutritious and starchy seeds. According to the concept of FAO, cereals are refers to
crops harvested for their dry grain only. For marketing purpose, the production data on
cereals are stated in terms of clean, dry mass of grains with a moisture content of 12 to 14
percent. In addition to moisture content and other inedible elements (e.g. cellulose), cereal
grains also contain a trace amount of minerals and vitamins, carbohydrates mainly starches
which comprise about 65 to 75 percent of their whole as well as proteins which is 6 to 12
percent and about 1 to 5 percent fat (FAO, 2014). In Bangladesh major cereal crops including
rice (aus, aman, boro), wheat and minor cereal crops like, maize, barley, cheena, jowar, bajra,
kaon etc. covered a total area of 30.03 million acres of land with the production of 38.33
million metric tons of food grains. Major cereals covered a land area of 29.22 million acres
with the production of 36.05 million metric tons of food grains while minor cereals covered a
land area of only 0.81 million acres with the production of 2.28 million metric tons of food
grains. Among the major cereals rice (aus, aman, boro) covered a land area of 28.20 million
acres with the production of 34.71 million metric tons of food grain and wheat covered a land
area of 1.07 million acres with the production of 1.34 million metric tons of food grains
(BBS, 2015).
2
Rice occupies the top position among all the cereals with almost 75 percent of the total
cropped area under rice cultivation. It easily can be said that the main crop for entire
agricultural sector of Bangladesh is rice. On the other hand, wheat and maize have some
presence in Bangladesh among the other cereals (Ganesh-Kumar et al., 2012).
For improving crop yields and farm profit fertilizer is considered as the principal inputs. In
case of agricultural sector of Bangladesh this is also true, because the country has hardly any
possibility of expanding its cultivable land area. For this, the production of food of this
country can be accelerated through improving irrigation facilities alongside better practice of
fertilizer as well as high yielding variety (HYV) (Shah et al., 2008). Fertilizer is mainly
recommended for crop plants to supply essential nutrient element throughout the growth and
development period. Among the all essential nutrient elements nitrogen is needed most for
crop plants. To supply nitrogen mainly urea fertilizer is used which contains about 46%
nitrogen. Plants require in large amounts of nitrogen for growth and development. High
nitrogen fertilization enables maximum crop yields which are the scenario of industrial
countries in the last 50 years. There is a dramatic increase in the use of synthetic nitrogen
fertilizers in the last 50 years to meet the agricultural needs of a growing population (Conant
et al., 2013). On the other hand, in case of developing countries, there is limited access to
nitrogen fertilizer as well as inadequate nitrogen nutrition consequences in low crop
productivity which ultimately leads to a reduction in food supply (Brown et al., 2009).
In most terrestrial ecosystems the availability of nitrogen is one of the major limiting factors
for primary productivity (Cole et al., 2008). The farmers of Bangladesh use a considerable
amount of urea fertilizer to meet the requirement of nitrogen for the production of rice and
wheat. But a large portion of this fertilizer can not be utilized by the crop plants due to lower
nitrogen use efficiency (NUE). Crop plant can use only 30-50% applied nitrogen efficiently
which is sometimes even lower than that value (Prasad et al., 1979). Nitrogen use efficiency
(NUE) is very important factor for crop production, particularly for cereal crops. The value of
NUE differs from crop to crop. Efficient use of nitrogen is very important to maintain the
economic sustainability of cropping systems. The definition of NUE depends on the purpose
to which the indicator will be placed. By using partial nutrient balance NUE can be
measured. This is also known as the removal/use ratio or the output/input ratio. This indicator
is resultant from the totality of nitrogen in all of the yields removed from the field (i.e., the
harvested crop) and the totality of whole inputs of N to the crop field, farm or region. (i.e.,
fertilizer, imported animal manure, compost, green manure or other soil amendments,
3
imported animal feed, and biological N fixation). The value of NUE reflects the quantity of
nitrogen recovered in yield which is related to the quantity of nitrogen incoming to the site
(Norton et al., 2015). The lower value of NUE in cereal crops is occurred due to different
types of losses such as ammonia volatilization, leaching of nitrate nitrogen, surface run-off,
and denitrification. This lower NUE value is responsible for higher cost of crop production as
well as for environmental pollution. Enhancing nitrogen use efficiency is required for the
improvement of crop yields, to lessen the cost of production and to uphold environmental
quality. Nitrogen use efficiency in agriculture can be improved through integrated nitrogen
management approaches which take into consideration better-quality fertilizer accompanied
by proper soil and crop management practices (Fageria et al., 2005).
Keeping these above considerations in view, the present study has aimed with the following
objectives:
1. To review nitrogen use efficiency in cereal crops in Bangladesh, and
2. To know the approaches to improve nitrogen use efficiency in cereal crops.
4
CHAPTER II
MATERIALS & METHODS
This paper is exclusively a review paper so that all of the information has been collected from
the secondary sources. During the preparation of the review paper, I went through various
relevant books, journals publications etc. The related topics have been reviewed with the help
of library facilities of Bangabandhu Sheikh Mujibur Rahman Agricultural University
(BSMRAU), Bangladesh Agricultural Research Institute (BARI) and Bangladesh Rice
Research Institute (BRRI) and internet browsing. After collecting all the available
information, it has been presented as per the objectives of this paper.
5
CHAPTER III
REVIEW OF FINDINGS
Nitrogen (N)
Nitrogen is a primary essential nutrient for plant growth and development. In many organic
compounds (protein, nucleic acids, alkaloids etc.) nitrogen is acting as principal component.
Nitrogen is an essential part of adenosine diphosphate (ADP) and adenosine triphosphate
(ATP). ADP and ATP play a key role in energy use, transfer and release in various metabolic
processes of plants (Riedell et al., 1996). Nitrogen is also an important part of nucleic acid
(deoxyribonucleic acid and ribonucleic acid) which play a vital role in plants genetic
inheritance. Chlorophyll which acts as a factory for plants photosynthetic activity is
composed of nitrogen. Nitrogen has special significance in absorption of water and nutrients
through improving the root system (Fageria and Barbosa, 2001).
Nitrogen use efficiency (NUE)
For achieving high yields with the minimization of the rates of nitrogen fertilization and
limited environmental side effects related to nitrogen leaching, optimization of fertilizer use
and improvement of NUE is needed now (Agostini et al., 2010; Burns, 2006). Nitrogen use
efficiency can be calculated through evaluating the ability of crops to uptake nitrogen from
the soil (Burns, 2006), and the efficiency with which the absorbed nitrogen is used by the
crop for its growth and yield (Schenk, 2006). The value of NUE may differ within the same
crop because it depends on different organs and mechanisms and on different environmental
factors (Burns, 2006). NUE can be calculated as the ratio between the amount of fertilizer N
removed with the crop and the amount of fertilizer N applied (Brentrup, 2010). Agronomic
nitrogen use efficiency or simply nitrogen use efficiency (NUE) can be calculated with the
help of the following formula (Krupnik et al., 2015):
Agronomic nitrogen use efficiency = ( GYF –GY0) / FN
Where, GYF = Grain yield (kg ha−1
) in nitrogen-fertilized plot; GY0 = Grain yield (kg ha−1
) in
zero nitrogen-fertilized plot or control plot and FN= Total applied nitrogen fertilizer (kg ha−1
).
6
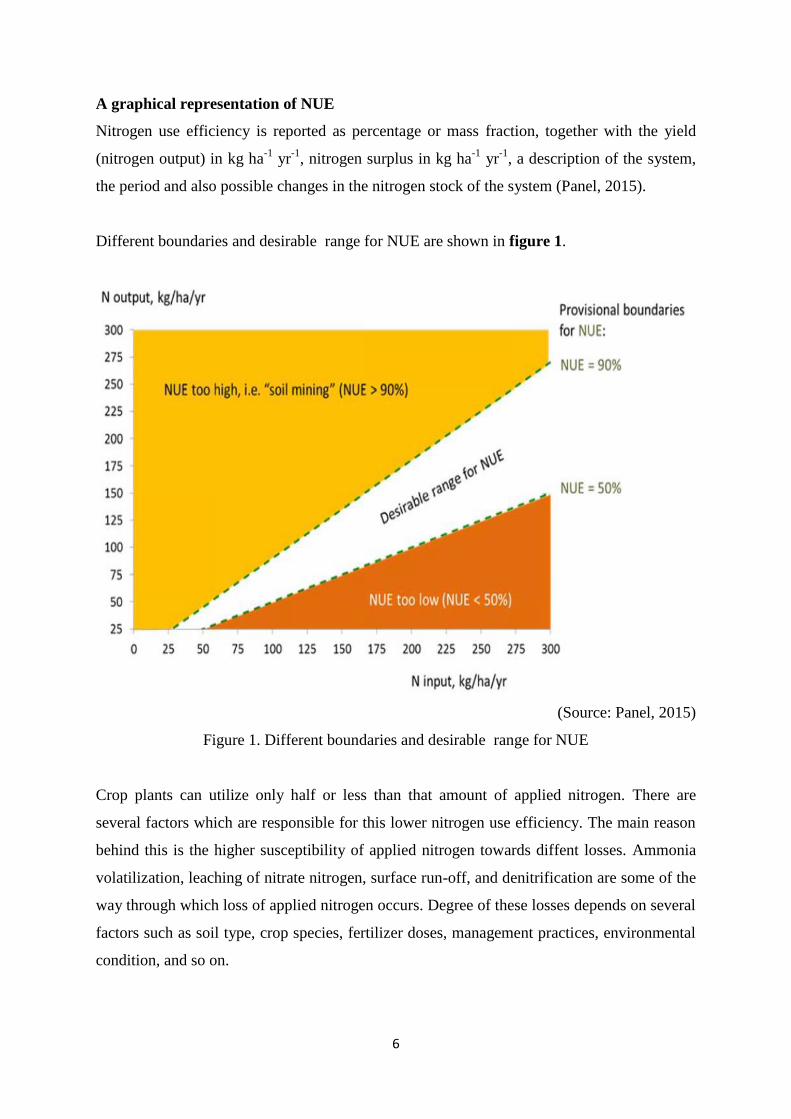
A graphical representation of NUE
Nitrogen use efficiency is reported as percentage or mass fraction, together with the yield
(nitrogen output) in kg ha-1
yr-1
, nitrogen surplus in kg ha-1
yr-1
, a description of the system,
the period and also possible changes in the nitrogen stock of the system (Panel, 2015).
Different boundaries and desirable range for NUE are shown in figure 1.
(Source: Panel, 2015)
Figure 1. Different boundaries and desirable range for NUE
Crop plants can utilize only half or less than that amount of applied nitrogen. There are
several factors which are responsible for this lower nitrogen use efficiency. The main reason
behind this is the higher susceptibility of applied nitrogen towards diffent losses. Ammonia
volatilization, leaching of nitrate nitrogen, surface run-off, and denitrification are some of the
way through which loss of applied nitrogen occurs. Degree of these losses depends on several
factors such as soil type, crop species, fertilizer doses, management practices, environmental
condition, and so on.
7
Factors influencing nitrogen use efficiency (NUE)
Efficient use of nitrogen by crops depends on a number of factors. These can be discussed in
three parts:
Demand of N: Demand of N by crops related to climatic variables such as ambient
temperature, solar radiation, amount of rainfall and relative humidity. These factors
and their interaction influence crop demand of N as well as health of crop plants
(Kravchecko et al., 2003).
Supply of N: Supply of N depends on mineralization of N from soil organic matter as
well as N through chemical fertilizers which are applied externally. The contribution
of chemical fertilizer to N supply is higher than soil organic matter because of their
higher mineralization rate. Mineralization rate of N of soil is mostly influenced by
some factors such as moisture availability, temperature, aeration and activity of
microbial population. For example, low soil moisture with mild soil temperature can
reduce the rate of N mineralization from organic sources (Giller et al., 2004).
Losses of N: Nitrogen demand can be increased due to optimum conditions for plant
growth and development. But, because of higher rate of N loss low recovery of
applied N occurs (Mosier et al., 2001).
Approaches to improve nitrogen use efficiency
Soil, water and crop management
Site specific nitrogen management
Conservation agricultural practices
Use of controlled and slow release fertilizers
Use of manure and organic amendments
Improved crop varities
Methods of fertilizer application
Crop improvement
Among the cereals rice and wheat are mainly grown for consumption purpose in Bangladesh.
To meet the requirement of overgrowing population farmers of this country need to increase
the production every year. For this, they use a huge amount of chemical fertilizers along with
other improved technologies such as improved seeds, HYV (High Yielding Varieties),
pesticides, modern technologies and management practices.
8
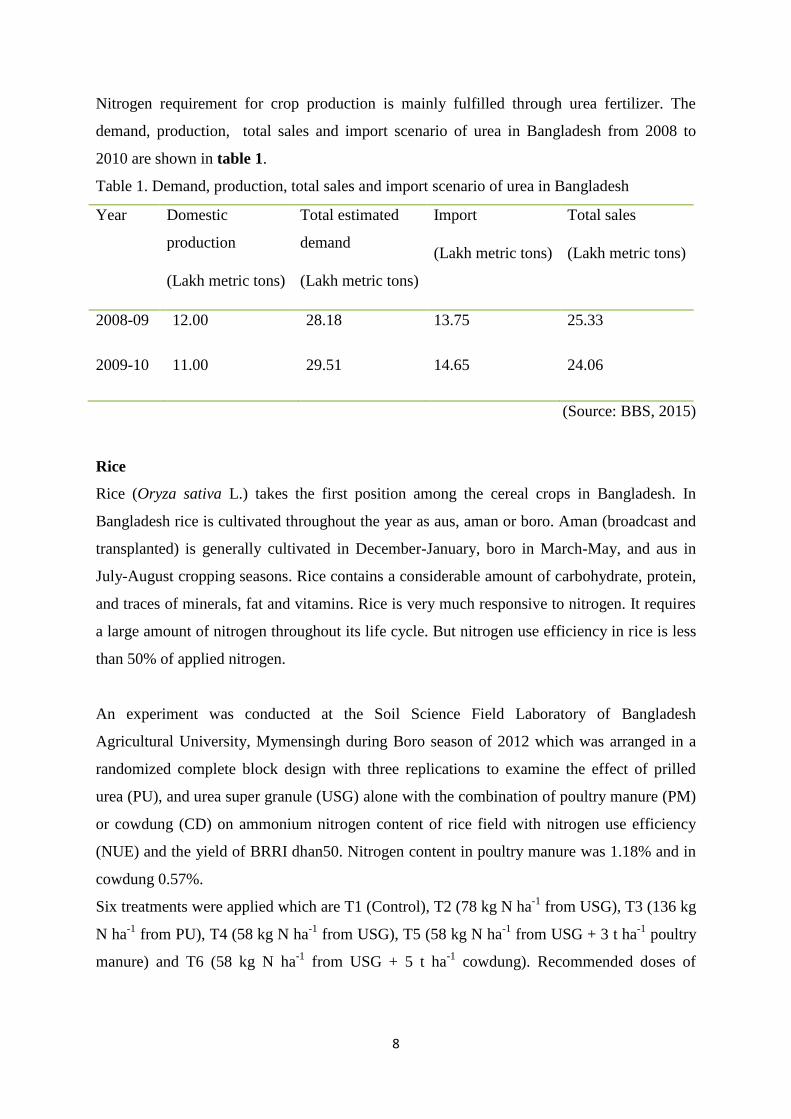
Nitrogen requirement for crop production is mainly fulfilled through urea fertilizer. The
demand, production, total sales and import scenario of urea in Bangladesh from 2008 to
2010 are shown in table 1.
Table 1. Demand, production, total sales and import scenario of urea in Bangladesh
Year Domestic
production
(Lakh metric tons)
Total estimated
demand
(Lakh metric tons)
Import
(Lakh metric tons)
Total sales
(Lakh metric tons)
2008-09 12.00 28.18 13.75 25.33
2009-10 11.00 29.51 14.65 24.06
(Source: BBS, 2015)
Rice
Rice (Oryza sativa L.) takes the first position among the cereal crops in Bangladesh. In
Bangladesh rice is cultivated throughout the year as aus, aman or boro. Aman (broadcast and
transplanted) is generally cultivated in December-January, boro in March-May, and aus in
July-August cropping seasons. Rice contains a considerable amount of carbohydrate, protein,
and traces of minerals, fat and vitamins. Rice is very much responsive to nitrogen. It requires
a large amount of nitrogen throughout its life cycle. But nitrogen use efficiency in rice is less
than 50% of applied nitrogen.
An experiment was conducted at the Soil Science Field Laboratory of Bangladesh
Agricultural University, Mymensingh during Boro season of 2012 which was arranged in a
randomized complete block design with three replications to examine the effect of prilled
urea (PU), and urea super granule (USG) alone with the combination of poultry manure (PM)
or cowdung (CD) on ammonium nitrogen content of rice field with nitrogen use efficiency
(NUE) and the yield of BRRI dhan50. Nitrogen content in poultry manure was 1.18% and in
cowdung 0.57%.
Six treatments were applied which are T1 (Control), T2 (78 kg N ha-1
from USG), T3 (136 kg
N ha-1
from PU), T4 (58 kg N ha-1
from USG), T5 (58 kg N ha-1
from USG + 3 t ha-1
poultry
manure) and T6 (58 kg N ha-1
from USG + 5 t ha-1
cowdung). Recommended doses of
9
phosphorus, potassium, sulphur and zinc fertilizers were applied to all plots (Husan et al.,
2014).
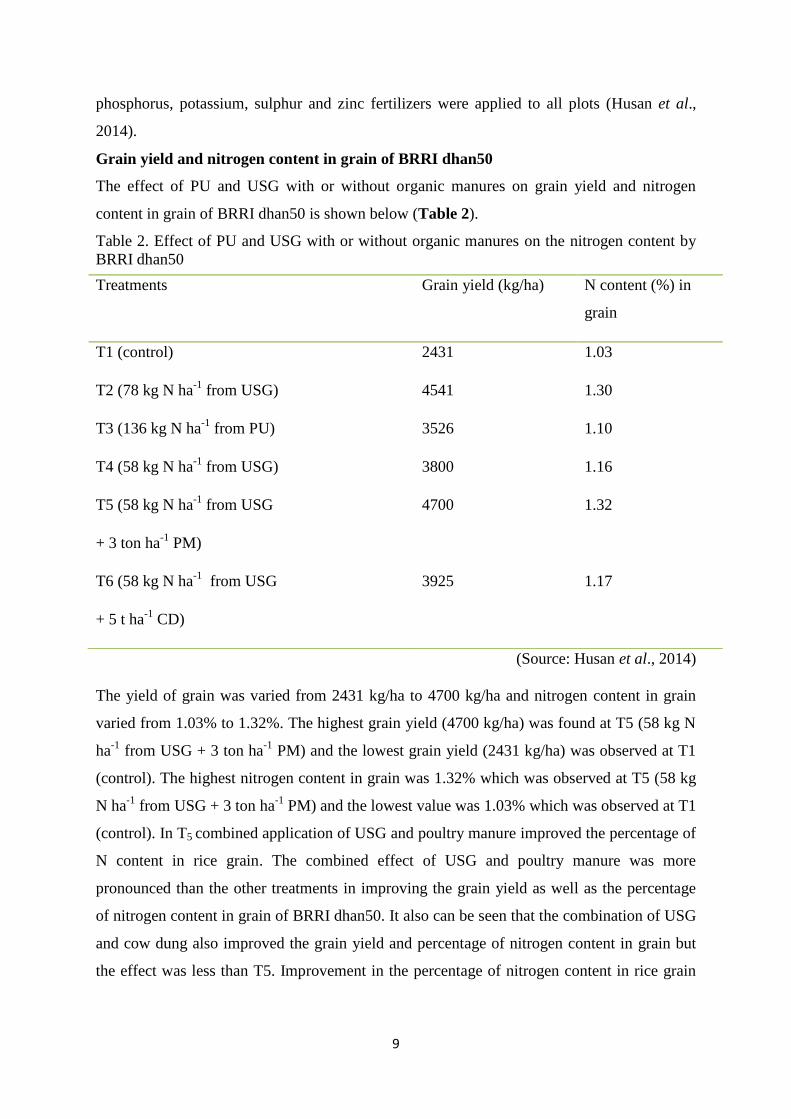
Grain yield and nitrogen content in grain of BRRI dhan50
The effect of PU and USG with or without organic manures on grain yield and nitrogen
content in grain of BRRI dhan50 is shown below (Table 2).
Table 2. Effect of PU and USG with or without organic manures on the nitrogen content by
BRRI dhan50
(Source: Husan et al., 2014)
The yield of grain was varied from 2431 kg/ha to 4700 kg/ha and nitrogen content in grain
varied from 1.03% to 1.32%. The highest grain yield (4700 kg/ha) was found at T5 (58 kg N
ha-1
from USG + 3 ton ha-1
PM) and the lowest grain yield (2431 kg/ha) was observed at T1
(control). The highest nitrogen content in grain was 1.32% which was observed at T5 (58 kg
N ha-1
from USG + 3 ton ha-1
PM) and the lowest value was 1.03% which was observed at T1
(control). In T5 combined application of USG and poultry manure improved the percentage of
N content in rice grain. The combined effect of USG and poultry manure was more
pronounced than the other treatments in improving the grain yield as well as the percentage
of nitrogen content in grain of BRRI dhan50. It also can be seen that the combination of USG
and cow dung also improved the grain yield and percentage of nitrogen content in grain but
the effect was less than T5. Improvement in the percentage of nitrogen content in rice grain
Treatments Grain yield (kg/ha) N content (%) in
grain
T1 (control) 2431 1.03
T2 (78 kg N ha-1
from USG) 4541 1.30
T3 (136 kg N ha-1
from PU) 3526 1.10
T4 (58 kg N ha-1
from USG) 3800 1.16
T5 (58 kg N ha-1
from USG
+ 3 ton ha-1
PM)
4700 1.32
T6 (58 kg N ha-1
from USG
+ 5 t ha-1
CD)
3925 1.17
10
due to the application of fertilizers and manures was also reported by Bhaskaram and Krisna,
(2009).
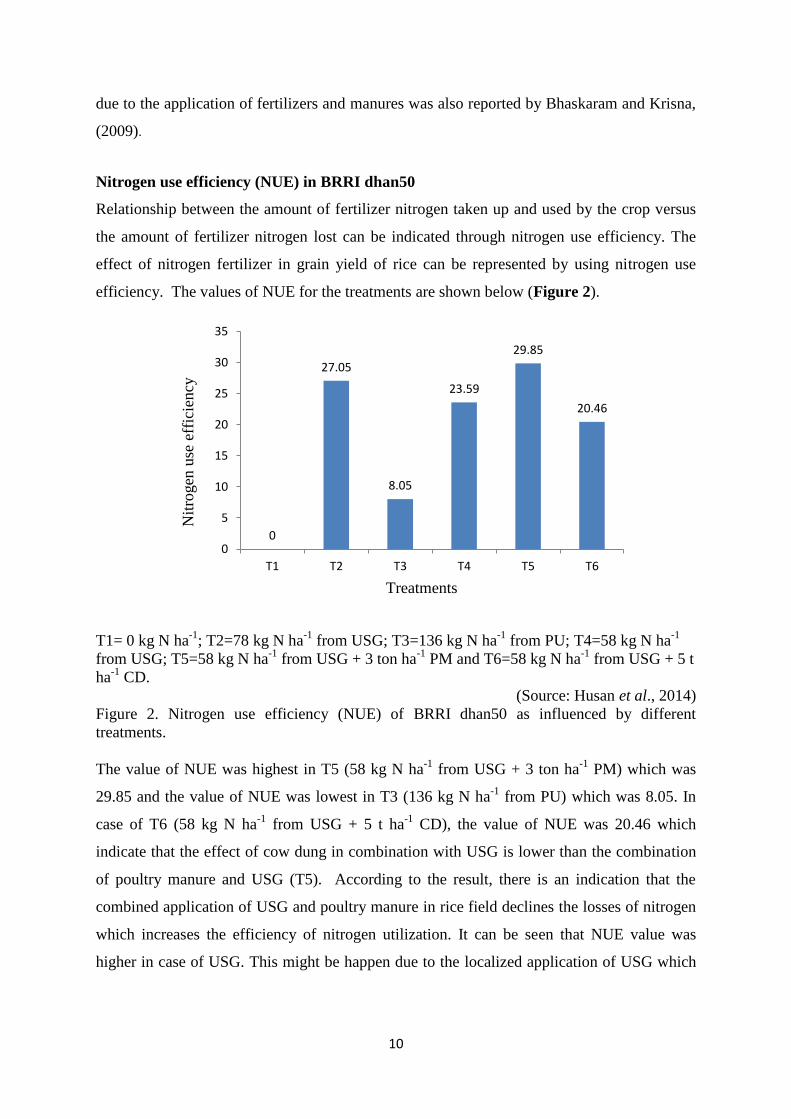
Nitrogen use efficiency (NUE) in BRRI dhan50
Relationship between the amount of fertilizer nitrogen taken up and used by the crop versus
the amount of fertilizer nitrogen lost can be indicated through nitrogen use efficiency. The
effect of nitrogen fertilizer in grain yield of rice can be represented by using nitrogen use
efficiency. The values of NUE for the treatments are shown below (Figure 2).
T1= 0 kg N ha-1
; T2=78 kg N ha-1
from USG; T3=136 kg N ha-1
from PU; T4=58 kg N ha-1
from USG; T5=58 kg N ha-1
from USG + 3 ton ha-1
PM and T6=58 kg N ha-1
from USG + 5 t
ha-1
CD.
(Source: Husan et al., 2014)
Figure 2. Nitrogen use efficiency (NUE) of BRRI dhan50 as influenced by different
treatments.
The value of NUE was highest in T5 (58 kg N ha-1
from USG + 3 ton ha-1
PM) which was
29.85 and the value of NUE was lowest in T3 (136 kg N ha-1
from PU) which was 8.05. In
case of T6 (58 kg N ha-1
from USG + 5 t ha-1
CD), the value of NUE was 20.46 which
indicate that the effect of cow dung in combination with USG is lower than the combination
of poultry manure and USG (T5). According to the result, there is an indication that the
combined application of USG and poultry manure in rice field declines the losses of nitrogen
which increases the efficiency of nitrogen utilization. It can be seen that NUE value was
higher in case of USG. This might be happen due to the localized application of USG which
0
27.05
8.05
23.59
29.85
20.46
0
5
10
15
20
25
30
35
T1 T2 T3 T4 T5 T6
Treatments
Nit
rogen
use
eff
icie
ncy
11
minimized the losses as well as increased NUE value. Similar type of results was also
reported by Akter et al. (2012) and Jahan et al. (2014).
Another experiment was carried out at the farm of Bangladesh Rice Research Institute,
Gazipur during boro season of 2013-14 and 2014-15 to figure out nitrogen use efficiencies
and response of BRRI dhan28 and BRRI dhan29 under four N management practices. The
practices were 1) urea application by prilled urea (PU) applicator, 2) urea super granule
(USG) (2.7 g) application by USG applicator, 3) hand broadcasting of prilled urea in three
splits and iv) without urea (control). Factorial randomized complete block design with three
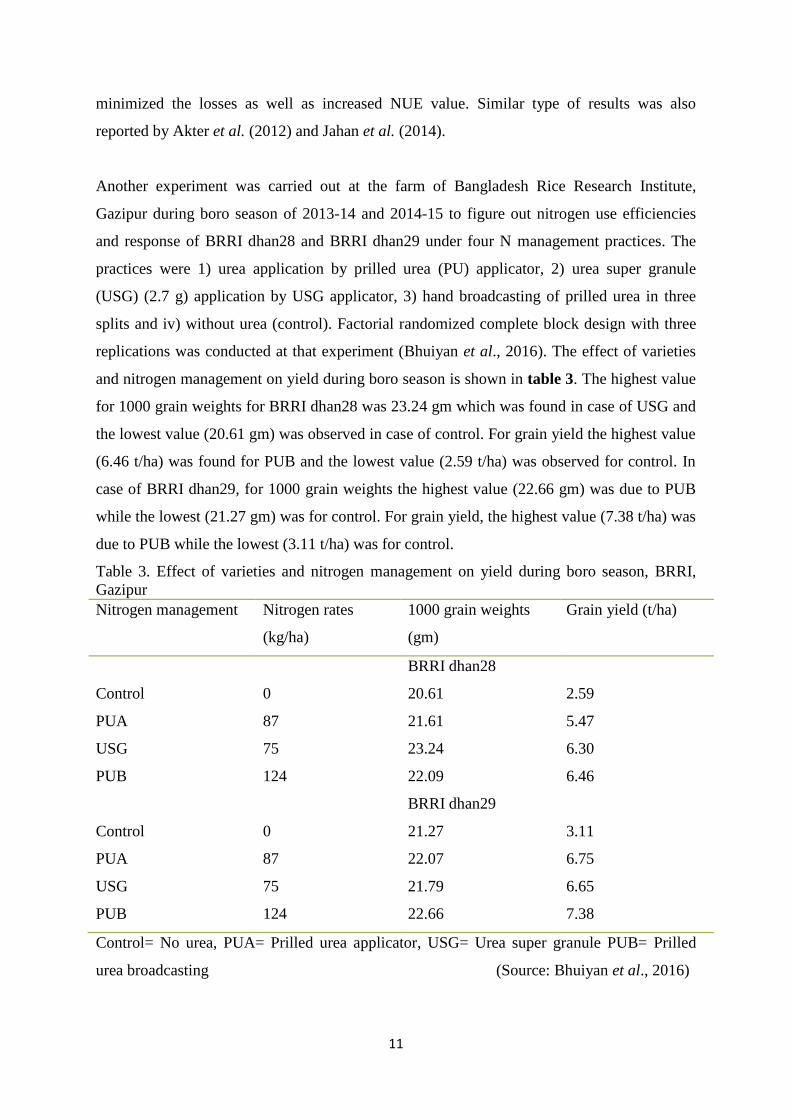
replications was conducted at that experiment (Bhuiyan et al., 2016). The effect of varieties
and nitrogen management on yield during boro season is shown in table 3. The highest value
for 1000 grain weights for BRRI dhan28 was 23.24 gm which was found in case of USG and
the lowest value (20.61 gm) was observed in case of control. For grain yield the highest value
(6.46 t/ha) was found for PUB and the lowest value (2.59 t/ha) was observed for control. In
case of BRRI dhan29, for 1000 grain weights the highest value (22.66 gm) was due to PUB
while the lowest (21.27 gm) was for control. For grain yield, the highest value (7.38 t/ha) was
due to PUB while the lowest (3.11 t/ha) was for control.
Table 3. Effect of varieties and nitrogen management on yield during boro season, BRRI,
Gazipur
Nitrogen management Nitrogen rates
(kg/ha)
1000 grain weights
(gm)
Grain yield (t/ha)
BRRI dhan28
Control 0 20.61 2.59
PUA 87 21.61 5.47
USG 75 23.24 6.30
PUB 124 22.09 6.46
BRRI dhan29
Control 0 21.27 3.11
PUA 87 22.07 6.75
USG 75 21.79 6.65
PUB 124 22.66 7.38
Control= No urea, PUA= Prilled urea applicator, USG= Urea super granule PUB= Prilled
urea broadcasting (Source: Bhuiyan et al., 2016)
12
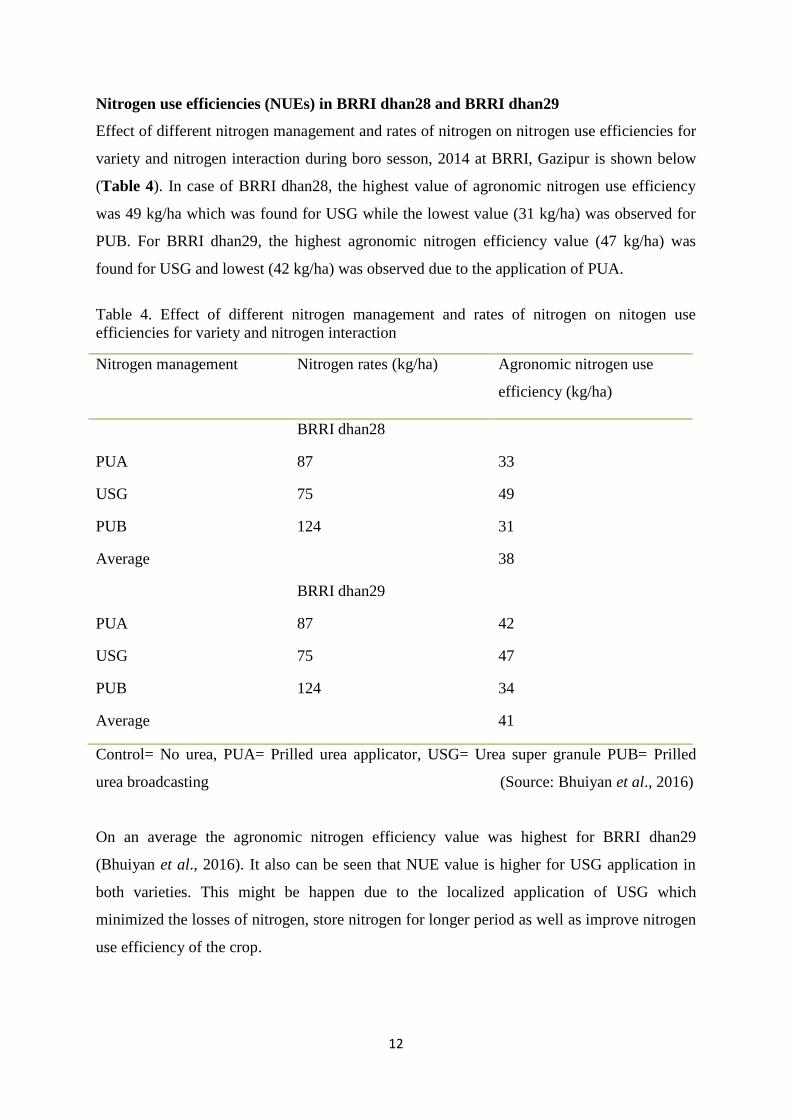
Nitrogen use efficiencies (NUEs) in BRRI dhan28 and BRRI dhan29
Effect of different nitrogen management and rates of nitrogen on nitrogen use efficiencies for
variety and nitrogen interaction during boro sesson, 2014 at BRRI, Gazipur is shown below
(Table 4). In case of BRRI dhan28, the highest value of agronomic nitrogen use efficiency
was 49 kg/ha which was found for USG while the lowest value (31 kg/ha) was observed for
PUB. For BRRI dhan29, the highest agronomic nitrogen efficiency value (47 kg/ha) was
found for USG and lowest (42 kg/ha) was observed due to the application of PUA.
Table 4. Effect of different nitrogen management and rates of nitrogen on nitogen use
efficiencies for variety and nitrogen interaction
Control= No urea, PUA= Prilled urea applicator, USG= Urea super granule PUB= Prilled
urea broadcasting (Source: Bhuiyan et al., 2016)
On an average the agronomic nitrogen efficiency value was highest for BRRI dhan29
(Bhuiyan et al., 2016). It also can be seen that NUE value is higher for USG application in
both varieties. This might be happen due to the localized application of USG which
minimized the losses of nitrogen, store nitrogen for longer period as well as improve nitrogen
use efficiency of the crop.
Nitrogen management Nitrogen rates (kg/ha) Agronomic nitrogen use
efficiency (kg/ha)
BRRI dhan28
PUA 87 33
USG 75 49
PUB 124 31
Average 38
BRRI dhan29
PUA 87 42
USG 75 47
PUB 124 34
Average 41
13
Wheat (Triticum aestivum L.) takes the position of second most important cereal crop of
Bangladesh after rice. The yield of wheat is significantly influenced by different varieties,
inputs requirement and growth cycle. For this, the farmers of Bangladesh prefer to use
diverse varieties with several yield contributing characters which are different from one
variety to another (Kumar et al. 2011). Due to varietal diversity the growth and development
process of wheat plants differ under a given agro-climatic condition (BARI, 2010).
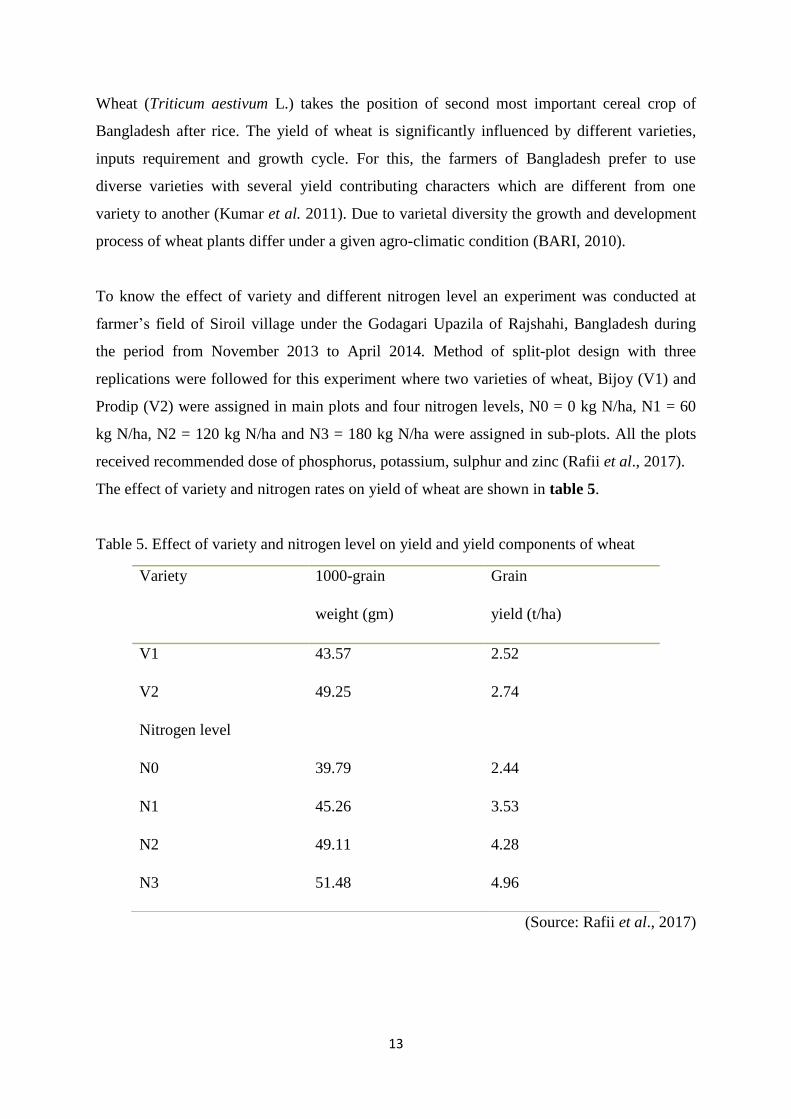
To know the effect of variety and different nitrogen level an experiment was conducted at
farmer’s field of Siroil village under the Godagari Upazila of Rajshahi, Bangladesh during
the period from November 2013 to April 2014. Method of split-plot design with three
replications were followed for this experiment where two varieties of wheat, Bijoy (V1) and
Prodip (V2) were assigned in main plots and four nitrogen levels, N0 = 0 kg N/ha, N1 = 60
kg N/ha, N2 = 120 kg N/ha and N3 = 180 kg N/ha were assigned in sub-plots. All the plots
received recommended dose of phosphorus, potassium, sulphur and zinc (Rafii et al., 2017).
The effect of variety and nitrogen rates on yield of wheat are shown in table 5.
Table 5. Effect of variety and nitrogen level on yield and yield components of wheat
(Source: Rafii et al., 2017)
Variety 1000-grain
weight (gm)
Grain
yield (t/ha)
V1 43.57 2.52
V2 49.25 2.74
Nitrogen level
N0 39.79 2.44
N1 45.26 3.53
N2 49.11 4.28
N3 51.48 4.96
14
In case of 1000 grain weights the highest value (51.48 gm) was observed at N3 (180 kg N
ha−1
). The lowest value (39.79 gm) was observed at N0 (control). After N3 the highest value
was obtained from N2 (120 kg N ha-1
) which was 49.11 gm and then from N1 (60 kg N ha-1
)
which was 45.26 gm. In case of grain yield the highest value (4.96 t/ha) was observed at N3
(180 kg N ha−1
) and the lowest value (2.44 t/ha) was found at N0 (control). Likewise 1000
grain weights, after N3 the highest value for grain yield was observed at N2 (120 kg N ha-1
)
which was 4.28 t/ha and then at N1 (60 kg N ha-1
) which was 3.53 t/ha (Table 5).
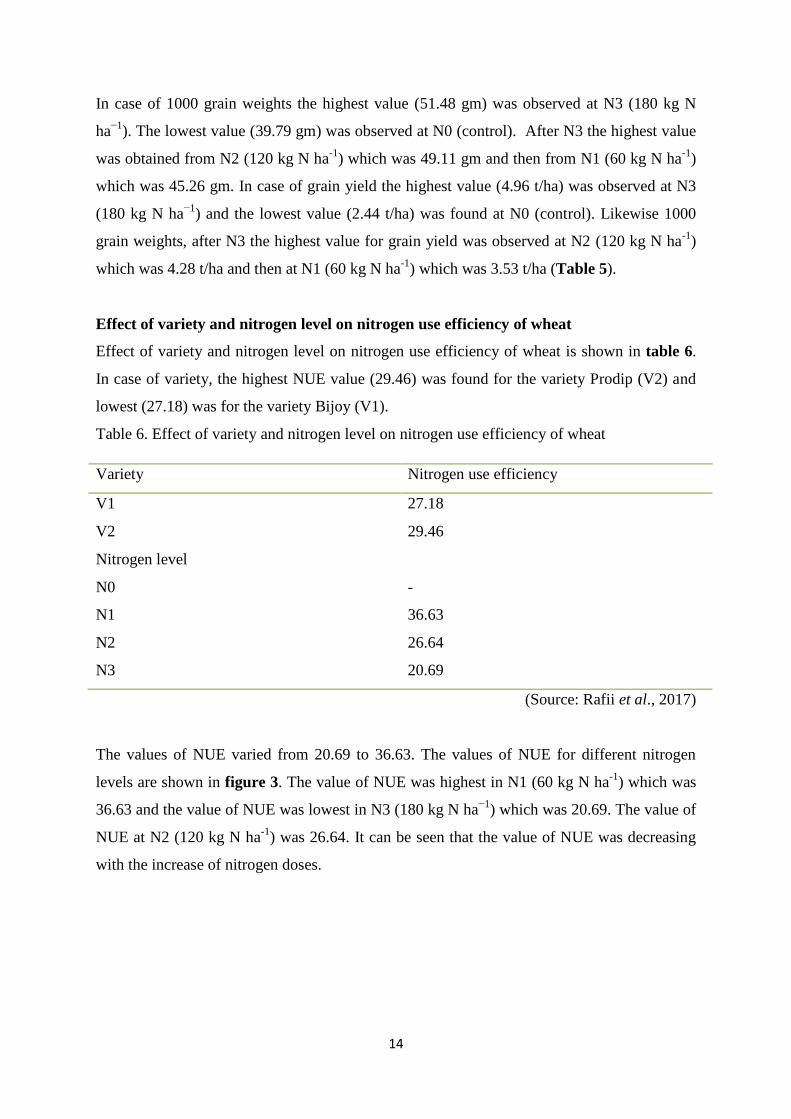
Effect of variety and nitrogen level on nitrogen use efficiency of wheat
Effect of variety and nitrogen level on nitrogen use efficiency of wheat is shown in table 6.
In case of variety, the highest NUE value (29.46) was found for the variety Prodip (V2) and
lowest (27.18) was for the variety Bijoy (V1).
Table 6. Effect of variety and nitrogen level on nitrogen use efficiency of wheat
(Source: Rafii et al., 2017)
The values of NUE varied from 20.69 to 36.63. The values of NUE for different nitrogen
levels are shown in figure 3. The value of NUE was highest in N1 (60 kg N ha-1
) which was
36.63 and the value of NUE was lowest in N3 (180 kg N ha−1
) which was 20.69. The value of
NUE at N2 (120 kg N ha-1
) was 26.64. It can be seen that the value of NUE was decreasing
with the increase of nitrogen doses.
Variety Nitrogen use efficiency
V1 27.18
V2 29.46
Nitrogen level
N0 -
N1 36.63
N2 26.64
N3 20.69

15
This might be happen due higher amount of losses of applied nitrogen as well as rapid growth
of microbial population which compete for nitrogen with crop plants and decrease the NUE
value for plants.
N0= 0 kg N/ha; N1= 60 kg N/ha; N2= 120 kg N/ha and N3= 180 kg N/ha
(Source: Rafii et al., 2017)
Figure 3. Nitrogen use efficiency of wheat as influenced by different nitrogen level.
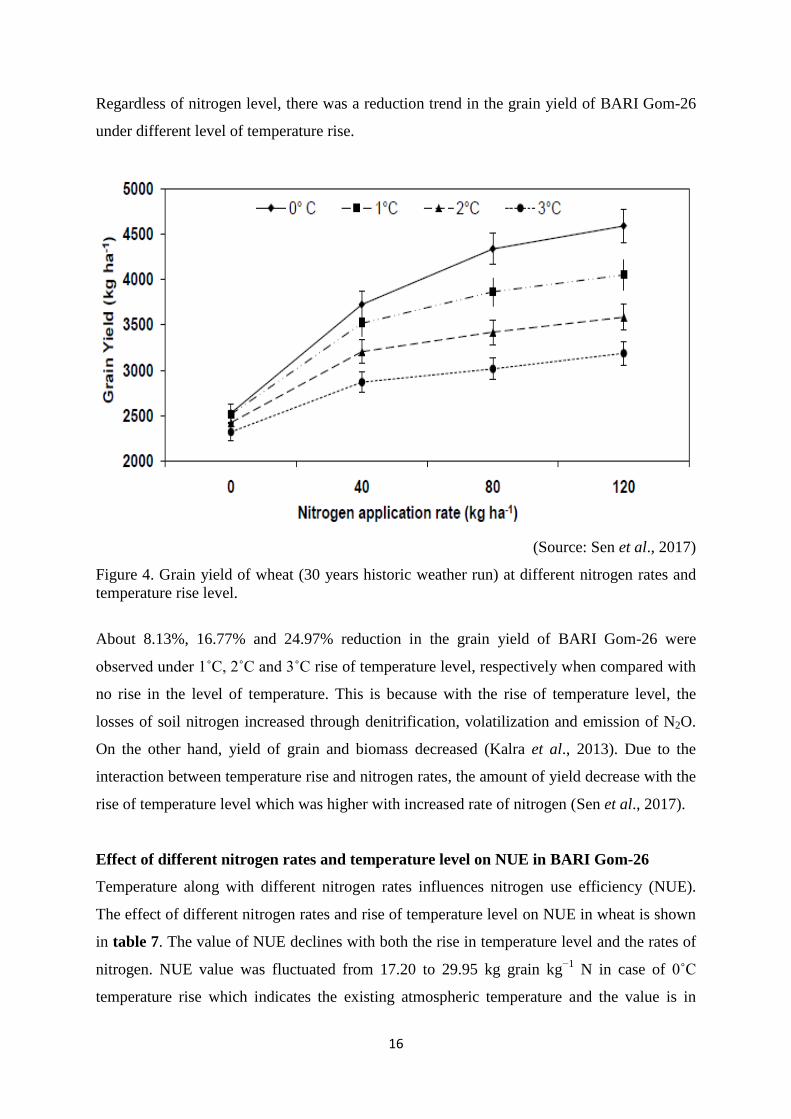
Effect of different nitrogen rates and temperature level on grain yield in BARI Gom-26
In this study, the researcher examined the effect of four nitrogen levels (0, 40, 80 and 120 kg
ha−1
) and four irrigation levels [0 (no irrigation), 1, 2 and 3] under 0˚C, 1˚C, 2˚C and 3˚C rise
in temperature on the production of BARI Gom-26 in Bangladesh. Grain yield of wheat is
influenced by the rise of temperature level along with different nitrogen rates (Sen et al.,
2017). The effect of these two factors on grain yield of wheat is shown in figure 4. The yield
of wheat grain was in increasing trend with the increase of applied nitrogen rates and was in
decreasing trend with the rise of temperature level. Grain yield of wheat usually reaches in
steady condition after the application of 150 kg N ha−1
. The researcher found highest grain
yield at 120 kg N ha−1
with 0˚C temperature rise. Grain yield of wheat was lowest at 0 kg N
ha-1
(control) with 3˚C rise in temperature level.
0
36.63
26.64
20.69
0
5
10
15
20
25
30
35
40
N0 N1 N2 N3
Nit
rogen
use
eff
icie
ncy
Nitrogen Level
16
Regardless of nitrogen level, there was a reduction trend in the grain yield of BARI Gom-26
under different level of temperature rise.
(Source: Sen et al., 2017)
Figure 4. Grain yield of wheat (30 years historic weather run) at different nitrogen rates and
temperature rise level.
About 8.13%, 16.77% and 24.97% reduction in the grain yield of BARI Gom-26 were
observed under 1˚C, 2˚C and 3˚C rise of temperature level, respectively when compared with
no rise in the level of temperature. This is because with the rise of temperature level, the
losses of soil nitrogen increased through denitrification, volatilization and emission of N2O.
On the other hand, yield of grain and biomass decreased (Kalra et al., 2013). Due to the
interaction between temperature rise and nitrogen rates, the amount of yield decrease with the
rise of temperature level which was higher with increased rate of nitrogen (Sen et al., 2017).
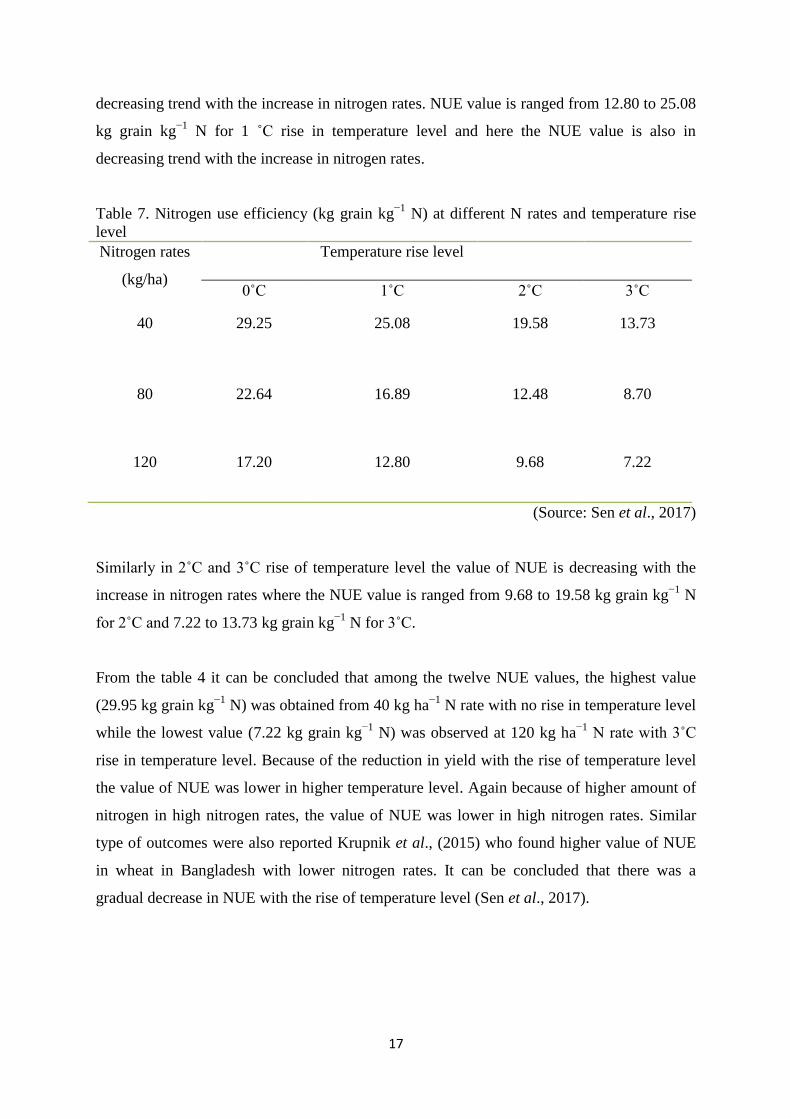
Effect of different nitrogen rates and temperature level on NUE in BARI Gom-26
Temperature along with different nitrogen rates influences nitrogen use efficiency (NUE).
The effect of different nitrogen rates and rise of temperature level on NUE in wheat is shown
in table 7. The value of NUE declines with both the rise in temperature level and the rates of
nitrogen. NUE value was fluctuated from 17.20 to 29.95 kg grain kg−1
N in case of 0˚C
temperature rise which indicates the existing atmospheric temperature and the value is in
17
decreasing trend with the increase in nitrogen rates. NUE value is ranged from 12.80 to 25.08
kg grain kg−1
N for 1 ˚C rise in temperature level and here the NUE value is also in
decreasing trend with the increase in nitrogen rates.
Table 7. Nitrogen use efficiency (kg grain kg−1
N) at different N rates and temperature rise
level
Nitrogen rates
(kg/ha)
Temperature rise level
0˚C 1˚C 2˚C 3˚C
40 29.25 25.08 19.58 13.73
80 22.64 16.89 12.48 8.70
120 17.20 12.80 9.68 7.22
(Source: Sen et al., 2017)
Similarly in 2˚C and 3˚C rise of temperature level the value of NUE is decreasing with the
increase in nitrogen rates where the NUE value is ranged from 9.68 to 19.58 kg grain kg−1
N
for 2˚C and 7.22 to 13.73 kg grain kg−1
N for 3˚C.
From the table 4 it can be concluded that among the twelve NUE values, the highest value
(29.95 kg grain kg−1
N) was obtained from 40 kg ha−1
N rate with no rise in temperature level
while the lowest value (7.22 kg grain kg−1
N) was observed at 120 kg ha−1
N rate with 3˚C
rise in temperature level. Because of the reduction in yield with the rise of temperature level
the value of NUE was lower in higher temperature level. Again because of higher amount of
nitrogen in high nitrogen rates, the value of NUE was lower in high nitrogen rates. Similar
type of outcomes were also reported Krupnik et al., (2015) who found higher value of NUE
in wheat in Bangladesh with lower nitrogen rates. It can be concluded that there was a
gradual decrease in NUE with the rise of temperature level (Sen et al., 2017).
18
Improved practices for improving nitrogen use efficiency
Proper nitrogen management system can improve NUE. There are several scientifically
available means of nitrogen management to ensure efficient use of agricultural inputs
(chemical fertilizers, land, water, and crops). This will enhance beneficial utilization of N in
crops and reduce its losses. Nitrogen use efficiency can be improved through the following
approaches:
i. Site specific nitrogen management (SSNM)
Site specific nitrogen management (SSNM) includes quantitative knowledge of field specific
variability in crops required N and supplying power of expected soil N. The fundamental
underlying assumption of this concept is to establish an optimum synchronization between
supply and demand of N for plant growth (Giller et al., 2004). On the basis of when and what
type of decisions are made, SSNM can be grouped in two categories, A) prescriptive SSNM,
(2) corrective SSNM (Dobermann et al., 2004). In case of prescriptive SSNM before sowing
on the basis of soil’s N supplying power the amount and time of application are analyzed. On
the other hand, in the second diagnostic tools are used to assess nitrogen status of the crop.
Example of some promising diagnostic tools for corrective SSNM in cereals are Chlorophyll
meters (SPAD), nutrient expert and leaf color charts (LCC). The interpretation of these
recorded data is serving as the basis for decisions about timing and quantity of N applications
(Schroeder et al., 2000).
ii. Integrated nitrogen management (INM)
Integrated nitrogen management involves supply of mineralized N from soil organic matter as
well as N through chemical fertilizers which are applied externally and their interactions to
enhance nitrogen recovery (Olesen et al., 2004). This can influence physico-chemical soil
environment which will help in better root growth and enhanced supply of other
micronutrients (Singh et al., 2012).
iii. Slow release fertilizer
Controlled and slow released fertilizer can contribute to increase nitrogen use efficiency to a
great extent. There are some slow release fertilizers which are now marketed having the
potential to decrease losses of N and improve nitrogen use efficiency (Giller et al., 2004).
These compounds can reduce N losses by delaying release of nitrogen which may improve
the synchronization between crop demand and that of soil N supply. Neem coated urea is an
19
example of slow release nitrogen fertilizers. But, use of these controlled release fertilizer is
not so popular yet. Slow release fertilizers contribute only 0.15% of the total N fertilizer
consumption. The possible reasons behind this low percentage are high manufacturing cost as
well as non- availability by farmers from developing countries (Shivay et al., 2001)
iv. Improved method of nitrogen application
Nitrogen use efficiency can be improved through various methods of nitrogen application.
Deep placement, foliar spray, placement of urea with mud balls technique in the reduced zone
of transplanted puddled rice field can enhance nitrogen recovery percentage through reducing
the losses as well as give better crop yield (McBratney et al., 2003).
v. Adoption of resource conservation practices
Conservation agriculture (CA):
By practicing conservation agriculture nutrient supply power of soil can be improved. It will
ensure better soil health that will lead to higher availability of nutrients to plants (Fageria,
2002). Zero tillage and permanent bed planting with proper residue management can be
applied to achieve this (Burgess et al., 2002). Physical, chemical and biological properties of
soil, aggregate stability (Calvino et al., 2003), and change in macro-porosity (Burgess et al.,
2002) can be improved through conservation agriculture system which will ensure more
nutrient availability and better outputs.
Residue management:
Plant growth and development can be influenced by crop residues as they affect the quantity
of nutrients available to crops (Mohanty and Mishra, 2014). They are important sources and
sinks for carbon and nitrogen cycle (Dinnes et al., 2002). Crop residues can supply nitrogen
to the plants over long time period by initially converting it into inorganic form and then
mineralize it at later stage of crop based on nitrogen demand of crop (Pankhurst et al., 2002).
Green manuring:
Legume crops can be used as green manure as they can fix atmospheric free nitrogen in the
soil (Vyn et al., 2000). These crops help to improve soil health and fertility status,
acidification of soil, micro-biological diversity, moisture status of the soil, and thermal
regime (Mary and Recous, 1994).
20
Crop rotation:
Proper crop rotation helps in maintaining the health and fertility of soil as well as nutrient
balance. Crop rotations with legume crops help in greater nitrogen availability as well as
improve nitrogen use efficiency in cereal crops as legume can fix free atmospheric nitrogen
(Gan et al. 2003).
vi. Enhancement of nitrogen use efficiency through genetic improvement of crop
Crop improvement through introducing various quality traits which are responsible for
effective nitrogen utilization may improve nitrogen use efficiency. With the application of
same amount of nitrogen some genotypes may produce different grain yields. Differences in
the efficiency of N acquisition may arise from (1) differences in the efficiency of absorption
and assimilation of NH4 + and other nitrogen species and their regulation (Schmidt et al.,
2002); (2) the extent and distribution of roots, age of roots, and root induced changes in the
rhizosphere affecting mineralization, transformation, and transport of nitrogen (Ladha et al.,
2003); and (3) root associated biological N fixation (Shrestha and Ladha 1996).
vii. Precision farming
Precision farming is an information and technology based farm input management system
which aims at the use of technologies and principles to identify, analyze and manage spatial
and temporal variability associated with all aspects of agricultural production within fields for
maximum profitability, sustainability, enhancing crop performance, protecting land resources
and maintain or improve the environment quality (McBratney et al., 2003). Precision farming
can be possible through remote sensing, geographic information systems (GIS) and global
positioning systems (GPS) technology (Schmidt et al., 2002). Application of proper amount
of nitrogen in proper place and in right time is very important to improve the use efficiency
of nitrogen.
21
CHAPTER IV
CONCLUSION
Nitrogen use efficiency (NUE) in cereals in Bangladesh specially in rice and wheat is less
than 50% of the applied nitrogen. One of the major cause behind this can be the higher
susceptibility of applied nitrogen towards different types of losses. However, increase in
temperature level can also lower the NUE value which was observed in wheat. Efficiency of
using nitrogen can also be varied from variety to variety. For the improvement of the present
condition of NUE, use of urea super granule (USG) as a source of nitrogen in stead of prilled
urea (PU) can be an effective approach. Besides, site specific nitrogen management,
integrated nitrogen management, slow release fertilizer, adoption of different conservation
practices, precision farming and crop improvement are necessary for improving the present
condition of nitrogen use efficiency in cereal crops in Bangladesh.
22
CHAPTER V
REFERENCES
Agostini, F., F. Tei. M. Silgram, M. Farneselli, P. Benincasa, and M.F. Aller. (2010).
Decreasing N leaching in vegetable crops through improvements in N fertilizer
management, Sustainable Agr. Rev. 4:147–200.
Akter, S., Islam, M.R., Rahman, M.M. and Hoque, M.M. (2012). Influences of nitrogen
supplied from inorganic and organic sources on the yield, nutrient uptake and nitrogen
use efficiency of BRRI dhan29. Bangladesh J. Crop Sci. 22-23: 151-158.
BARI (Bangladesh Agricultural Research Institute) (2010). Annual Report, 2009-10.
Bangladesh Agril. Res. Inst. Gazipur 1701, Bangladesh.
BBS (2015). Yearbook of agricultural statistics 2015. Dhaka: Bangladesh Bureau of
Statistics.
Bhaskaram, U. and Krisna, D. (2009). Effect of organic farming on soil fertility, yield and
quality of crops in the tropics. XVIth Int. Plant Nutri. Col. 89-90.
Bhuiyan, M.K.A., Nahar, L., Mahbub, M.M., Shultana, R., Mridha, M.A.J., Rahman,
M.A., & Kamruzzaman, M. (2016). Yield Response and Nitrogen use Efficiency of
Boro Rice Varieties as Affected by Different Methods of USG and Prilled Urea
Application. Bangladesh Agron. J. 19:1-10.
Brentrup, F., & Pallière, C. (2010). Nitrogen use efficiency as an agro-environmental
indicator. In Proceedings of the OECD Workshop on Agrienvironmental Indicators.
23-26.
Brown M.E., Hintermann B, Higgins N (2009) Markets, climate change, and food
security in West Africa. Environ. Sci. Technol. 43: 8016–8020.
Burgess, M.S., Mehuys, G.R., and Madramootoo, C.A. (2002). Nitrogen dynamics of
decomposing corn residue components under three tillage systems. Soil Sci. Soc. Am.
J. 66:1350–1358.
Burns, I.G. (2006). Assessing N fertilizer requirements and the reliability of different
recommendation systems. Acta Hort. 700:35–48.
23
Calvino, P.A., Andrade, F.H., and Sadras, V.O. (2003). Maize yield as affected by water
availability, soil depth, and crop management. Agron. J. 95:275–281.
Cole L., Buckland S.M., Bardgett R.D. (2008). Influence of disturbance and nitrogen
addition on plant and soil animal diversity in grassland. Soil Biol. Biochem. 40: 505-
514.
Conant R, Berdanier A, Grace P (2013) Patterns and trends in nitrogen use and nitrogen
recovery efficiency in world agriculture. Global Biogeochem Cycles 27: 558–566.
Dinnes, D.L., Karlen, D.L., Jaynes, D.B., Kaspar, T.C., Hatfield, J.L., Colvin, T.S., and
Cambardella, C.A. (2002). Nitrogen management strategies to reduce nitrate leaching
in tile-drained mid-western soils. Agron. J. 94:153–171.
Dobermann, A., and Cassman, K.G. (2004). Environmental dimensions of fertilizer
nitrogen: What can be done to increase nitrogen use efficiency and ensure global food
security? In ‘‘Agriculture and the Nitrogen Cycle: Assessing the Impacts of Fertilizer
Use on Food Production and the Environment’’. 261–278.
Fageria, N.K. (2002). Soil quality vs. environmentally based agriculture. Commun. Soil
Sci. Plant Anal. 33:2301–2329.
Fageria, N.K., & Baligar, V.C. (2005). Enhancing nitrogen use efficiency in crop
plants. Adv. Agron. 88: 97-185.
Fageria, N.K., and Barbosa, M.P. (2001). Nitrogen use efficiency in lowland rice
genotypes. Soil Sci. Plant Anal. 32:2079– 2089.
[FAO] Food and Agricultural Organization (2014). FAOSTAT. http://faostat.fao.org.
Gan, Y.T., Miller, P.R., McConkey, B.G., Zentner, R.P., Stevenson, F.C., and McDonald,
C.L. (2003). Influence of diverse cropping sequences on durum wheat yield and
protein in the semiarid northern Great Plains. Agron. J. 95:245–252.
Ganesh-Kumar, A., Prasad, S.K., & Pullabhotla, H. (2012). Supply and demand for
cereals in Bangladesh (No. 01186). IFPRI Discussion Paper.
Ghose, B., Razib, B., & Sharmistha, G. (2014). Reviewing the status of agricultural
production in Bangladesh from a food security perspective. Russian Journal of
Agricultural and Socio-Economic Sciences, 25.
24
Giller, K.E., Chalk, P.M., Dobermann, A., Hammond, L., Hever, P., Ladha, J.K., Maene,
L., Nyamudeza, P., Ssali, H., and Freney, J.R. (2004). Emerging technologies to
increase the efficiency of use of fertilizer nitrogen. In‘‘Agriculture and the Nitrogen
Cycle: Assessing the Impacts of Fertilizer Use on Food Production and the
Environment’’. 35–51.
Husan, M.R., Islam, M.R., Faried, K., & Mian, M.H. (2014). Nitrogen use efficiency and
rice yield as influenced by the application of prilled urea and urea super granule with
or without organic manure. Journal of the Bangladesh Agricultural University, 12: 37-
43.
Jahan, N., Islam, M.R., Siddique, A.B., Islam, M.R., Hasan, M.M., Shamsuzzaman, S.M.
and Samsuri, A.W. (2014). Effects of integrated use of prilled urea, urea super granule
and poultry manure on yield of transplant aus rice and field water quality. Life Sci. J.
11: 101-108.
Kalra, N., Suneja, P., Mendiratta, N. and Gupta, N. (2013). Simulating the impact of
climate change and its variability on growth and yield of crops. Climate Change and
Environmental Sustainability, 1:11-19.
Kravchecko, A.N., Thelen, K.D., Bullock, D.G., and Miller, N.R. (2003). Relationship
among crop grain yield, topography, and soil electrical conductivity studied with
cross-correlograms. Agron. J. 95:1132–1139.
Krupnik, T.J., Ahmed, Z.U., Timsina, J., Shahjahan, M., Kurishi, A.A.S.M., Miah, A.A.,
Rahman, B.M., Gathala, M.K. and McDonald, A.J. (2015) Forgoing the Fallow in
Bangladesh’s Stress-Prone Coastal Deltaic Environments: Effect of Sowing Date,
Nitrogen, and Genotype on Wheat Yield in Farmers’ Field. Field Crops Res. 170:7-
20.
Kumar, K., Alam, A.S., Khatun, M.R., & Islam, M.R. (2011). Effects of varieties and
nitrogen application levels on the yield and yield components of wheat. J. Bangladesh
Soc. Agric. Sci. Technol, 8: 87-92.
Ladha, J.K., Dawe, D., Pathak, H., Padre, A.T., Yadav, R.L., Bijay-Singh Yadvinder-
Singh Singh, Y., Singh, P., Kundu, A.L., Sakal, R., Ram, N., Regmi, A.P., Gami, S.
K., Bhandari, A.L., Amin, R., Yadav, C.R., Bhattarai, E.M., Das, S., Aggarwal,
H.P.,Gupta, R.K., and Hobbs, P.R. (2003). How extensive are yield declines in long
term rice-wheat experiments in Asia? Field Crop. Res. 81:159–180.
25
Mary, B., and Recous, S. (1994). Measurement of nitrogen mineralization and
immobilization fluxes in soil as a means of predicting net mineralization. Eur. J.
Agron. 2:291–300.
McBratney, A.B., Minasny, B., and Whelan, B.M. (2003). Obtaining ‘useful’ high-
resolution soil data from proximally sensed electrical conductivity (PSEC/R) surveys.
In: Stafford J.V. (ed.), Precision agriculture ’05. Wageningen Academic Publishers,
Wageningen, The Netherlands, Sweden, 503-511.
Mosier, A. R., Bleken, M. A., Chaiwanakupt, P., Ellis, E. C., Freney, J. R., Howarth, R.
B., Matson, P. A., Minami, K., Naylor, R., Weeks, K. N. and Zhu, Z. L. (2001).
Policy implications of human accelerated nitrogen cycling. Biogeochem. 52:281–320.
Norton, R., Davidson, E., & Roberts, T. (2015). Nitrogen use efficiency and nutrient
performance indicators. Global Partnership on Nutrient Management.
Olesen, J.E., Sørensen, P., Thomsen, I.K., Eriksen, J., Thomsen, A.G., and Berntsen, J.
(2004). Integrated nitrogen input systems in Denmark. In ‘‘Agriculture and the
Nitrogen Cycle: Assessing the Impacts of Fertilizer Use on Food Production and the
Environment’’. 129–140.
Panel, E.N.E. (2015). Nitrogen Use Efficiency (NUE) an indicator for the utilization of
nitrogen in food systems. Wageningen University, Alterra, Wageningen, Netherlands.
Pankhurst, C.E., McDonald, H.J., Hawke, B.G. and Kirkby, C.A. (2002). Effect of tillage
and stubble management on chemical and microbiological properties and the
development of suppression towards cereal root disease in soils from two sites in
NSW, Australia. Soil Biol. Biochem. 34:833-840.
Prasad, R. (1979). Increasing fertilizer nitrogen efficiency in wetland rice. Nitrogen and
rice, 465-484.
Rafii, M., & Shamsuzzaman, S., Haque, A., Hossain, M., Haque, M., Hasan, M., Malek,
M. (2017) Response of yield, nitrogen use efficiency and grain protein content of
wheat (Triticum aestivum L.) varieties to different nitrogen levels. Bangladesh J. Bot.
46: 389-396.
Riedell, W.E., Schumacher, T.E., and Evenson, P.D. (1996). Nitrogen fertilizer
management to improve crop tolerance to corn rootworm larval feeding damage.
Agron. J. 88:27–32.
26
Schenk, M.K. 2006. Nutrient efficiency of vegetable crops. Acta Hort. 700:25–38.
Schmidt, J.P., De Joia, A.J., Ferguson, R.B., Taylor, R.K., Young, R.K., and Havlin, J.L.
(2002). Corn yield response to nitrogen at multiple in-field locations. Agron. J.
94:798–806.
Schroeder, J.J., Neeteson, J.J., Oenema, O., and Struik, P.C. (2000). Does the crop or the
soil indicate how to save nitrogen in maize production? Reviewing the state of the art.
Field Crops Res. 66:151–164.
Sen, R., Choudhury, A.K., Akhter, S., Ishtiaque, S., Jahan, M.A. H.S., Ahmed, F.,
Biswas, J.C., Maniruzzaman, M., Miah, M.M.U., Rahman, M.M., & Kalra, N. (2017).
Simulating Nitrogen and Irrigation Effects on Wheat Production in Bangladesh under
Changing Climate. American J. Plant Sci. 8:1593.
Shah, A.L., Rahman, M.S., & Aziz, M.A. (2008). Outlook for fertilizer consumption and
food production in Bangladesh. Bangladesh J. Agric. and Environ. 4:9-26.
Shivay, Y.S., R. Prasad, S. Singh, and S. N. Sharma. (2001). Coating of prilled urea with
neem (Azadirachta indica) for efficient nitrogen use in lowland transplanted rice
(Oryza sativa L.). Indian J. Agron. 46: 453–457.
Shrestha, R.K., and Ladha, J.K. (1996). Estimation of rice genotypic variation in N2
fixation by 15N dilution using 15N labeled soil. Soil Sci. Soc. Am. J. 60:1815–1821.
Singh, B., Singh, V., Singh, Y., Thind, H.S., Kumar, A., Gupta, R.K., Kaul, A. and
Vashistha, M. (2012). Fixed-time adjustable dose site-specific nitrogen management
in transplanted irrigated rice (Oryza sativa L.) in South Asia. Field Crop Res. 126:
63–69.
Timsina, J., Wolf, J., Guilpart, N., van Bussel, L.G.J., Grassini, P., van Wart, J., and van
Ittersum, M.K. (2016). Can Bangladesh produce enough cereals to meet future
demand? Agricultural Systems. 163:36-40.
Vyn, T.J., Faber, J.G., Janovicek, K.J., and Beauchamp, E.G. (2000). Cover crop effects
on nitrogen availability to corn following wheat. Agron. J. 92:915–924.
Recommended


![11.[57-69]Price Behaviour of Major Cereal Crops in Bangladesh](https://img.dokumen.tips/doc/110x75/577d1e5a1a28ab4e1e8e556f/1157-69price-behaviour-of-major-cereal-crops-in-bangladesh.jpg)